Abstract
Crude hemp (Cannabis sativa L.) seed oil (HSO) has a high degree of unsaturation, which has increased its interest in many industrial applications, especially epoxy-resin production. Crude HSO is refined to remove impurities and pigments; however, refining after epoxidation (post-epoxidation refining) also removes impurities and side products, similar to the vegetable oil refining process. Therefore, this study evaluates if it is worth refining crude HSO before epoxidation (pre-epoxidation), and to what extent pre-refining (before epoxidation) is needed to maintain yield and quality. Crude, degummed, and bleached HSOs were epoxidized at 60 °C for 5.5 h using amberlite 120H+ solid catalyst. The cumulative recovery yield, oxirane, conversion, color, and other quality parameters were analyzed before and after epoxidation of HSOs. Results showed that the recovery yield pre- and post-epoxidation of the epoxidized hempseed oils (EHSOs) ranged from 74 to 85%, with the bleached EHSO having the lowest yield. The oxirane content and epoxy conversion ranged from 8.4 to 8.6% and 99.5%, respectively. There was a significant decrease (approximately 99%) in the chlorophyll color content after epoxidation for samples that were not bleached initially with bleaching earth. Hydrogen peroxide was very effective in bleaching the HSO. Other quality parameters did not show any significant benefit from pre-epoxidation bleaching of the HSO. Therefore, it is recommended to directly epoxidize crude HSO or degummed HSO.
1. Introduction
Before the 2018 US farm bill, hemp (Cannabis sativa L.) cultivation was very restrictive due to its classification in the 1970 US Controlled Substance Act. The 2018 farm bill allowed certain states to cultivate hemp in accordance with specific rules [1]. Depending on the component being explored, hemp is categorized as industrial or floral hemp. Globally, industrial hemp has a long history of versatile uses in food, fiber, oil, medicines, and industrial products, while floral hemp has been used for recreational and more recently medicinal purposes [2,3]. Unlike floral hemp, where the focus is on the flower, industrial hemp is mostly grown for its fiber, which is concentrated in the stem. The flowers then develop into seeds which contain approximately 30–35% oil by weight and a seed yield of approximately 0.95 t ha−1 [4,5].
Hempseed oils (HSO) have emerged as a commercially available edible oil used in food applications, but they are widely used in the chemical industry because of their low smoke point [6,7]. HSO contains a high content of polyunsaturated fatty acid (75–96%), which allows the high unsaturated double bonds to be converted to epoxy groups through the epoxidation process [8,9]. Although the epoxidation process enhances the functionality and utility of epoxidized oil, the quality and yield of epoxidized oils are significantly influenced by the fatty acid composition and purity of the crude oil [10,11]. Crude HSO contains impurities such as free fatty acids (FFAs), phospholipids, pigments (chlorophyll), and oxidation products, which may adversely affect the downstream epoxy production process and the final product properties. A common practice is to remove these impurities and improve the oil oxidative stability through refining the oils, which typically involves degumming, neutralization, bleaching, and deodorization [12,13,14,15]. Degumming with water or acid and base neutralization removes gums and phospholipids, promotes the saponification of free fatty acids, degrades bioactive compounds like antioxidants, and enables separation of the soap stock while treatment with bleaching earth adsorbs the chlorophyll, carotenoids, and oxidative products to improve the oil’s appearance, flavor, and oxidative stability. Other processes, such as deodorization and winterization, remove odors, flavors, and antioxidants [12,16,17]. Commonly, the qualitative changes in oil during these various refining stages are primarily characterized by changes in their minor components, including carotenoids, chlorophylls, phytosterols, tocopherols, phospholipids, and free fatty acids. While each stage has a specific technological goal, the bleaching process significantly alters its physicochemical properties. The effectiveness of bleaching is measured by the removal of undesirable pigments, compounds, lipid peroxidation products, and other undesirable substances including soaps, phosphatide residues and phospholipid impurities that were not fully removed during degumming [18,19,20].
Epoxidation is a key chemical modification process to introduce epoxy groups to unsaturated double bonds, creating crude epoxidized oil in three phases, which must be separated and refined post-epoxidation [21]. The synthesis of epoxy groups typically involves the reaction of unsaturated bonds, such as an alkene, with an organic peroxy acid influenced by the chosen catalytic system, making the selection of the epoxidation method a critical determinant of key process metrics [10,11]. These metrics include reactant conversion, product selectivity, sustainability of the process, and overall economic viability. The major epoxidation catalysis methods employed are broadly categorized into four main classes. The conventional sulfuric acid catalysis method, which uses a mineral acid, can lead to a significant number of side reactions and requires complex neutralization and purification steps. The acidic ion-exchange resin (AIER) catalysis method utilizes solid-phase polymeric resins with acidic functional groups. The chemo-enzymatic catalysis method employs enzymes, such as lipases or peroxygenases, often in combination with co-catalysts, to facilitate the reaction under mild conditions. The metal-catalyzed method involves the use of transition metal complexes, but may present challenges related to catalyst recovery and cost.
Among the various catalytic systems, the AIER process has emerged as the most frequently used and widely adopted method for the epoxidation of vegetable oils. Its widespread use can be attributed to several distinct advantages over other methods [10,11]. The solid-phase nature of the AIER catalyst simplifies downstream processing and catalyst separation, eliminating the need for complex filtration or neutralization steps. Furthermore, the AIER process consistently demonstrates high conversion rates and superior product quality across diverse types of vegetable oil feedstocks. The method is also noted for its operational flexibility, accommodating different batch sizes and process conditions, and for minimizing the formation of undesirable side products. These combined factors make the AIER process a highly efficient and economically favorable method for industrial-scale epoxidation of vegetable oils [21].
During the epoxidation reaction using the AIER method, the organic acid used as an oxygen carrier to the double bonds can also dissolve the gums or phospholipid by chelating their bonded metal ions, allowing for effective separation from the oil during post-refining [19,20]. In the same reaction process, hydrogen peroxide, which is used as an oxygen donor in the epoxidation process, acts as a chemical bleaching agent. The hydrogen peroxide breaks down chemical bonds responsible for color pigments in the oil and helps decompose hydroperoxides to non-volatile and oxidized triacylglycerols [22,23]. With this inherent bleaching effect, separate bleaching of the oil prior to epoxidation may not be beneficial or cost effective. The refining process post-epoxidation through water washing and base neutralization, which separates the aqueous phase with dissolved impurities and the organic phase, is similar to the degumming and neutralization steps of the crude vegetable oil refining process [23,24,25,26,27]. While crude oil refining is essential for food, feed, and other applications, there is a need to explore its importance prior to the epoxidation process.
Despite its promise, hempseed oil faces unique challenges associated with its processing. For food-grade oil, the bitter taste limits market acceptance, while the presence of chlorophyll is not a concern in medicinal and cosmetic applications; it may pose a problem for biofuels and bioproducts as impurities lead to a decrease in oxidative stability, affecting their market value [18]. Hence, refining is usually needed; however, the refining processes may strip away beneficial components like natural antioxidants, which offer a unique advantage in stabilizing vegetable oil and enhancing the overall quality of the final product [2,13,17]. Moreover, dual competition between the industrial and food sectors raises concerns about whether refining is adequate for the various applications. Excessive refining pre-epoxidation may also lead to the loss of valuable components and increase production costs, whereas insufficient refining may compromise the efficiency of the epoxidation reaction and ultimately the quality of the epoxidized resin.
There have been many studies focused on optimizing high epoxy yields and quality, as well as exploring alternative non-edible oil sources to alleviate the competition with food applications [25,28,29,30,31]. Manthey et al. [31] optimized the reaction conditions of HSO and reported yield loss after washing and separation from the catalyst using reactants, with a mass yield of approximately 75% by volume in relation to the initial volume of hemp oil, and 8.6% epoxy yield. Jariwala et al. [32] developed polyurethane foams from epoxidized hempseed oil (EHSO) and achieved an oxirane oxygen content of 5.9%, while Omonov et al. [33] achieved 8.0%. Also, Surender et al. [34] synthesized hydroxyl derivatives of HSO by subjecting the oil to epoxidation and ring-opening reactions with various agents, such as water, ethanol, and butanol, and reported 85% mass yield, with 5.76% epoxy oxirane yield. These studies show that there have been different mass and conversion yields for EHSO. None of these previous studies focused on assessing the pre-refining effect on the quality and yield of EHSO.
Hence, this study aims to investigate the impact of crude HSO refining on the quality and yield of epoxidized HSO, focusing on the level of refining and the quality of the epoxidized product. By systematically varying the refining steps and analyzing the resulting EHSO, we seek to identify the minimum refining requirements necessary to achieve high epoxidation yields and desirable product characteristics. The findings provide valuable insights into whether refining is required to produce quality EHSO, balancing production effectiveness with product quality, and supporting the sustainable utilization of vegetable oils in industrial applications.
2. Materials and Methods
2.1. Materials
Hempseed and mechanically extracted HSO were obtained from Healthy Oilseeds LLC (Carrington, ND, USA). Amberlite IR120 H+ and anhydrous magnesium sulfate were purchased from Arcos Organics (Morris Plains, NJ, USA) and Mallinckrodt Baker, Inc. (Phillipsburg, NJ, USA), respectively. Citric acid, glacial acetic acid (ACS grade), sodium hydroxide, and sodium carbonate were procured from EDM Chemicals (Gibbstown, NJ, USA). Activated bleaching earth (Select-FF bleaching clay) was purchased from Oil-Dri Corporation of America (Chicago, IL, USA). Aqueous hydrogen peroxide (50% by weight in water) and the standard reagents were purchased from Sigma-Aldrich (St. Louis, MO, USA). All chemicals were analytical grade and used without further purification.
2.2. Hempseed Oil Extraction
In this study, HSO extraction was evaluated with both mechanical and solvent-extracted HSO. Mechanically cold-pressed crude hempseed oil was obtained directly from Healthy Oilseeds LLC (Carrington, ND, USA), and no additional oil conditioning was performed before degumming. Hempseed oil was extracted using a double-barrel screw press (Komet, Germany) equipped with a nitrogen-cooled barrel. The iodine value of the oil was determined using the American Oil Chemist Society (AOCS) standard method Tg 1a-64. The molar ratios of reactants and epoxidation reaction procedures were based on previous work [21].
Solvent extraction of the hempseed involves flaking of the whole hempseed (9.1% moisture) using Roskamp Model K 5 hp roller mill with a gap width of approximately 0.5 mm. The oil in the flake seed was extracted using a 12 L round-bottom flask Soxhlet extraction system. In each extraction batch, approximately 600 g of the flaked seeds were put into a 110 mm × 300 mm porous thimble and then into a Soxhlet extraction chamber. Approximately 8 L of n-hexane in the round-bottom flask was heated on a Glas-col aluminum heating mantle controlled by a variable voltage regulator set at 95% (equivalent to 360 °C). Hexane evaporated from the oil-hexane matrix mixture in the round-bottom flask at 95 °C for approximately 8 h. The condensed hexane cycled through the thimbles containing the samples until the hexane ran clear in the extraction chamber. Finally, residual hexane in the oil was removed by heating the oil mixture at 70 °C under a 55 kPa vacuum at 85 rpm in an IKA RV8 rotary evaporator. The process was stopped when no more condensation from the boiling HSO mixture was observed.
2.3. Refining of Mechanical and Solvent Extracted Oil
Water degumming: Water- degumming was performed to remove hydratable phospholipids or gums from the extracted oil. 1 kg of hexane-free crude oil was initially heated to 65 °C in a 4 L glass beaker and vigorously stirred using an Ultra-Turrex homogenizer (Omni International, Kennesaw, GA, USA) at 4000 rpm. Distilled water 2.5% (w/w) was added and continuously stirred for 10 min to allow separation of flocculated gums. Oil and hydrated phospholipids were separated by centrifuging (Allegra X-15R, Beckham Coulter, Brea, CA, USA) for 20 min at 4000 rpm, and the oil layer was decanted into a beaker. The recovered oil sample was dried with magnesium sulfate 15% (w/w) and then vacuum filtered using Whatman #4 filter paper. Each degumming procedure was conducted for both mechanically and solvent-extracted HSO (crude HSO).
Acid Degumming: Acid degumming was performed to remove non-hydratable phospholipids from the extracted HSO. Crude HSO (1 kg) was heated to 65 °C in a 4 L glass beaker with continuous stirring using an Ultra-Turrex homogenizer (Omni International, Kennesaw, GA, USA). In total, 0.3% (w/w) of citric acid solution (50% w/w) was added simultaneously and intensely mixed for 30 s. This was followed by a base addition of 5.5 mL/g (w/w) of 2 M NaOH solution/g citric acid (50% w/w) for 30 s to neutralize. Distilled water 2.5% (w/w) was added and slowly stirred at 50 °C for 10 min at 2000 rpm; oil and phospholipids were separated in a centrifuge (Allegra X-15R, Beckham Coulter, Brea, CA, USA) for 20 min at 4000 rpm and dried using magnesium sulfate 15% (w/w) and then vacuum filtered using Whatman #4 filter paper.
Bleaching: Bleaching treatment was performed to remove pigments, metals, soap, oxidation products, and residual phospholipids from the degummed oil samples. Bleaching was carried out after degumming on the 1 kg batches of acid-degummed and water-degummed HSO. Each degummed sample of extracted HSO was bleached according to the AOCS standard method Cc 8b-52 (2017), with slight modifications. After the degumming step, 750 g of degummed oil was preheated to 100 °C and vigorously mixed with 2.5% (w/w) Select-FF bleaching clay at 4000 rpm using an Ultra-Turrex homogenizer (Omni International, Kennesaw, GA, USA) for 15 min at 120 °C. The bleaching clay was then vacuum filtered with Whatman #4 filter paper.
All bleaching samples were taken through the degumming steps. Therefore, refined or pre-epoxidation samples include acid-degummed, acid-degummed–bleached, water-degummed, and water-degummed–bleached HSO (Figure 1). Triplicates of each refined oil sample were produced for epoxidation.
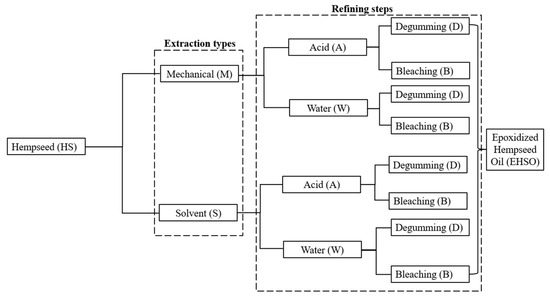
Figure 1.
Flow chart of the different samples of oil being epoxidized. The different samples of refining steps were labeled as crude (C), acid-degummed (AD), acid-degummed–bleached (ADB), water-degummed (WD), and water-degummed–bleached (WDB).
2.4. Epoxidation Reaction of Hempseed Oil
The epoxidation reaction was carried out in duplicate in 2 L three-neck round-bottom flasks (reactors). To facilitate proper mixing of the hempseed oil and oxidizing agent, the reactors were equipped with an agitator fastened to a glass button stir shaft (6 mm) with a semi-circular Teflon blade stirrer of 75 mm diameter. The reactors were set up and placed in a water bath (Precision model 50, Winchester, VA, USA), immersed entirely up to the base of the neck. The water bath temperature was set at 40 °C. HSO (500 g) containing 0.62 mol double bonds (calculated based on the unsaturated fatty acids composition), glacial acetic acid (93.3 g), and 100 g amberlite IR 120H+ 20% (w/w of HSO) were poured into the reactor, and the reaction content was stirred continuously at 800 rpm. The molar ratio between HSO double bonds to acetic acid to hydrogen peroxide (H2O2) was kept at 1:0.5:2 to achieve optimum conversion of double bonds to oxirane. The temperature of the reactor content was monitored using a Digi-Sense dual type-T thermocouple datalogger (Cole Parmer, Vernon Hills, IL, USA). Once the reactor temperature reached 40 °C, hydrogen peroxide (423 g) was added dropwise with a funnel for 2.5 h to help control the exothermic process. The reactor content temperature varied between 60 and 65 °C, and gradually stabilized at 60 °C. The total reaction time was 5.5 h from the beginning of hydrogen peroxide addition. At the end of the reaction, hexane solvent 30% (w/w) was added to reduce the viscosity of EHSO, and the Amberlite IR 120H+ catalyst was filtered using a cheesecloth. The organic and aqueous layers were allowed to separate by gravitational settling in a 2 L separatory funnel at room temperature (30 °C) for 1 h, and the aqueous layer was decanted. The crude EHSO was washed based on the optimal process in Oyewole et al. [21]. After washing, drying was performed using 20% (w/w) anhydrous magnesium sulfate. The hydrated magnesium sulfate was removed by vacuum filtration with Whatman #4 filter paper, and the hexane solvent was removed using an IKA RV8 rotary evaporator. The recovered EHSO was stored in amber bottles for yield and quality analysis. All epoxidation was conducted in three batches of each extracted and refined HSO sample. Figure 1 shows a flow chart of the extracted crude and refined HSO samples, all of which were processed to epoxidized HSO.
2.5. Analytical Methods
The mass recovery yields of EHSO from the crude and refined samples were calculated on a wet mass basis as shown in Equation (1).
The oxirane oxygen content (OO) was determined using the titrimetric method of hydrobromide in acetic acid according to AOCS official method Cd 9-57 (2017). The Oxirane oxygen in the EHSO was calculated using Equation (2).
The iodine value (IV) for EHSO samples was determined analytically according to the AOCS Tg 1-64 (2017) official method. For extracted and refined samples, 5 g of the sample was dissolved in 10 mL of carbon tetrachloride (CCl4) and then mixed with 12.5 mL Wijs solution. For epoxidized samples, 10 g samples were dissolved in similar solutions due to the dilution of remaining unsaturation in epoxidized form. After one minute of swirling, the mixture was stored in the dark for 1 h. Next, 10 mL of 10% potassium iodide (KI) solution and 50 mL of distilled water were added. The solution was titrated against 0.1 N sodium thiosulfate solution (Na2S2O3). A blank titration was performed in duplicate for each sample. IV was calculated using the following Equation (3).
where B is the titre volume of blank, S is the titre volume of sample, N is the normality of Na2S2O3 solution, and W is the mass of the sample in grams.
The conversion of double bonds in hempseed oil to epoxy bonds was calculated as shown in Equation (4) by using the iodine values of HSO and EHSO.
where IVi is the iodine value of the starting EHSO sample, and IVf is the final iodine value of the EHSO determined by AOCS Tg 1-64 (2017) official method.
The selectivity for oxirane oxygen can be calculated by Equation (5).
where OO and OOp are the experimentally determined oxirane oxygen and the maximum predicted oxirane oxygen given in Equation (6).
where Ai and Ao are the atomic weights of iodine (126.9) and oxygen (16.0), respectively.
The solids (non-volatile) content was determined in accordance with ASTM D2369 [35]. A total of 1–2 mL of the synthesized HSO was weighed into an aluminum foil dish, dispersed, and heated in an oven at 140 °C for 1 h. The percent volatile content was calculated from the loss in weight, as shown in Equation (7).
Moisture content: The moisture content was determined using a Karl Fischer titrator (Mettler-Toledo, Columbus, OH, USA). The result was expressed as a percentage to indicate the mass of water in 100 g of the oil sample.
The viscosity of the synthesized resins was determined using a U-shaped tube glass capillary viscometer, Cannon-Fenske Routine size 200 (AMK Glass Inc., Vineland, NJ, USA), immersed in a water bath at 40 °C. The left portion of the tube includes a straight capillary with a very narrow inside diameter. HSO samples were analyzed by drawing them into the upper bulb of the right limb of the tube using a vacuum and then allowing the samples to drain downwards by gravity. The efflux time for the upper surface of the liquid to fall from the top line of the bulb to the bottom line was recorded. The kinematic viscosity (mm2/s) was calculated by multiplying the measured efflux time by the capillary viscometer constant.
The Epoxide Equivalent Weight (EEW, g/eq.) of the epoxidized products was expressed as the weight of epoxidized oil per equivalent of epoxy group and calculated using Equation (8).
The epoxide functionality (EF) of the epoxy products was estimated using epoxide equivalent weight (EEW) and molecular weight values using Equation (9).
where Wi is the average molecular weight of EHSO.
The percent epoxide value was determined using the epoxy equivalent weight value calculated for each EHSO using Equation (10).
The color of the oil samples was measured in a diode array spectrophotometer (Model Fx, Lovibond, UK) using AOCS official method Cc 13e-92 (2017). The instrument was calibrated to AOCS RY and Chlorophyll (Red, Yellow) settings and scales. To measure color, oil samples were added to a plastic cuvette with an optical path length of 10 mm at 25 °C. The measurements were taken in duplicate.
The phospholipid content of the oil samples was determined using the AOCS official method Ca 12–55 (2017). This method determines equivalent phosphatide content by ashing the oil sample in the presence of zinc oxide, followed by the spectrophotometric measurement at 650 nm of phosphorus as a blue phosphomolybdic acid complex. The standard curve was prepared as directed in the AOCS standard method, and the absorbance of each standard was plotted against its phosphorus content. The reagent blank was prepared and compared with the standard curve. Each sample was analyzed in duplicate.
The free fatty acid content (FFA) and peroxide value (PV) of all oil samples were determined using the CDR FoodLab® Jr. analyzer (Florence, Italy) with reagents and packaged cuvettes (PV kit catalog number F300150 and FFA kit catalog number F300125). An appropriate test curve was selected for each sample depending on the expected test range. FFA tests were measured within the 1–3.5% oleic acid range, while PV tests were quantified using a range of 0.3–25 meq O2/kg.
The Oil Stability Index (OSI) was determined using the AOCS official method Cd 12b-92 (2017). The analysis was performed using an 893 Professional Biodiesel Rancimat (Metrohm, Herisau, Switzerland). This was conducted by passing a stream of purified air through a test sample held in a heating block at 110 °C, with an airflow rate of 9 L/h. The effluent air from the oil or fat test sample was then bubbled through a vessel containing deionized water. The conductivity of the water was continually monitored and changed when volatile organic acids created from the oxidation of the oil dissolved in the water. Analyses were conducted in duplicate.
2.6. Statistical Analysis
A full factorial design was used to analyze the influence of each extraction type and refining step factors at 2 and 8 treatment levels, respectively. A two-way analysis of variance (ANOVA) was used to determine the differences between mean values. The response variables for the ANOVA were all in the analyses characterized in the methods. The mean comparison of the factors was analyzed using the Tukey HSD (honestly significant difference) test at a 95% level of confidence. Minitab v.21 statistical software (State College, PA, USA) was used to analyze the average value of the replicates.
3. Results and Discussion
3.1. Analysis of the Yield of the Epoxidized Oil
Recovery Yield
The goal of the study was to compare the recovery yield and quality differences in epoxidized HSO synthesized from crude, degummed, and bleached HSO samples. A total of twenty samples were refined and epoxidized: ten samples from mechanically extracted HSO and ten samples from solvent extracted HSO. The mass recovery yield results shown in Table 1 represent the amount of EHSO collected after epoxidation. Overall, the yield ranges between 82 and 97%. A recovery yield of 75% was reported by Manthey et al. [31] and 85% by Surender et al. [34] when they epoxidized crude HSO. In this study, the EHSO yield values of the extraction types were averaged irrespective of the refining step after the epoxidation process. Likewise, the values for the different refining steps were averaged irrespective of the extraction type. The mean comparison showed that yields were significantly different (p-values < 0.05) among the different refining steps and extraction types, even though the standard deviations were 2–3%. The yield from the crude EHSO was the lowest, and that from acid-degummed–bleached samples was the highest. Theoretically, the maximum recovery yield of an EHSO relative to HSO is expected to be 109.9% if all the double bonds were epoxidized and all the products were recovered. There are 0.62 moles of double bond in 100 g of HSO, and the oxygen is expected to add 9.9 g if all the bonds are epoxidized. Yields less than 109.9% are likely due to residual double bonds, or EHSO adhering to the flask, catalysts, and/or filter media, as well as side products washed off during post-epoxidation refining. Because all the processes were similar, the variation in yields was likely due to the quantity of impurities (gums, free fatty acids, colorants, etc.) removed before and/or after the epoxidation process.

Table 1.
ANOVA results for the yield of epoxidized hempseed oil.
As mentioned in the introduction, refining after the epoxidation process, where the crude EHSO is washed several times with water and then neutralized with sodium carbonate, is very similar to the degumming and neutralization steps of vegetable oils. The recovery of the epoxidized crude was the lowest (<90%), but it is important to factor in the yield loss during HSO refining prior to the epoxidation process. Table 2 shows the recovery yield pre- and post-epoxidation, where the cumulative recovery yield of the crude is comparable to degummed and bleached samples. It is important to note that the EHSO from crude HSO had only post-epoxidation refining; that is, most of the impurities like phospholipids (gum) and free fatty acids were removed after epoxidation. Meanwhile, the bleached samples had very high post-epoxidation yield, but the lowest cumulative yield if loss during bleaching is considered.
Table 2.
Comparing the mass recovery yield before and after epoxidation of mechanically extracted hempseed oil.
In general, the cumulative recovery loss of 15–26% might not be attributed to only the level of impurities present, but likely to the difficulty in phase-separation during refining. Some studies have added a solvent like hexane during the washing process to improve phase separation, but added a desolventizing step to remove the solvent [16]. The pre- and post-epoxidation yields showed that the water-degummed and bleached (WDB) samples had the highest cumulative yield loss of 26% compared to other refined samples. This was followed by acid degumming and bleaching (ADB) with 19.5%. This shows that there was a significant amount of yield loss from the extra process (bleaching) because HSO was lost when filtering or separating the bleaching clay from the bleached oil. It is not clear why the cumulative loss in WDB was significantly higher than ADB, but this might be due to emulsification of oil and water, as water washing of the degummed oil generates additional oil loss. Emulsification of oil and water may be due to the affinity of water to the ester group and hydratable phospholipids after bleaching [23,36]. Figure 2 visually shows the recovered color of crude and acid-degummed EHSO samples prepared for washing during post-epoxidation. Comparing the color shows that impurities like phospholipids, gums, and color pigments that precipitated in the crude EHSO samples make the appearance cloudier than acid-degummed EHSO samples. Washing the organic oil layer with base reagent removes the impurities and saponifiable portions (soaps), leading to oil loss and a decrease in the overall yield of the EHSO. Looking at the cumulative yield in Table 2 revealed that at least degumming of the HSO improved the recovery yield, and bleaching was not beneficial in terms of mass recovery.
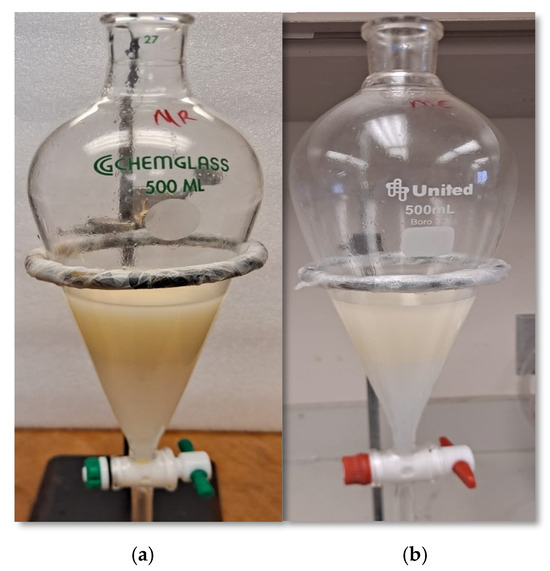
Figure 2.
Post-epoxidation washing process of EHSO samples: (a) crude EHSO and (b) acid-degummed EHSO.
3.2. Analysis of the Quality of the Epoxidized Resin
3.2.1. Oxirane Oxygen Content (OO)
One of the ways to evaluate the quality of epoxidized oils is by the degree of epoxidation from the oxirane oxygen content, which quantifies the number of epoxy groups available in the resin. Table 3 shows the statistical analysis of oxirane oxygen content for EHSO. Even though the mean OO values were between 8.45 and 8.59%, the statistical analysis shows that there was a significant difference (p-value < 0.05) between extraction types and refining steps. Oxirane oxygen contents of crude EHSO and refined EHSO, such as ADB and WDB, were not statistically different, indicating that the impurities in crude EHSO did not hinder the formation of oxirane bonds, though the ADB and WDB were the highest pre-refined step in this study [10,11]. However, the bleached samples had slightly lower oxirane than the degummed samples. This may be due to the water breaking down the ester bonds within a bleached oil molecule, resulting in the formation of free fatty acids and glycerol, which can then be washed as soaps during post-refining. Some studies have found that chemical reactions such as hydrolysis and oxidation lead to an increase in free fatty acids and the formation of primary and secondary oxidation products [37,38]. For example, when epoxidized oils are treated with a base upon neutralization, they convert fatty acid carboxylate salts into carboxylic acids, which increase side reaction products [30,39].
Table 3.
Oxirane oxygen, epoxy equivalent weight (EEW), and solid content of epoxidized hempseed oil.
In most epoxidized hempseed oil studies, maximizing epoxy qualities was not prioritized, mainly due to a focus on synthesis for various epoxy resin applications. For example, Jariwala et al. [32] synthesized EHSO and achieved an OO of 5.9% with an initial IV of 124.3 gI2/100 g, while Surender et al. [34] synthesized hydroxyl derivatives of HSO to develop polyurethane foams. Furthermore, Omonov et al. [33] and Manthey et al. [31] synthesized EHSO for the preparation of thermosets and achieved an OO of 8.0% and 8.6%, respectively. Some differences observed in the OO from these studies may be due to their initial IV of HSO in epoxidation, and other reaction conditions such as different molar ratios, production time, and temperature. In this study, the optimized epoxidation process procedure from Monono et al. [40] was used, which may have helped achieve a higher OO yield.
EEW is related to the epoxide concentration in epoxy resin applications. Lower EEW is required for more concentration of epoxide, leading to increased crosslink density in epoxy resin curing requirements. Crude EHSO, having the highest EEW value because of lower oxirane content, indicates lower crosslink density for coatings and composite applications. Moreover, crude EHSO results indicate the likelihood of long carbon chain fatty acids after post-epoxidation refining compared to samples that had pre- and post-epoxidation refining [41]. This was compared to EHSO from Lerma-Canto et al. [42], where EEW was higher at 226 g/eq because of a lower OO result. Solid contents were closely similar, with all values of epoxidized oil synthesized being greater than 99.9%. These values indicate that the post-epoxidation drying process was effective in removing moisture and any residual volatiles from the final epoxy resin.
3.2.2. Conversion
Conversion of unsaturated bonds to epoxy bonds is an important parameter because it shows the percent of oxirane or epoxy bond formed compared to its maximum theoretical oxirane oxygen that can be formed. However, because epoxy bonds can be formed and then cleaved by degradation to form other products, it was appropriate to define the conversion with respect to the iodine value that accounts for the degree of unsaturation. Low iodine values after epoxidation indicate a higher conversion of the unsaturated double bonds in the epoxidized oil. Table 4 shows that there was a significant difference in conversion for extraction types but not for different refining steps. More than 99% of unsaturated double bonds were converted during epoxidation, which implies that near complete conversions of double bonds were achieved for the different EHSO. This was possibly due to adequate stirring and by using the optimal process conditions suggested by Monono et al. [40]. The final iodine values varied between 0.2 and 0.8 gI2/100 g, indicating near-zero unsaturation of the final resin. Looking at the OO conversion values calculated using the actual and theoretical OO, the maximum conversion of unsaturated bonds to epoxy groups was 94.6% for epoxidized water-degummed (EWD) oil (Table 4). This shows that side products like peroxides and hydroxyl groups could have been formed in the presence of excess water and hydrogen peroxide [39]. Less than 6.4% of the bonds were converted into other products in the epoxidation of the EHSO. Cooney [43] reported that maximum relative IV conversion was reached after 8 h at 88% and the highest OO conversion was 73.4% at 7 h, under different study conditions. Manthey et al. [31] reported oxirane oxygen content as approximately 8.6% and a relative conversion to oxirane of 92% at 7 h [44].
Table 4.
Conversion and iodine value of epoxidized hempseed oil.
3.2.3. Other Quality Characteristics of the Epoxidized Hempseed Oil
Selectivity refers to the preferential ability to form oxirane oxygen, minimizing unwanted byproducts. The lower the bond saturation found using iodine values of the EHSO samples (Table 4), the more readily epoxidation was achieved with high conversion and high selectivity. Table 5 shows that the selectivity was high (>0.94) in all the EHSO corresponding to high conversion values of epoxy groups, even for the samples that were not bleached prior to epoxidation. The high selectivity further indicates low degradation into unwanted products. The viscosity of the epoxy resins for composite purposes should be less than 500 cP at 40 °C because higher viscosity can cause problems with fiber wetting, which may allow voids, and increase the injection time [45,46]. The kinematic viscosity appeared to vary from 210–236 mm2/s at 40 °C across samples (Table 5). The viscosities of the bleached samples were slightly higher than the other samples, while the degummed samples were slightly lower at 210–213 mm2/s.
Table 5.
Other quality properties of epoxidized hempseed oil samples.
Other quality parameters like phosphorus, free fatty acids (FFA), oxidative stability index (OSI), and peroxide values of the HSO and EHSO were evaluated, and the results are shown in Table 6. Evaluating these parameters for oil quality was important because they indicate different aspects of oil degradation and suitability after purification. Phosphorus of the crude sample was generally low at 25 ppm, which is within the 5–30 ppm range for degummed oils [28,47]. The phosphorous amount decreased during pre-epoxidation refining to 12–17 ppm and was significantly lower at 1.9–3.4 ppm post-epoxidation refining. This demonstrates that refining the oil before the epoxidation process may not be necessary with regard to the initial phosphorus content. Phosphorus in crude vegetable oil is usually removed during the degumming process, either by water and/or acid degumming. Post-epoxidation washing or refining is similar to the degumming process, which likely aided the precipitation and removal of phospholipids.
Table 6.
Characterization of pre- and post-epoxidation for different refined mechanical pressed hempseed oil.
The FFA content indicates fatty acid chains that cleave from the glycerol group in the triglyceride structure. From Table 6, the initial FFA of crude was 2.9 ppm, which is extremely low compared to approximately 20,000 ppm reported in Wilson et al. [48]. This indicates that only a small amount of FFA exists in free acid forms, which confirms that the majority of fatty acids are present in ester forms, either in triacylglycerols (TAGs) or in polar lipids such as glycolipids or phospholipids [48]. The FFAs were washed off during refining, hence the values were reduced to less than 1 ppm in all the epoxidized resins.
OSI indicates the stability of the HSO or EHSO to oxidation. The higher the OSI, the more stable the oil. The OSI of the crude HSO was higher than the refined HSO, which was likely due to the presence of antioxidants. These antioxidants were removed during the degumming and bleaching processes; hence, the OSI significantly decreased (Table 6). Post-epoxidation, the OSI of the EHSO significantly increased to 12 h. This is because of the low degree of unsaturated bonds in the EHSO. The OSI of 12 h was the same for all EHSO irrespective of the refining type. Meanwhile, the peroxide value (PV) corresponds with OSI for determining the quality of the product with respect to removed impurities. As shown in Table 6, the PV of the crude to refined HSO decreased from 13.6 to 7.4 meqO2/kg and 2.4–1.3 meqO2/kg, respectively, which differ significantly after post-epoxidation. Low PV confirms that the post-epoxidation process provides good stability for EHSO samples.
3.3. Effect of Bleaching on the HSO and EHSO Color
As shown in the previous section, bleaching the oil sample prior to epoxidation did not significantly improve the degree of epoxidation reaction. However, bleaching helps remove unwanted color, thereby improving the visual appeal of the product. As mentioned earlier, hydrogen peroxide acts as a bleaching agent. The oxidizing agent effectively removes the color molecules to achieve a lighter and more desirable appearance. It was important to qualitatively compare the color of the samples that were bleached and not bleached (degummed) prior to epoxidation (Figure 3). Figure 3a is a picture showing the colors of the HSO prior to epoxidation. The acid-degummed samples were slightly lighter than the crude and water-degummed samples, and the green chlorophyll color was clearly removed in the samples that were bleached using bleaching earth. Figure 3b is a picture showing the colors after epoxidation. All the green color disappeared, even for samples that were not bleached earlier, such as the crude and degummed samples. This clearly demonstrates the bleaching effect of hydrogen peroxide. Hydrogen peroxide achieved near complete color removal via decomposition of the non-polar nature of color pigments [25,49].
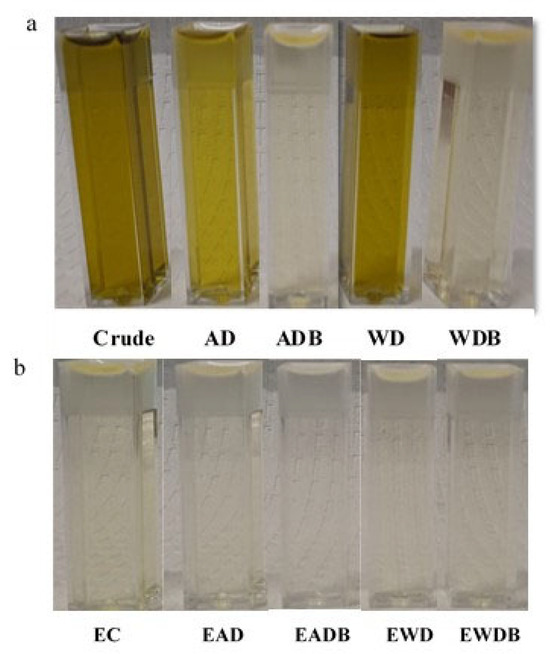
Figure 3.
Picture of different mechanical extracted hempseed oil samples (a) before epoxidation and (b) after epoxidation. Acid-Degummed (AD), Acid-Degummed and Bleached (ADB), Water-Degummed (WD), and Water-Degummed and Bleached (WDB) samples. E = Epoxidized.
To further explain the color differences in Figure 3, color analysis of HSO samples before and after epoxidation was performed using a Lovibond colorimeter, with the results shown in Table 7. The red color was initially very low (≤1.5) prior to epoxidation, and there was a decrease to 0.1–0.2 after epoxidation in all the samples. There was a similar trend in all the samples for the yellow color, which reduced to 0.3–0.8 following epoxidation. However, our focus for color analysis of EHSO samples (after epoxidation) was the chlorophyll content (green color) because it was the most significant color in the crude and unbleached HSO. Table 7 shows that crude EHSO chlorophyll content reduced by 99% during epoxidation.
Table 7.
Color analysis of hempseed oil samples before and after epoxidation.
The chlorophyll content in the crude oil significantly reduced from 17,558 ppb to 155 ppb due to the bleaching effect of hydrogen peroxide during epoxidation. Meanwhile, the chlorophyll content averaged 78–138 ppb for the bleached samples (bleaching earth used) prior to epoxidation. After epoxidation, the chlorophyll content of these bleached samples reduced to 25–35 ppb. Overall, the chlorophyll content of all epoxidized samples was between 25 and 154 ppb, irrespective of the refining process prior to epoxidation. This was evident in the absence of color observed in Figure 3b. The percent reduction between pre- and post-epoxidation EHSO samples was calculated and shown in Figure 4. The reduction values support that the extra bleaching prior to epoxidation was probably not necessary because 99% of the pigmentation (yellow and chlorophyll color) was lost after epoxidation without prior bleaching (Figure 4). Generally, low color content after the refining and post-epoxidation helps to lessen the actions of prooxidants (heat, light, oxygen), which accelerate oil degradation [50,51].
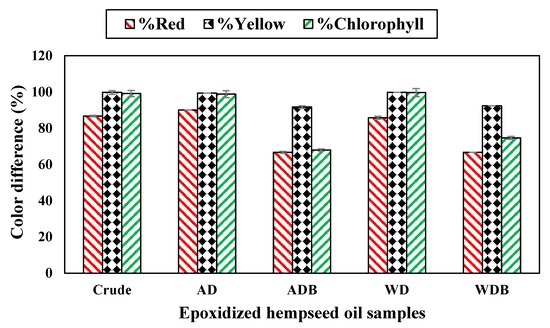
Figure 4.
Percent reduction between pre- and post-epoxidation EHSO samples.
4. Conclusions
The recovery yield, quality, and color were evaluated for different levels of HSO refinement and following post-epoxidation. For the yield, the cumulative loss from pre- and post-epoxidation processes revealed that the epoxidized degummed HSO had a mass recovery of approximately 86% compared to the yield of epoxidized crude and bleached HSO at 82% and 78%, respectively. Therefore, any additional pre-epoxidation bleaching step increased the amount of yield loss. The impurities in the crude HSO did not influence the epoxidation process, as the oxirane oxygen content for all samples ranged from 8.4 to 8.6% irrespective of the level of pre-epoxidation refining of the HSO. The double bond conversion for the crude oil was 99.5%, similar to samples that were degummed and bleached. For color removal, hydrogen peroxide was not only an oxidizer but also a bleacher. The chlorophyll content of the non-bleached samples (crude and degummed) reduced by 98.8–99.5% after epoxidation. Therefore, the bleaching process with bleaching earth prior to the epoxidation process was not necessary. Other quality characteristics of EHSO samples did not show any benefit from refining pre-epoxidation. Overall, results from this study indicate that the quality benefits from extra refining were not significantly beneficial and therefore can be minimized. Recommendations for further work are to evaluate the properties of thermoset materials produced from different EHSO types.
Author Contributions
Conceptualization, T.O. and E.M.; methodology, T.O. and E.M.; validation, T.O., N.C.S. and E.B.; formal analysis, T.O. and N.C.S.; investigation, T.O., N.C.S. and E.M.; resources, N.C.S., E.B. and E.M.; data curation, T.O., N.C.S. and E.M.; writing—original draft preparation, T.O. and E.M.; writing—review and editing, T.O., E.B. and E.M.; visualization, T.O., N.C.S., E.B. and E.M.; supervision, E.M.; project administration, E.M.; funding acquisition, E.M. All authors have read and agreed to the published version of the manuscript.
Funding
The research was funded by the grant USDA-NIFA-OP-009864. Additional support comes from the North Dakota Agricultural Experiment Station and USDA-NIFA Hatch multistate ND014891.
Data Availability Statement
Data are available upon request.
Acknowledgments
The authors are very grateful to Roger Gussiaas from Healthy Oilseeds, LLC in Carrington, ND, for providing hemp oil and hemp grain used in these experiments.
Conflicts of Interest
The authors declare no conflicts of interest. The funders had no role in the design of the study; in the collection, analyses or interpretation of data; in the writing of the manuscript; or in the decision to publish the results.
References
- Johnson, R. Defining hemp: A fact sheet. Congr. Res. Serv. 2019, 44742, 1–12. [Google Scholar]
- Rupasinghe, H.V.; Davis, A.; Kumar, S.K.; Murray, B.; Zheljazkov, V.D. Industrial hemp (Cannabis sativa subsp. sativa) as an emerging source for value-added functional food ingredients and nutraceuticals. Molecules 2020, 25, 4078. [Google Scholar] [CrossRef] [PubMed]
- Visković, J.; Zheljazkov, V.D.; Sikora, V.; Noller, J.; Latković, D.; Ocamb, C.M.; Koren, A. Industrial hemp (Cannabis sativa L.) agronomy and utilization: A review. Agronomy 2023, 13, 931. [Google Scholar] [CrossRef]
- Abdollahi, M.; Sefidkon, F.; Calagari, M.; Mousavi, A.; Mahomoodally, M.F. A comparative study of seed yield and oil composition of four cultivars of Hemp (Cannabis sativa L.) grown from three regions in northern Iran. Ind. Crops Prod. 2020, 152, 112397. [Google Scholar]
- Leonard, W.; Zhang, P.; Ying, D.; Fang, Z. Hempseed in food industry: Nutritional value, health benefits, and industrial applications. Compr. Rev. Food Sci. Food Saf. 2020, 19, 282–308. [Google Scholar] [CrossRef]
- Brzyski, P.; Barnat-Hunek, D.; Suchorab, Z.; Łagód, G. Composite materials based on hemp and flax for low-energy buildings. Materials 2017, 10, 510. [Google Scholar] [CrossRef]
- Polaczek, K.; Kurańska, M. Hemp seed oil and oilseed radish oil as new sources of raw materials for the synthesis of bio-polyols for open-cell polyurethane foams. Materials 2022, 15, 8891. [Google Scholar]
- Anwar, F.; Latif, S.; Ashraf, M. Analytical characterization of hemp (Cannabis sativa) seed oil from different agro-ecological zones of Pakistan. J. Am. Oil Chem. Soc. 2006, 83, 323–329. [Google Scholar] [CrossRef]
- Haytowitz, D.; Ahuja, J.; Wu, X.; Khan, M.; Somanchi, M.; Nickle, M.; Nguyen, Q.; Roseland, J.; Williams, J.; Patterson, K. USDA National Nutrient Database for Standard Reference, Legacy. 2018. Available online: https://www.ars.usda.gov/research/publications/publication/?seqno115=349687 (accessed on 12 July 2024).
- Campanella, A.; Baltanas, M.A.; Capel-Sanchez, M.C.; Campos-Martin, J.M.; Fierro, J.L.G. Soybean oil epoxidation with hydrogen peroxide using an amorphous Ti/SiO2 catalyst. Green Chem. 2004, 6, 330–334. [Google Scholar]
- Petrović, Z.S.; Zlatanić, A.; Lava, C.C.; Sinadinović-Fišer, S. Epoxidation of soybean oil in toluene with peroxoacetic and peroxoformic acids—Kinetics and side reactions. Eur. J. Lipid Sci. Technol. 2002, 104, 293–299. [Google Scholar]
- Callaway, J.C.; Pate, D.W. Hempseed oil. In Gourmet and Health-Promoting Specialty Oils; Elsevier: Amsterdam, The Netherlands, 2009; pp. 185–213. Available online: https://www.sciencedirect.com/science/article/pii/B9781893997974500115 (accessed on 14 July 2024).
- Liang, J.; Appukuttan Aachary, A.; Thiyam-Holländer, U. Hemp seed oil: Minor components and oil quality. Lipid Technol. 2015, 27, 231–233. [Google Scholar] [CrossRef]
- Montserrat-de La Paz, S.; Marín-Aguilar, F.; García-Giménez, M.D.; Fernández-Arche, M.A. Hemp (Cannabis sativa L.) Seed Oil: Analytical and Phytochemical Characterization of the Unsaponifiable Fraction. J. Agric. Food Chem. 2014, 62, 1105–1110. [Google Scholar] [CrossRef] [PubMed]
- Tuberoso, C.I.; Kowalczyk, A.; Sarritzu, E.; Cabras, P. Determination of antioxidant compounds and antioxidant activity in commercial oilseeds for food use. Food Chem. 2007, 103, 1494–1501. [Google Scholar] [CrossRef]
- Gharby, S. Refining Vegetable Oils: Chemical and Physical Refining. Sci. World J. 2022, 2022, 6627013. [Google Scholar] [CrossRef]
- Rabrenović, B.B.; Vujasinović, V.B. Industrial hempseed oil and lipids: Processing and properties. In Industrial Hemp; Elsevier: Amsterdam, The Netherlands, 2022; pp. 95–124. Available online: https://www.sciencedirect.com/science/article/pii/B9780323909105000038 (accessed on 14 July 2024).
- Golimowski, W.; Teleszko, M.; Zając, A.; Kmiecik, D.; Grygier, A. Effect of the bleaching process on changes in the fatty acid profile of raw hemp seed oil (Cannabis sativa). Molecules 2023, 28, 769. [Google Scholar] [CrossRef]
- Aachary, A.A.; Liang, J.; Hydamaka, A.; Eskin, N.M.; Thiyam-Holländer, U. A new ultrasound-assisted bleaching technique for impacting chlorophyll content of cold-pressed hempseed oil. LWT-Food Sci. Technol. 2016, 72, 439–446. [Google Scholar] [CrossRef]
- Kwaśnica, A.; Teleszko, M.; Marcinkowski, D.; Kmiecik, D.; Grygier, A.; Golimowski, W. Analysis of changes in the amount of phytosterols after the bleaching process of hemp oils. Molecules 2022, 27, 7196. [Google Scholar] [CrossRef]
- Oyewole, T.; Sarker, N.C.; Dhaliwal, G.; Biggane, E.; Monono, E. Investigating the effect of refining parameters on acetic acid removal and the quality of crude epoxidized soybean oil. J. Am. Oil Chem. Soc. 2024, 102, 47–59. [Google Scholar] [CrossRef]
- Dijkstra, A.J.; Van Opstal, M. The total degumming process. J. Am. Oil Chem. Soc. 1989, 66, 1002–1009. [Google Scholar] [CrossRef]
- Gunstone, F.D. Epoxidized oils. In Lipid Technologies and Applications; Routledge: Abingdon, UK, 2018; pp. 759–769. Available online: https://www.taylorfrancis.com/chapters/edit/10.1201/9780203748848-29/epoxidized-oils-frank-gunstone (accessed on 29 August 2024).
- Aider, M.; Ndiaye, M.; Karim, A. Optimization of canola meal bleaching by hydrogen peroxide, protein extraction and characterization of their functional properties. Future Foods 2023, 8, 100282. [Google Scholar] [CrossRef]
- Rincón, L.A.; Ramírez, J.C.; Orjuela, A. Assessment of degumming and bleaching processes for used cooking oils upgrading into oleochemical feedstocks. J. Environ. Chem. Eng. 2021, 9, 104610. [Google Scholar] [CrossRef]
- Ruíz-Méndez, M.V. Physical refining of edible oils using nitrogen as stripping gas. Process optimization. Grasas y Aceites 1994, 45, 3. [Google Scholar] [CrossRef]
- Santori, G.; Di Nicola, G.; Moglie, M.; Polonara, F. A review analyzing the industrial biodiesel production practice starting from vegetable oil refining. Appl. Energy 2012, 92, 109–132. [Google Scholar] [CrossRef]
- Gupta, M. Practical Guide to Vegetable Oil Processing; Elsevier: Amsterdam, The Netherlands, 2017. [Google Scholar]
- Borugadda, V.B.; Goud, V.V. Physicochemical and rheological characterization of waste cooking oil epoxide and their blends. Waste Biomass Valorization 2016, 7, 23–30. [Google Scholar] [CrossRef]
- Goud, V.V.; Patwardhan, A.V.; Dinda, S.; Pradhan, N.C. Kinetics of epoxidation of jatropha oil with peroxyacetic and peroxyformic acid catalysed by acidic ion exchange resin. Chem. Eng. Sci. 2007, 62, 4065–4076. [Google Scholar] [CrossRef]
- Manthey, N.W.; Cardona, F.; Francucci, G.; Aravinthan, T. Thermo-mechanical properties of epoxidized hemp oil-based bioresins and biocomposites. J. Reinf. Plast. Compos. 2013, 32, 1444–1456. [Google Scholar] [CrossRef]
- Jariwala, S.; Desai, Y.N.; Sahu, P.; Gupta, R.K. Hemp Seed Oil Derived Rigid Polyurethane Foams and Their Underlying Flame Retardancy Properties. J. Polym. Environ. 2024, 32, 3822–3834. [Google Scholar] [CrossRef]
- Omonov, T.S.; Patel, V.; Curtis, J.M. The Development of Epoxidized Hemp Oil Prepolymers for the Preparation of Thermoset Networks. J. Am. Oil Chem. Soc. 2019, 96, 1389–1403. [Google Scholar] [CrossRef]
- Surender, R.; Mahendran, A.R.; Wuzella, G.; Vijayakumar, C.T. Synthesis, characterization and degradation behavior of thermoplastic polyurethane from hydroxylated hemp seed oil. J. Therm. Anal. Calorim. 2016, 123, 525–533. [Google Scholar] [CrossRef]
- ASTM D2369-20; Standard Test Method for Volatile Content of Coatings. ASTM International: West Conshohocken, PA, USA, 2024.
- Abedinzadeh, S.; Torbati, M.; Azadmard-Damirchi, S.; Hashempour-Baltork, F. Changes in the quality of oil extracted by hot pressing from black cumin (Nigella sativa ) seeds and by solvent from the obtained cake during refining. Food Sci. Nutr. 2024, 12, 3563–3573. [Google Scholar] [CrossRef]
- Jadhav, S.J.; Nimbalkar, S.S.; Kulkarni, A.D.; Madhavi, D.L. Lipid oxidation in biological and food systems. In Food Antioxidants; CRC Press: Boca Raton, FL, USA, 1995; pp. 19–78. Available online: https://www.taylorfrancis.com/chapters/edit/10.1201/9781482273175-9/lipid-oxidation-biological-food-systems-jadhav-nimbalkar-kulkarni-madhavi (accessed on 5 October 2024).
- Zhang, Q.; Saleh, A.S.; Chen, J.; Shen, Q. Chemical alterations taken place during deep-fat frying based on certain reaction products: A review. Chem. Phys. Lipids 2012, 165, 662–681. [Google Scholar] [CrossRef]
- Campanella, A.; Baltanás, M.A. Degradation of the oxirane ring of epoxidized vegetable oils in liquid-liquid systems: II. Reactivity with solvated acetic and peracetic acids. Lat. Am. Appl. Res. 2005, 35, 211–216. [Google Scholar]
- Monono, E.M.; Haagenson, D.M.; Wiesenborn, D.P. Characterizing the epoxidation process conditions of canola oil for reactor scale-up. Ind. Crops Prod. 2015, 67, 364–372. [Google Scholar] [CrossRef]
- Setien, R.A.; Ghasemi, S.; Pourhashem, G.; Webster, D.C. Comparison of epoxidation methods for biobased oils: Dioxirane intermediates generated from Oxone versus peracid derived from hydrogen peroxide. Polym. Int. 2021, 70, 594–603. [Google Scholar] [CrossRef]
- Lerma-Canto, A.; Samper, M.D.; Dominguez-Candela, I.; Garcia-Garcia, D.; Fombuena, V. Epoxidized and Maleinized Hemp Oil to Develop Fully Bio-Based Epoxy Resin Based on Anhydride Hardeners. Polymers 2023, 15, 1404. [Google Scholar] [CrossRef]
- Cooney, T.I.; Cardona, F.; Tran-Cong, T. Kinetics of in situ epoxidation of hemp oil under heterogeneous reaction conditions: An overview with preliminary results. In Proceedings of the 1st International Postgraduate Conference on Engineering, Designing and Developing the Built Environment for Sustainable Wellbeing (eddBE 2011), Brisbane, Australia, 27–29 April 2011; Available online: https://research.usq.edu.au/item/q0vx6/kinetics-of-in-situ-epoxidation-of-hemp-oil-under-heterogeneous-reaction-conditions-an-overview-with-preliminary-results (accessed on 15 September 2024).
- Cooney, T. Epoxidised Resins from Natural Renewable Resources. Bachelor’s Dissertation, University of Southern Queensland, Toowoomba, Australia, 2009. Available online: https://sear.unisq.edu.au/8468/ (accessed on 4 March 2025).
- Parreira, T.F.; Ferreira, M.M.; Sales, H.J.; De Almeida, W.B. Quantitative determination of epoxidized soybean oil using near-infrared spectroscopy and multivariate calibration. Appl. Spectrosc. 2002, 56, 1607–1614. [Google Scholar] [CrossRef]
- La Scala, J.; Wool, R.P. Rheology of chemically modified triglycerides. J. Appl. Polym. Sci. 2005, 95, 774–783. [Google Scholar] [CrossRef]
- Pérez, J.E.; Haagenson, D.M.; Pryor, S.W.; Ulven, C.A.; Wiesenborn, D.P. Production and characterization of epoxidized canola oil. Trans. ASABE 2009, 52, 1289–1297. [Google Scholar] [CrossRef]
- Wilson, P.C.; Monono, E.; Sarker, N.C.; Clementson, C.L.; Evangelista, R.; Winkler-Moser, J.K. Assessing the Refinement Conditions for Mechanical and Solvent Extracted Hempseed Oil. J. ASABE 2025, 68, 207–215. [Google Scholar] [CrossRef]
- Banskota, A.H.; Jones, A.; Hui, J.P.; Stefanova, R. Triacylglycerols and other lipids profiling of hemp by-products. Molecules 2022, 27, 2339. [Google Scholar] [CrossRef]
- Chen, X.; Sun, S. Color reversion of refined vegetable oils: A review. Molecules 2023, 28, 5177. [Google Scholar] [CrossRef] [PubMed]
- Naz, S.; Siddiqi, R.; Sheikh, H.; Sayeed, S.A. Deterioration of olive, corn and soybean oils due to air, light, heat and deep-frying. Food Res. Int. 2005, 38, 127–134. [Google Scholar] [CrossRef]
Disclaimer/Publisher’s Note: The statements, opinions and data contained in all publications are solely those of the individual author(s) and contributor(s) and not of MDPI and/or the editor(s). MDPI and/or the editor(s) disclaim responsibility for any injury to people or property resulting from any ideas, methods, instructions or products referred to in the content. |
© 2025 by the authors. Licensee MDPI, Basel, Switzerland. This article is an open access article distributed under the terms and conditions of the Creative Commons Attribution (CC BY) license (https://creativecommons.org/licenses/by/4.0/).