Article

Sensitivity Control of Hydroquinone and Catechol at Poly(Brilliant Cresyl Blue)-Modified GCE by Varying Activation Conditions of the GCE: An Experimental and Computational Study

1
Department of Chemistry, Jagannath University, Dhaka 1100, Bangladesh
2
Center for Interdisciplinary Chemistry Research (CICR), Dhaka 1000, Bangladesh
3
Center for Nanotechnology Research, Department of Chemistry, American International University-Bangladesh (AIUB), Dhaka 1229, Bangladesh
4
Center for Nanotechnology, Department of Natural Sciences, Coppin State University, 2500 W. North Ave, Baltimore, MD 21216, USA
*
Authors to whom correspondence should be addressed.
ChemEngineering 2022, 6(2), 27; https://doi.org/10.3390/chemengineering6020027
Submission received: 16 February 2022 / Revised: 8 March 2022 / Accepted: 24 March 2022 / Published: 28 March 2022
(This article belongs to the Special Issue Feature Papers in Chemical Engineering)

Abstract

:
The poly(brilliant cresyl blue) (PBCB)-modified activated glassy carbon electrode (AGCE) shows the catalytic activity toward the oxidation of hydroquinone (HQ) and catechol (CT). The modified electrode can also separate the oxidation peaks of HQ and CT in their mixture, which is not possible with bare GCE. These properties of the modified electrode can be utilized to fabricate an electrochemical sensor for sensitive and simultaneous detection of HQ and CT. In this study, an attempt is made to control the sensitivity of the modified electrodes. This can be accomplished by simply changing the activation condition of the GCE during electropolymerization. GCE can be activated via one-step (applying only oxidation potential) and two-step (applying both oxidation and reduction potential) processes. When we change the activation condition from onestep to twosteps, a clear enhancement inpeak currents of HQ and CT is observed. This helps us to fabricate a highly sensitive electrochemical sensor for the simultaneous detection of HQ and CT. The molecular dynamics (MD) simulation is carried out to explain the experimental data. The MD simulations provide the insight adsorption phenomena to clarify the reasons for higher signals of CT over HQ due to having meta-position –OH group in its structure.

1. Introduction

Hydroquinone (HQ) and catechol (CT) are two naturally abundant phenolic isomers of dihydroxybenzene that widely coexist in ecological systems. Most of their comprehensive applicable sectors are pharmaceuticals, tanning, cosmetics, pesticide, flavoring agents, and photography chemical industries [1]. However, these are considered as environmental pollutants by the European Union (EU) and the US Environmental Protection Agency (EPA) because of their high toxicity [2]. The environmental and biological significance of HQ and CT such as toxicity, carcinogenicity, antioxidative activity, and antiviral activity has raised researchers’ interest in extensively studying them [3]. However, the coexistence of these isomers directly interferes in environmental samples and raises difficulty during their individual or simultaneous identification [4]. Therefore, it is challenging but essential to introduce a highly selective and sensitive analytical technique to detect HQ and CT simultaneously.
Recently, numerous techniques have been established, including spectrophotometric [5], chromatographic [6], chemiluminescence [7], fluorescence [8], and electrochemical techniques [9,10], for the quantitatively simultaneous detection of HQ and CT. Among them, electrochemical methods have been more advantageous due to their relatively low cost, fast response, simple operation, and high sensitivity [11]. However, the conventional glassy carbon electrode (GCE) cannot resolve the interference problem of the identification of these two phenolic isomers and provide their overlapping broad electrochemical voltammetric response [12]. The concept of using modifiers, such as carbon nanotubes [13], conducting polymer films [14], nanocomposites [15], gold nanoparticles [16], etc., to modify the GCE electrode is capable to overcome this problem. The formation of an oxide layer by electrochemical activation of the GCE, called activated GCE (AGCE), is another kind of reagentless electrode modification process. With the advent of electronically conducting polymers, modified electrodes are widely used on account of the following advantages: ease of preparation, good stability, reproducibility, homogeneity, and more accessible electroactive sites [17]. A variety of conducting polymers to modify GCE has been reported for the detection of HQ and CT such as poly-diallyldimethylammonium chloride [4], poly-amidosulfonic acid [18], poly-3-methylthiophene [19], polyp-aminobenzoic acid [20], poly-crystal violet [21], and polythionine [2]. Previously, we have prepared AGCE by applying oxidation potential and then modified it with poly(brilliant cresyl blue)(PBCB) for the simultaneous determination of HQ and CT [22]. In this study, we enhanced the sensitivity of the PBCB-modified AGCE for the detection of the same analytes. For this, the activation condition was changed, i.e., we applied both oxidation and reduction potential to prepare AGCE before electropolymerization. Then, we performed computational simulations to understand the sensing behavior of the modified electrode.
Recently, computational simulations have been widely used together with experiments to understand the interfacial mechanism and adsorption phenomenon of different electrochemical systems [23,24,25]. Li et al. observed the adsorption phenomenon of CT derivatives on graphene using molecular dynamics (MD) simulations [26]. The interfacial structure of CT and alumina surfaces was simulated, where CT formed two hydrogen bonds with the alumina surface [27]. However, despite applying many advanced experimental and simulation techniques, the interfacial structure of HQ and CT on the vicinity of the electrode surface is still unclear due to the complex structure between phenolic compounds and electrodes. It is also difficult and computationally expensive to fabricate such experimental events by simulation. Nevertheless, an extensive understanding of this interfacial structure is highly essential in order to fabricate new efficient electrochemical sensors.
This study was carried out to contribute to the understanding of the signal enhancement of individual voltametric response of HQ and CT caused by the structural change in the interface using the electrochemical method and all-atom MD simulations. We modified the GCE by employing a two-step activation condition: a constant oxidation potential proceeded by the application of the constant reduction potential and then modification with PBCB. Similar events were fabricated in simulations for comparison. Cyclic and differential pulse voltammetry, together with MD simulations, were employed to comprehensively examine the sensing capability and mechanism of this proposed modified electrode.

2. Experimental

2.1. Chemicals

All the reagents (analytical grade) were used without further purification. Double distilled water was used throughout the study. Hydroquinone, catechol, brilliant cresyl blue, and potassium hexacyanoferrate (III) were purchased from Sigma-Aldrich (Germany). Sodium phosphate dibasic (Na2HPO4) and sodium phosphate monobasic (NaH2PO4) were used to prepare a phosphate-buffered solution (PBS). Then, 0.1 M PBS of pH 7.0 was employed as the supporting electrolyte in electrochemical voltammetric measurements. PBS was prepared following our previous procedure [1]. Room temperature was controlled over the full experiments.

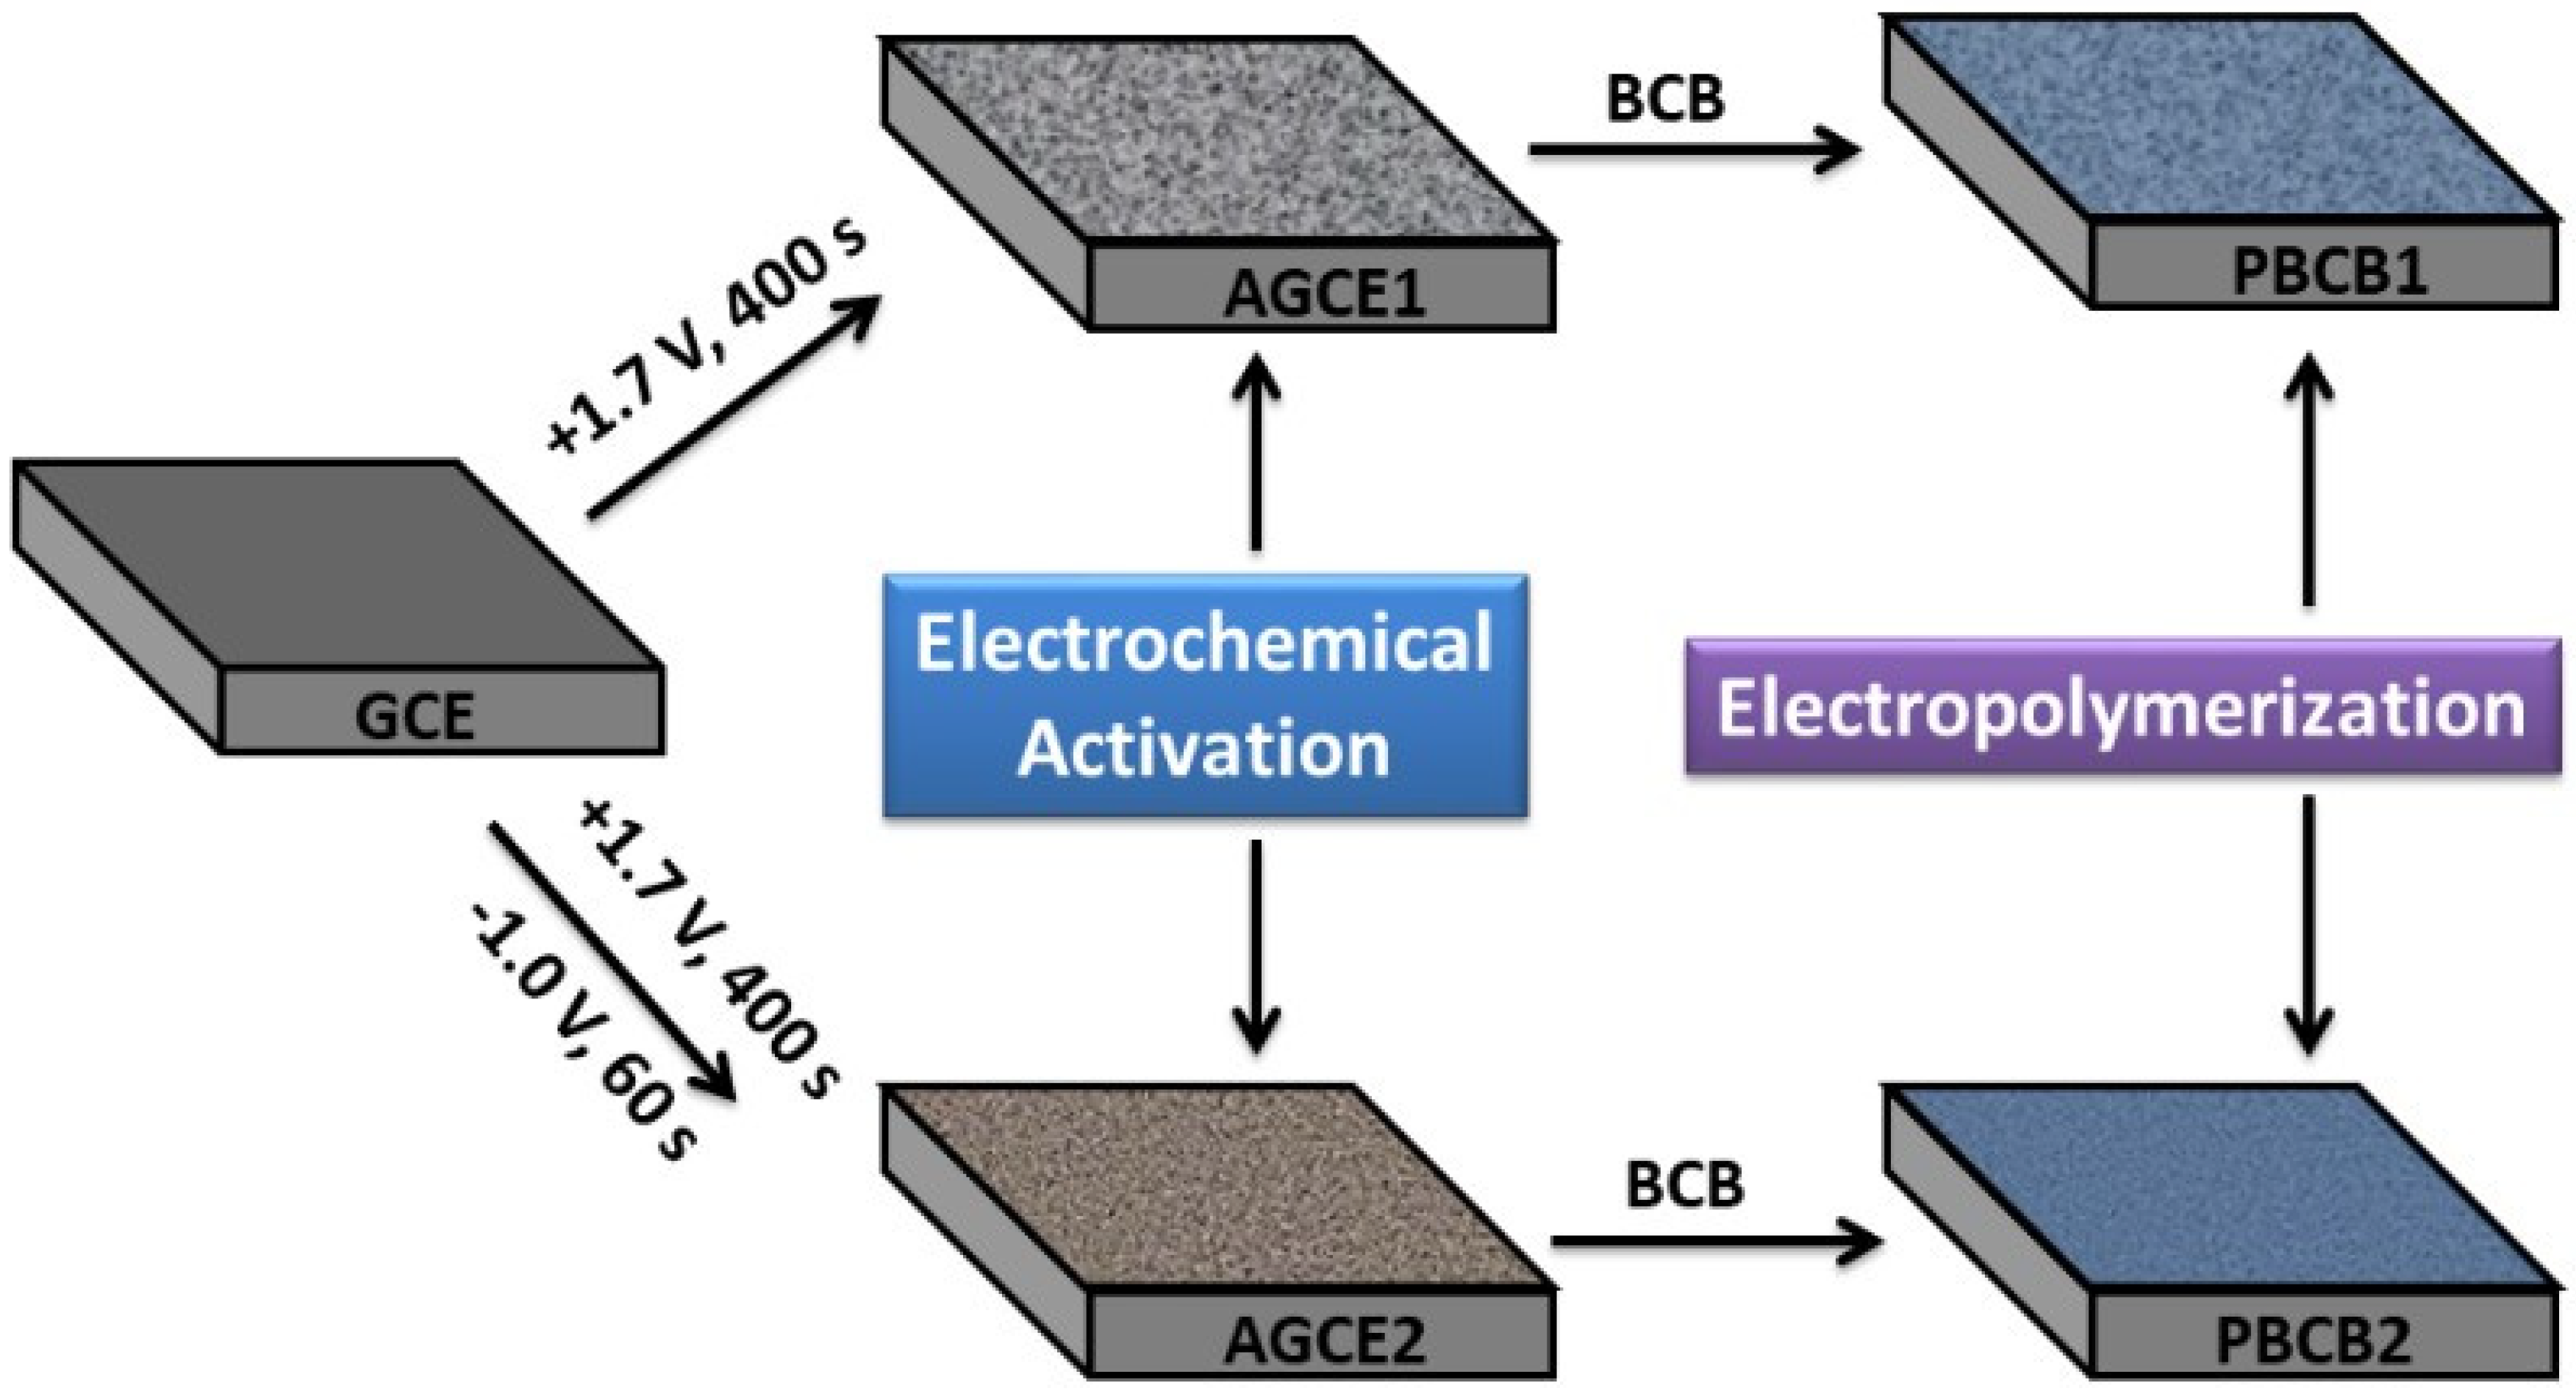
2.2. Preparation of Modified Electrodes

Prior to use, GCEs were polished with 0.05 μm alumina/water slurry (Buehler, 41 Waukegan Road Lake Bluff, IL, 60044-1699, USA) for obtaining a mirror-like finish, followed by sonication, and then rinsed with enough distilled water. One-step and two-step electrochemical activation processes were performed on the cleaned surface of GCEs. One-step activation (AGCE1) was accomplished by applying an oxidation potential of 1.7 V for 400 s in 0.1 M PBS (pH 7.0). Two-step activation (AGCE2) was carried out in the same phosphate-buffered solution by applying an oxidation potential of 1.7 V for 400 s, followed by a constant reduction potential of −1.0 V for 60 s. Electropolymerization of BCB was ascertained to obtain PBCB-modified activated GCE by sweeping the potential between −0.5 V and +0.4 V in PBS (pH 7.0) containing 0.1 mM BCB. In this paper, PBCB-modified one-step-activated GCE (only oxidation) and two-step-activated (oxidation followed by reduction) GCE are denoted by PBCB1 and PBCB2, respectively. Scheme 1 shows the modification process of PBCB1 and PBCB2.

2.3. Instrumentation

Voltammetric measurements were carried out with a CHI 660E electrochemical workstation (CH Instruments, 880 E Richey Rd, Houston, TX 77073, USA). Bare GCE, PBCB1, and PBCB2 were used as working electrodes. Ag/AgCl (3 M KCl) electrode and a platinum wire were used as reference and counter electrodes, respectively, to build up a conventional three-electrode system. Cyclic voltammetry (CV) and electrochemical impedance spectroscopy (EIS) measurements were carried out at the formal redox potential (0.3 V) of [Fe(CN)6]3−. EIS spectra were recorded over a frequency range from 100 kHz to 1 Hz with an amplitude of 5 mV. Electrochemical parameters for differential pulse voltammetry (DPV) were as follows: pulse amplitude; 100 mV/s, pulse width; 2ms, and pulse period; 1000 ms.

3. Results and Discussion

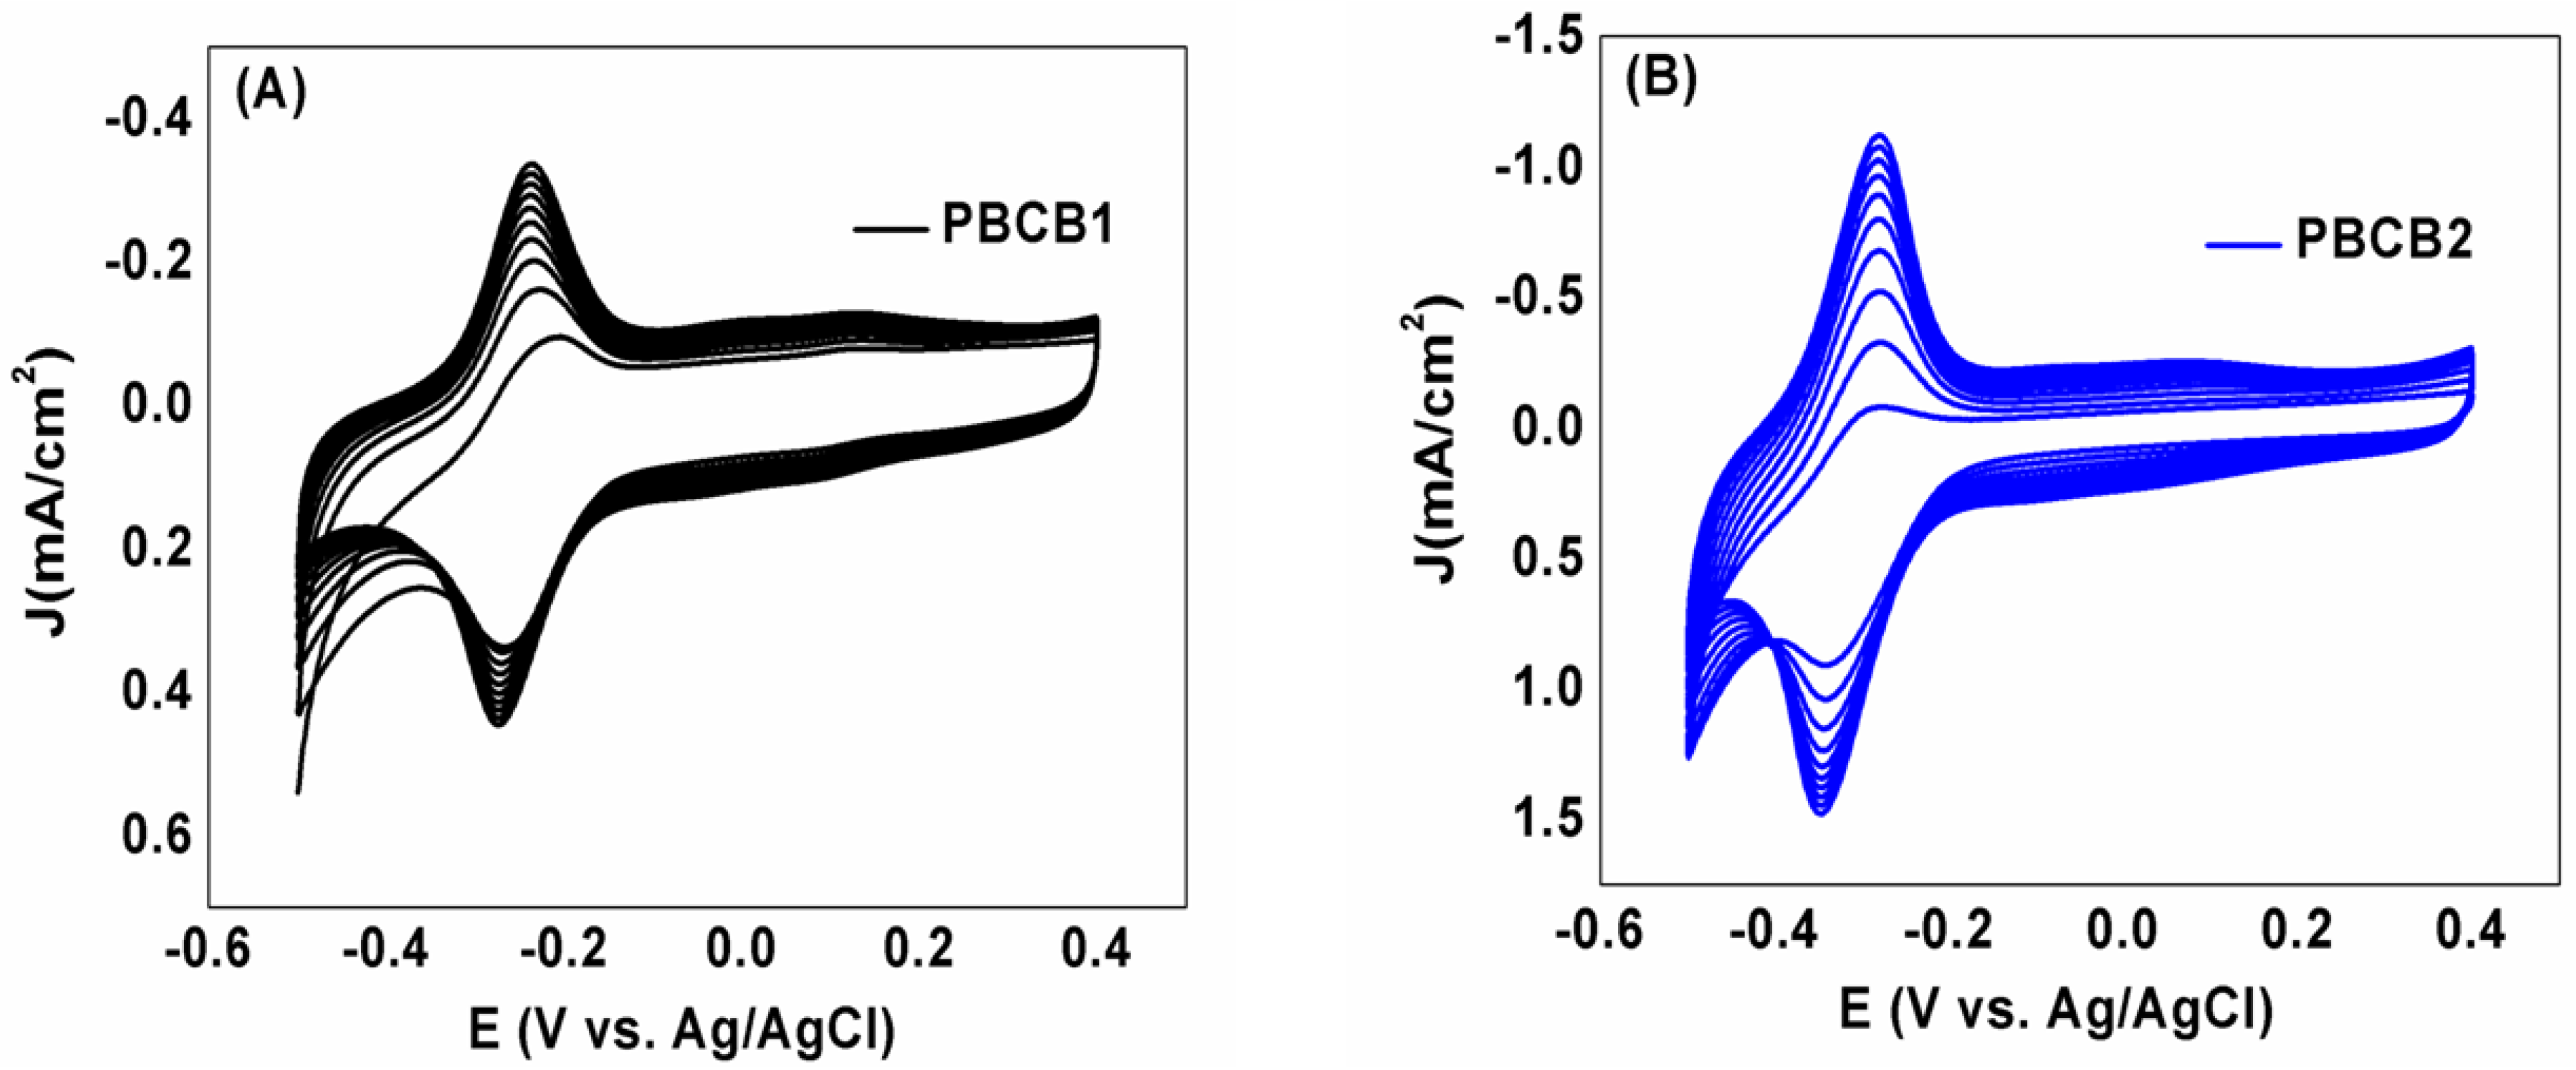
3.1. Electropolymerization of BCB on AGCE

Electropolymerization of BCB monomer through activation conditions, as described in the Experimental Section, was carried out using a consecutive series (10 cycles) of cyclic voltammograms (CVs) to obtain PBCB1 and PBCB2, as shown in Figure 1. A continuous increase incurrent including clear redox peaks without shifting their potentials indicated the stable PBCB film formation on the AGCEs [28]. It is considered that surface roughness increases with the activation of the electrode before electropolymerization. Higher surface roughness facilitates more HQ and CT adsorption onto the electrode surface. As manifested in Figure 1, upon increasing the number of cycles, the redox current density of PBCB2 significantly increased. The sharply improved peak current of PBCB2 is indicative of the fast current response and shows more sensitivity for the adsorbed ions than PBCB1. This higher sensitivity of PBCB2 was achieved for the two-step activation condition. In the first step of the activation process, surface functionalization occurred and formed an oxide layer on GCE. As a result, the surface area of GCE could be enhanced via opening the closed pore of the surface. After reduction of the oxide layer in the second step, the nature of functional groups could alter and surface roughness could be changed on the electrode surface. Therefore, it was expected that higher roughness of the surface of PBCB2 would show better performance than PBCB1, and ascending sensitivity could offer enhanced current signals when implemented in the detection of HQ and CT.

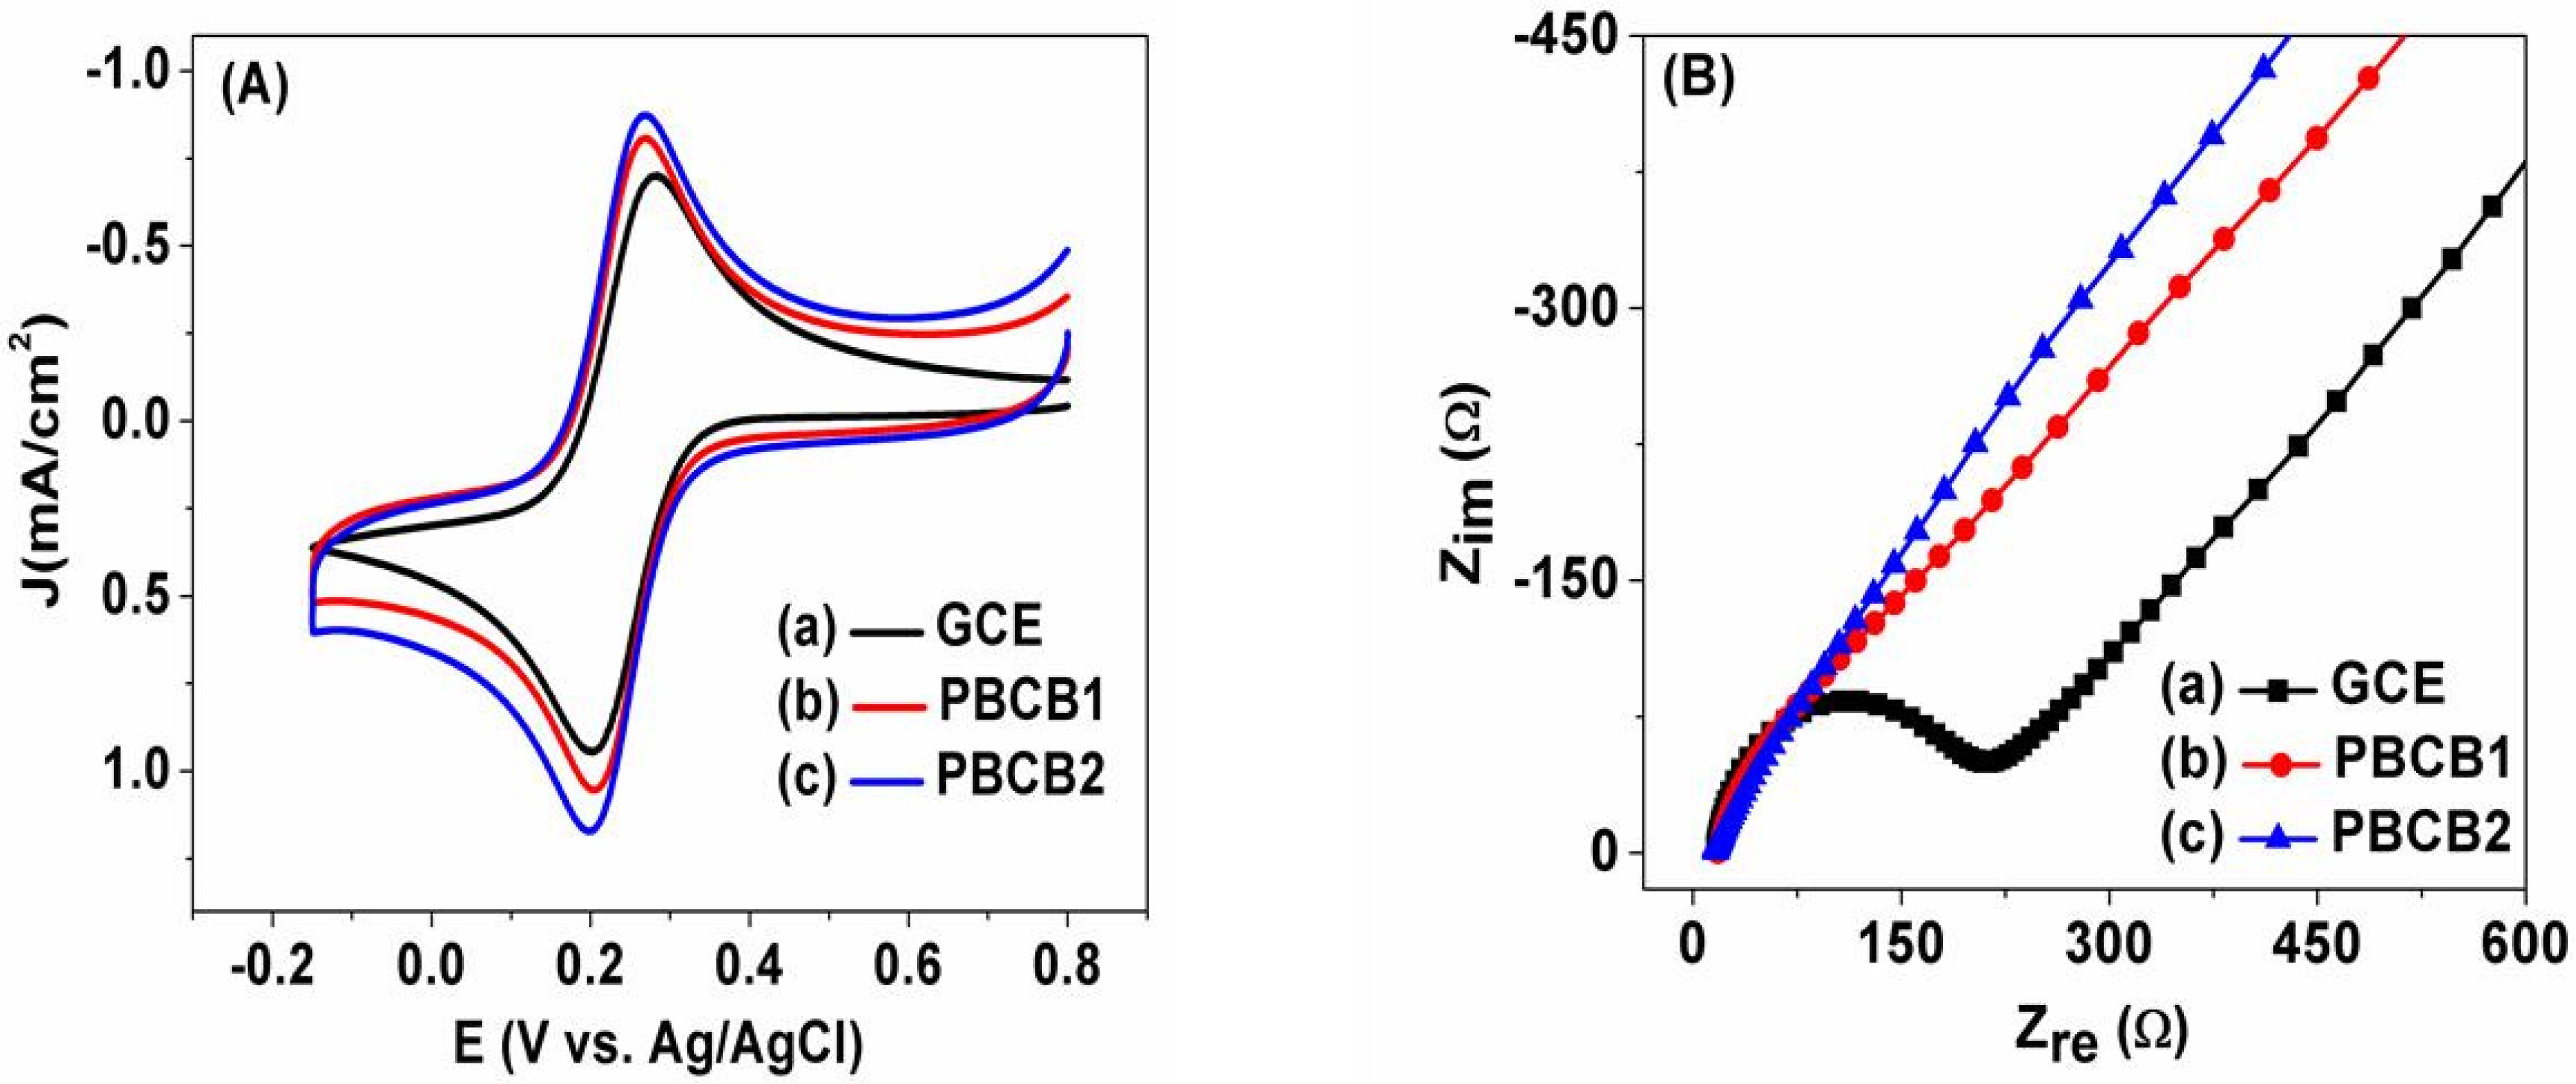
3.2. Surface Characterization of PBCB1 and PBCB2

By utilizing the sensitive redox probe [Fe(CN)6]3−/4−, CV and EIS were accomplished to characterize the PBCB-modified electrodes. The electrochemical charge transfer properties of bare GCE, PBCB1, and PBCB2 were evaluated by CVs in 5 mM [Fe(CN)6]3− containing 1.0 M KCl, as shown in Figure 2A. At bare GCE, a couple of relatively weak redox peaks were observed, compared with the condition observed in both PBCB-modified electrodes. Here, electrostatic interaction between redox probe and electrode surface was the center of interest. The electrostatic attraction of positively charged PBCB on the electrode surface and the negatively charged [Fe(CN)6]3− facilitated fast electron transfer kinetics, which was accompanied by the higher diffusion current density for modified electrodes. Increased peak currents were observed at PBCB2, compared with PBCB1 and bare GCE, as shown in Figure 2A. For higher surface roughness of PBCB2 attained by the two-step activation condition, more negatively charged [Fe(CN)6]3− couldinteract on the surface. That means a more pronounced diffusional tail generated for PBCB2 was associated with the deposition of much-accumulated ions on the electrode surface. As a result, the electrochemical behavior of these two PBCB-modified electrodes toward the oxidation of HQ and CT should also be different. EIS analysis was performed at a potential of 0.3 V, which is near the E° of [Fe(CN)6]3− (Figure 2B). The semicircle of the PBCB2 almost disappeared because of the good stability and superior electronic conductivity through rapid electron transfer. The charge-transfer resistance (Rct) was extracted from the EIS data, and the values of PBCB1 and PBCB2 were calculated to be 64.6 Ω and 0.001 Ω, respectively, implying that faster electron transfer induced by the less resistance value ofPBCB2 than that of PBCB1. The EIS results were also consistent with the obtaineddata in CV analysis.

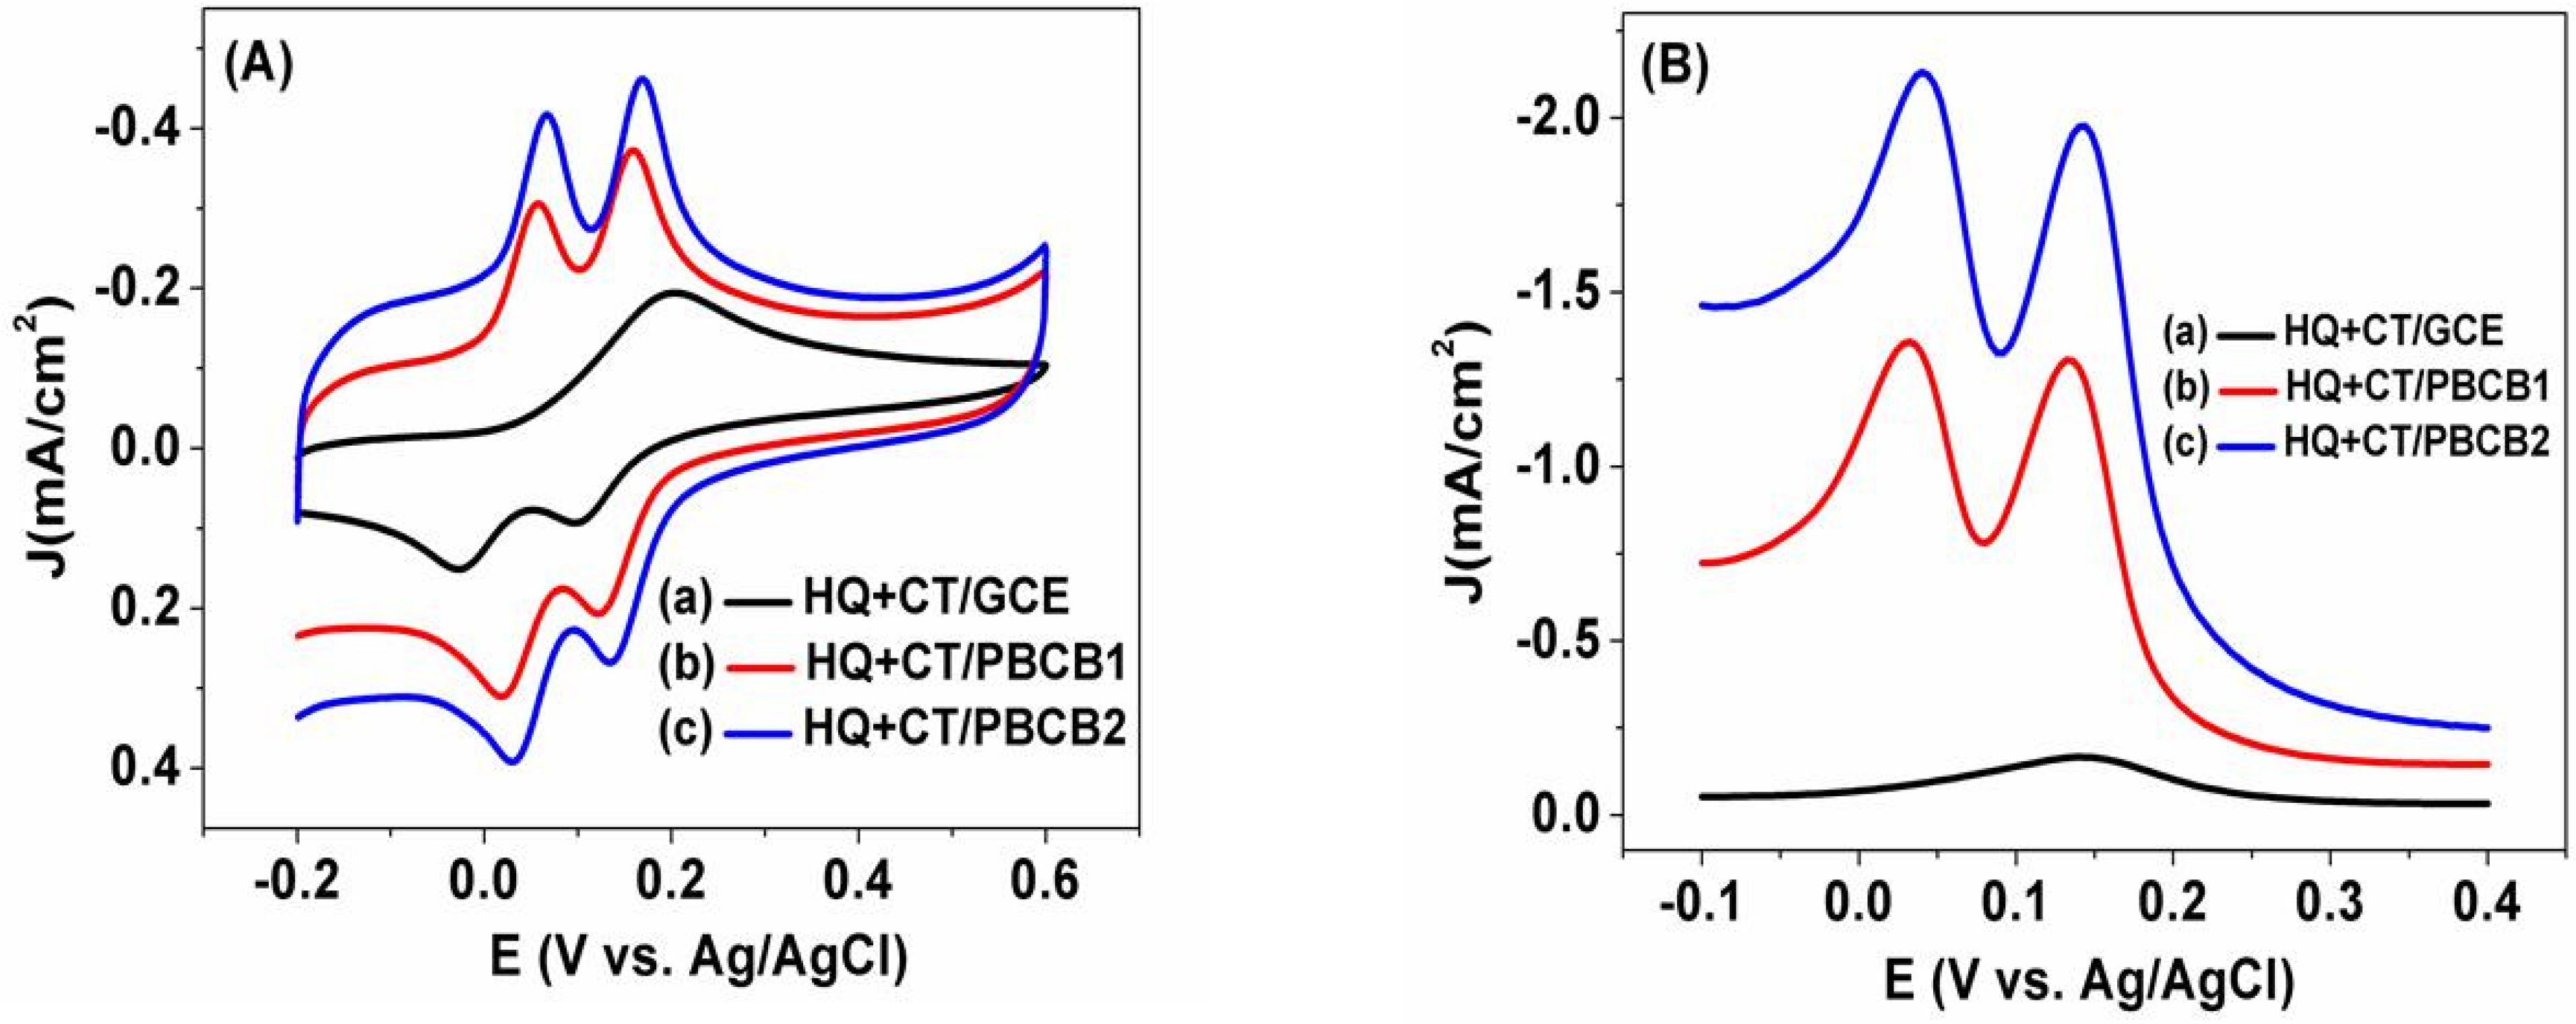
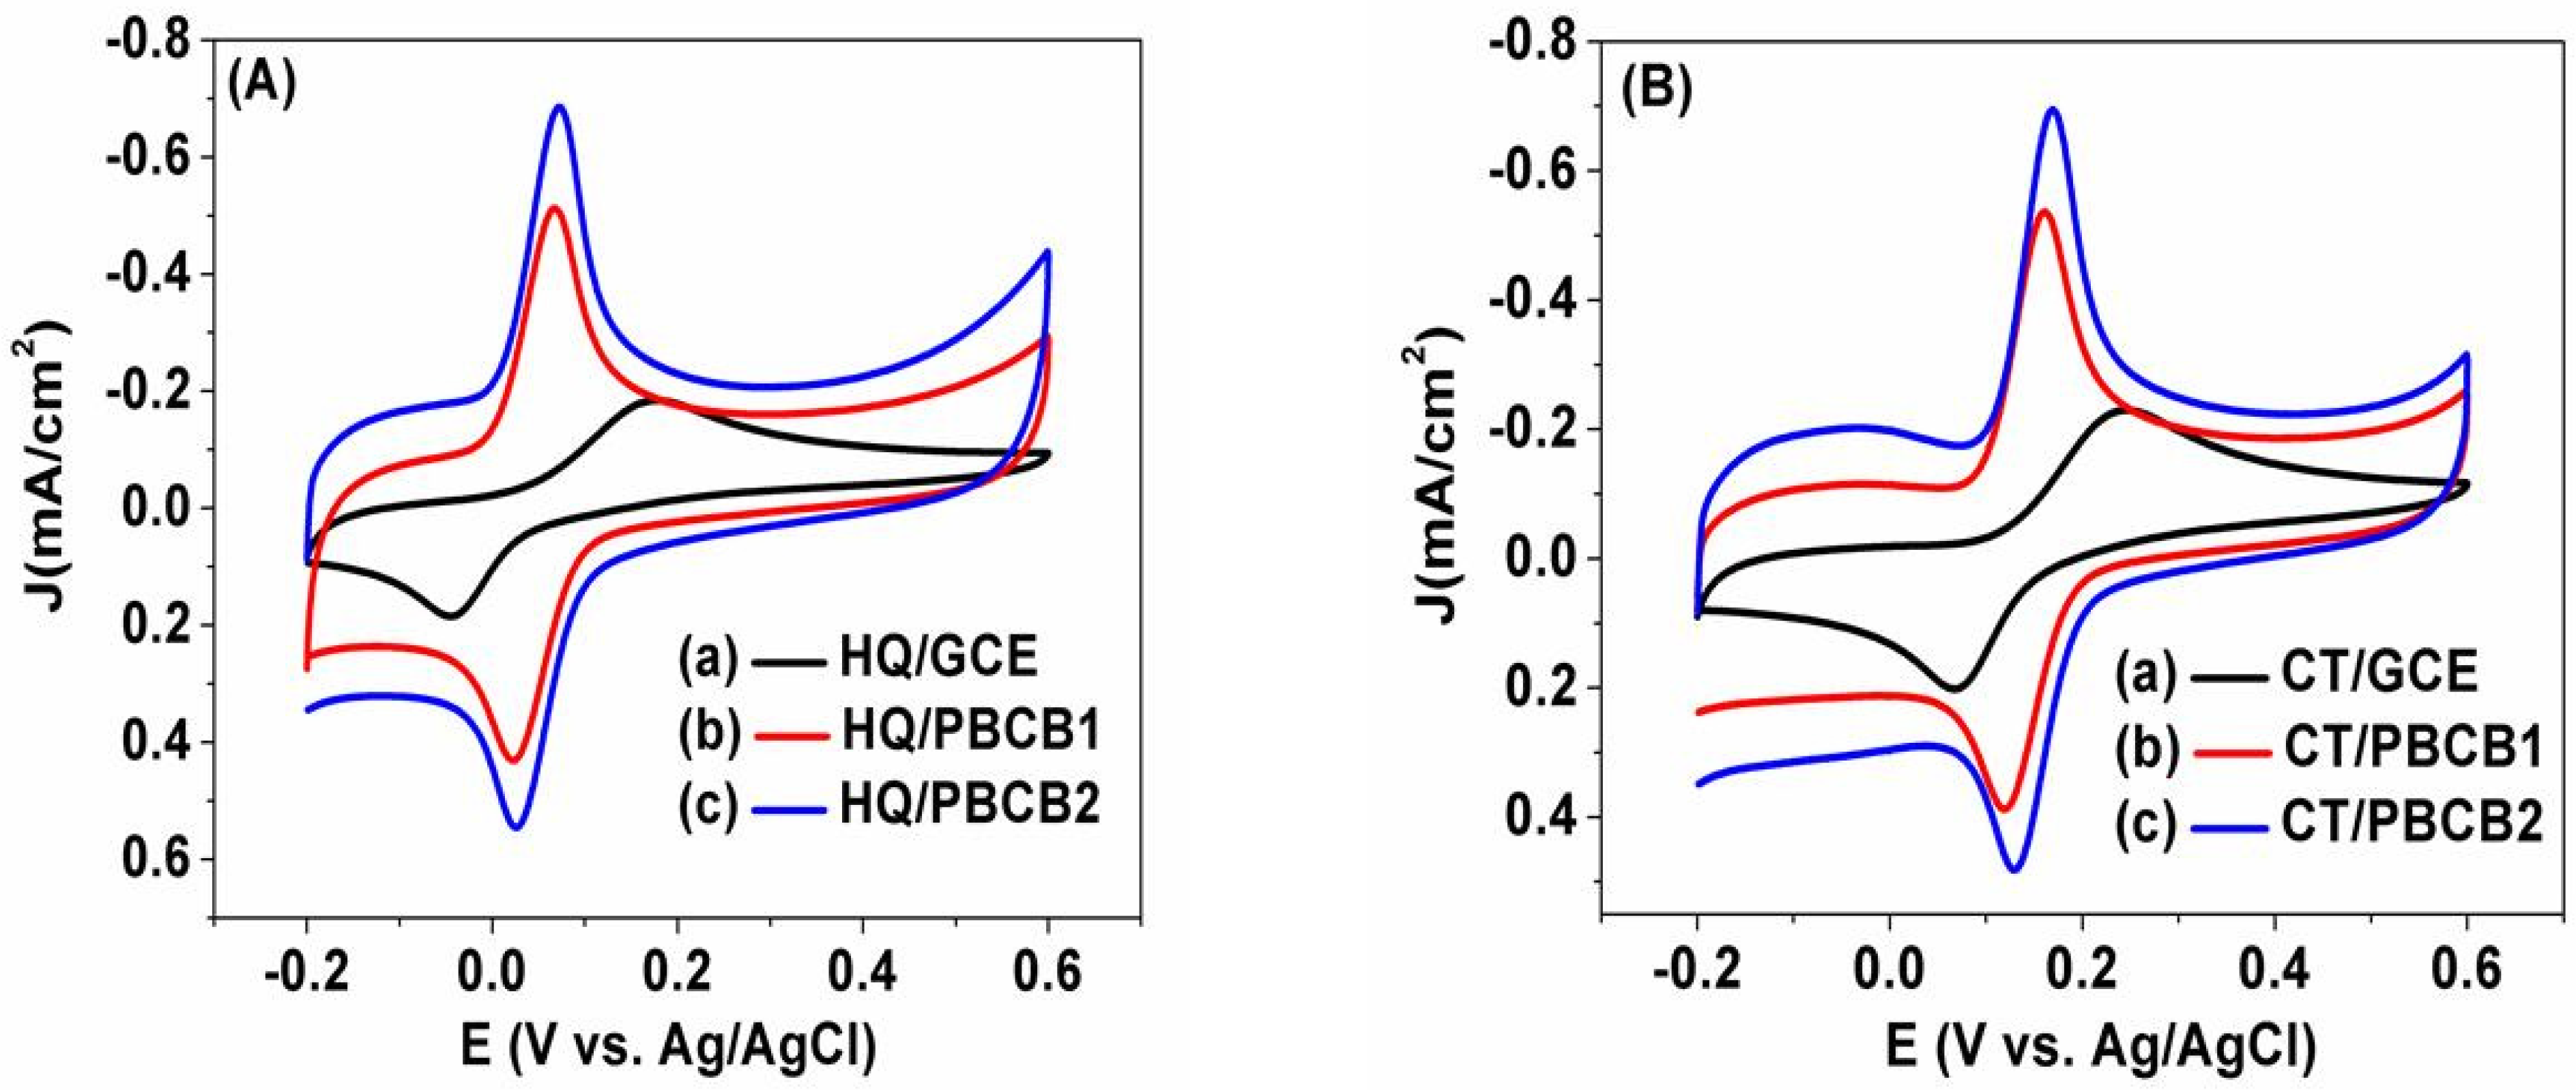
3.3. Electrochemical Behavior of HQ and CT

Figure 3A,B show the electrochemical behavior of GCE, PBCB1, and PBCB2 toward 0.5 mM of HQ and CT by CVs in 0.1M PBS (pH = 7.0). The peak potentials separation between anodic and cathodic peaks (∆Ep) corresponded to the values of 0.22 V and 0.19 V for HQ and CT at unmodified GCE, respectively. In comparison, at the modified GCE (both PBCB1 and PBCB2), the values for the peak potential separation in HQ and CT were reduced significantly to 47 mV and 42 mV, respectively. The narrow peak separations indicate that the redox reactions were reversible at the PBCB1 and PBCB2. Moreover, the peak currents of HQ and CT increased at both PBCB1 and PBCB2, with the latter electrode showing a relatively more increasing tendency. This increased peak current may be due to the improved surface conductivity of the GCE through enlarged surface accessibility resulting from the additional reduction potential of the activation process.
From CVs and DPVs for the mixture of HQ and CT, an unresolved broad peak at 200 mV appeared for GCE, which could not identify the individual presence of HQ and CT illustrated in Figure 4. A couple of well-defined oxidation peaks of CVs of the mixture of HQ and CT were found at the PBCB-modified electrode, with peak potentials of 66 mV and 166 mV, respectively. The sensitivity of HQ and CT at PBCB2 was significantly higher than that of others, suggesting higher catalytic activity of PBCB2. The DPV results showed more pronounced current responses for HQ and CT at PBCB2 (Figure 4B). However, the separation of peak potentials of HQ and CT at PBCB1 and PBCB2 were similar, and they were measured to be around 100 mV. Owing to the higher conductivity and larger accessibility of active sites of PBCB2 toward analytes, the results revealed superior electrocatalytic activity and much higher sensitivity on the resolution of those two analytes.

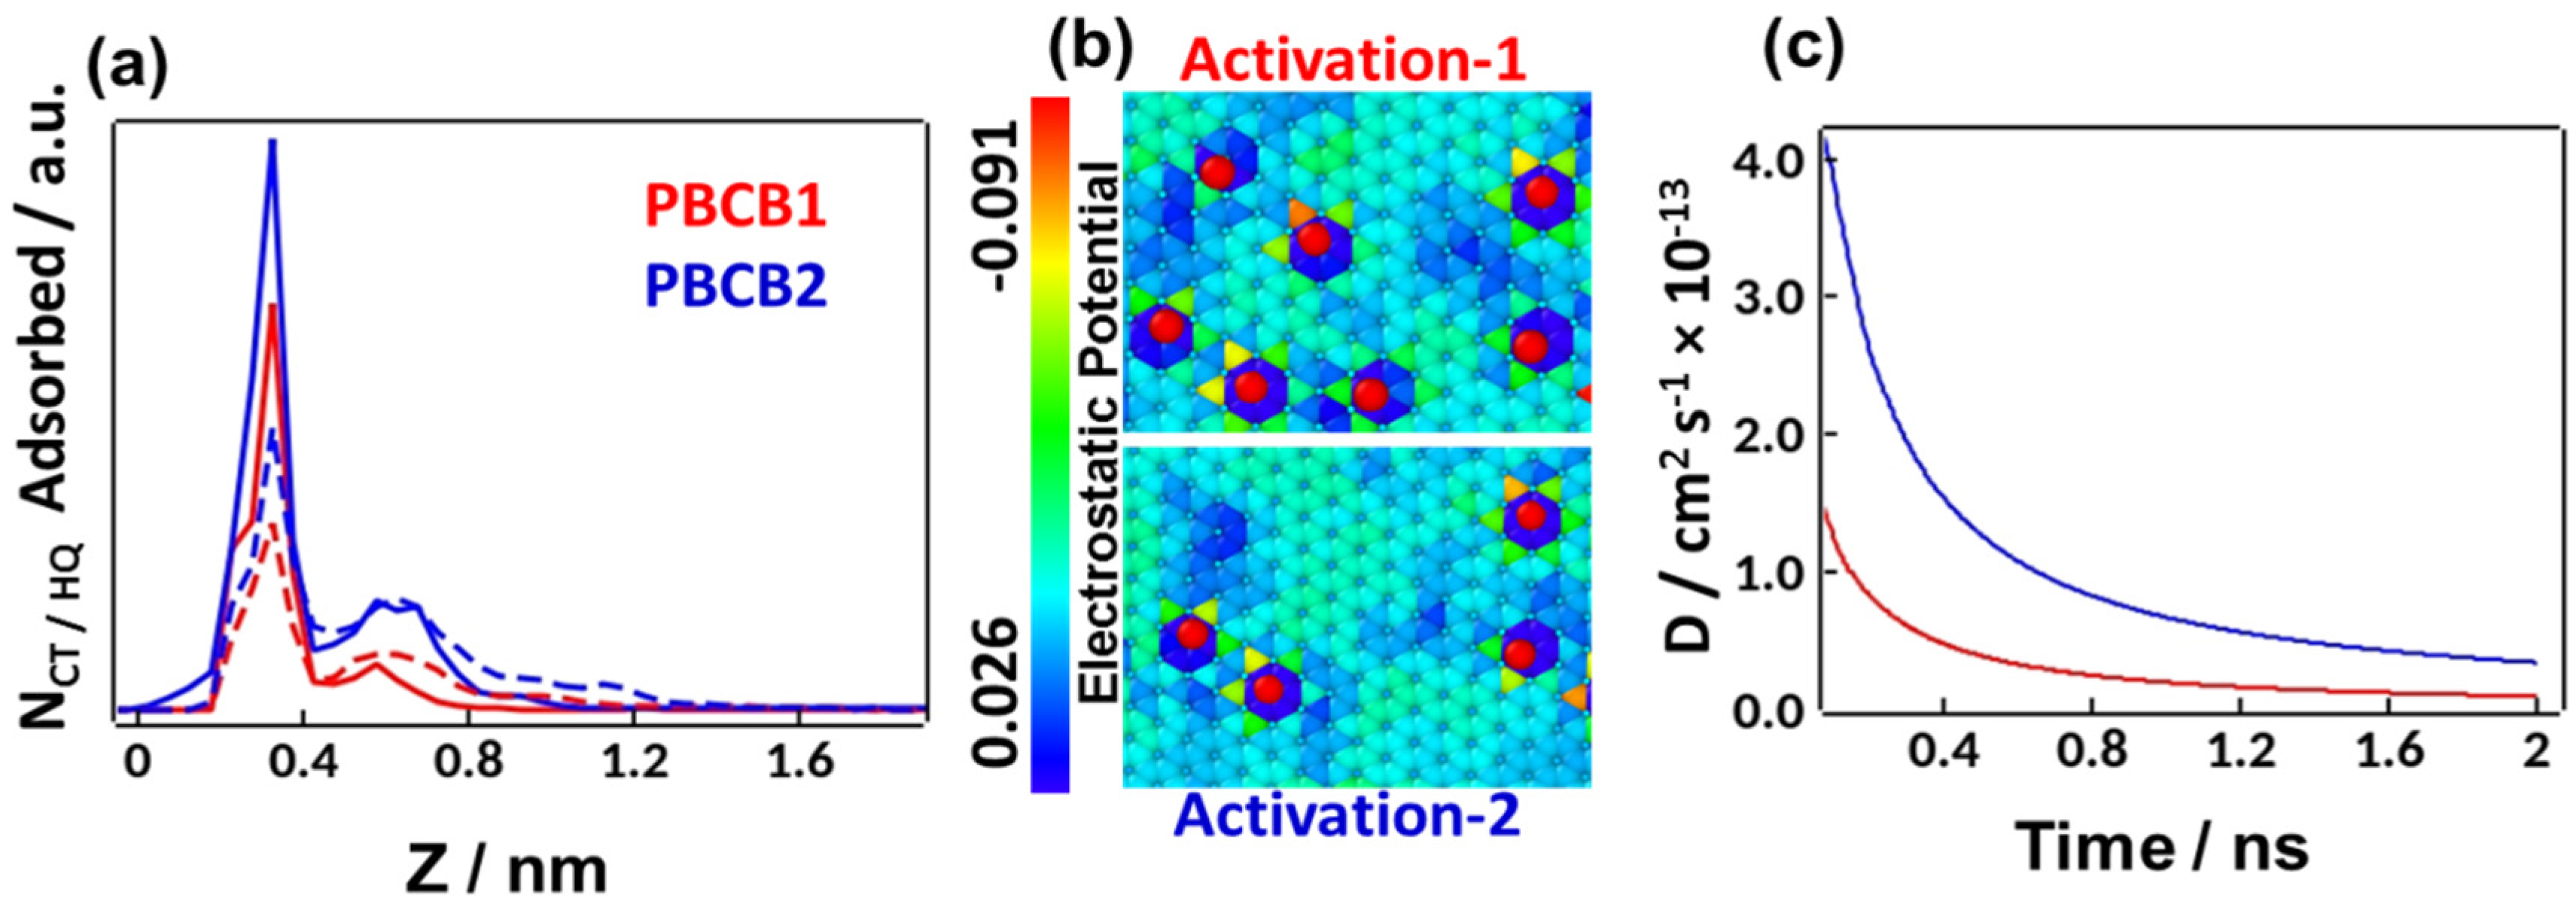
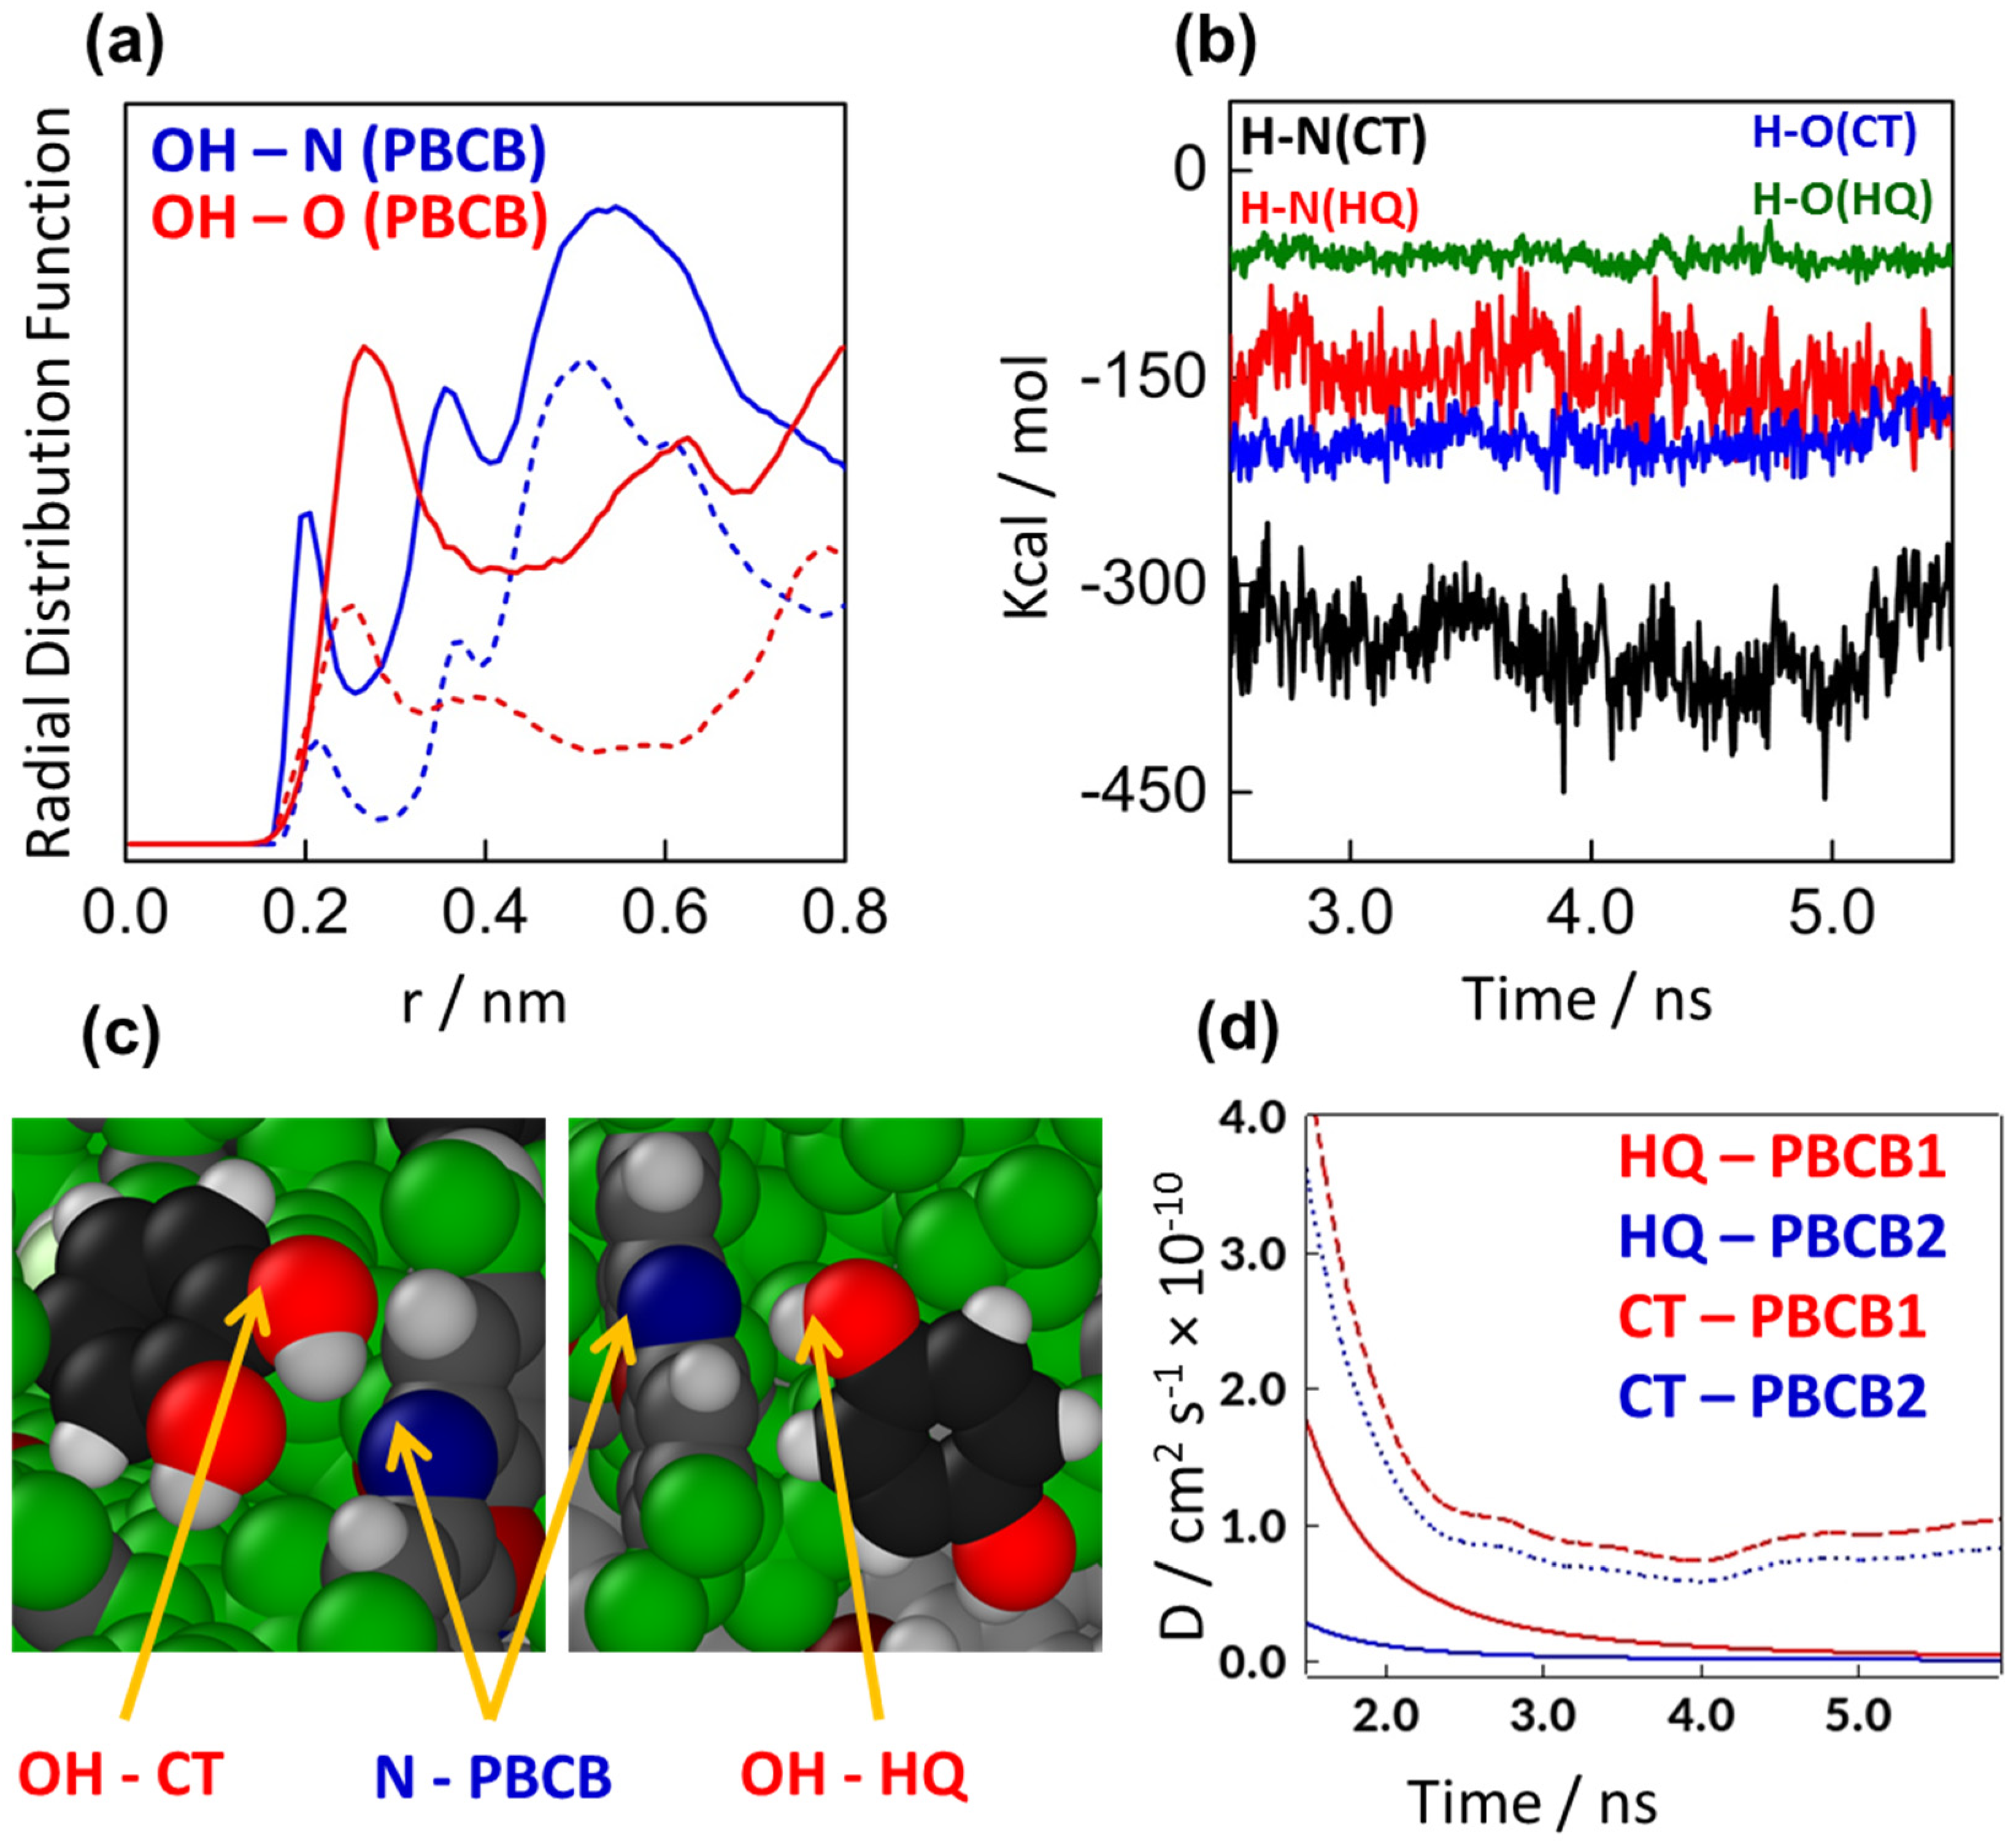
3.4. Computational Analysis through MD Simulations

MD simulation was employed to investigate the interfacial structure of HQ and CT at the vicinity of PBCB-modified activated GCE systems. Here, electrochemically activated GCE was fabricated by introducing O on the upper surface of the four layers of graphite. We included 20 and 10 O randomly on the (5 nm × 5 nm) graphite for mimicking activation conditions 1 and 2, respectively. The all-atom PBCB polymer, HQ, and CT were composed of 120, 14, and 14 atoms, respectively. The partial charge distribution of modified graphite, PBCB, HQ, and CT were calculated by using the semiempirical AM1-BBC method, which can produce a very precise charge distribution in all the compounds [29]. Molecular dynamics simulations were performed using the LAMMPS program. All of the interactions between the particles were modeled using the standard 12-6 Lenard-Jones (LJ) potential and coulombic pairwise interaction with a cut-off of 12.0 Å. The GRAFF force field, which was completed with all available parameters force field with great consistency with the AMBER force field, was used to construct the potentials of modified graphite, HQ, CT, and PBCB polymer [30]. The Lorentz–Berthelot rules were used to confirm the all-mixing LJ interaction between different types of adsorbates and adsorbents.
The functionalized graphite was positioned at the center of a 5.15 ×5.15 × 5 nm3 unit cell under a periodic boundary condition system. NPT simulations were conducted for 1 ns at 1 atm pressure and 150 K temperature to fabricate the electrode surfaces by PBCB. These fabricated surfaces represent the experimental PBCB1 (20 O on the surface) and PBCB2 (10 O on the surface) electrodes. After the complete fabrication, 60 CT or HQ molecules were randomly introduced in the simulation box with a 1 nm distance from the polymer-modified surface for an individual system. The Nose–Hoover algorithm was adopted during the simulation at 298 K temperature. In addition, 5 ns NVT simulations were employed for each system to achieve the equilibrium condition.
Adsorption number of the HQ and CT on the PBCB1 and PBCB2 surfaces, charge distribution on the activation-1 and activation-2 surfaces, and diffusion coefficient of the adsorbed PBCB polymers on PBCB1 and PBCB2 surfaces are depicted in Figure 5. As shown in Figure 5a, PBCB2 adsorbed higher amounts of HQ and CT than PBCB1. This simulation outcome had very good agreement with the experimental results illustrated in Figure 3. Both HQ and CT were adsorbed at 0.36 nm distance from both PBCB1 and PBCB2 surfaces. The higher adsorption capability of PBCB2 was a result of the high surface roughness, which is caused by the higher delocalization of the adsorbed polymers. PBCB2 (activation-2) electrode surface contains less functional group than PBCB1 (activation-1); therefore, the PBCB2 surface contains less electron density than PBCB1 (Figure 5b). This feature of less electron density provides a weak interaction toward the polymer, and therefore, more polymer delocalization occurs in PBCB2than in PBCB1. The simulated diffusion coefficient of the PBCB polymer was calculated for PBCB1 and PBCB2 (Figure 5c), ranging from 0 to 2 ns. In the beginning, polymers were not perfectly equilibrated; therefore, the diffusion values were large; however, the polymers were equilibrated at around 1.5 ns, and the line became flat for both PBCB1 and PBCB2. At all time durations, PBCB2 showed higher polymer diffusion than PBCB1, and PBCB polymers on PBCB2 had around two times higher diffusion than that on PBCB1 at equilibrium. This higher diffusion increased the surface roughness and accessibility of more HQ and CT to the active sites of PBCB2.
Figure 6a shows the simulated radial distribution of H from the OH group of HQ/CT and N and O from PBCB. The first neighboring distance for H–N was 0.21 nm and 0.20 nm for HQ and CT, respectively, while for H–O, it was 0.25 nm and 0.26 nm for HQ and CT, respectively. Therefore, it is clear that both HQ and CT preferentially interacted with the N sites of PBCB by OH groups, rather than O sites. Additionally, CT showed more pronounced scattering intensity for both H–N and H–O interaction, compared with HQ with a slightly shorter distance for H–N and longer distance for H–O. This indicates that CT had more adsorption preference than HQ by its stronger interaction with the active sites of PBCB. The interaction energy between H–N and H–N for HQ and CT were calculated from the MD simulations, as illustrated in Figure 6b. The most stable interaction was formed by the OH group of CT and N from PBCB with the average energy value of −350 ± 40 kcal/mol, while HQ showed around two times higher energy value (−180 ± 50 kcal/mol) for the same interaction. Likewise, for H–O interaction, CT showed approximately two times lower energy values (−200 ± 30 kcal/mol) than HQ (−80 ± 10 kcal/mol). The origin of this interaction energy distinction is the position of OH groups in the HQ and CT structures. Due to the ortho OH group in the structure, CT can use both OH groups to interact with the N and O sites of PBCB, while HQ can use only one OH group, as the other one is in the para position. This phenomenon can be seen clearly in the simulated snapshots illustrated in Figure 6c. The diffusion coefficients of adsorbed HQ and CT on PBCB1 and PBCB2 surfaces were calculated with a function of simulation time, as shown in Figure 6d. CT showed smaller diffusion than HQ at both surfaces. Both HQ and CT showed lower diffusion on PBCB2 than those on PBCB1. Therefore, we concluded that CT can interact more strongly with the active sites of PBCB than can HQ, which leads to a higher current response in the electrochemical sensing measurement.

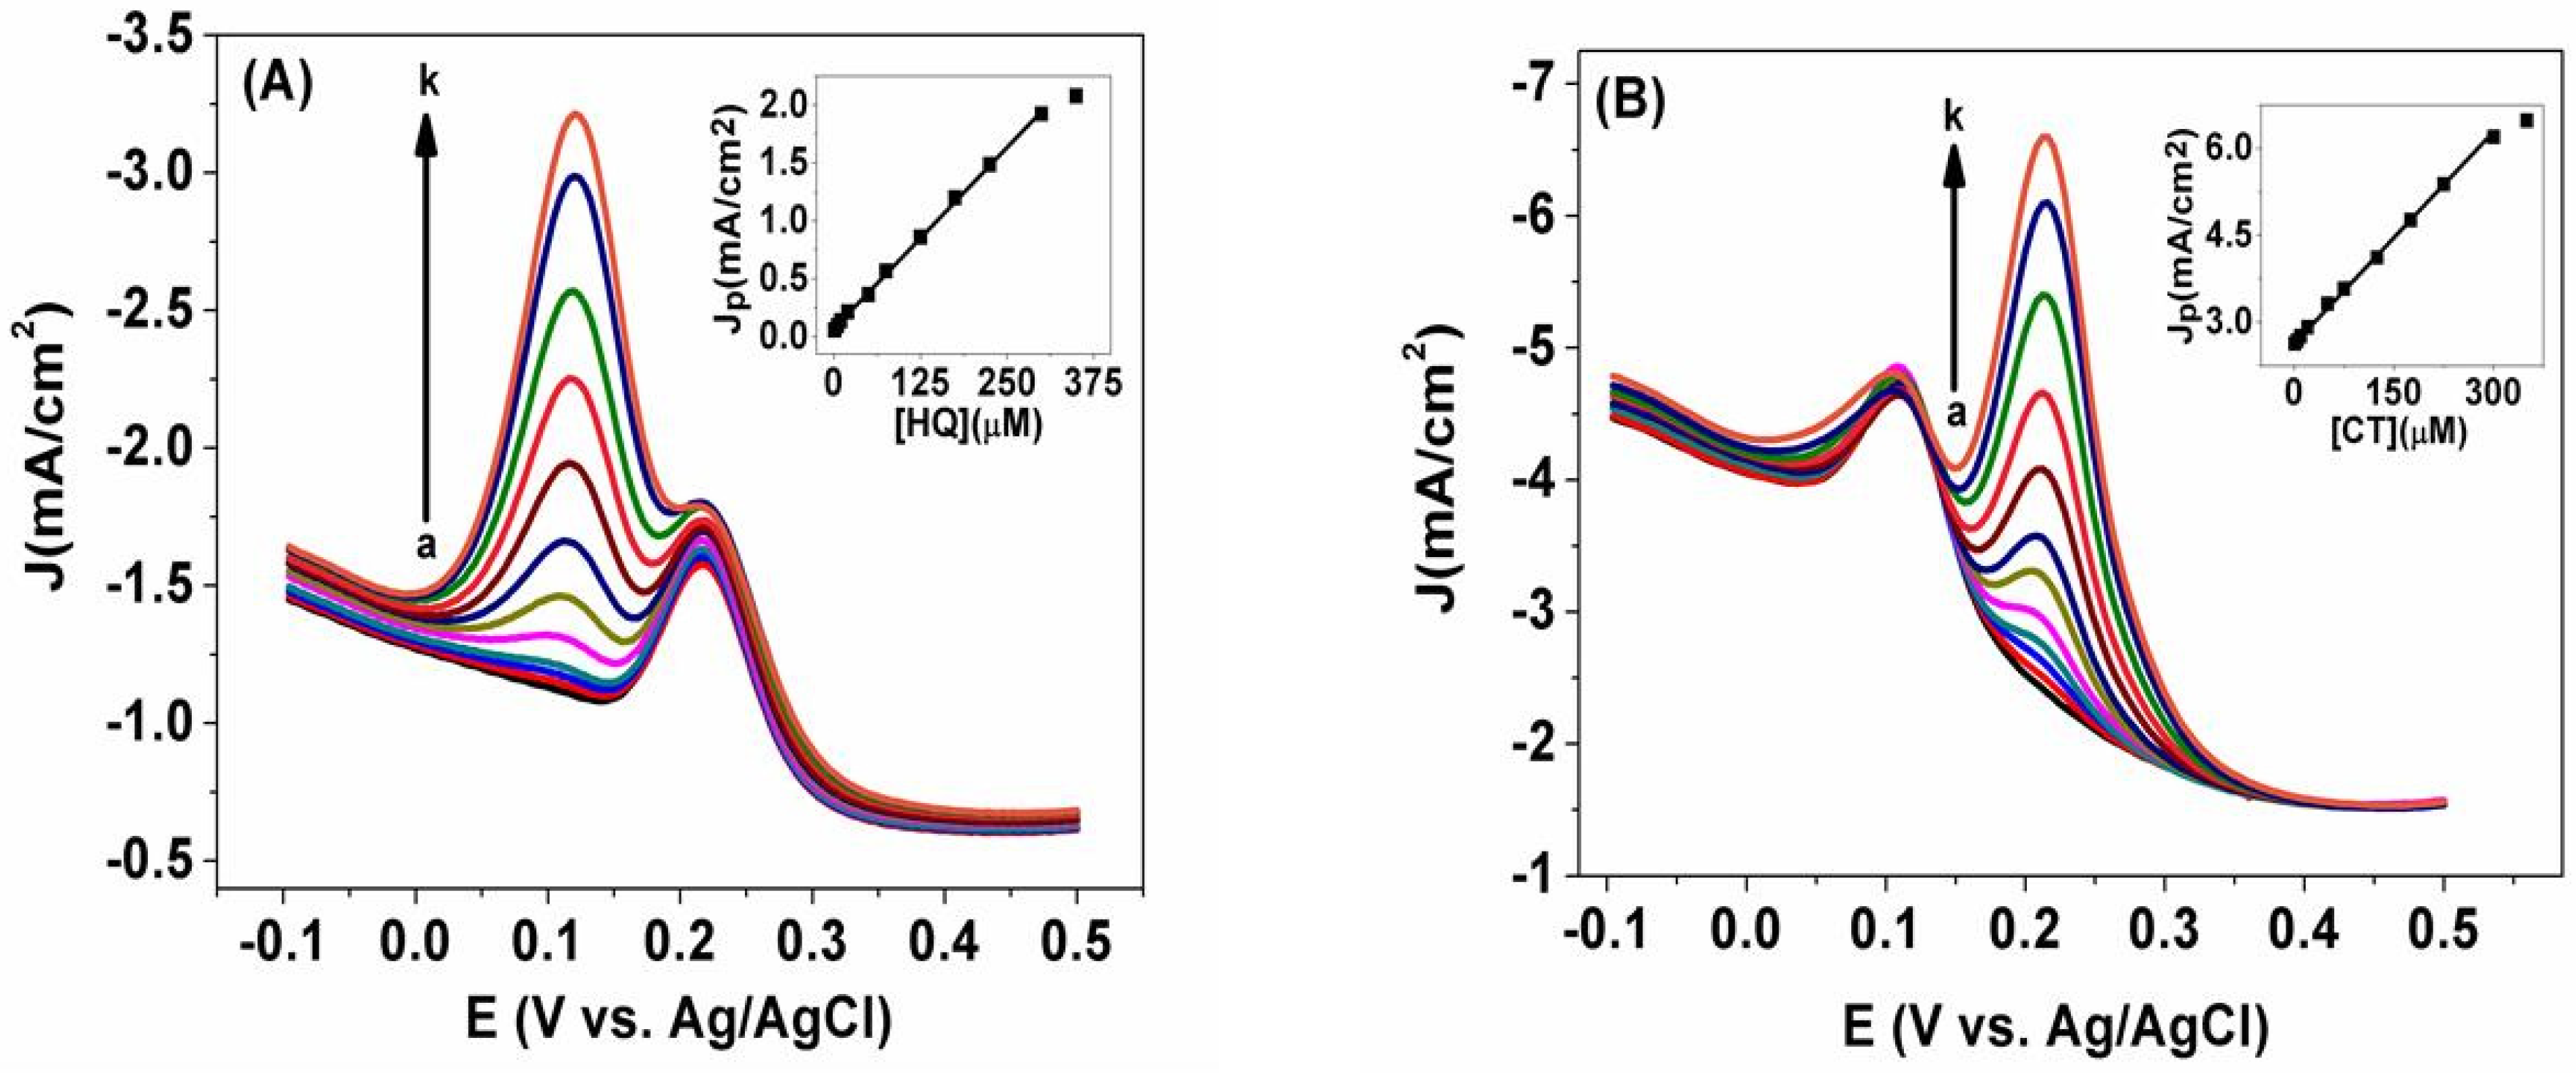
3.5. Simultaneous Determination of HQ and CT

It can be inferred from the results described in the previous section that the PBCB2 showed better performance on the electrochemical response of HQ and CT. Therefore, wechosePBCB2 as our final modified electrode for the simultaneous and quantitative determination of both the phenolic compounds. To verify the efficiency of PBCB2, the DVP technique was utilized because of their higher sensitivity by eliminating the non-faradic currents found in CV. We conducted DPV at various concentrations of HQ and CT observed in Figure 7, where one analyte concentration was kept constant relative to its counterpart (150 µM HQ and 100 µM CT). The anodic peak current of HQ evolved at the potential of 0.1 mV, linearly increased with the increasing concentration of HQ (Figure 7A). This indicated that the enhanced accumulation of HQ occurred at modified PBCB2 contributed via conspicuous larger accessible active sites on the electrode surface. In order to make the concentration of CT constant, the peak current remained almost unchanged. In comparison, Figure 7B presents similar concentration variation patterns for CT with constant HQ. The linear calibration plots of HQ and CT were constructed between concentrations and current responses from DPV records (shown in insets of both panels in Figure 7A,B, respectively). With a regression coefficient of 0.99 for both HQ and CT, the linear range of concentration was from 1 to 300 µM, and the detection limits (S/N = 3) were determined to be 0.14 µM and 0.07 µM for HQ and CT, respectively. For the simultaneous determination of HQ and CT, the linear range and detection limits of HQ and CT of this report are comparatively much lower than those indicated in previous reports [18,31,32,33,34,35,36,37]. In total, 10 successive CV measurements were studied to check the reproducibility, and from these data, the relative standard deviations (RSDs) of the electrode for oxidation peak were measured as 0.42% and 0.47% for 0.5 mM HQ and CT, respectively. These values corresponded to the indication of the highly reproducible proposed method. The stability of the modified electrode was investigated by testing initial and after 40 consecutive CV measurements and found that initial anodic peak currents of HQ and CT were reduced to 98.9% and 99.4%, respectively. Moreover, the performance of storage stability of the modified electrode was appraised by storing it in pH 7.0 PBS for two weeks at 4 °C and then used again to determine HQ and CT. The current response value retained more than 94% of its initial current response, demonstrating that the proposed sensor possessed good storage stability.

3.6. Interference Studies

Due to the similar structure of phenolic compounds such as resorcinol, phenol, and nitrophenol, possible interference could occur during the quantitative detection of HQ and CT. To explore the anti-interference performance of the proposed PBCB2 sensor, we carried out a spike/recovery test. For these, we added a certain concentration of interfering substances into the mixture of HQ and CT and observed the peak current response. The anodic peak current responses in the presence and absence of interference were calculated to evaluate the recovery of HQ and CT. It was also confirmed that, even in the presence of a similar concentration range of interfering substance, the anodic currents and potentials were not affected in the mixture of HQ and CT during the detection of them. Furthermore, we tested several common interfering substances such as NH4+, Ca2+, Mg2+, K+, Fe2+, which can interfere with the detection. The results showed that there was no significant interference, even with 10-fold excess concentrations of those interfering species. The summarized data of the interference studies are tabulated in Table 1, indicating that the proposed sensor possessed superiorelectrocatalytic selectivity and a good anti-interference ability for quantitative simultaneous determination of HQ and CT.

4. Conclusions

In summary, we controlled the sensitivity of polymer-modified electrodes by changing the activation condition of GCE. Increased sensitivity of PBCB-modified AGCE was found by changing the activation condition from one-step (oxidation only) to two-step (oxidation, followed by reduction). PBCB2 (from two-step activation) was used to construct a highly sensitive electrochemical sensor for the simultaneous determination of HQ and CT. High polymer dislocation in the PBCB2 surface was found in the MD simulations, which is responsible for the high adsorbing and sensing capability. Radial distribution function and interaction energy between H-N and H-O of HQ and CT proved that N sites of the PBCB polymer act as preferential active sites, and CT interact strongly with this site using two OH groups, while HQ can use one OH group; therefore, CT was detected from the solution with 50% lower concentration. A lower diffusion coefficient value of CT compared with that of HQ on both surfaces is a clear sign of the high sensitivity of CT over HQ. Furthermore, through a comprehensive understanding of the interfacial structure of catechol-based derivatives and the proposed sensor in the selective and simultaneous determination of HQ and CT, this study revealed that the proposed method is an effective strategy for the development of sensors and biosensors, with promising enhanced catalytic sensitivity and selectivity. We believe that this study is particular of benefit to researchers seeking to construct a highly sensitive electrochemical sensor for the detection of various target analytes.

Author Contributions

Conceptualization, S.F. and M.S.K.; investigation, F.Z.M., A.A.M. and T.A.; writing—original draft preparation, S.F. and M.S.K.; writing—review and editing, M.A.M. and M.M.R.; supervision, J.U. and A.J.S.A. All authors have read and agreed to the published version of the manuscript.

Funding

This research received no external funding.

Institutional Review Board Statement

Not applicable.

Informed Consent Statement

Not applicable.

Acknowledgments

This research was supported by the Jagannath University, Dhaka, Bangladesh.

Conflicts of Interest

The authors declare no conflict of interest.

References

  1. Ahammad, A.J.S.; Rahman, M.M.; Xu, G.R.; Kim, S.; Lee, J.J. Highly sensitive and simultaneous determination of hydroquinone and catechol at poly(thionine) modified glassy carbon electrode. Electrochim. Acta 2011, 56, 5266. [Google Scholar] [CrossRef]
  2. Ahammad, A.J.S.; Sarker, S.; Rahman, M.A.; Lee, J.J. Simultaneous determination of hydroquinone and catechol at an activated glassy carbon electrode. Electroanalysis 2010, 22, 694. [Google Scholar] [CrossRef]
  3. Li, M.; Ni, F.; Wang, Y.; Xu, S.; Zhang, D.; Chen, S.; Wang, L. Sensitive and facile determination of catechol and hydroquinone simultaneously under coexistence of resorcinol with A Zn/Al layered double hydroxide film modified glassy carbon electrode. Electroanalysis 2009, 21, 1521. [Google Scholar] [CrossRef]
  4. Wang, L.; Zhang, Y.; Du, Y.; Lu, D.; Zhang, Y.; Wang, C. Simultaneous determination of catechol and hydroquinone based on poly (diallyldimethylammonium chloride) functionalized graphene-modified glassy carbon electrode. J. Solid State Electrochem. 2012, 16, 1323. [Google Scholar] [CrossRef]
  5. Nagaraja, P.; Vasantha, R.A.; Sunitha, K.R. A new sensitive and selective spectrophotometric method for the determination of catechol derivatives and its pharmaceutical preparations. J. Pharm. Biomed. Anal. 2001, 25, 417. [Google Scholar] [CrossRef]
  6. Wang, L.H.; Kuo, Y.P. Simultaneous quantitative determination of resorcinol and 1-Naphthol in haircolor products by high-performance liquid chromatography. Chromatographia 1999, 49, 208. [Google Scholar] [CrossRef]
  7. Zhao, L.; Lv, B.; Yuan, H.; Zhou, Z.; Xiao, D. A sensitive chemiluminescence method for determination of hydroquinone and catechol. Sensors 2007, 7, 578. [Google Scholar] [CrossRef] [Green Version]
  8. Pistonesi, M.F.; Nezio, M.S.D.; Centurion, M.E.; Palomeque, M.E.; Lista, A.G.; Band, B.S.F. Determination of phenol, resorcinol and hydroquinone in air samples by synchronous fluorescence using partial least-squares (PLS). Talanta 2006, 69, 1265. [Google Scholar] [CrossRef] [PubMed]
  9. Du, H.; Ye, J.; Zhang, J.; Huang, X.; Yu, C. A voltammetric sensor based on graphene-modified electrode for simultaneous determination of catechol and hydroquinone. J. Electroanal. Chem. 2011, 650, 209. [Google Scholar] [CrossRef]
  10. Unnikrishnan, B.; Ru, P.L.; Chen, S.M. Electrochemically synthesized Pt–MnO2 composite particles for simultaneous determination of catechol and hydroquinone. Sens. Actuators B Chem. 2012, 169, 235. [Google Scholar] [CrossRef]
  11. Ahammad, A.J.S.; Nath, N.C.D.; Xu, G.R.; Kim, S.; Lee, J.J. Interference-free determination of dopamine at the poly(thionine)-modified glassy carbon electrode. J. Electrochem. Soc. 2011, 158, F106. [Google Scholar] [CrossRef]
  12. Yu, J.; Du, W.; Zhao, F.; Zeng, B. High sensitive simultaneous determination of catechol and hydroquinone at mesoporous carbon CMK-3 electrode in comparison with multi-walled carbon nanotubes and Vulcan XC-72 carbon electrodes. Electrochim. Acta 2009, 54, 984. [Google Scholar] [CrossRef]
  13. Li, D.W.; Li, Y.T.; Song, W.; Long, Y.T. Simultaneous determination of dihydroxybenzene isomers using disposable screen-printed electrode modified by multiwalled carbon nanotubes and gold nanoparticles. Anal. Methods 2010, 2, 837. [Google Scholar] [CrossRef]
  14. Umasankar, Y.; Periasamy, A.P.; Chen, S.M. Electrocatalysis and simultaneous determination of catechol and quinol by poly(malachite green) coated multiwalled carbon nanotube film. Anal. Biochem. 2011, 411, 71. [Google Scholar] [CrossRef] [PubMed]
  15. Liu, Z.; Wang, Z.; Cao, Y.; Jing, Y.; Liu, Y. High sensitive simultaneous determination of hydroquinone and catechol based on graphene/BMIMPF6 nanocomposite modified electrode. Sens. Actuators B Chem. 2011, 157, 540. [Google Scholar] [CrossRef]
  16. Huo, Z.; Zhou, Y.; Liu, Q.; He, X.; Liang, Y.; Xu, M. Sensitive simultaneous determination of catechol and hydroquinone using a gold electrode modified with carbon nanofibers and gold nanoparticles. Microchim. Acta 2011, 173, 119. [Google Scholar] [CrossRef]
  17. Yuan, Y.; Ahammad, A.J.S.; Xu, G.R.; Kim, S.; Lee, J.J. Poly(thionine) modified GC electrode for simultaneous detection of dopamine and uric Acid in the presence of ascorbic acid. Bull. Korean Chem. Soc. 2008, 29, 1883. [Google Scholar]
  18. Zhao, D.M.; Zhang, X.H.; Feng, L.J.; Jia, L.; Wang, S.F. Simultaneous determination of hydroquinone and catechol at PASA/MWNTs composite film modified glassy carbon electrode. Colloids Surf. B 2009, 74, 317. [Google Scholar] [CrossRef]
  19. Zhang, H.; Zhao, J.; Liu, H.; Liu, R.; Wang, H.; Liu, J. Electrochemical determination of diphenols and their mixtures at the multiwall carbon nanotubes/poly (3-methylthiophene) modified glassy carbon electrode. Microchim. Acta 2010, 169, 277. [Google Scholar] [CrossRef]
  20. Yang, P.; Zhu, Q.; Chen, Y.; Wang, F. Simultaneous determination of hydroquinone and catechol using poly(p-aminobenzoic acid) modified glassy carbon electrode. J.Appl. Polym. Sci. 2009, 113, 2881. [Google Scholar] [CrossRef]
  21. Zhang, Y.; Zhuang, H.; Lu, H. Electrocatalytic oxidation of hydroquinone at poly(crystal-violet) film–modified electrode and its selective determination in the presence of o-hydroquinone and m-hydroquinone. Anal. Lett. 2009, 42, 339. [Google Scholar] [CrossRef]
  22. Shaikh, A.A.; Saha, S.K.; Bakshi, P.K.; Hussain, A.; Ahammad, A.J.S. Poly(brilliant cresyl blue)-modified electrode for highly sensitive and simultaneous determination of hydroquinone and catechol. J. Electrochem. Soc. 2013, 160, B37. [Google Scholar] [CrossRef]
  23. da Silva, A.R.L.; dos Santos, A.J.; Martinez-Huitle, C.A. Electrochemical measurements and theoretical studies for understanding the behavior of catechol, resorcinol and hydroquinone on the boron doped diamond surface. RSC Adv. 2018, 8, 3483. [Google Scholar] [CrossRef] [Green Version]
  24. Faraezi, S.; Khan, M.S.; Ohba, T. Dehydration of cations inducing fast ion transfer and high electrical capacitance performance on graphene electrode in aqueous electrolytes. Ind. Eng. Chem. Res. 2020, 59, 5768. [Google Scholar] [CrossRef]
  25. Saiz-Poseu, J.; Faraudo, J.; Figueras, A.; Alibes, R.; Busque, F.; Ruiz-Molina, D. Switchable self-assembly of a bioinspired alkyl catechol at a solid/liquid interface: Competitive interfacial, noncovalent, and solvent interactions. Chem. Eur. J. 2012, 18, 3056. [Google Scholar] [CrossRef]
  26. Li, Y.; Liao, M.; Zhou, J. Catechol and its derivatives adhesion on graphene: Insights from molecular dynamics simulations. J. Phys. Chem. C 2018, 122, 22965. [Google Scholar] [CrossRef]
  27. Yeh, I.; Lenhart, J.L.; Rinderspacher, B.C. Molecular dynamics simulations of adsorption of catechol and related phenolic compounds to alumina surfaces. J. Phys. Chem. C 2015, 119, 7721. [Google Scholar] [CrossRef]
  28. Ahammad, A.J.S.; Alam, M.K.; Islam, T.; Hasan, M.M.; Karim, R.; Anju, A.N.; Mozumder, M.N.I. Poly (brilliant cresyl blue)-reduced graphene oxide modified activated GCE for nitrite detection: Analyzing the synergistic interactions through experimental and computational study. Electrochim. Acta 2020, 349, 136375. [Google Scholar] [CrossRef]
  29. Khan, S.M.; Kitayama, H.; Yamada, Y.; Gohda, S.; Ono, H.; Umeda, D.; Abe, K.; Hata, K.; Ohba, T. High CO2 sensitivity and reversibility on nitrogen-containing polymer by remarkable CO2 adsorption on nitrogen sites. J. Phys. Chem. C 2018, 122, 24143. [Google Scholar] [CrossRef]
  30. Wang, J.; Wolf, R.M.; Caldwall, J.W.; Kollman, P.A.; Case, D.A. Development and testing of a general amber force field. J. Comput. Chem. 2004, 25, 1157. [Google Scholar] [CrossRef] [PubMed]
  31. Zhang, D.; Peng, Y.; Qi, H.; Gao, Q.; Zhang, C. Application of multielectrode array modified with carbon nanotubes to simultaneous amperometric determination of dihydroxybenzene isomers. Sens. Actuators B Chem. 2009, 136, 113. [Google Scholar] [CrossRef]
  32. Ding, Y.P.; Liu, W.L.; Wu, Q.S.; Wang, X.G. Direct simultaneous determination of dihydroxybenzene isomers at C-nanotube-modified electrodes by derivative voltammetry. J. Electroanal. Chem. 2005, 575, 275. [Google Scholar] [CrossRef]
  33. Yang, P.; Wei, W.; Tao, C.; Zeng, J. Simultaneous voltammetry determination of dihydroxybenzene isomers by poly-bromophenol blue/carbon nanotubes composite modified electrode. Bull. Environ. Contam. Toxicol. 2007, 79, 5. [Google Scholar] [CrossRef]
  34. Wang, C.; Yuan, R.; Chai, Y.; Hu, F. Simultaneous determination of hydroquinone, catechol, resorcinol and nitrite using gold nanoparticles loaded on poly-3-amino-5-mercapto-1,2,4-triazole-MWNTs film modified electrode. Anal. Methods 2012, 4, 1626. [Google Scholar] [CrossRef]
  35. Hu, F.; Chen, S.; Wang, C.; Yuan, R.; Yuan, D.; Wang, C. Study on the application of reduced graphene oxide and multiwall carbon nanotubes hybrid materials for simultaneous determination of catechol, hydroquinone, p-cresol and nitrite. Anal. Chim. Acta 2012, 724, 40. [Google Scholar] [CrossRef]
  36. Deng, K.; Li, C.; Li, X.; Xu, G. Simultaneous electrochemical determination of hydroquinone and catechol at MWNTs and Cobalt(II) tetrakisphenylporphyrin modified electrode. Anal. Lett. 2012, 45, 883. [Google Scholar] [CrossRef]
  37. Yang, C.; Chai, Y.; Yuan, R.; Xu, W.; Chen, S. Gold nanoparticle–graphene nanohybrid bridged 3-amino-5-mercapto-1,2,4-triazole-functionalized multiwall carbon nanotubes for the simultaneous determination of hydroquinone, catechol, resorcinol and nitrite. Anal. Methods 2013, 5, 666. [Google Scholar] [CrossRef]
Scheme 1. Schematic representation of the modification of PBCB1 and PBCB2 for the simultaneous determination of HQ and CT.
Chemengineering 06 00027 sch001
Figure 1. CVs for the electropolymerization of BCB onto AGCE in two different activation ways: one-step activation, PBCB1 (A) and two-step activation PBCB2 (B) in 0.1 MPBS (pH 7.0).
Chemengineering 06 00027 g001
Figure 2. CVs (A) and EIS (B) spectra of 5.0 mM K3[Fe(CN)6] in 1.0 M KCl at GCE (a), PBCB1(b), and PBCB2 (c).
Chemengineering 06 00027 g002
Figure 3. CVs of 0.50 mM HQ (A) and CT (B) in PBS (pH = 7.0) at GCE (a), PBCB1(b), and PBCB2 (c).
Chemengineering 06 00027 g003
Figure 4. CVs (A) and DPVs (B) for the mixture solution of HQ (0.50 mM) and CT (0.50 mM) in PBS (pH = 7.0) at GCE (a), PBCB1 (b), and PBCB2 (c).
Chemengineering 06 00027 g004
Figure 5. (a) Simulated number distribution of the HQ (dotted line) and CT (solid line) on PBCB1 (red) and PBCB2 (blue); (b) surface charge distribution of activation-1 (red) and activation-2 (blue); (c) diffusion coefficient of PBCB polymers on the activated surface of PBCB1 (red) and PBCB2 (blue).
Chemengineering 06 00027 g005
Figure 6. (a) Simulated radial distribution function between the H of the OH group and N of PBCB (blue) and O of PBCB (red) in HQ (dotted line) and CT (solid line); (b) interaction energy between OH of HQ and N (red), O (green), and OH of CT and N (black) and O (blue); (c) simulated snapshots of CT adsorption on PBCB (right) and HQ adsorption on PBCB (left), H (white), O (red), N (blue), C of CT and HQ (black), C of PBCB (gray); (d) diffusion coefficient of HQ (dotted line) and CT (solid line) on the surface of PBCB1 (red) and PBCB2 (blue).
Chemengineering 06 00027 g006
Figure 7. DPVs for PBCB2 in solution of different concentrations (a-k: 1, 5, 10, 20, 50, 75, 125, 175, 225, 300, and 350 μM) of HQ containing 150 μMCT (A) and different concentrations (a–k: 1, 5, 10, 20, 50, 75, 125, 175, 225, 300, and 350 μM) of CT containing 150 μM HQ (B). Insets show the calibration plots of HQ and CT.
Chemengineering 06 00027 g007
Table 1. Possible interferences tested with the proposed method.
InterferencesCurrent Ratios [HQ]Current Ratios [CT]
Resorcinol1.110.98
Phenol1.020.96
2-Nitrophenol1.060.96
4-Nitrophenol1.061.09
NH4+1.040.94
Ca2+1.060.94
Mg2+1.141.03
K+1.050.96
Fe2+0.951.02
Publisher’s Note: MDPI stays neutral with regard to jurisdictional claims in published maps and institutional affiliations.

