Article

Sensitivity Analysis and Cost Estimation of a CO2 Capture Plant in Aspen HYSYS

by
Shirvan Shirdel
,
Stian Valand
,
Fatemeh Fazli
,
Bernhard Winther-Sørensen
,
Solomon Aforkoghene Aromada
,
Sumudu Karunarathne
and
Lars Erik Øi
*
Department of Process, Energy and Environmental Technology, University of South-Eastern Norway, Kjølnes Ring 56, 3918 Porsgrunn, Norway
*
Author to whom correspondence should be addressed.
ChemEngineering 2022, 6(2), 28; https://doi.org/10.3390/chemengineering6020028
Submission received: 20 February 2022 / Revised: 2 April 2022 / Accepted: 6 April 2022 / Published: 11 April 2022
(This article belongs to the Topic Chemical and Biochemical Processes for Energy Sources)

Abstract

:
A standard CO2 capture process is implemented in Aspen HYSYS, simulated, and evaluated based on available data from Fortum’s waste burning facility at Klemetsrud in Norway. Since amine-based CO2 removal has high costs, the main aim is cost-optimizing. A simplified carbon-capture unit with a 20-m absorber packing height, 90% CO2 removal efficiency, and a minimum approach temperature for the lean/rich amine heat exchanger (ΔTmin) of 10 °C was considered the base case simulation model. A sensitivity analysis was performed to optimize these parameters. For the base case study, CO2 captured cost was calculated as 37.5 EUR/t. When the sensitivity analysis changes the size, the Power Law method adjusts the equipment cost. A comparison of the Enhanced Detailed Factor (EDF) and the Power Law approach was performed for all simulations to evaluate the uncertainties in the findings from the Power Law method. The optimums calculated for ΔTmin and CO2 capture rate were 15 °C and 87% for both methods, with CO2 removal costs of 37 EUR/t CO2 and 36.7 EUR/t CO2, respectively. With 19 m of packing height to absorber, the minimum CO2 capture cost was calculated as 37.3 EUR/t and 37.1 EUR/t for the EDF and Power Law methods, respectively. Since there was a difference between the Power Law method and the EDF method, a size factor exponent derivation was performed. The derivation resulted in the following exponents: for the lean heat exchanger 0.74, for the lean/rich heat exchanger 1.03, for the condenser 0.68, for the reboiler 0.92, for the pump 0.88, and for the fan 0.23.

Graphical Abstract

1. Introduction

A significant amount of human-made CO2 emissions has its origin in combustion processes such as the burning of coal, oil and gas [1]. CO2 capture utilization and storage (CCUS) has been suggested to cope with such emissions as a possible solution. The term CCUS describes a process that involves the capture of CO2 from extensive facilities that are burning fossil- or biomass fuel. The captured CO2 can be used at the facility or compressed and stored in permanent storage locations. Such locations for storage can, for instance, be depleted oil and gas reservoirs. Approximately 230 Mt of CO2 is utilized globally each year, largely for fertilizer production (roughly 125 Mt/year) and improved oil recovery (around 70–80 Mt/year). Food and beverage manufacturing, cooling, water treatment, and greenhouses are some of the other commercial uses of CO2. Today, 20% of the global CO2 emissions are emitted from heavy industries, and the world’s carbon-capture facilities can capture more than 40 Mt of CO2 [2]. This amount of captured CO2 is expected to double because the interest in CO2 capture is growing. More facilities for CO2 capture are being built, and the technology is recognized as a significant contributor to reducing CO2 emissions [2].
The drawback of CO2 capture is that it is assimilated with enormous capital costs (CAPEX) and an energy-demanding process that results in prohibitive operational expenses (OPEX) [3]. Therefore, further work on reducing costs is of great importance.

1.1. Literature Review

Post-combustion CO2 capture is the most industry-established capture method found in fossil fuel power plants and, to some extent, in the cement, steel, and iron industries [4]. Regarding a study by Patel et al. [5], CO2 capture is the most expensive part of the overall carbon-capture and storage (CCS) operation, accounting for about 70% of the total cost [5]. A lot of work has been done on the simulation and cost optimization of CO2 capture. The work in this study is a continuation of previous projects at the University of South-Eastern Norway on CO2 capture simulation and cost estimation using Aspen HYSYS. Therefore, it is interesting to investigate which variables affect the plant cost.
According to Kallevik [6], the cost of a plant is mostly influenced by five factors. The first is the exhaust gas flow that goes into the absorption column. This affects the dimensions of the process equipment in the gas path, which is a large part of the total equipment. The second is the CO2 content in the flue gas. A high concentration lowers the energy consumption due to a higher driving force. Third, an increase in CO2 removal rate increases energy consumption. Fourth, the flow rate of the solvent determines the size of the equipment and the utility need. Fifth is the energy requirement of hot utility and electricity. A hot utility is required as the desorption is endothermic, and it needs heat to reverse the CO2 absorption. The thermal energy need will increase with a high solvent flow rate. The electricity demand is mainly due to the flue gas transport through the process and will grow with the pressure requirement and volume flow.
Lars Erik Øi [7] used Aspen HYSYS to simulate a basic combined cycle gas power plant and a monoethanolamine (MEA)-based CO2 removal process. The CO2 removal (%) and energy consumption in the CO2 removal plant were calculated as a function of amine circulation rate, absorption column height, absorption temperature, and steam temperature. The focus has been on MEA-based absorption and desorption calculation techniques for CO2 collection of atmospheric exhaust gas of a gas-based power plant in Aspen HYSYS. Total CO2 removal quality and heat consumption have been calculated as a function of circulation rate, absorber temperature, and other variables. One of the project’s objectives was to determine the process’ cost optimum parameters [7].
Rubin et al. [8] advocated using a uniform set of items to include in a cost estimate, a standard nomenclature to characterize each cost element, and a consistent technique of aggregating intermediate cost elements to arrive at a project’s total capital and operational costs. To increase the clarity and uniformity of cost estimates for greenhouse gas mitigation methods, they propose a standard costing approach as well as standards for CCS cost reporting [8]. Van Der Spek et al. [9] studied the recent advances in CCS engineering and economic analysis in 2019. They evaluated equipment design and size, cost indices and location factors, process and project contingency costs, CO2 transportation and storage costs, and uncertainty analysis and validation.
Xiaobo Luo, in his PhD thesis [10], provided modelling, simulation, and optimization research on the best design and operation of an MEA-based post-combustion carbon-capture (PCC) process and integrated system with a natural gas combined cycle (NGCC) power plant, with the goal of lowering the cost of PCC commercial deployment for NGCC power plants. He created a cost model, using vendor-provided key equipment costs from a benchmark report that included a comprehensive technical design [10].
In another study, Øi et al. [11] simulated several absorption and desorption configurations for 85 per cent amine-based CO2 removal from a natural gas-fired power plant. Simulated processes include a standard procedure, split-stream, vapor recompression, and various combinations thereof. Equipment dimensioning, cost estimates, and process optimization have all been carried out via the simulations. A basic vapor recompression case was determined to be the most cost-effective arrangement of the analyzed cases [11].
Aromada and Øi indicate in their research [3] that both vapor recompression and vapor recompression paired with split-stream operations can minimize energy usage. Among the combinations studied, the vapor recompression technique was shown to be the most energy efficient. In addition, for the CO2 capture parameters, which are based on a natural gas-based power plant project in Mongstad, Norway, energy optimization and economic analysis were undertaken [3].
Regarding the other methods of CO2 removal, Roussanaly et al. [12] present a new systematic method for designing and optimizing CO2 capture membrane systems that integrates both technological and economic principles. This approach generates graphical separation issue solutions in order to construct a cost-optimal membrane system that meets CO2 capture ratio and purity standards. The technique is demonstrated through the design of a post-combustion CO2 capture membrane system placed on an Advanced Super Critical (ASC) power station and compared to a MEA capture unit. Finally, a comparison is made between the cost model used and models found in the literature to show that the competitiveness of the membrane system described in this research is attributable to superior design rather than an underestimating of the membrane capture cost [12].
CO2 capture science and technology based on adsorbents are discussed and reviewed in terms of chemistry and methodology by Patel et al. [5]. Six criteria are anticipated to be satisfied in a successful sorbent design: cost, capacity, selectivity, stability, recyclability, and fast kinetics [5].
To cost-optimize the plant, this study wishes to conduct a sensitivity analysis on the effect of the overall cost when process parameters are changed. The typical choices of process parameters are according to Øi [7]: the gas temperature into the absorber, the pressure into the absorber, the minimum temperature difference in the lean/rich heat exchanger, the reboiler temperature, the condenser temperature or the reflux ratio, the solvent circulation rate, the pressure in the desorber, and efficiency of the CO2 removal rate of the process. The process parameters investigated are the efficiency of the absorber, the minimum temperature in the lean/rich heat exchanger, and the absorber packing height.
For efficiency, similar studies were conducted by Øi et al., [13], Kallevik [6], and Ali [14]. They all ended up with an optimum cleaning efficiency equal to 85%. Ali found an optimum efficiency of 87%.
For the minimum temperature (ΔTmin) in the lean/rich heat exchanger, Aromada et al. [15] calculated 15 °C as the optimum. However, Kallevik [6] and Øi et al. [13] found ΔTmin = 13 °C as the optimum. It is worth noticing that in Øi et al. [13], depending on the parameters, the optimal temperature difference in the primary heat exchanger was determined to be 10–15 °C, which also agrees with the result of Aromada et al. [15].
For the absorber packing height, Kallevik [6] performed a sensitivity analysis with 90% cleaning efficiency, with a flue gas inlet 3.7 mole% CO2 and an optimum absorber packing height of 19 m. Additionally, Øi et al. [13] studied a 90% cleaning efficiency with a CO2-content of 17.8 mole%. They ended up with an optimum packing height of 12 m.

1.2. Scope of the Study

This paper will investigate an amine absorption process based on available emission data from Fortum’s FEED report [16]. There are no simulated and cost-estimated scenarios on CO2 capture from waste incineration facilities reported. Fortum’s waste-burning facility at Klemetsrud in Norway has started a carbon-capture pilot project based on amine absorption of CO2. According to Fortum’s FEED report from 2019, the carbon-capture process targets removal efficiency of 95% of the CO2 emissions [16]. A base case is established in Aspen HYSYS based on Fortum’s data, and then a dimensioning and cost estimation is performed. A sensitivity analysis executes cost optimization to minimize and reduce costs. A series of case studies conducts the technique to investigate the changes in price affected by the different variables. In this study, the variables manipulated are the absorber packing height, the CO2 capture efficiency, and the lean/rich heat exchanger minimum temperature difference.
Further, the Power Law method is utilized to adjust the equipment cost when the sensitivity analysis changes the size. However, this way of calculating the equipment cost can be considered a “shortcut” as it is a time-saving process. To investigate the uncertainties in the results from the Power Law method, a comparison between the Enhanced Detailed Factor (EDF) using Aspen In-Plant Cost estimator and the Power Law method has been accomplished.
Lastly, to improve the usage of the Power Law method, a derivation of the individual size factor exponent for all the equipment—except the absorber and desorber—was executed. The derivation is a technique to find a unique exponent factor for each piece of equipment.
In this study, data from Fortum’s waste burning facility at Klemetsrud in Norway has been used. There are no simulated and cost-estimated scenarios on CO2 capture from waste incineration facilities reported in the open literature. Additionally, for all cases in the sensitivity analysis, a comparison between the Enhanced Detailed Factor (EDF) using Aspen In-Plant Cost estimator and the Power Law method has been accomplished to investigate the uncertainties in the results from the Power Law approach. In most literature, just the Power Law method has been utilized to adjust the equipment cost when the sensitivity analysis changes the size. Further, to improve the usage of the Power Law method, a derivation of the individual size factor exponent for all the equipment—except the absorber and desorber—was executed.

2. Materials and Methods

In this study, Aspen HYSYS version 12 was used to create a standard amine-based CO2 capture process, and the simulated results were the foundation for equipment dimensioning and cost estimation with the same calculation approach as in literature [15,17]. The fluid package of the acid gas property package, including vapor and liquid equilibrium models for electrolytes, was used in all simulations. This package replaced the Amine property package, which has been commonly used in literature. Constant Murphree efficiencies were specified in the absorber and desorber.

2.1. Process Description and Available Parameters

Waste coming from households is solely responsible for 5% of global greenhouse emissions. A waste burning facility can convert waste to energy during an incineration process. One of the vital roles of a waste burning facility is to treat and burn trash that is not recyclable. CO2 removal is expected to significantly reduce emissions in a waste burning facility. The waste treatment produces emissions, and carbon capture is a possible solution [16].
To establish the base case for our simulations, the values for summer H2O in Fortum’s CO2 capture plant [16], which gives an average H2O content of 16.3%, and then will be made saturated at 40 °C, have been used in the simulations. Since the flue gas pressure ranges from 0.95–1.05 bar(a), an average inlet pressure of 101 kPa is considered in the cases. The amine used in Fortum’s CO2 capture plant is Cansolv DC- 103 mixed with 50% water. The Cansolv solution is made by Shell, and its specifications are not available to the public [16]. Instead, MEA has been used as the amine in the solvent for this project.
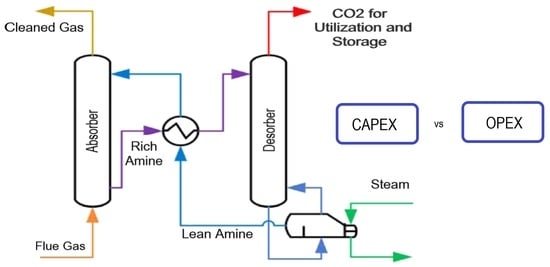
The conventional amine-based CO2 absorption–desorption mechanism is depicted in Figure 1. A primary absorber and desorber (stripper) with a reboiler and condenser, lean/rich amine heat exchanger, pumps, and a cooler make up the system. An amine solvent absorbs CO2 from the exhaust gas (e.g., monoethanolamine-MEA) in the absorption column. After being heated in the lean/rich amine heat exchanger, the CO2-rich amine solution from the absorption column is injected into the stripper for regeneration. The regenerated (lean) amine is returned to the absorption column to be reused. It initially passes through the lean/rich amine heat exchanger to heat up the rich stream before being cooled in the amine cooler [3].

2.2. Specifications and Simulation

The specifications in Table 1 correspond to a 90 per cent CO2 removal efficiency and a minimum approach temperature of 10 °C in the lean/rich heat exchanger, which is considered the base case configuration.
The calculation method used is similar to previous works [3,13,15]. The absorption and desorption columns have been modelled as equilibrium stages with stage efficiencies. The absorber is modelled with 20 packing steps, but the desorber has just eight packing stages. For both columns, equilibrium stages of 1 m height are considered. For the absorption column, Murphree efficiencies of 15% were used. For all stages of the desorption column, a constant Murphree efficiency of 50% was given. The Modified HYSIM Inside-Out method was chosen in the columns since it aids in convergence. The pump and flue gas fan were specified to have an adiabatic efficiency of 75% [3,13,15].
An alternative to the equilibrium-based simulation approach is a column calculation based on the number and height of transfer units (NTU/HTU) or a rate-based approach [17]. A limitation of the alternative calculations is unknown parameters such as mass transfer and heat transfer numbers. The Murphree efficiency values in the equilibrium-based simulations can be based both on estimation from physical properties and on empirical values [7,17]. Another advantage with equilibrium-based simulations compared to rate-based simulations available in, e.g., Aspen Plus, is that they converge more easily [17].
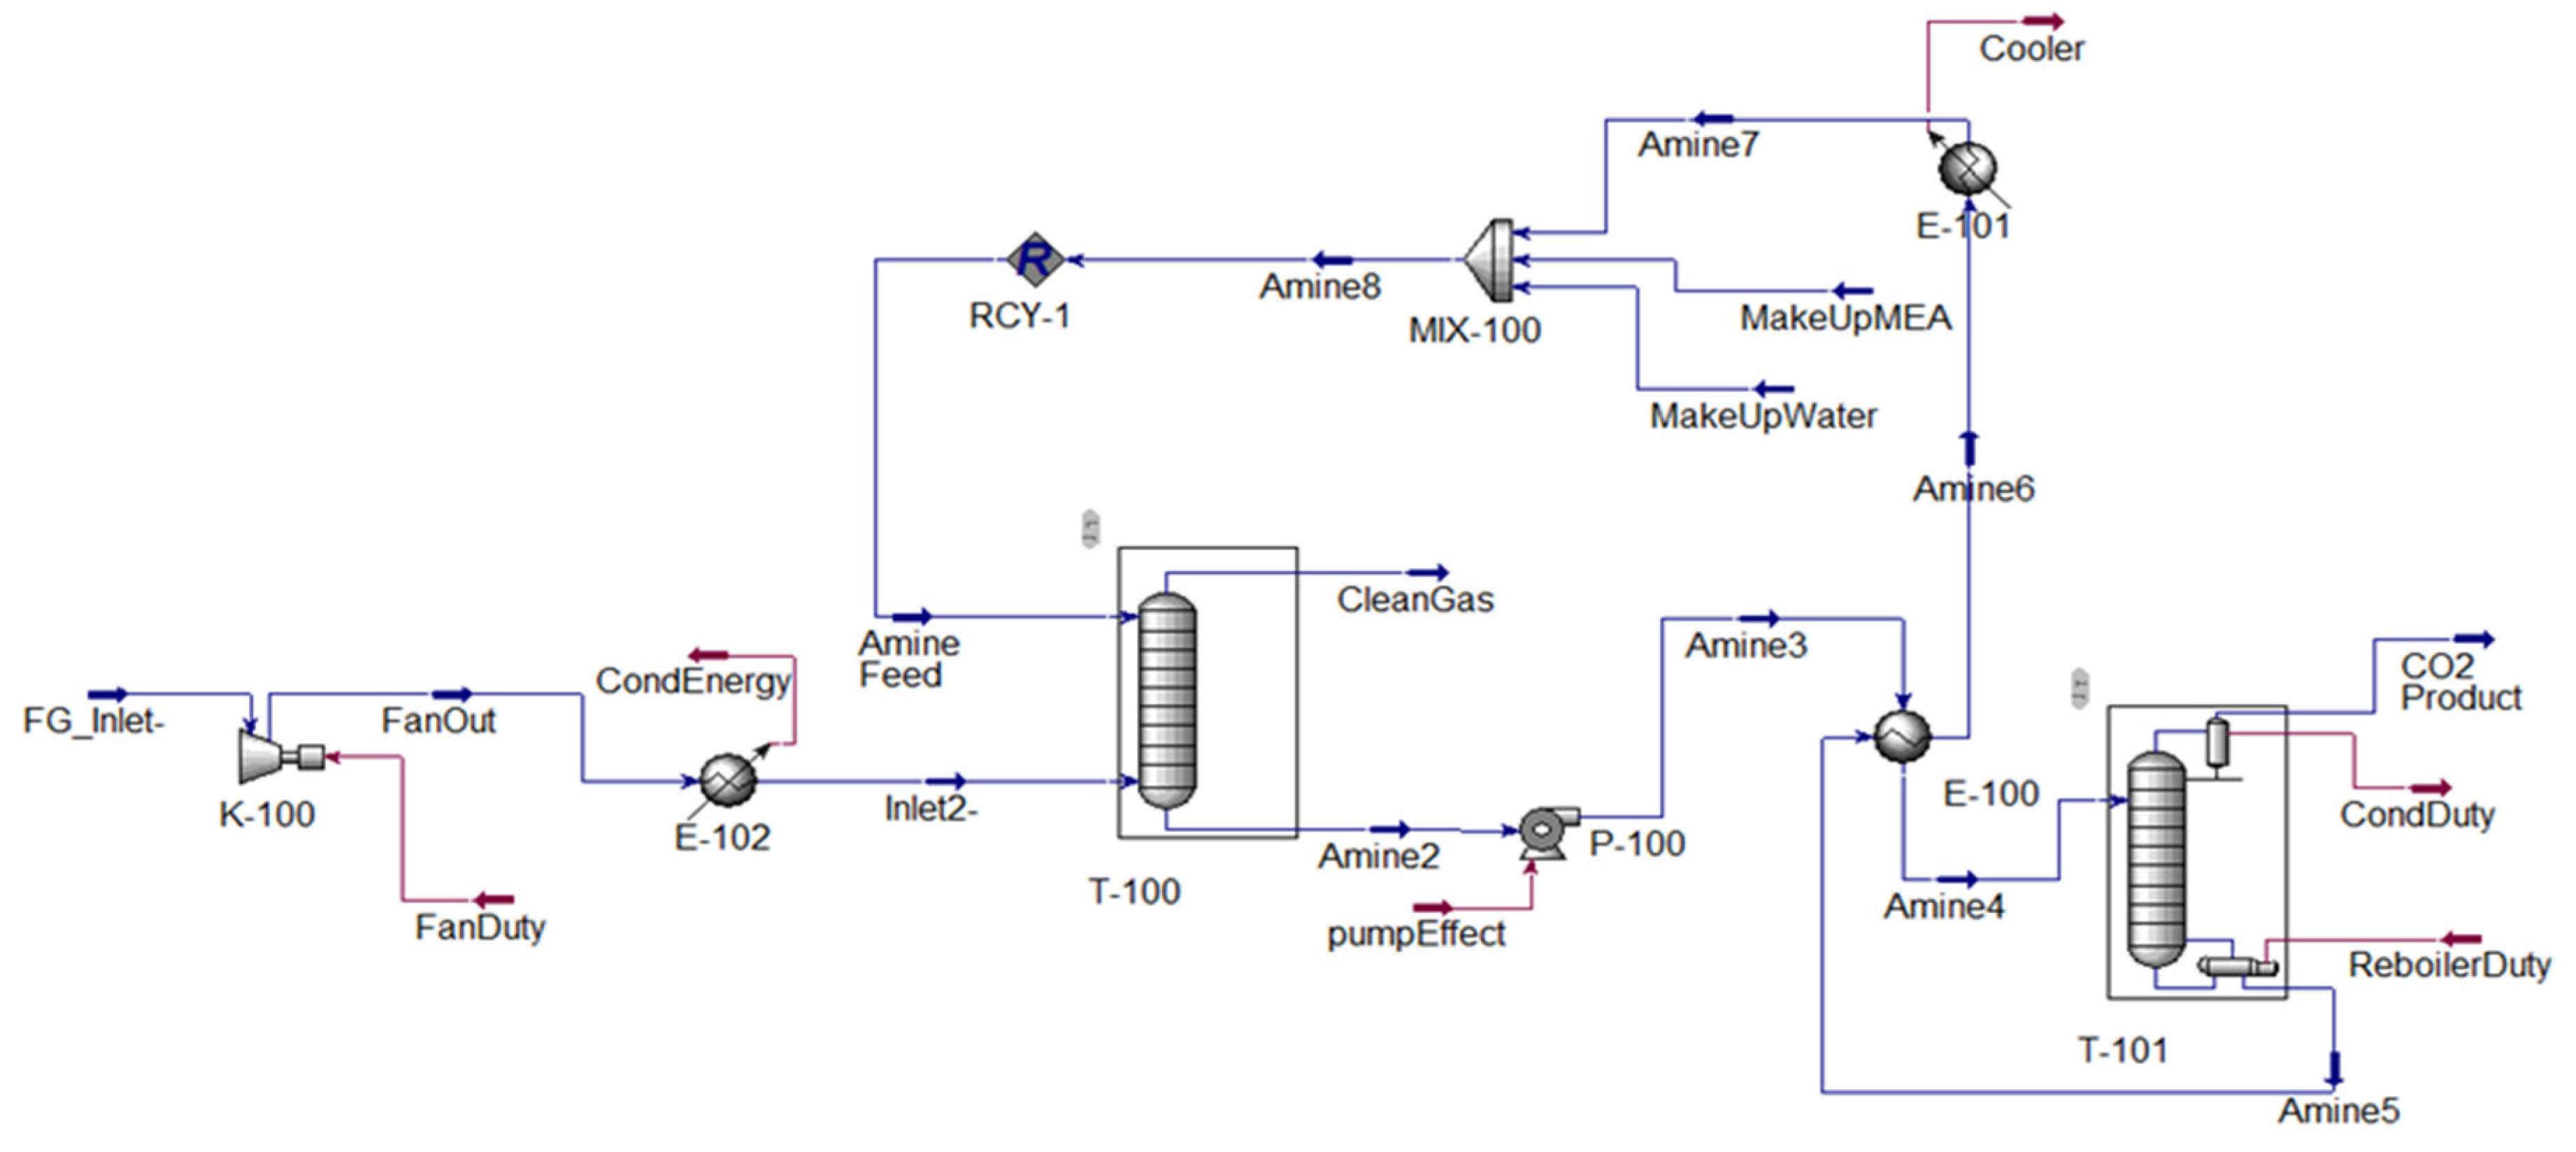
Figure 2 shows the Aspen HYSYS simulation process flow diagram (PFD). Aspen HYSYS is an equation-based simulation program, meaning it can compute in-streams from out-streams. This study, on the other hand, uses a sequential calculating technique. To solve the flowsheet in Aspen HYSYS, one needs to include recycle blocks. This block compares the block’s in-stream to the block’s out-stream in the previous iteration [13].
A fan and a cooler in the process flow have been considered to adjust the inlet stream temperature and pressure into the absorber column. The fan will increase the pressure from 101 kPa to 111 kPa, which is assumed as sufficient and used in previous work such as by Øi [7]. The temperature of the flue gas will increase due to the pressure increase. This temperature increase is handled with a cooler before the absorber to obtain 40 °C at the absorber inlet. The cooler before the absorber will not be a part of further discussion as it is assumed that it will not significantly impact the cost estimates.

3. Dimensioning and Cost Estimation

A simplified dimensioning of the process equipment has been done. The calculations are based on the process flowsheet from Aspen HYSYS with equations of states, and energy and material balances.

3.1. Scope of Analysis

Except for the flue gas cooler, the cost analysis is confined to the equipment specified in the flowsheet in Figure 2. Pretreatment and especially the removal of SOx and NOx will probably be necessary. A possible process is given in Iliuta and Larachi [18]. There is no pre-treatment, such as inlet gas purification or cooling, and no post-treatment, such as compression, transport, or storage of CO2 in this study. The cost estimate is only for the cost of the specified equipment installed. It excludes expenses such as land acquisition, preparation, service buildings, and ownership costs.

3.2. Dimensioning of Equipment

For the absorber and desorber cost estimation, the volume of packing and shell is used as the dimensioning factors. The most expensive component of a column is the packing, and in this study, structured packing is chosen because of its high efficiency, high capacity, and low-pressure drop [7]. A constant stage (Murphree) efficiency equivalent to 1 m of packing was assumed to calculate the packing height. Table 1 specifies Murphree efficiencies of 0.15 and 0.5 for the absorber and desorber, respectively. The absorption and desorption columns’ total heights are estimated to be 40 and 20 m, respectively. The packing, liquid distributors, water wash, demister, gas inflow and outflow, and sump are all factored into the absorber height calculation. The condenser inlet, packing, liquid distributor, gas inlet, and sump are all factored into the desorber height calculation [13,19]. The absorption column diameter was determined using a gas velocity of 2.5 m/s, whereas the desorption column was computed using 1 m/s [19].
Based on the duties and temperature conditions extracted from the simulations and an ideal countercurrent flow assumption, the heat transfer areas of the heat exchangers are estimated. The heat transfer coefficients are assumed to be 500 W/(m2·K) for the lean/rich heat exchanger, 800 W/(m2·K) for the lean amine cooler, 800 W/(m2·K) for the reboiler, and 1000 W/(m2·K) for the condenser [19]. This research assumes standard shell and tube heat exchangers.
For the pump and fan, the duty is used as the dimensioning parameter; however, the mass flow is also used in the Aspen In-Plant cost estimator. The fan and pumps are designed with an adiabatic efficiency of 75% in Aspen HYSYS.

3.3. Capital Cost Estimation

In this study, the capital cost (CAPEX) estimation is done by the Enhanced Detailed Factor (EDF) method. This approach is based on installation factors for each item of process equipment. According to Ali et al. [14], there are numerous advantages of using the EDF method. This method performs well and gives an accurate estimate in the early-stage cost estimate.
The cost for each piece of equipment was calculated with the use of the Aspen In-Plant Cost-estimator (v.12) software, which gives the price in Euro (€) for the year 2019 (1st Quarter), and the default location is Rotterdam in Netherland. The exact location of Rotterdam is assumed in this evaluation. To calculate the cost for each piece of equipment, an installation factor sheet made by Nils Henrik Eldrup is used [15]. This sheet includes all the installation factors for the equipment, and it requires that the equipment cost is calculated in carbon steel (CS). Each equipment component will have a total installation factor, which is the sum of all sub-factors (direct costs, engineering, administration, commissioning, and contingency).
Except for the flue gas fan, which is built of carbon steel, all equipment is supposed to be made of stainless steel (SS316). For welded and rotating equipment, the material factors to convert costs in SS316 to CS are 1.75 and 1.30, respectively.
The installed cost factors were estimated by using the values reported in the detailed factor table [15] for the year 2020. This implies that the equipment cost must first be converted to cost data for 2020. Then, the EDF method will be applied for finding the total installed cost. Finally, the total installed price must be adjusted for inflation from 2020 to 2021. The cost-inflation index that has been used is tabulated in Table 2 [20]. The currency will be converted to Norwegian kroner (NOK) with the factor of 9.8, which is taken from early October 2021 from Norges Bank [21].

3.4. Operating Cost Estimation

The operational and maintenance cost (OPEX) contributes to a significant part of the total costs. It is common practice to divide OPEX into fixed and variable costs. The fixed costs are maintenance costs and operating labor costs. The maintenance costs are usually assumed as a percentage of the equipment installation cost (EIC) in the range of 2% to 6%, which in this study considered 3%. The operating labor costs depend on the number of workers and the operating hours throughout the year. Variable costs are mainly utility costs such as raw materials, electricity, cooling water, steam, solvents, and other consumables. The yearly cost of the mentioned utilities must be calculated [14]. In Table 3, the OPEX assumptions and specifications are presented [15].

4. Methods for Optimization

For the economic evaluation, a sensitivity analysis of our configuration is conducted. A series of case studies are performed to investigate the effect of the different variables on the cost. The variables are the packing height, absorber efficiency, and lean/rich heat exchanger minimum temperature difference. To compare the various project alternatives and arrive at the optimum solution, it is necessary to compute the yearly CO2 capturing cost for each alternative, where this amount is estimated from Equation (1) [14,15].
Annual capturing cost of CO2 = (Total annual cost)/(Mass of captured CO2)
Total annual cost = Annualized CAPEX + Annualized OPEX
To calculate the annualized CAPEX, the operational lifetime and the interest rate needs to be known.
Annualized CAPEX (euro/year) = CAPEX/(Annualized factor)
Annualized   factor = i = 1 n [ 1 ( 1 + r ) n ]
where n is the operative lifetime (for one year construction) and r is the interest rate.
The equipment’s size will differ when parameters are changed in order to perform a sensitivity analysis on the base case. A comparison between the EDF method and the cost-to-capacity method, also known as the Power Law, will be applied to the equipment. The idea of the Power Law is that the change in equipment’s size or performance is not necessarily linear to the costs but that cost is a function of capacity raised to an exponential factor. This can be expressed by Equation (5) [22].
(Cost of B)/(Cost of A) = ((Capacity of B)/(Capacity of A))e
where e is an exponential size factor that typically varies in the order of magnitude from 0.35 to 1.70 depending on the type of equipment [23]; for this study, it is assumed that the exponential factor is 1.0 for the absorber and desorber column, and for the rest of the equipment, it is considered as a factor of 0.65.

4.1. Absorber Packing Height

For this case study, the stages have been adjusted from 18 to 24 stages to find the lowest CO2 captured cost (NOK/kg CO2). It is assumed that the pressure drop in the absorber is a function of the number of stages and correlated with a factor of 1 kPa per stage. This will also affect the needed pressure increase from the fan. This is the same approach used by Kallevik; however, he used 0.94 kPa per stage [6]. The absorber efficiency, the lean/rich heat exchanger minimum temperature difference, and lean amine composition have been kept constant through the case study. However, to keep them constant, the lean amine feed and the inlet temperature of the desorber had to be adjusted.

4.2. Removal Efficiency

To explore economic performance while modifying the overall removal efficiency, a case study was conducted. First, the CO2 captured cost (NOK/kg CO2) was evaluated for two different efficiency cases (85% and 95%) as well as the base case (90%). Then, to find a more accurate case, by changing the lean amine flow rate, efficiency was adjusted from 82% to 89%, and for each case, the CO2 captured cost was calculated. Here, the number of stages in absorber and desorber, the composition of recycling amine solvent, and the minimum temperature approach in the lean/rich heat exchanger remained the same as the base case.

4.3. The Lean/Rich Heat Exchanger Minimum Temperature Approach

Another case study was conducted to look into the economic performance of the lean/rich heat exchanger when the degree of heat recovery was changed. In the minimum approach temperature, CO2 captured cost was calculated for four cases (ΔTmin = 5.5 °C, ΔTmin = 7.5 °C, ΔTmin = 12.5 °C, and ΔTmin = 15 °C) as well as the base case (ΔTmin = 10 °C). According to the result obtained from these cases, the study was expanded on extra cases from 11 °C to 17 °C. Assuming the constant temperature for the reboiler outlet is equal to 120 °C and changing the temperature of the outlet-rich amine from the lean/reach heat exchanger, the ΔTmin was adjusted for each case. For a particular total CO2 removal efficiency, all flue gas and absorption column parameters were kept constant throughout the investigation, and the same was done for the rate and composition of lean amine flow.

4.4. Approach to Size Factor’s Exponent Derivation

The methodology for deriving an exponent factor assumes a non-linear relationship between the size and the equipment cost—cost is a function of size raised to an exponent. However, a linear relationship appears by applying the natural logarithm to the size and the price. Therefore, the individual exponent can be derived by taking the natural logarithm of a data set of size and cost, making a data plot of the results, and then performing a linear regression from the data plot. The slope of the line represents the exponent, and the R-squared indicates how close the linear regression is to matching the data set [22]. To derive the individual equipment exponent factors, two sets of data from the Aspen In-Plant Cost Estimator was used. The first data set is from the “the absorber packing height”-variation, and the second is from “the CO2-efficiency and the ΔTmin”-variations.

5. Results and Discussion

5.1. Base Case Evaluation

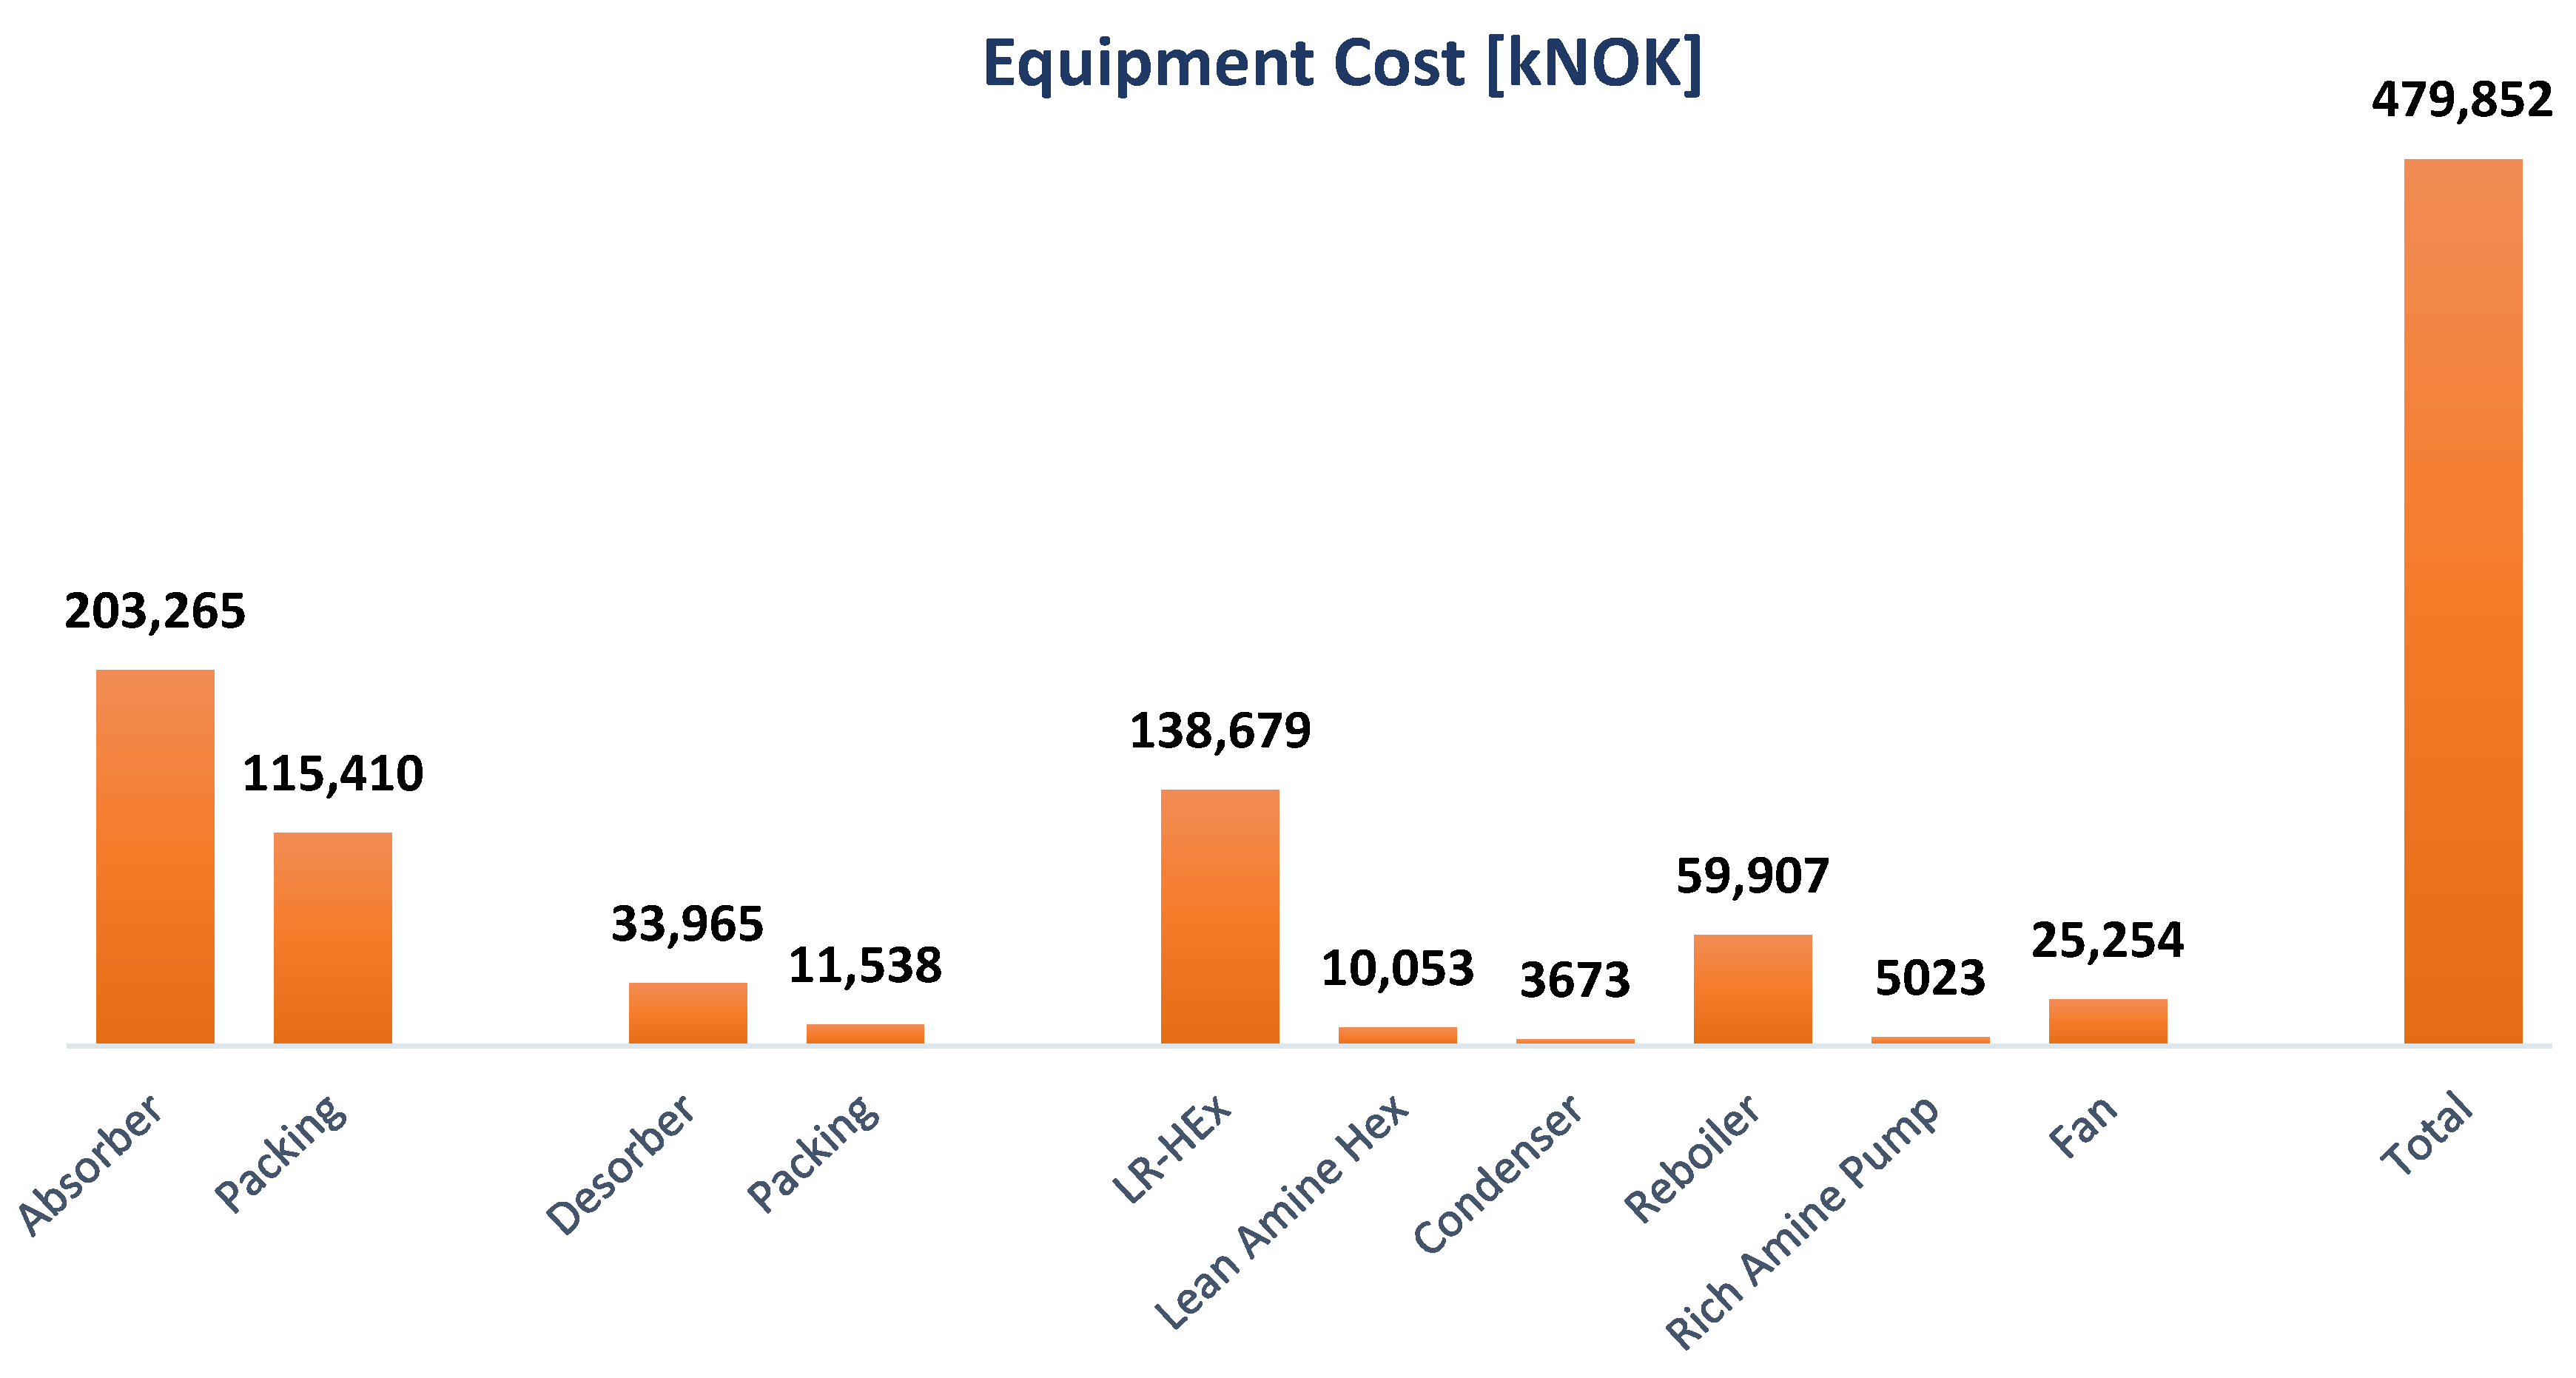
Figure 3 illustrates the equipment cost in the CO2 capture plant for the base case study. Total equipment cost is about 480 MNOK, and it is evident that the absorber is the most expensive equipment, with more than 40% of the total cost. It is worth mentioning that about 57% of the absorber’s cost is the packing cost. The lean/rich heat exchanger and reboiler are the other expensive types of equipment, contributing 29% and 13% of the total cost, respectively.
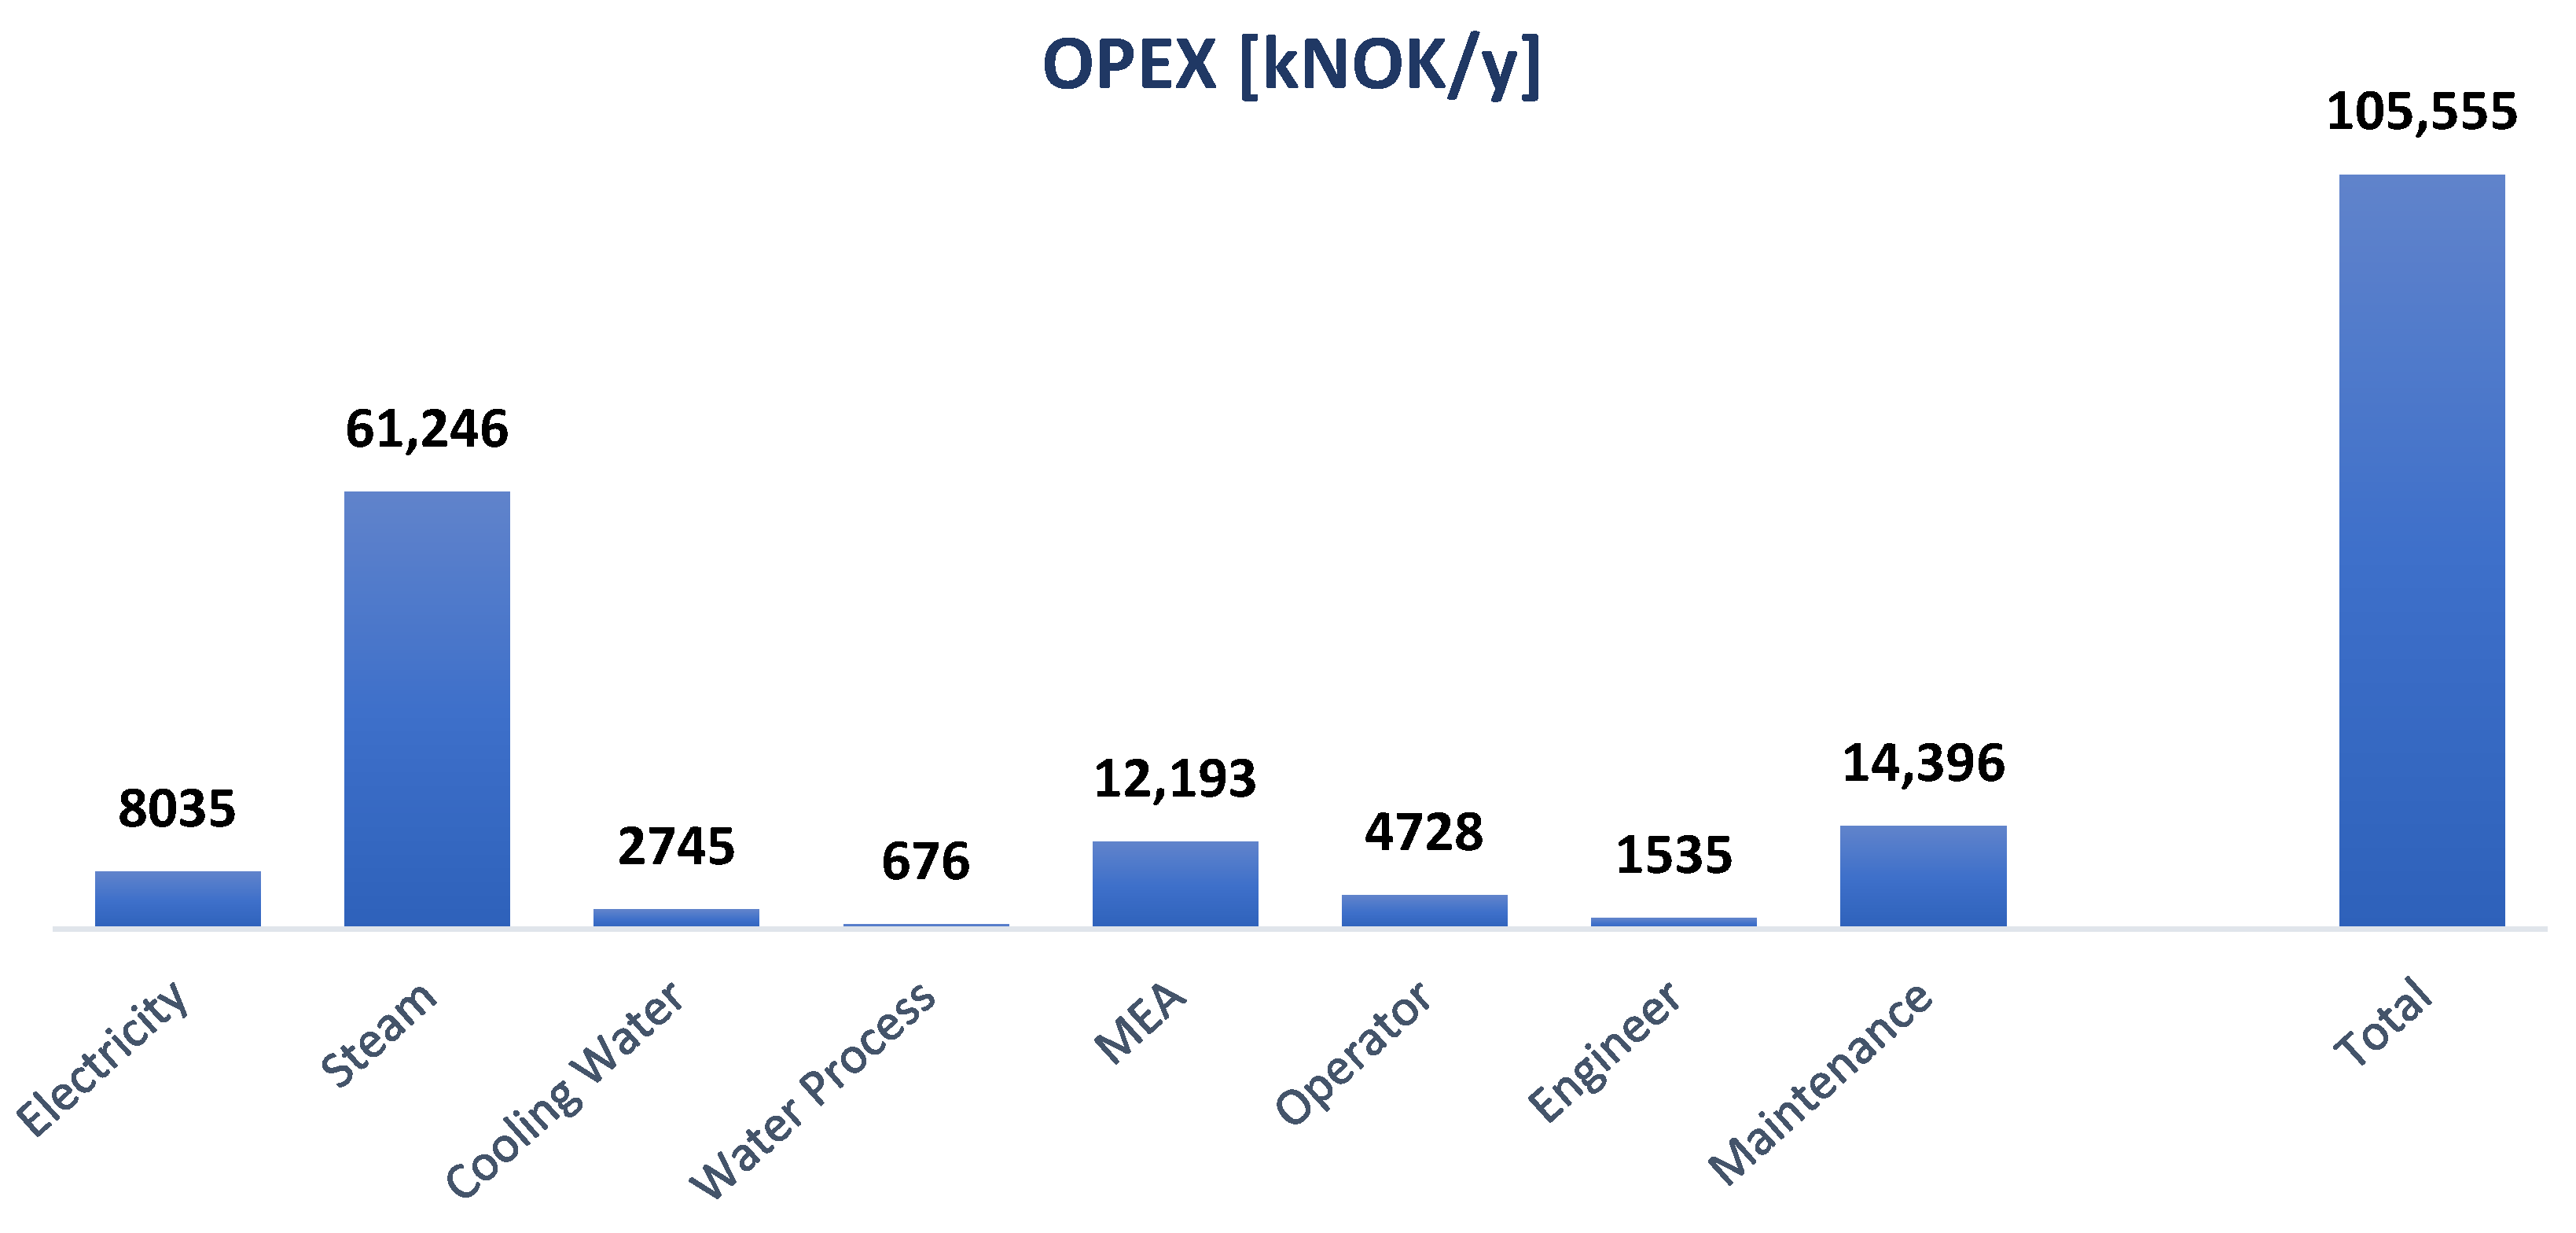
Figure 4 shows the total OPEX for the base case study. With a cost of more than 61 MNOK per year, steam is the most expensive utility for this plant. This is about 60% of the total OPEX (105.5 MNOK). For each step of the analysis, the steam consumption has been calculated and compared. As shown in Figure 4, maintenance, MEA, and electricity are the other expensive cost components beside steam.

5.2. Minimum Temperature Approach (ΔTmin) in Lean/Rich Heat Exchanger

This study is a trade-off between the area in the lean/rich heat exchanger and the requirements for external utility. When ΔTmin is changed, the area of the heat exchanger is changed. The most important trade-off is between the capital cost affected by the change in the size of the lean/rich heat exchanger and the operational cost involved in the difference in the steam consumption.
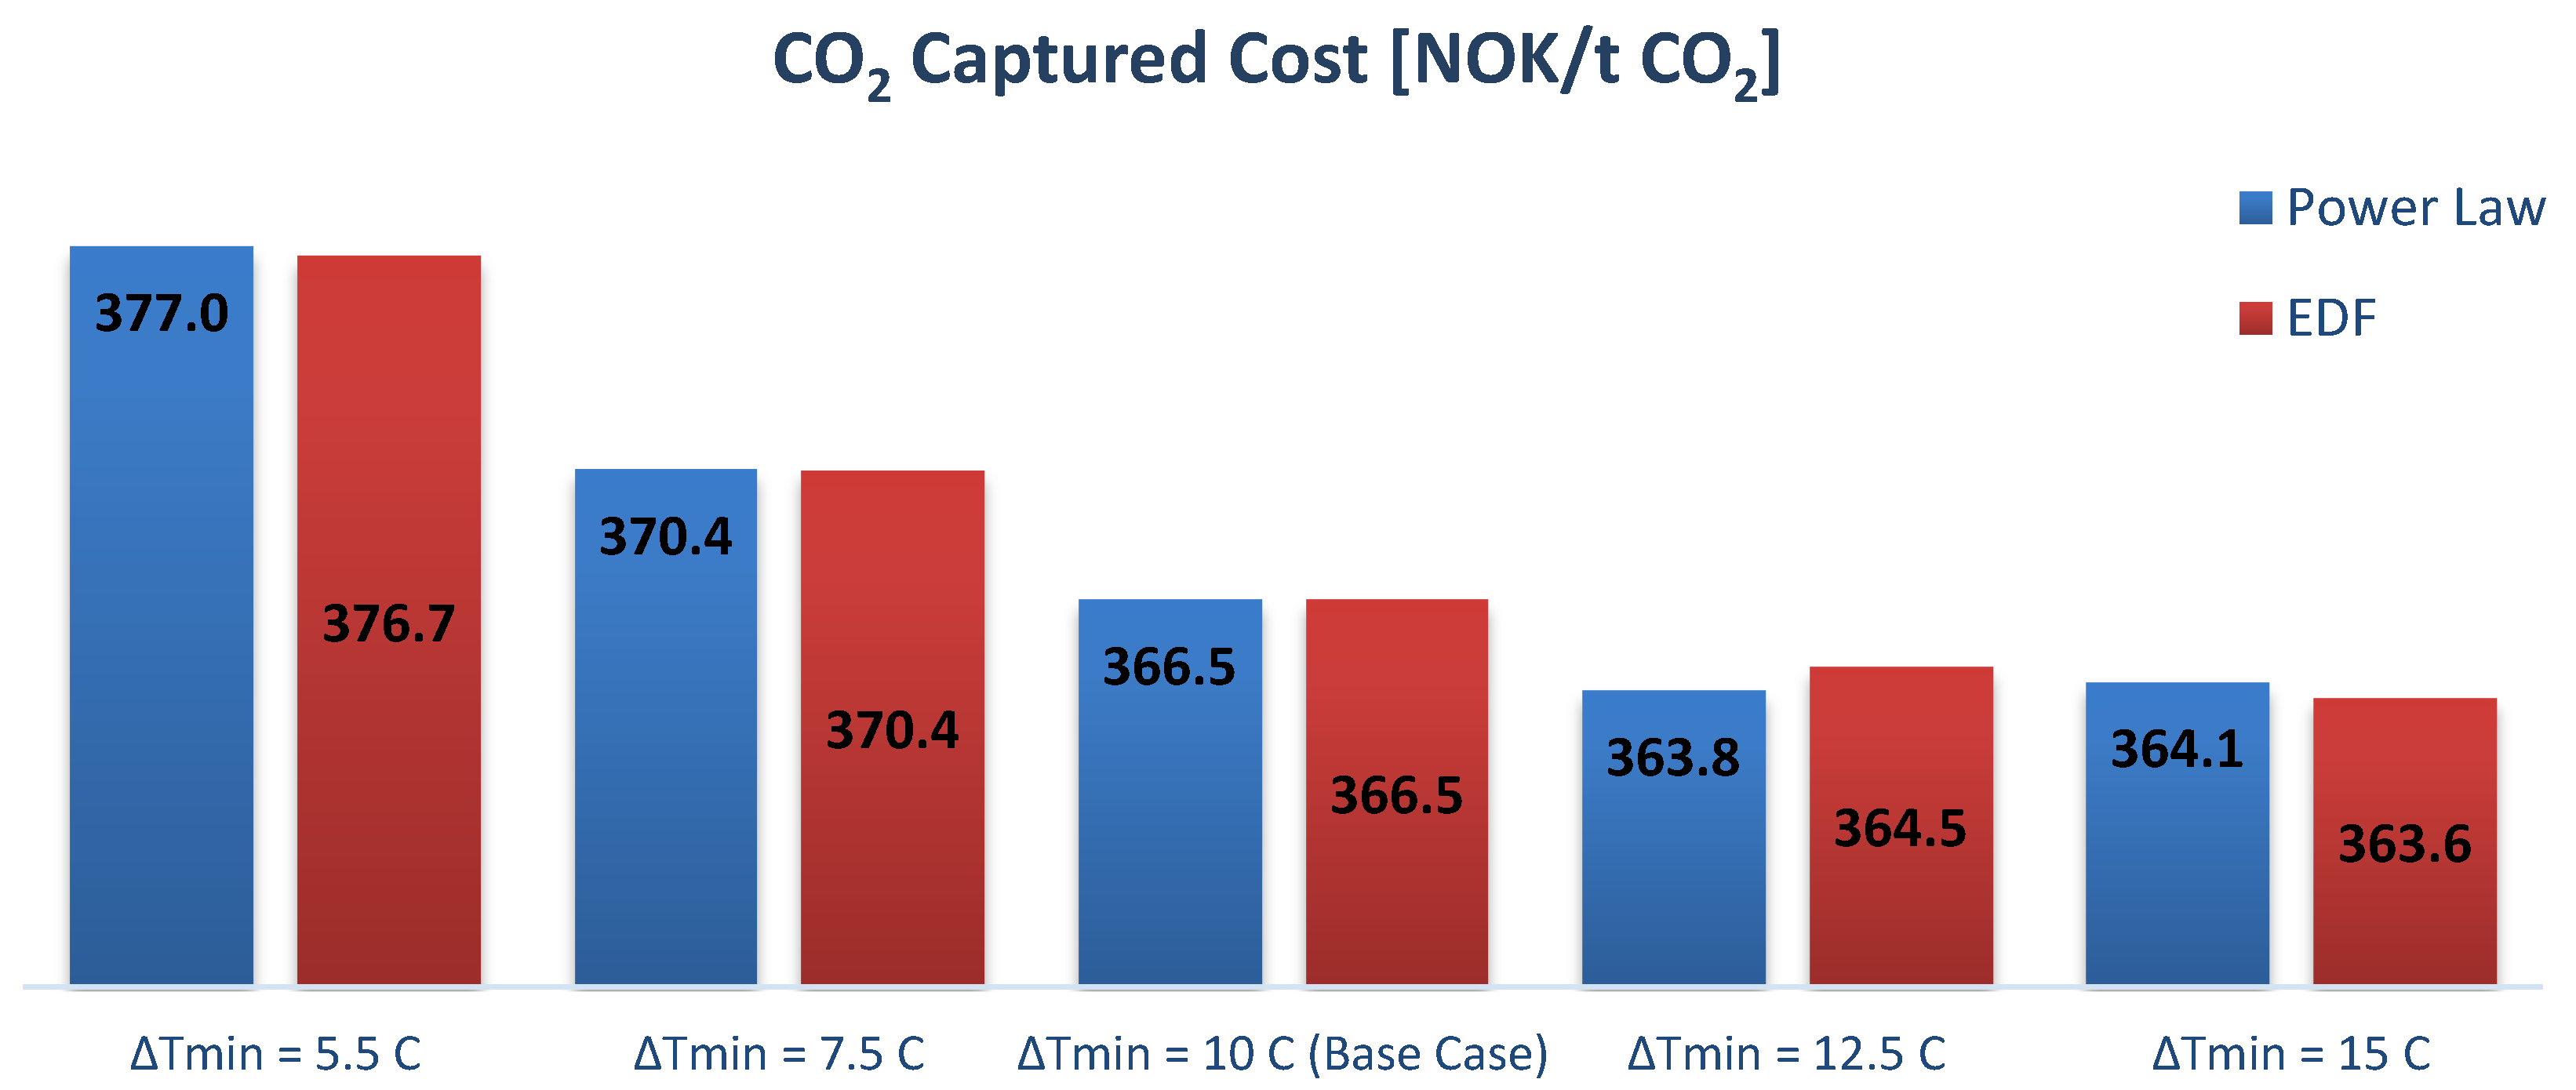
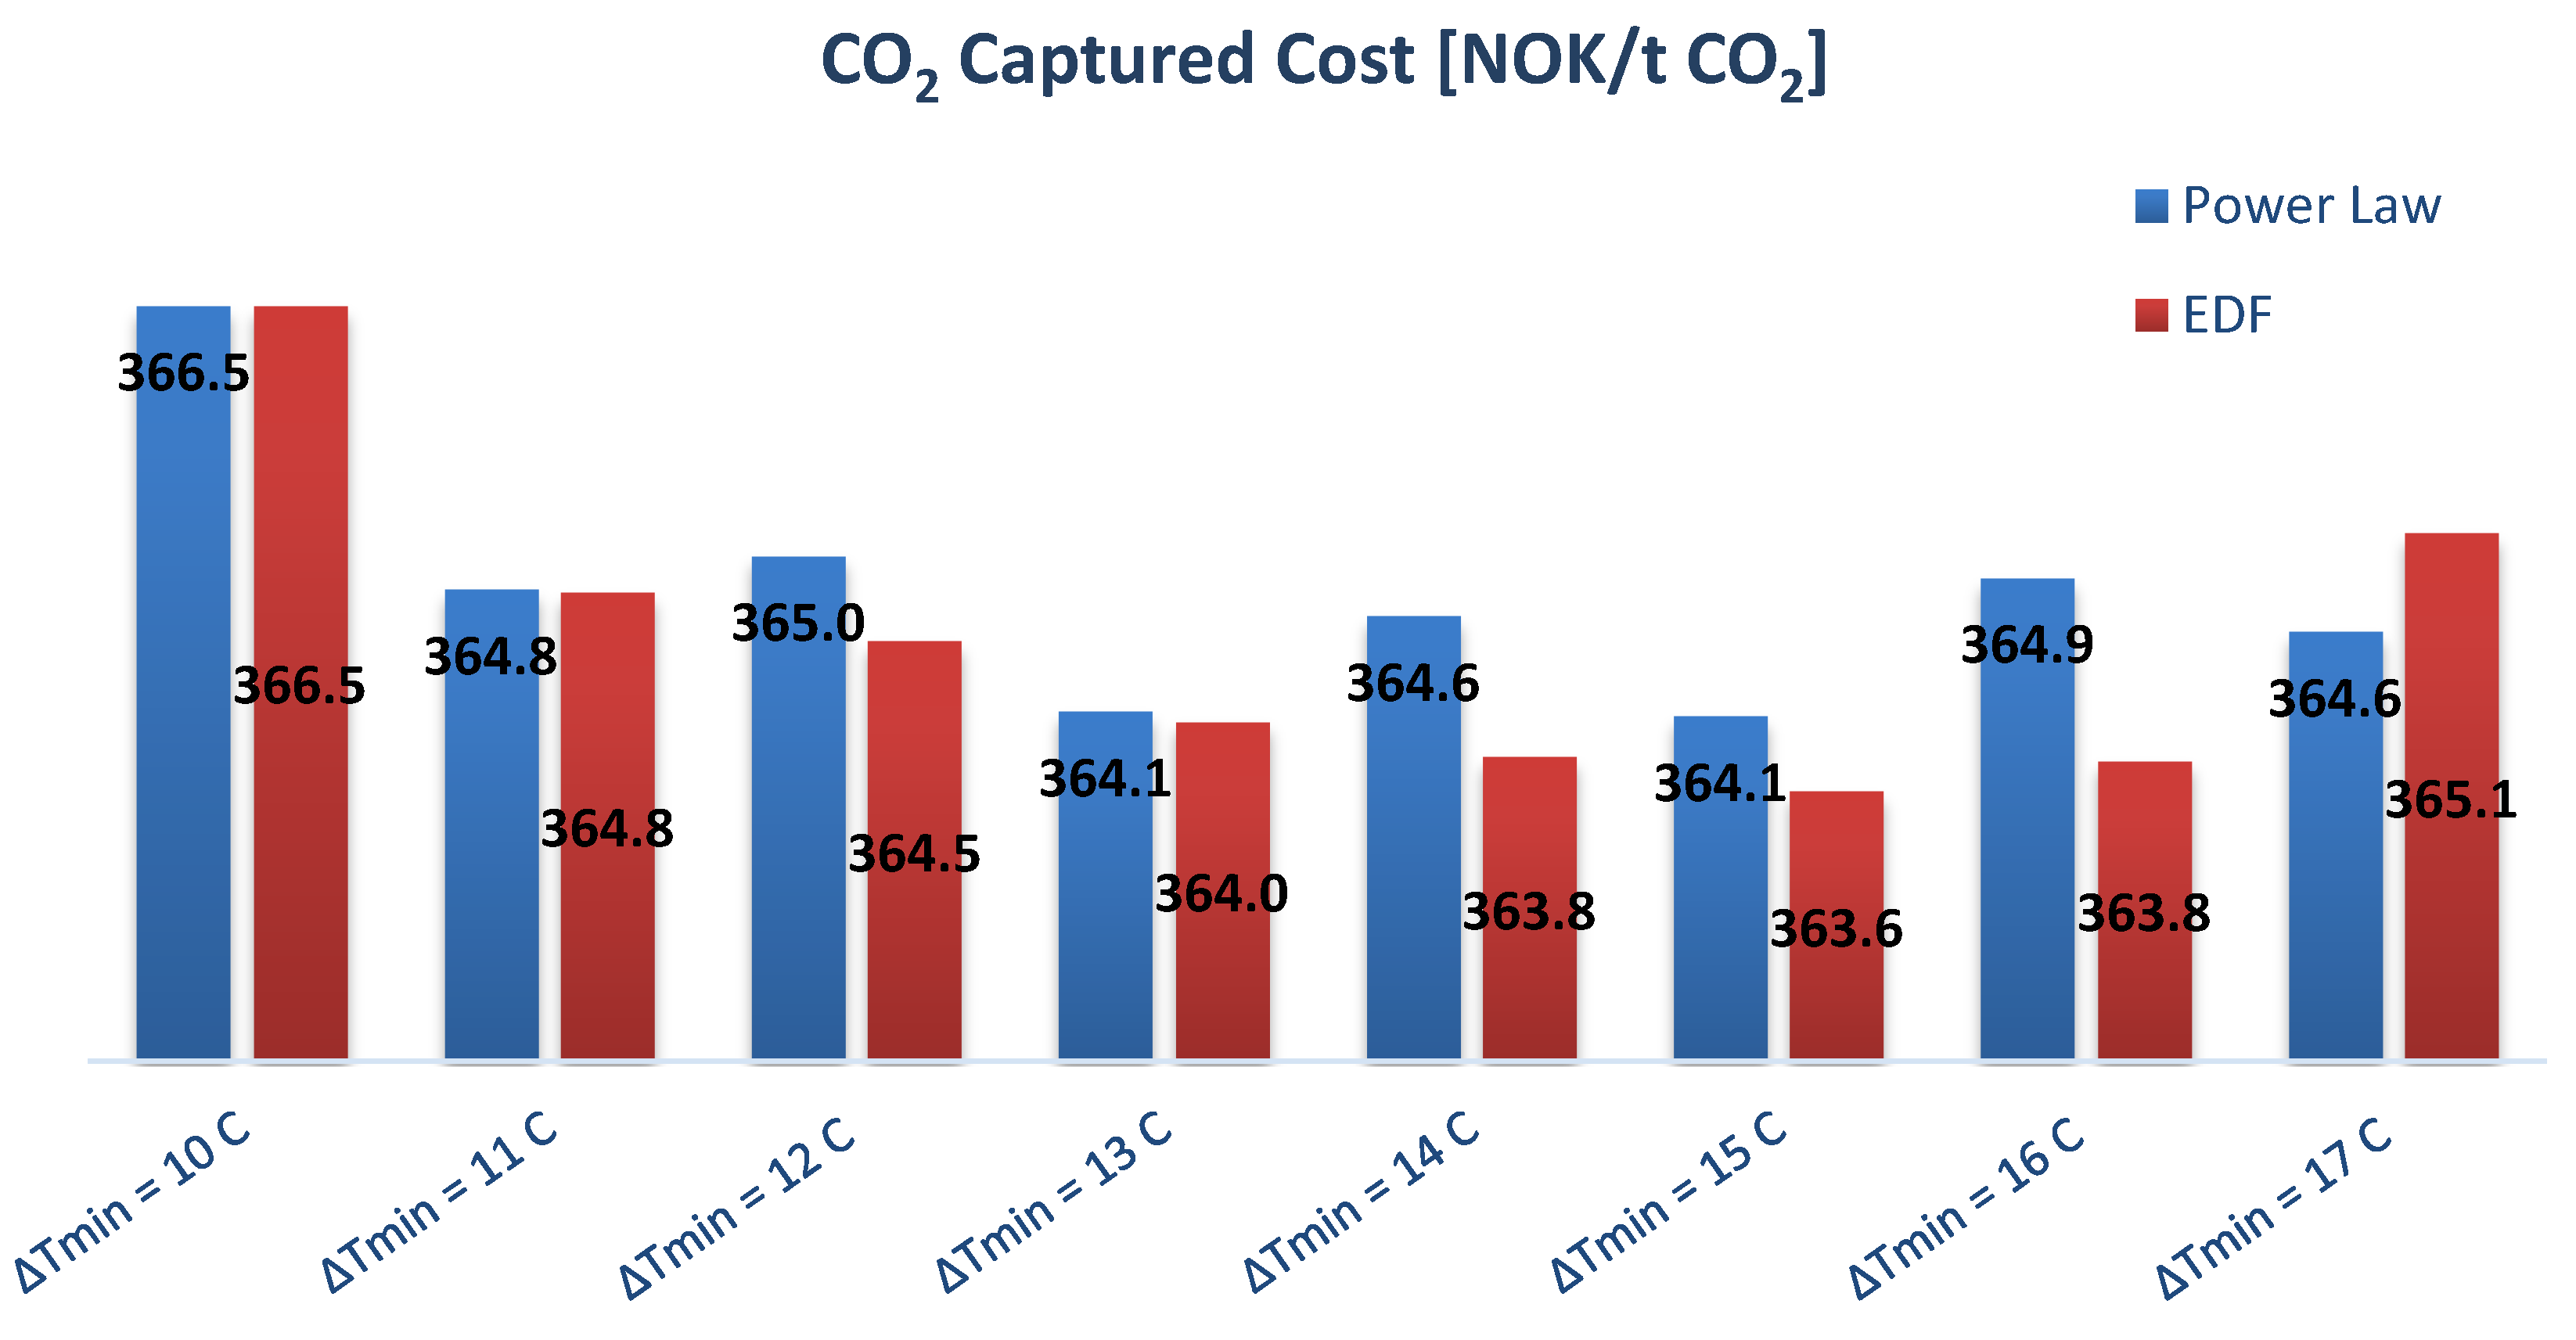
The calculation of the sensitivity analysis for the lean/rich heat exchanger minimum temperature approach (ΔTmin) is shown in Figure 5. The graph compares CO2 captured cost (NOK/t CO2) between the EDF- and Power Law method. According to Figure 5, the optimum ΔTmin is equal to 12.5 °C when the Power Law method has been used, while with the EDF method, the lowest cost achieved is with a ΔTmin = 15 °C. For further evaluation, other sensitivity analyses where the minimum temperature approach ranged from 11 °C to 17 °C were conducted and are shown in Figure 6.
Figure 6 shows that 15 °C is the calculated optimal minimum temperature approach for the two procedures, in which CO2 captured cost for the EDF- and Power Law method are 363.6 NOK/t CO2 and 364.1 NOK/t CO2, respectively. However, a similar result is seen for the Power Law method at ΔTmin = 13 °C. The results obtained from the EDF method are much more stable than the Power Law and clearly show that the lowest CO2 captured cost has occurred at ΔTmin = 15 °C (Figure 6). In terms of the Power Law method, the same exponent value (0.65) has been adopted for all types of equipment and in all various circumstances and capacities in this study. This could be a reason for the instability in the results of this method.
Figure 7 indicates the consumption of steam as the most expensive utility in different cases by evaluating the duty of reboiler per kilogram CO2 captured. Obviously, by increasing the minimum temperature approach in the lean/rich heat exchanger, the amount of steam consumed in the reboiler increased. The steam consumption for ΔTmin optimum calculated in this study is about 3820 kJ/kg.

5.3. CO2 Removal Efficiency

First, for finding the optimum efficiency, by adjusting the flow rate of amine solvent circulation, CO2 captured costs for 85% and 95% efficiency were calculated and compared to the base case (90% efficiency). Figure 8 shows almost similar results for both the EDF and the Power Law methods. It seems that in this study, 85% is the optimal case. After this analysis, extra removal efficiencies alternatives were evaluated to obtain the exact optimum efficiency (Figure 9).
Figure 9 compares the results of efficiencies from 82% to 89% in both the EDF- and Power Law methods. According to the graph, 87% is the optimum calculated efficiency in both approaches. The CO2 captured cost is 360 NOK/t and 360.8 NOK/t for the EDF- and Power Law methods, respectively.
There is an instability in the results shown in Figure 9 for both the EDF- and Power Law method. Although the graph indicates almost the same trend for both scenarios, the reason for discrepancies between the obtained results for both models could be the selection of the same exponent in the Power Law method for all equipment in various capacities, similar to what was explained in the previous section for the minimum temperature approach. Additionally, uncertainties in calculations and simulations could be another reason for instability in the results.
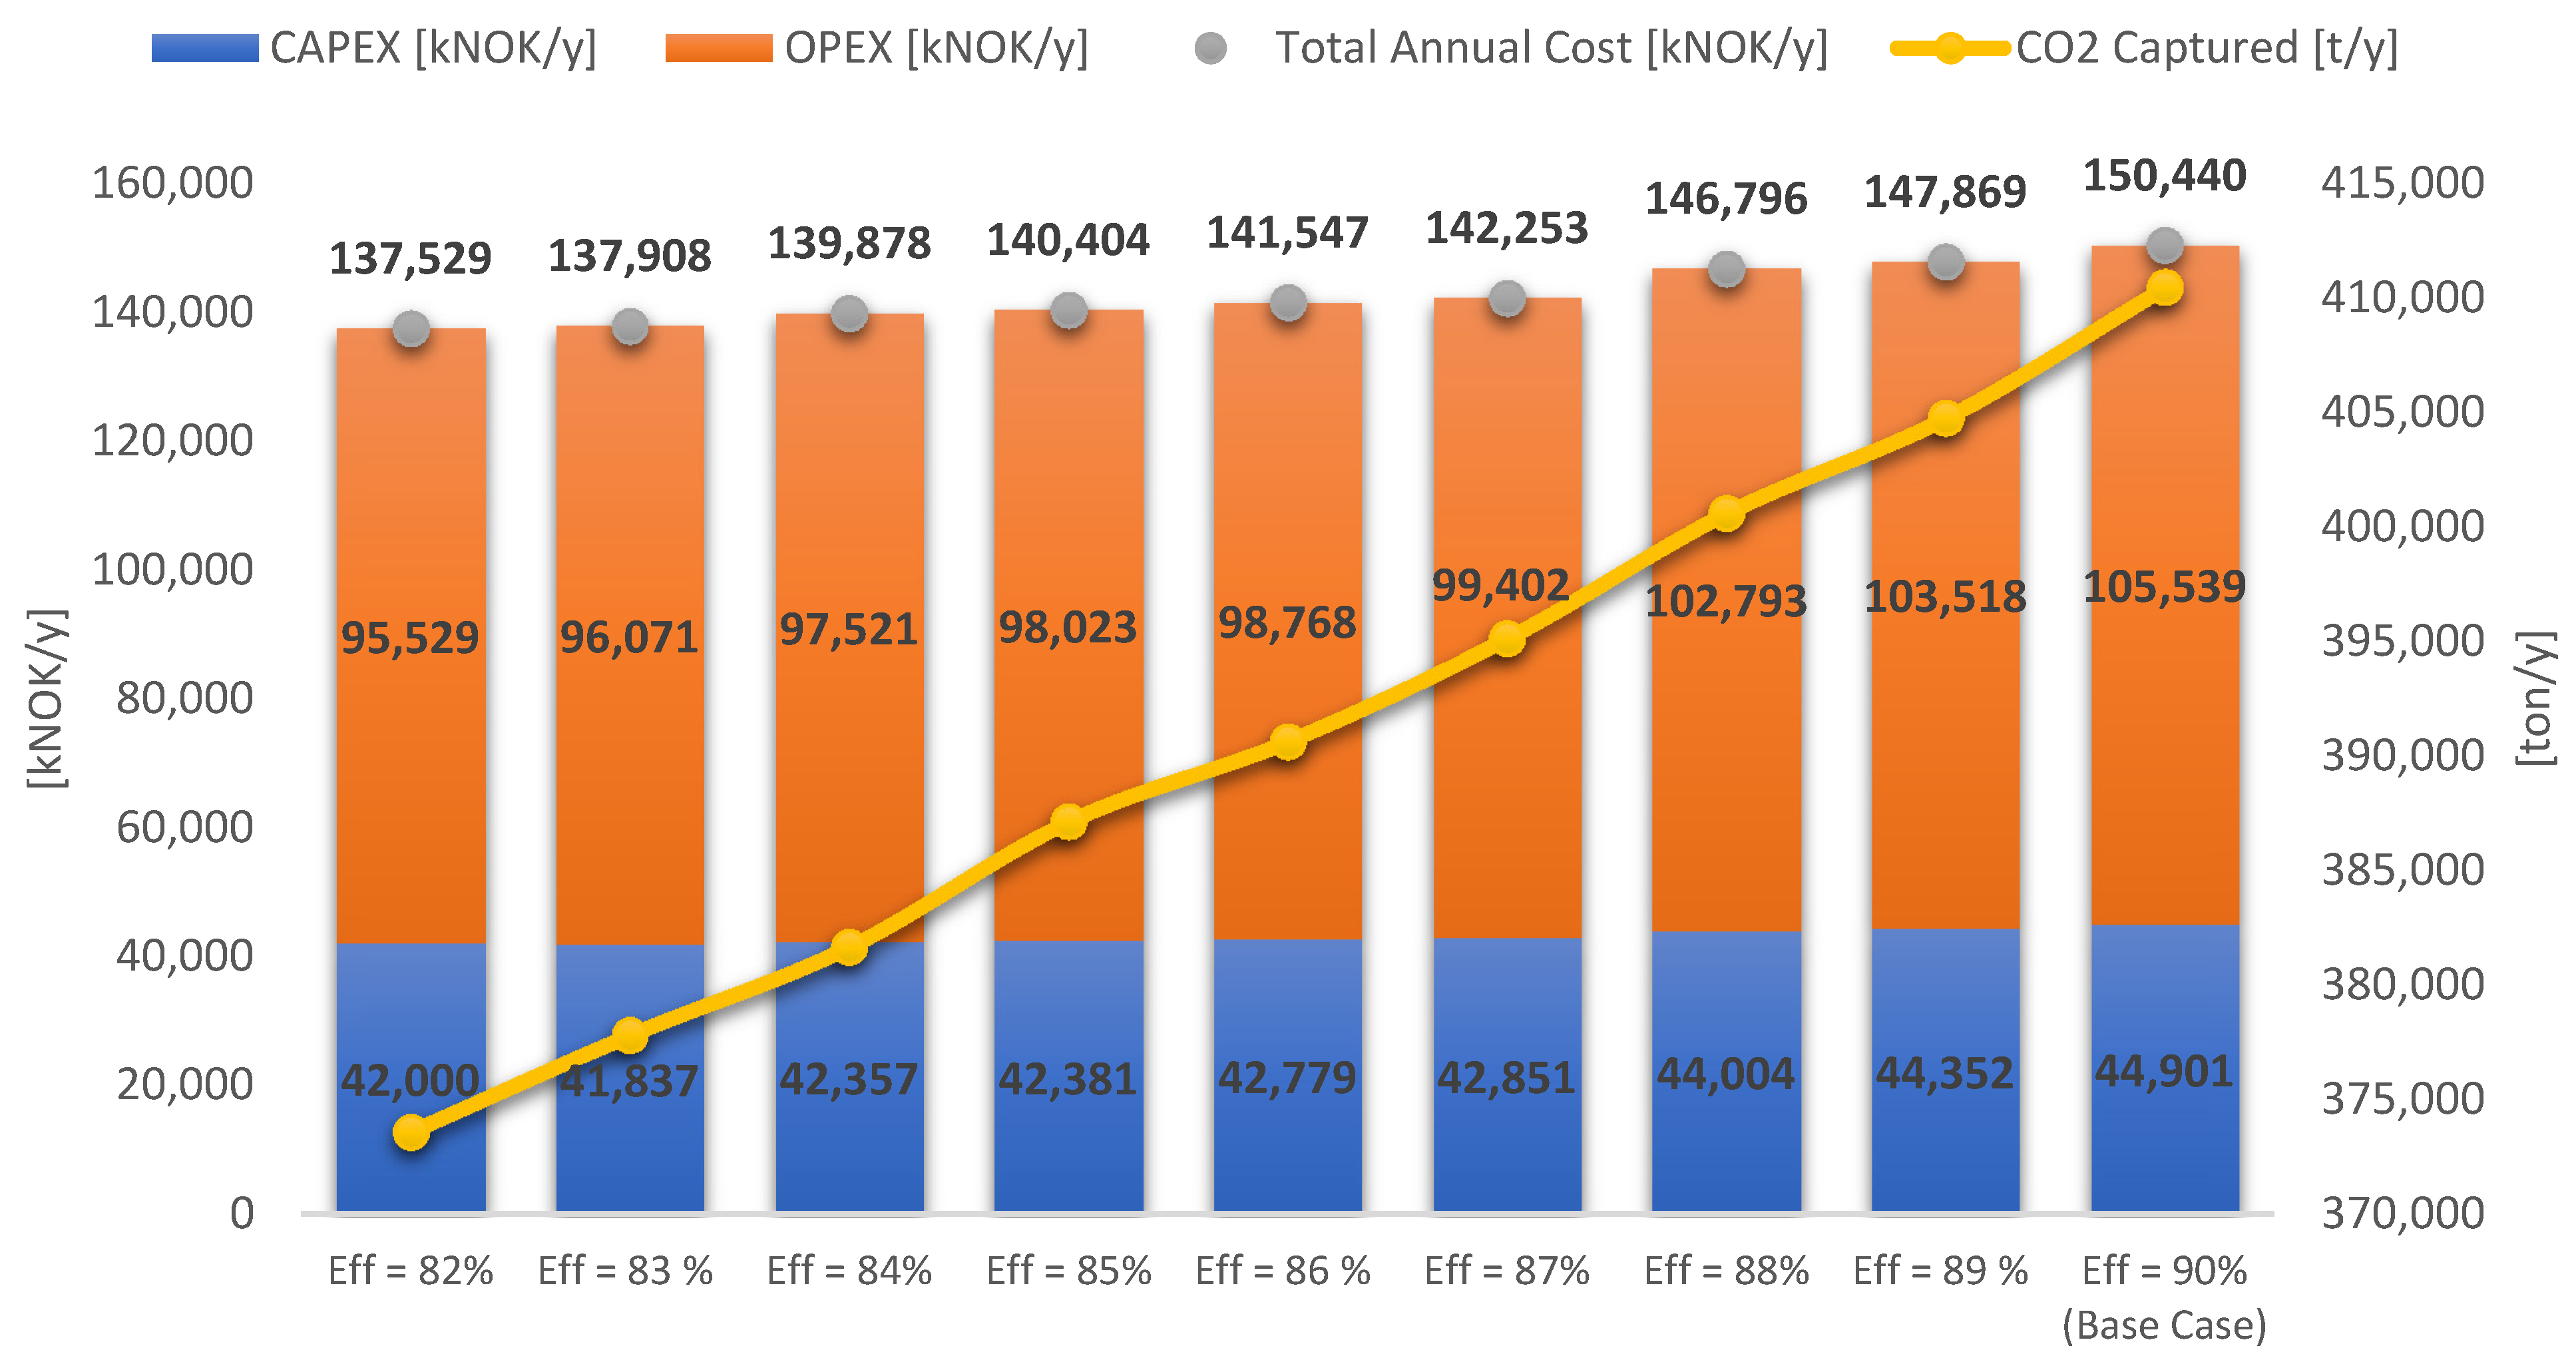
The total annual cost and amount of CO2 captured in a year are demonstrated in Figure 10. This proves that by increasing the efficiency from 82% to 90%, all other items, including CAPEX, OPEX, total annual cost, and CO2 captured, gradually go up, and the results are entirely stable. So, the variation in the results shown in Figure 9 could be due to CO2 captured cost dependency on the total annual cost and the amount of CO2 captured simultaneously, which cause some uncertainty in results for some cases, especially 83% or 84% efficiency.
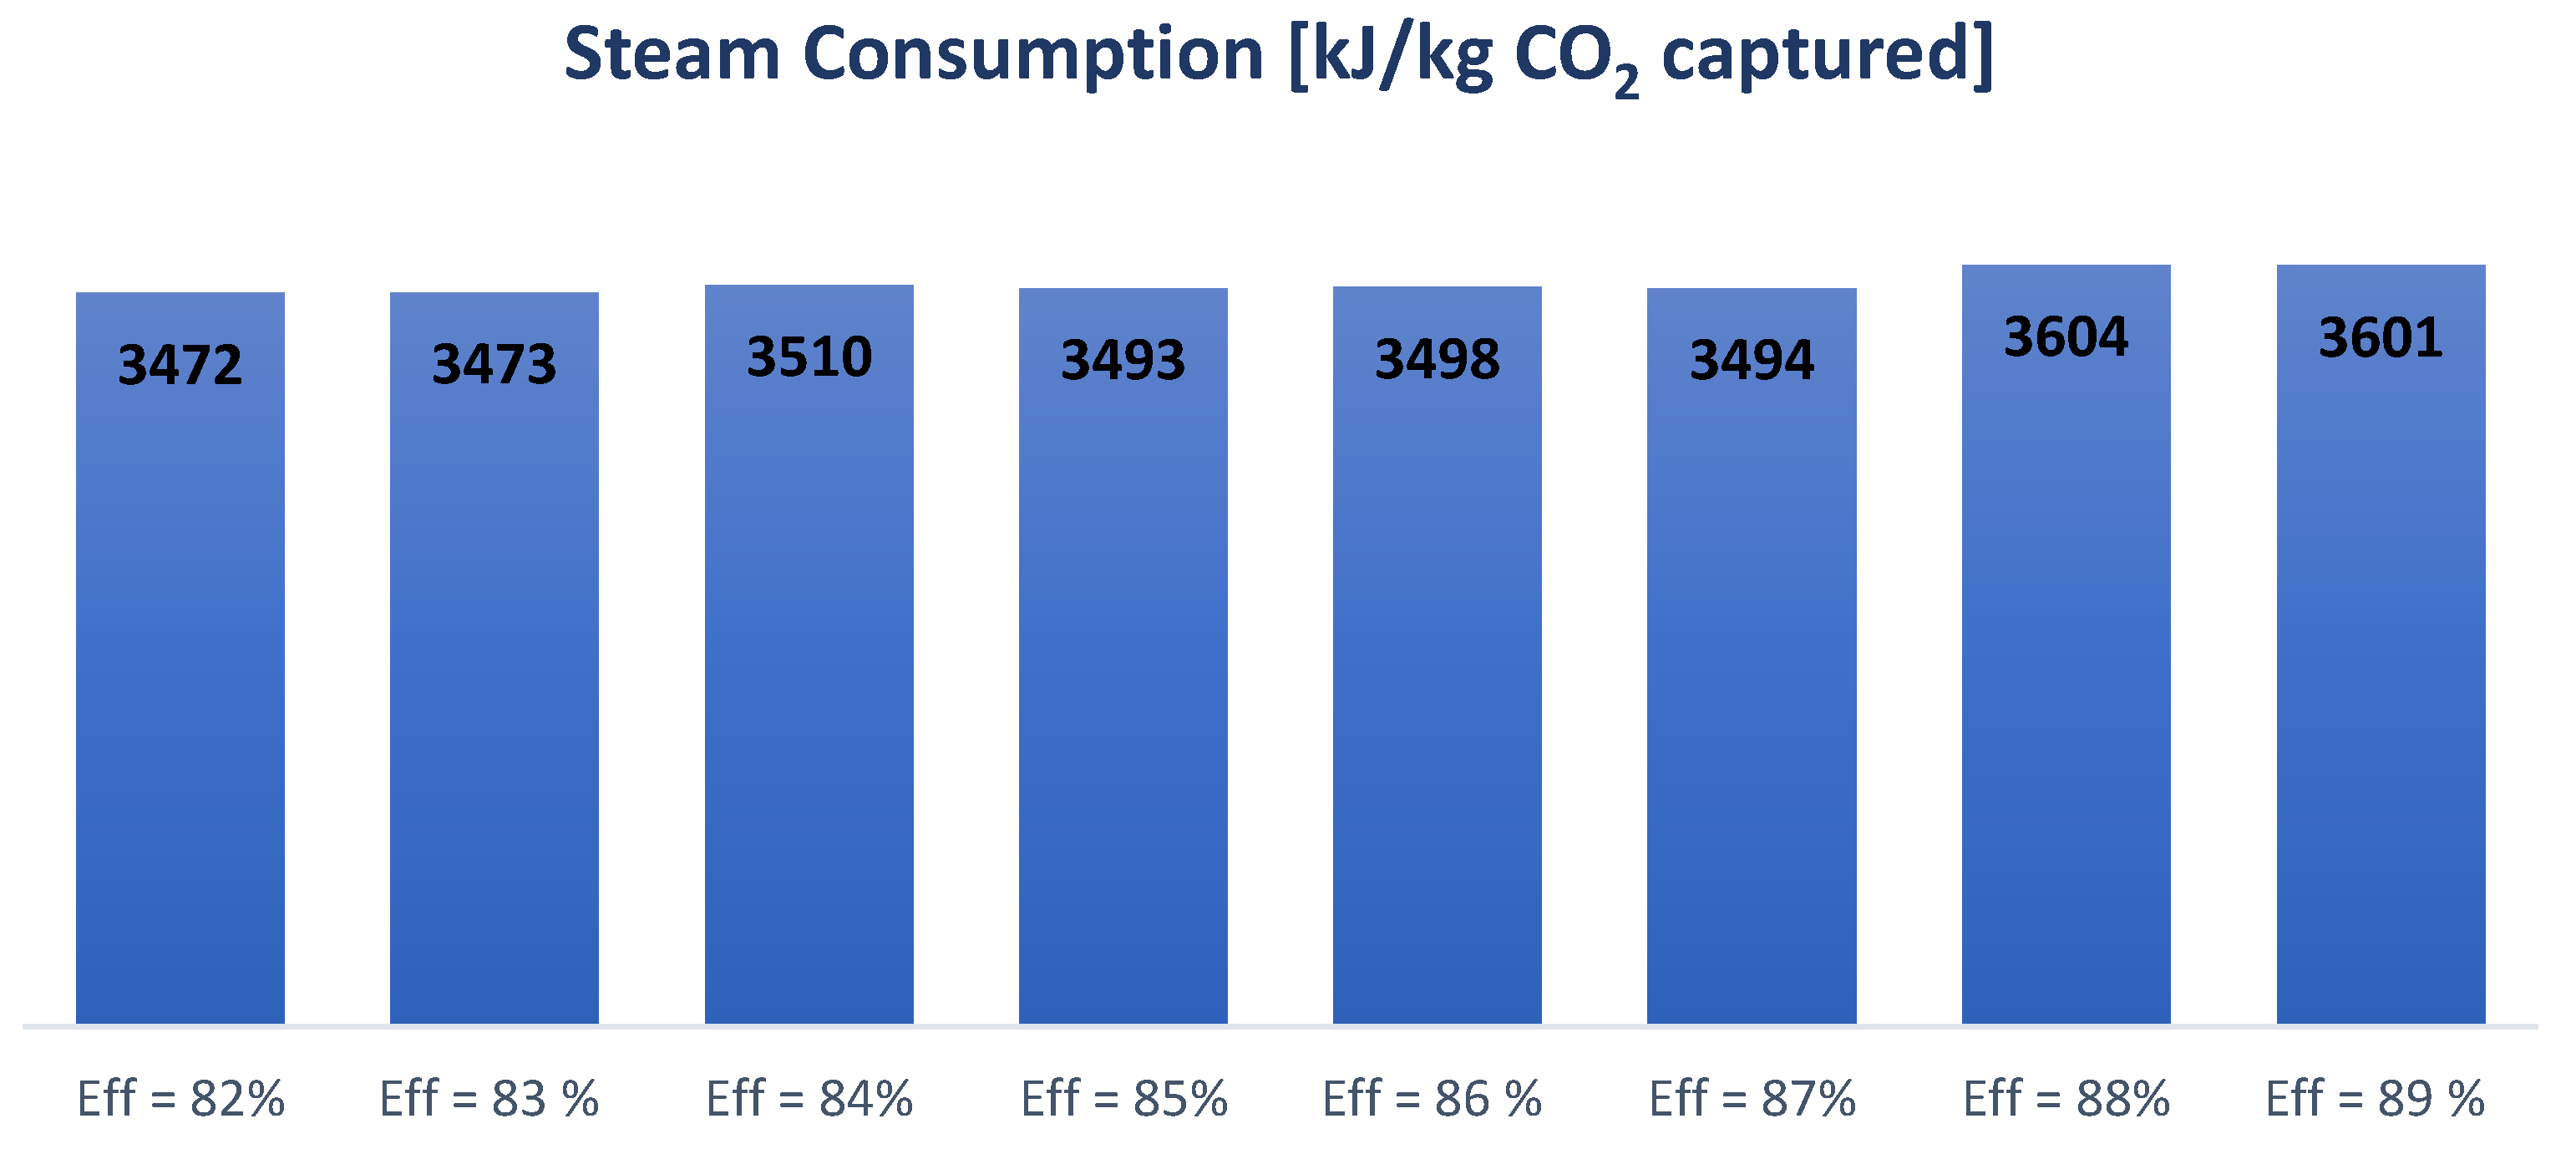
The steam consumption in the reboiler has been compared for various efficiencies in Figure 11. It shows almost identical steam consumption for removal efficiency from 82% to 89% in the range of 3472 to 3603 kJ/kg CO2 captured, while the calculated duty of the reboiler for 95% efficiency is about 6324 kJ per kilogram CO2 captured. This is almost twice as much as other cases, so this could be a significant reason why the CO2 captured cost in this efficiency is much higher than in other cases.

5.4. Absorber Packing Height

This study is a trade-off between amine flow rate and the number of stages in the absorber: the solvent flow rate increases when the number of absorber stages decreases, and vice versa. The significant capital costs affected by this change are the size of the absorber and the heat transfer area in the lean/rich heat exchanger. The cost of the lean/rich heat exchanger is affected due to the change in amine flow. The primary operational costs affected by the change are fan power consumption, steam consumption, and amine consumption. The fan power consumption varies because the pressure is adjusted to simulate the pressure loss over the packing. The steam consumption is affected due to the amine flow change, and the amine consumption is probably affected by various temperatures and amine flow in the absorber.
Figure 12 indicates the change in CO2 captured cost (NOK/t CO2) by adjusting the number of stages from 18 to 24 stages for the EDF- and Power Law method. Some variations between the two approaches can be observed, but no significant trend. There is also an indication of a global calculated minimum at stage number 19 and a local calculated minimum at stage number 22.
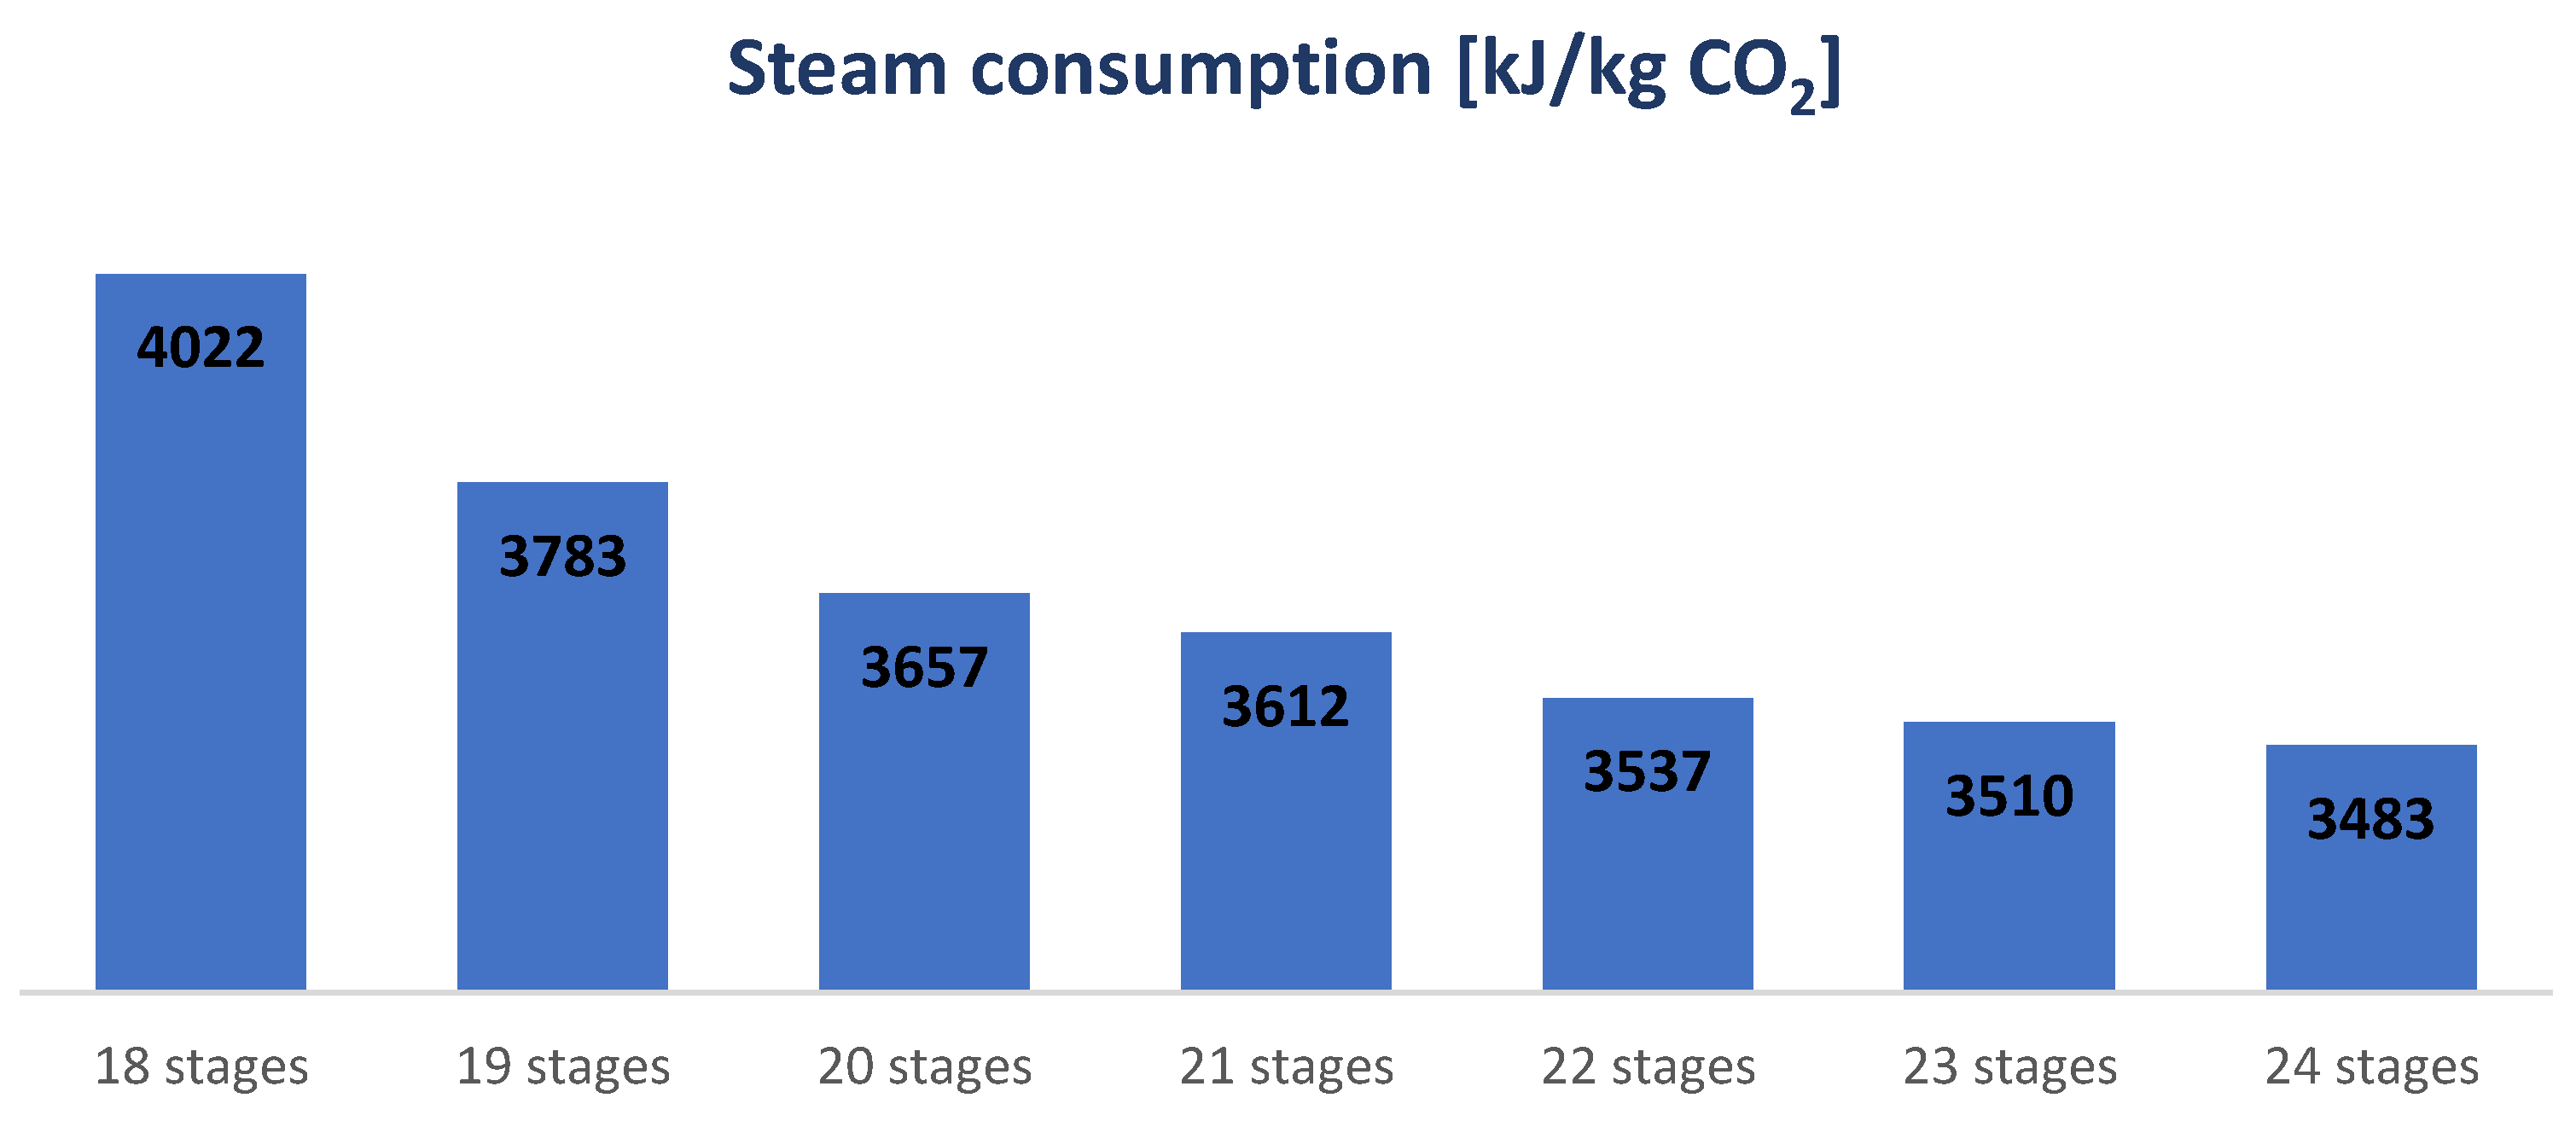
Figure 13 shows the steam consumption (kJ/kg CO2) at different absorber stages. When the number of stages increases the flow rate of the amine solvent decreases, so a declining trend in reboiler duty can be observed, with the largest decline from stage 18 to 20 and a gradually flattening curve after that. The steam represents the most considerable expense. Even though its rate of change declines gradually with the increment of stages, the largest decline happens from 18 to 19 and the second largest from 19 to 20. By only considering the calculated numbers, the local minimum at 22 could be due to the significant decline in steam consumption from stage 21 to 22. However, the most likely explanation is either instability in the simulations or uncertainties in the calculations.

5.5. Size factor’s Exponent Derivation

In Table 4, the derived exponents for the different types of equipment can be observed. The exponents are derived using the data set from the sensitivity analysis of “the absorber packing height”. It is worth noticing the high R-squared value for all the types of equipment except the fan.
Table 5 indicates the derived exponents for the different types of equipment, using the sensitivity analysis of “the CO2-efficiency and the ΔTmin” data set. It is worth noticing that this data set does not include the fan. Moreover, the R-squared is high value for all the types of equipment except the condenser.
The R-squared value measures how close the data are to the fitted regression line. An R-squared value of 1 is an ideal approximation, and 0 indicates that the model explains none of the data points [24]. The R-squared values in Table 4 and Table 5 suggest that all exponents—for both data sets and the given size range, equipment type and material—are over 94%. This indicates that when using the exact specifications and scope, all the exponents are usable and a better choice than the average.
The lean/rich heat exchanger, the reboiler, and the pump suggest that all the exponents for both data sets are over 98% and are almost ideal. This indicates that assuming the same specifications and size range, using these exponents with the Power law, will practically give the same result as the EDF method.
The exponents for the lean heat exchanger, the lean/rich heat exchanger, and the condenser are similar for both data sets. This indicates that the exponents can be used outside the size range of the given data sets, and when choosing which one from the given data set, the R-squared value and the proximity to the size range need to be considered.
The exponents for the reboiler and the pump deviate more for both data sets than the other equipment but indicate a value above the average exponent. This suggests that the exponents should be used with more care outside the given size range.
The exponent for the fan is only obtained from the “absorber height” data set.
The exponents presented in Table 4 and Table 5 are derived for the given size range, material, and equipment. The data are obtained from the Aspen In-Plant Cost Estimator and not the actual price. Additionally, the data sets are small. Therefore, it is essential to warrant a level of caution when using the exponents. However, most published exponents from the industry do not support specific items. Therefore, using the derived exponents will probably give a more precise result than the general exponent.

5.6. Comparison with Earlier Reports

The predicted cost of 360–380 NOK (36–38 Euro) per 1 ton CO2 captured is low when compared to more detailed cost estimates on CO2 capture cost reported in the literature, which show more than 50 Euro/t [14,15]. A probable reason for this could be the assumption of no pre-treatment, such as inlet gas purification or cooling, and no post-treatment, such as compression, transport, or storage of CO2. Additionally, it is more than the calculated cost of 180–190 NOK/t (18–19 Euro/t), which Øi et al. have evaluated [13].
A comparison between the results of this study and the other literature is shown in Table 6. All these studies have used a 29–30 (W%) MEA solvent in their simulations. The concentration of inlet CO2 varies due to variation in plant’s flue gases (NGCC power plant and Cement).

5.6.1. Absorber Stages

A similar study in Kallevik’s master thesis [6] is for 90% removal efficiency and finds the global calculated minimum captured cost in 19 stages. Moreover, the hot utility requirement decreased from 4.02 to 3.51 MJ/kg CO2 as the stages increased from stages 18 to 23. This is almost identical to Kallevik’s findings, ranging from 3.88 to 3.51 MJ/kg CO2 from stages 18 to 23 [6].
Øi et al. [13] calculated the global minimum at 12 m absorber packing height for 90% cleaning efficiency with a CO2-content of 17.8 mole%. This is a significant difference compared to the result in this report. When performing this sensitivity study, it was impossible to get the absorber to converge at 90% cleaning efficiency with fewer than 16 stages. This is similar to the Kalleviks study [6], where it only achieved a 90% removal rate between 14 and 23 stages. Husebye et al. argue that an increase in CO2 concentration results in a decline in cost—especially between 2.5 and 10%. This happens because of higher CO2 transfer, which needs less solvent [28]—therefore, one could have expected a lower number of stages.

5.6.2. Minimum Temperature Approach in the Lean/Rich Heat Exchanger

The results obtained for the EDF method clearly show that at ΔTmin equal to 15 °C, the lowest CO2 captured cost has been calculated, corresponding to Aromada et al.’s article [15]. In terms of the Power Law method, the calculated optimum minimum temperature approach in this study is ΔTmin = 13 °C, similar to Kallevik [6] and Øi [13] studies. The cost can probably be reduced by changing to another type of heat exchanger. Øi points out in his PhD [7] that a plate heat exchanger may reduce the cost and will probably reduce the optimum ΔTmin. According to Øi [7], a low ΔTmin will reduce steam and reboiler duty. On the other hand, a high ΔTmin will reduce the heat exchanger cost.

5.6.3. Total Efficiency

From the first optimization in this study, 85% is the optimal case, which corresponds to what is reported in Øi et al.’s article [13] and Kallevik’s thesis [6]. Moreover, Ali [14] calculated the minimum CO2 captured cost by changing the efficiency from 85% to 90%, in which the optimal case was reported as 87%. In this study, by evaluating the extra alternatives from 82% to 90%, the calculated optimum CO2 capture efficiency corresponds to 87%.

5.6.4. Reboiler Duty

The duty of the reboiler for 90% CO2 removal efficiency and calculated optimum ΔTmin = 15 °C is about 3820 kJ/kg CO2 captured, which almost corresponds to the values reported in previous works [11]. In Ali et al. [14], this figure for 90% efficiency and ΔTmin = 10°C is about 3970 kJ/kg, while for 85% efficiency and ΔTmin = 15 °C, it is more than 4000 kJ/kg. In this study, the calculated reboiler duties at ΔTmin equal to 10 °C for 90% and 85% efficiency are 3654 kJ/kg and 3493 kJ/kg, respectively. For 85% efficiency and ΔTmin = 10 °C, Øi [11], Ali [14], and Aromada [3] reported in their studies the calculated reboiler duty to 3300 kJ/kg, 3900 kJ/kg and 3600 kJ/kg, respectively.

6. Conclusions

This work presented a cost estimation of an amine-based CO2 capture process for a waste burning facility at Klemetsrud in Norway. The CAPEX and OPEX calculations were done by performing simulations in Aspen HYSYS using available data in Fortum’s FEED report. For the base case, the total cost was calculated to 37.5 EUR per ton CO2 captured, and energy consumption in the reboiler was calculated to 3654 kJ/kg.
The sensitivity analysis for the CO2 removal efficiency is a trade-off between the quantity of CO2 captured and the expense of a higher amine flow rate, which resulted in larger lean/rich heat exchanger, reboiler, and steam usage. This study resulted in 87% as the optimum calculated efficiency in the EDF- and Power Law methods. There the CO2 captured costs were 36.7 EUR/t and 36.8 EUR/t, respectively. The reboiler duty was around 3500 kJ per kg CO2 captured in the parameter assessment.
Sensitivity analysis of the ΔTmin in the lean/rich heat exchanger is a trade-off between the area of the lean/rich heat exchanger and the required exterior utility. This analysis showed an optimum ΔTmin of 15 °C from both the EDF- and Power Law methods, with a CO2 removal cost of 37 EUR/t CO2. However, the Power Law approach also yielded a comparable result at ΔTmin = 13 °C. In addition, the reboiler’s average energy usage was around 3800 kJ per kg CO2 captured.
The sensitivity analysis for the absorber packing height looks at the relationship between the amine flow rate and the number of absorber stages: as the number of absorber stages lowers, the solvent flow rate rises. The size of the absorber and the heat transfer area in the lean/rich heat exchanger are two key capital expenses that are influenced by this shift. Fan power consumption, steam consumption, and amine consumption are the three main operating costs affected by this adjustment. The fan power consumption fluctuates since the pressure is modified to compensate for pressure loss across the packing. Due to the amine flow modification, both steam and amine consumption are affected. This study resulted in 19 m as the optimum packing height. The CO2 removal costs for the EDF and Power Law techniques are 37.3 EUR/t and 37.1 EUR/t CO2 captured, respectively. In addition, the reboiler uses 3780 kJ of energy to extract 1 kg of CO2 from the flue gas.
A new size of factor exponent in the Power Law approach has been proposed by considering the calculated cost from the EDF-method. The exponents have different values that are specific for different equipment. The derivation on average resulted in the following exponents: for the lean heat exchanger 0.74, for the lean/rich heat exchanger 1.03, for the condenser 0.68, for the reboiler 0.92, for the pump 0.88, and for the fan 0.23.
Even though the optimization in this work only decreases the CO2 capture cost by about 3% compared to the base case, the total improvement is significant because the total cost is very large.

Author Contributions

Conceptualization, L.E.Ø. and S.A.A.; methodology, S.A.A., S.S. and B.W.-S.; software, S.S., F.F. and B.W.-S.; validation, L.E.Ø., S.V. and S.S.; formal analysis, L.E.Ø., S.S. and S.V.; investigation, S.S., S.V., F.F. and B.W.-S.; resources, L.E.Ø.; data curation, S.S., S.V. and B.W.-S.; writing—original draft preparation, S.S.; writing—review and editing, S.S., S.K. and L.E.Ø.; visualization, S.S. and L.E.Ø.; supervision, L.E.Ø. and S.K.; project administration, S.V. and B.W.-S. All authors have read and agreed to the published version of the manuscript.

Funding

This research received no external funding.

Institutional Review Board Statement

Not applicable.

Informed Consent Statement

Not applicable.

Data Availability Statement

Not applicable.

Conflicts of Interest

The authors declare no conflict of interest.

References

  1. Causes of Climate Change. Available online: https://ec.europa.eu/clima/climate-change/causes-climate-change_en (accessed on 26 October 2021).
  2. IEA—International Energy Agency, IEA. Available online: https://www.iea.org (accessed on 26 October 2021).
  3. Aromada, S.A.; Øi, L. Simulation of improved absorption configurations for CO2 capture. In Proceedings of the 56th Conference on Simulation and Modelling (SIMS 56), Linköping, Sweden, 7–9 October 2015; Linköping University Electronic Press: Linköping, Sweden, 2015. [Google Scholar]
  4. Jinadasa, M.H.W.N.; Jens, K.-J.; Halstensen, M. Process Analytical Technology for CO2 Capture. In Carbon Dioxide Chemistry, Capture and Oil Recovery; Karamé, I., Shaya, J., Srour, H., Eds.; InTech: London, UK, 2018. [Google Scholar] [CrossRef] [Green Version]
  5. Patel, H.A.; Byun, J.; Yavuz, C.T. Carbon Dioxide Capture Adsorbents: Chemistry and Methods. ChemSusChem 2017, 10, 1303–1317. [Google Scholar] [CrossRef] [PubMed]
  6. Kallevik, O.B. Cost Estimation of CO2 Removal in HYSYS. Master’s Thesis, Høgskolen i Telemark, Porsgrunn, Norway, 2010. [Google Scholar]
  7. Øi, L.E. Removal of CO2 from Exhaust Gas. Ph.D. Thesis, Telemark University College, Porsgrunn, Norway, 2012. [Google Scholar]
  8. Rubin, E.S.; Short, C.; Booras, G.; Davison, J.; Ekstrom, C.; Matuszewski, M.; McCoy, S. A proposed methodology for CO2 capture and storage cost estimates. Int. J. Greenh. Gas Control 2013, 17, 488–503. [Google Scholar] [CrossRef]
  9. Van der Spek, M.; Roussanaly, S.; Rubin, E.S. Best practices and recent advances in CCS cost engineering and economic analysis. Int. J. Greenh. Gas Control 2019, 83, 91–104. [Google Scholar] [CrossRef]
  10. Luo, X. Process Modelling, Simulation and OPTIMISATION of Natural Gas Combined Cycle Power Plant Integrated with Carbon Capture, Compression and Transport. Ph.D. Thesis, School of Engineering, The University of Hull, Hull, UK, 2016. [Google Scholar]
  11. Øi, L.E.; Bråthen, T.; Berg, C.; Brekne, S.K.; Flatin, M.; Johnsen, R.; Moen, I.G.; Thomassen, E. Optimization of configurations for amine based CO2 absorption using Aspen HYSYS. Energy Procedia 2014, 51, 224–233. [Google Scholar] [CrossRef] [Green Version]
  12. Roussanaly, S.; Lindqvist, K.; Anantharaman, R.; Jakobsen, J. A Systematic Method for Membrane CO2 Capture Modeling and Analysis. Energy Procedia 2014, 63, 217–224. [Google Scholar] [CrossRef] [Green Version]
  13. Øi, L.E.; Eldrup, N.; Aromada, S.; Haukås, A.; HelvigIda Hæstad, J.; Lande, A.M. Process Simulation, Cost Estimation and Optimization of CO2 Capture using Aspen HYSYS. In Proceedings of the 61st International Conference of Scandinavian Simulation, Virtual Conference, Oulu, Finland, 22–24 September 2020. [Google Scholar]
  14. Ali, H.; Eldrup, N.H.; Normann, F.; Skagestad, R.; Øi, L.E. Cost Estimation of CO2 Absorption Plants for CO2 Mitigation–Method and Assumptions. Int. J. Greenh. Gas Control 2019, 88, 10–23. [Google Scholar] [CrossRef]
  15. Aromada, S.A.; Eldrup, N.H.; Øi, L.E. Capital cost estimation of CO2 capture plant using Enhanced Detailed Factor (EDF) method: Installation factors and plant construction characteristic factors. Int. J. Greenh. Gas Control 2021, 110, 103394. [Google Scholar] [CrossRef]
  16. FEED-Study-Report-DG3_redacted_version_03-2.pdf. Available online: https://ccsnorway.com/wp-content/uploads/sites/6/2020/07/FEED-Study-Report-DG3_redacted_version_03-2.pdf (accessed on 26 October 2021).
  17. Fagerheim, S. Process Simulation of CO2 Absorption at TCM Mongstad. Master’s Thesis, University of South-Eastern Norway, Porsgrunn, Norway, 2019. [Google Scholar]
  18. Iliuta, I.; Larachi, F. Modeling and simulations of NOx and SO2 seawater scrubbing in packed-bed columns for marine applications. Catalysts 2019, 9, 489. [Google Scholar] [CrossRef] [Green Version]
  19. Ali, H. Techno-Economic Analysis of CO2 Capture Concepts. Ph.D. Thesis, University of South-Eastern Norway, Porsgrunn, Norway, 2019. [Google Scholar]
  20. ClearTax, Cost Inflation Index FY 2021-22—Overview, Calculation, Benefits & Examples. Available online: https://cleartax.in/s/cost-inflation-index (accessed on 28 October 2021).
  21. Exchange Rates. Available online: https://www.norges-bank.no/en/topics/Statistics/exchange_rates/ (accessed on 28 October 2021).
  22. Baumann, C. Cost-to-Capacity Method: Applications and Considerations. M&TS J. 2014, 30, 49–56. [Google Scholar]
  23. Smith, R. Chemical Process Design and Integration; John Wiley & Sons Ltd.: Chichester, UK, 2005; pp. 17–19. [Google Scholar]
  24. “What Is R-Squared?”, Investopedia. Available online: https://www.investopedia.com/terms/r/r-squared.asp (accessed on 6 November 2021).
  25. Amrollahi, Z.; Ystad, P.A.M.; Ertesvåg, I.S.; Bolland, O. Optimized process configurations of post-combustion CO2 capture for. natural-gas-fired power plant–Power plant efficiency analysis. Int. J. Greenh. Gas Control 2012, 8, 1–11. [Google Scholar] [CrossRef]
  26. Sipöcz, N.; Tobiesen, A.; Assadi, M. Integrated modelling and simulation of a 400 MW NGCC power plant with CO2 capture. Energy Procedia 2011, 4, 1941–1948. [Google Scholar] [CrossRef] [Green Version]
  27. Nwaoha, C.; Beaulieu, M.; Tontiwachwuthikul, P.; Gibson, M.D. Techno-economic analysis of CO2 capture from a 1.2 million MTPA cement plant using AMP-PZ-MEA blend. Int. J. Greenh. Gas Control 2018, 78, 400–412. [Google Scholar] [CrossRef]
  28. Husebye, J.; Brunsvold, A.L.; Roussanaly, S.; Zhang, X. Techno Economic Evaluation of Amine based CO2 Capture: Impact of CO2 Concentration and Steam Supply. Energy Procedia 2012, 23, 381–390. [Google Scholar] [CrossRef] [Green Version]
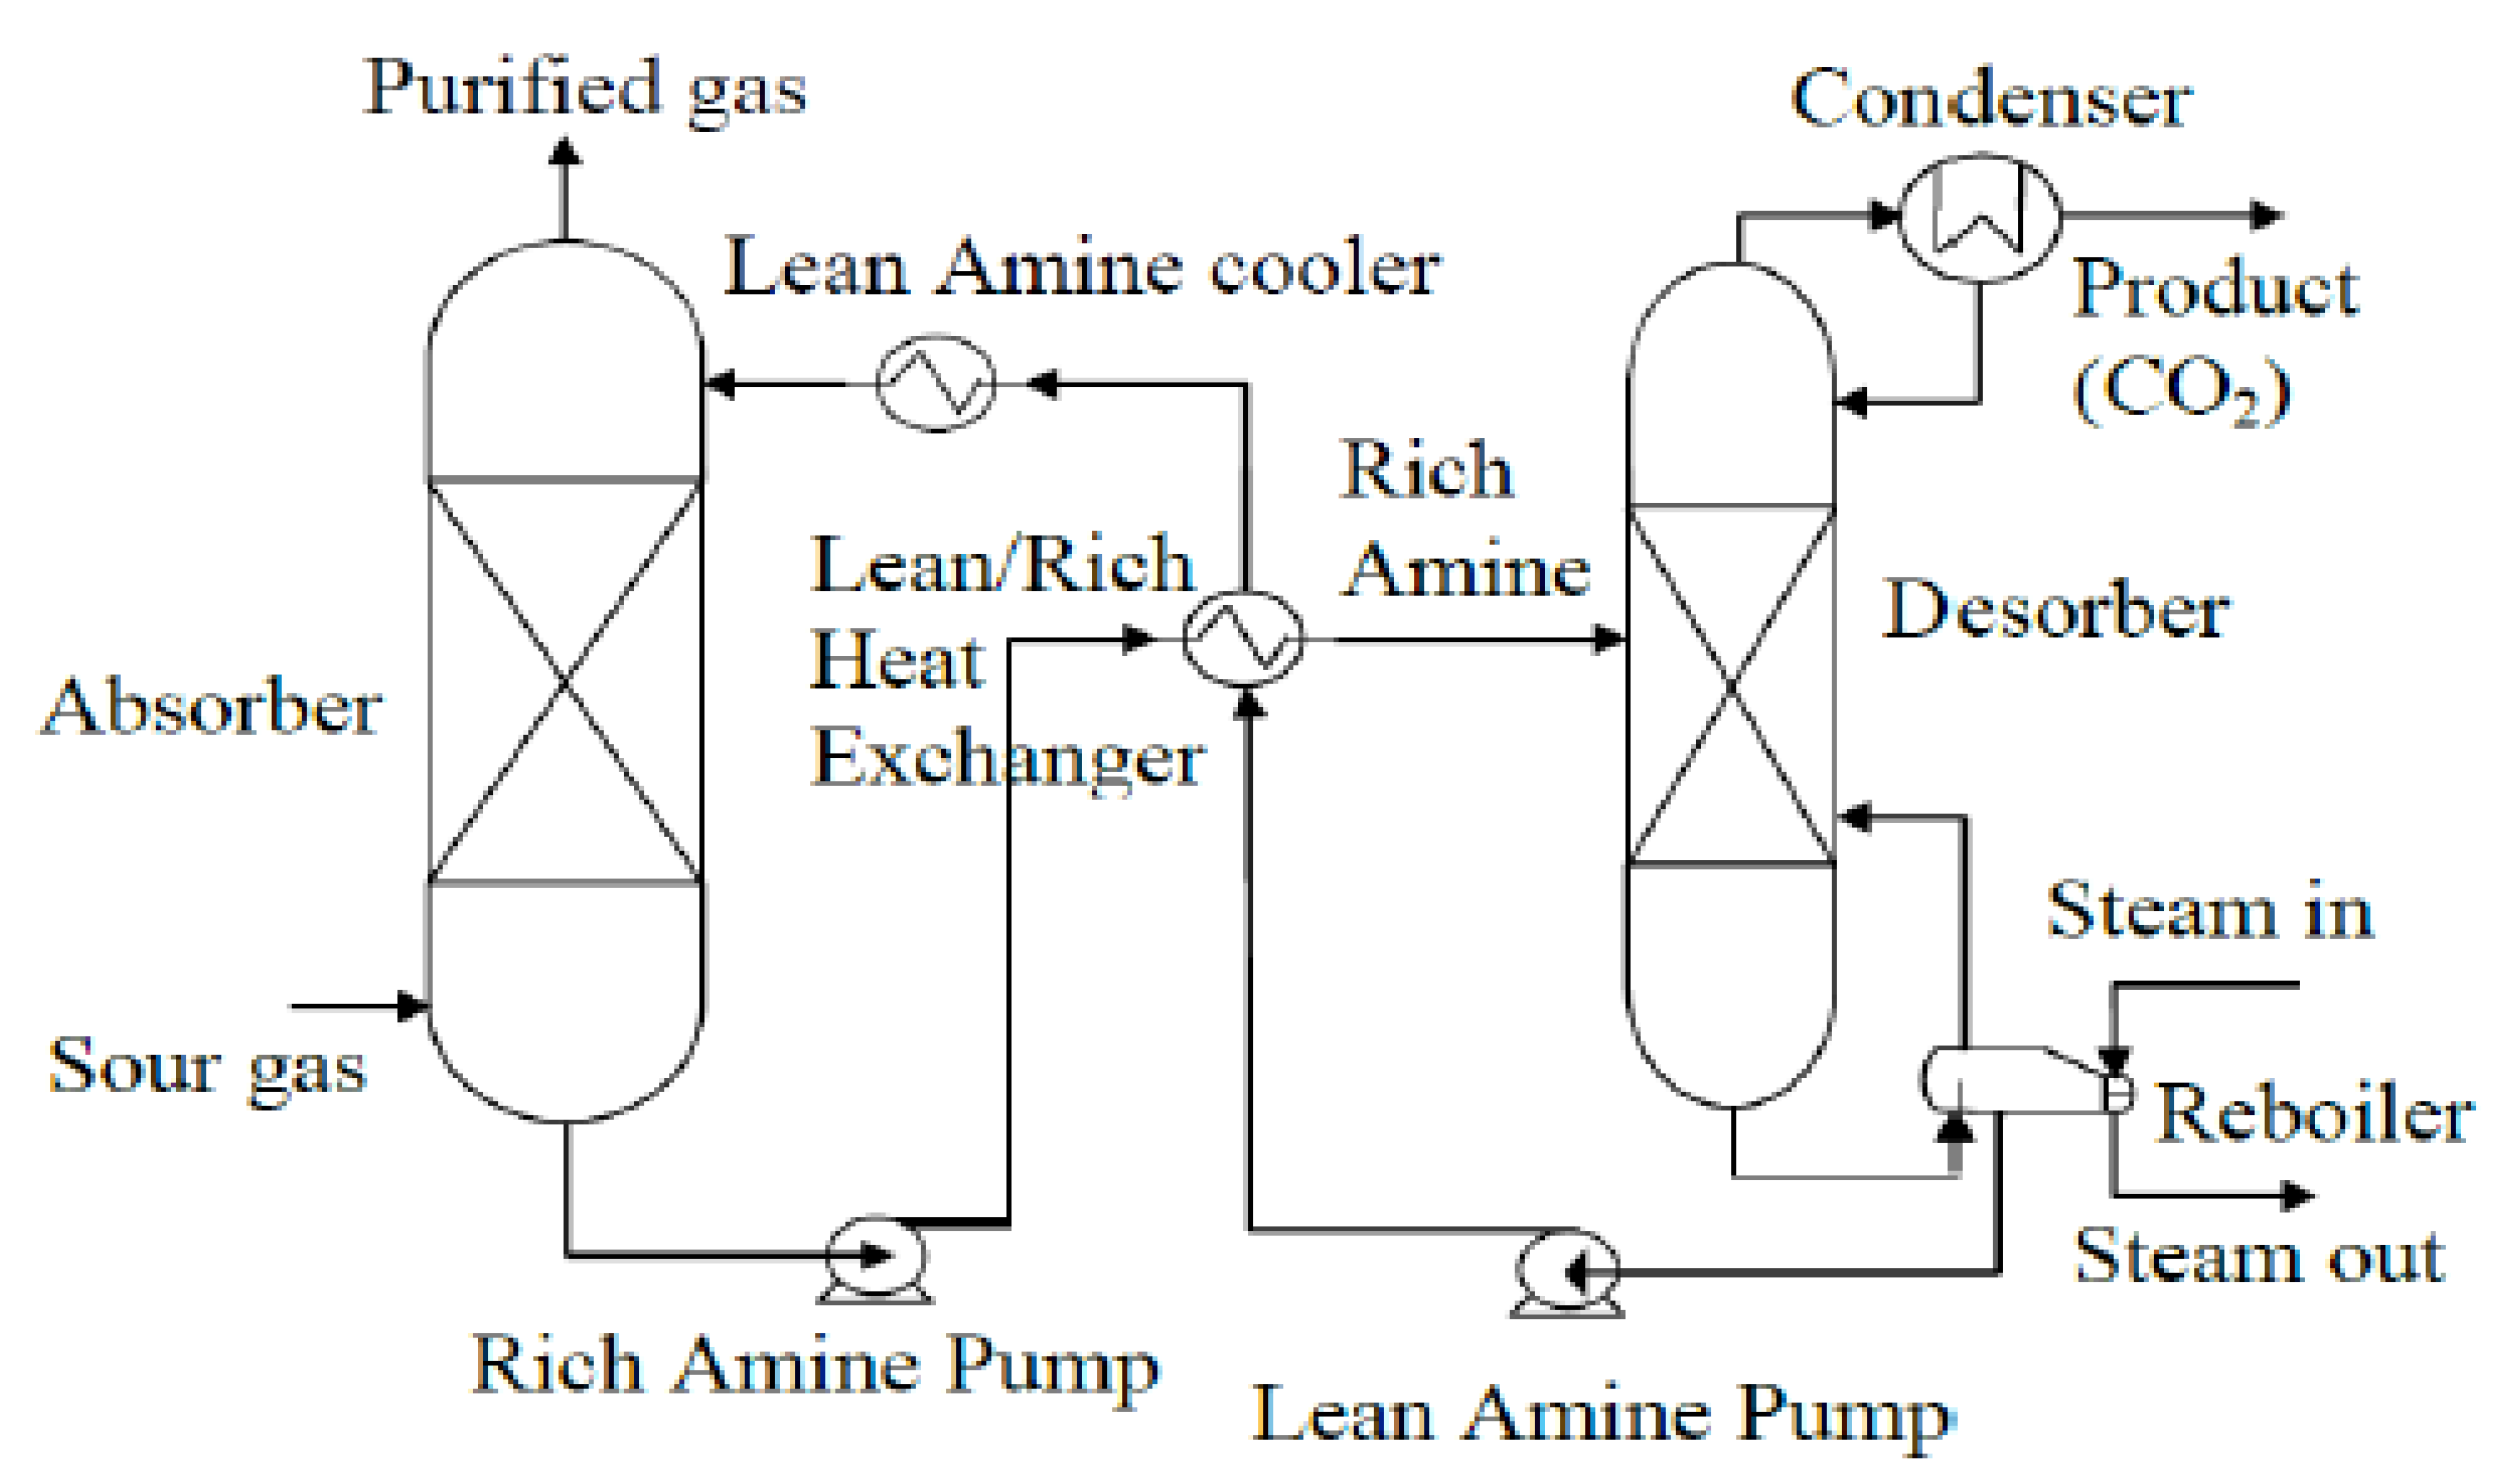
Figure 1. Process flow diagram of a standard amine-based CO2 capture process [3].
Chemengineering 06 00028 g001
Figure 2. Aspen HYSYS flow sheet for the base case simulation.
Chemengineering 06 00028 g002
Figure 3. Equipment cost for CO2 capture plant.
Chemengineering 06 00028 g003
Figure 4. Operation cost for the base case study.
Chemengineering 06 00028 g004
Figure 5. Sensitivity analyses for minimum temperature approach, ΔTmin (first optimization).
Chemengineering 06 00028 g005
Figure 6. Sensitivity analysis for minimum temperature approach, ΔTmin (second optimization).
Chemengineering 06 00028 g006
Figure 7. Steam consumption for ΔTmin sensitivity analyses (second optimization).
Chemengineering 06 00028 g007
Figure 8. Sensitivity analyses for CO2 capture efficiency (first optimization).
Chemengineering 06 00028 g008
Figure 9. Sensitivity analyses for CO2 capture efficiency (second optimization).
Chemengineering 06 00028 g009
Figure 10. Total annual cost and CO2 captured for optimum efficiency analysis.
Chemengineering 06 00028 g010
Figure 11. Steam consumption in sensitivity analyses for optimum efficiency (second optimization).
Chemengineering 06 00028 g011
Figure 12. Sensitivity analyses for absorber packing height.
Chemengineering 06 00028 g012
Figure 13. Steam consumption in sensitivity analyses for absorber packing height.
Chemengineering 06 00028 g013
Table 1. Aspen HYSYS model parameters and specifications for the base case alternative.
ItemsSpecifications (Unit)Value
Inlet Flue GasTemperature (°C)60
Pressure (kPa)101
Molar flow rate (kmol/h)17,110
O2 content (mole%)9
CO2 content (mole%)7.5
H2O content (mole%)6.7
N2 content (mole%)76.8
Flue gas to absorberTemperature (°C)40
Pressure (kPa)111
Lean MEATemperature (°C)45
Pressure (kPa)101
Molar flow rate (kmol/h)42,110
MEA content (W%)29.48
CO2 content (W%)5.58
AbsorberNumber of stages 20
Murphree efficiency (%)15
Rich amine pump pressure (kPa)200
Rich amine temp. out of Lean/Rich HEx (°C)102.9
DesorberNumber of stages in stripper8
Murphree efficiency (%)50
Reflux ratio in the desorber0.3
Reboiler temperature (°C)120
Pressure (kPa)200
Table 2. Cost-inflation indexes: 2019–2021 [20].
YearCost-Inflation Index
2019289
2020301
2021317
Table 3. OPEX assumptions and specifications [15].
ItemSymbolUnitValue
Operating lifetimen(Years)25 1
Operating hours p-(h/year)8000
Discount rater(%)8
Exchange rate-(NOK/EUR)9.8
Electricity cost-(EUR/kWh)0.06
Steam cost-(EUR/kWh)0.015
Cooling water cost-(EUR/m3)0.022
Water process cost-(EUR/m3)0.203
MEA cost-(EUR/m3)1516
Maintenance cost-(EUR/year)3% of CAPEX
Operator cost-(EUR/year)80,414 (×6 operators)
Engineer cost-(EUR/year)156,650 (1 engineer)
1 2 years construction + 23 years operation.
Table 4. Exponent derivation results from the sensitivity analysis of “the absorber packing height” data set.
EquipmentMaterialCapacity Unit SizeCost (kEUR)Data PointsExponent FactorR2
Lean HExSS316m2322.7177.390.710.960
Lean/rich HExSS316m28258.13311.691.070.992
CondenserSS316m266.948.690.70.985
ReboilerSS316m23050.41430.290.860.981
PumpSS316kW26.460.990.750.989
FanCSkW1020.3528.790.230.937
Table 5. Exponent derivation results from the sensitivity analysis of “the CO2-efficiency and the ΔTmin” data set.
EquipmentMaterialCapacity Unit SizeCost (kEUR)Data PointsExponent FactorR2
Lean HExSS316m2251.2150.8200.770.972
Lean/rich HExSS316m25890.32344.1201.000.999
CondenserSS316m278.157.8200.670.943
ReboilerSS316m23056.71396.3200.980.997
PumpSS316kW25.860.2201.020.999
Table 6. Comparison of simulation results with literature.
StudyCO2 Capture Rate (%)CO2 Concentration (mol%)ΔTmin (°C)Absorber Packing Height (m)Reboiler Duty (kJ/kg)
This work (Base Case)907.510203654
Ali et al. [14]9022–2810153970
Aromada et al. [3]853.7310203600
Øi et al. [13]9017.810123500
Amrollahi et al. [25]903.88.5133740
Sipöcz et al. [26]904.21026.9 *3930
Nwaoha et al. [27]9011.51022 (36 Stages)3860
* Not defined whether it is packing height or total column height.
Publisher’s Note: MDPI stays neutral with regard to jurisdictional claims in published maps and institutional affiliations.