Article

Thermal Decomposition Kinetic Study of Non-Recyclable Paper and Plastic Waste by Thermogravimetric Analysis

by
Ahmad Mohamed S. H. Al-Moftah
*,
Richard Marsh
and
Julian Steer
Cardiff School of Engineering, Cardiff University, Queen’s Buildings, The Parade, Cardiff CF24 3AA, UK
*
Author to whom correspondence should be addressed.
ChemEngineering 2021, 5(3), 54; https://doi.org/10.3390/chemengineering5030054
Submission received: 11 July 2021 / Revised: 9 August 2021 / Accepted: 20 August 2021 / Published: 30 August 2021
(This article belongs to the Special Issue Feature Papers in Chemical Engineering)

Abstract

:
The global net emissions of the Kyoto Protocol greenhouse gases (GHG), such as carbon dioxide (CO2), fluorinated gases, methane (CH4), and nitrous oxide (N2O), remain substantially high, despite concerted efforts to reduce them. Thermal treatment of solid waste contributes at least 2.8–4% of the GHG in part due to increased generation of municipal solid waste (MSW) and inefficient treatment processes, such as incineration and landfill. Thermal treatment processes, such as gasification and pyrolysis, are valuable ways to convert solid materials, such as wastes into syngas, liquids, and chars, for power generation, fuels, or for the bioremediation of soils. Subcoal™ is a commercial product based on paper and plastics from the source segregated waste that is not readily recyclable and that would otherwise potentially find its way in to landfills. This paper looks at the kinetic parameters associated with this product in pyrolysis, gasification, and combustion conditions for consideration as a fuel for power generation or as a reductant in the blast furnace ironmaking process. Thermogravimetric Analysis (TGA) in Nitrogen (N2), CO2, and in air, was used to measure and compare the reaction kinetics. The activation energy ( E a ) and pre-exponential factor A were measured at different heating rates using non-isothermal Ozawa Flynn Wall and (OFW) and Kissinger-Akahira-Sonuse (KAS) model-free techniques. The TGA curves showed that the thermal degradation of Subcoal™ comprises three main processes: dehydration, devolatilization, and char and ash formation. In addition, the heating rate drifts the devolatilization temperature to a higher value. Likewise, the derivative thermogravimetry (DTG) results stated that Tm degradation increased as the heating rate increased. Substantial variance in E a was noted between the four stages of thermal decomposition of Subcoal™ on both methods. The E a for gasification reached 200.2 ± 33.6 kJ/mol by OFW and 179.0 ± 31.9 kJ/mol by KAS. Pyrolysis registered E a values of 161.7 ± 24.7 kJ/mol by OFW and 142.6 ± 23.5 kJ/mol by KAS. Combustion returned the lowest E a values for both OFW (76.74 ± 15.4 kJ/mol) and KAS (71.0 ± 4.4 kJ/mol). The low E a values in combustion indicate shorter reaction time for Subcoal™ degradation compared to gasification and pyrolysis. Generally, TGA kinetics analysis using KAS and OFW methods show good consistency in evaluating Arrhenius constants.

1. Introduction

Greenhouse effects play a valuable role in trapping heat in the atmosphere to keep the earth warm. Excessive release of GHG, such as CO2, CH4, and N2O, due to increased commercial activities is invariably attributed to global warming and related climatic changes [1]. Global commitments to reduce GHG emissions and related temperature levels to pre-industrialised levels remain futile due to the slow enactment of necessary policies to reach net-zero emissions. In spite of 1260 Climate Acts across the globe and commitment by at least 20 countries to achieve net-zero emission in the next few decades, GHG emissions have maintained upward mobility [2]. The exponential demand for energy from 8588.9 million tonnes (Mtoe) to 13,147.3 Mtoe between 1995 and 2015 presents a microcosm of the future challenges posed to the Kyoto Protocol and the Paris Agreement to reduce GHG emissions to near net-zero from the current highs of 50 billion metric tonnes [3]. The composition of the GHG emissions vary considerably across the hierarchy of energy sources with fossil fuel contributing the lion share of 80%. Waste-to-energy and solid waste management practices account for 2.8–4% of the global environmental burden [4,5].
There is an increasing need to get the best use of solid wastes or biomass in thermal decomposition processes, such as pyrolysis, gasification, and combustion [6]. These processes can be utilised to decrease the reliance on fossil fuels and GHG emissions [7,8,9]. In a country, such as Qatar, the main practice of MSW management is landfilling, nevertheless owing to limited land availability, and this solution is increasingly not practical. Every year Qatar generates about 2.5 million tons of MSW corresponding to 1.5 kg per person per day [10]. Therefore, recycling of MSW to consumable materials and recovering energy are the more favourable options [11,12].
Subcoal is made from paper and plastics which are leftover from source segregated recycling waste that is deemed ‘non-recyclable’ after passing through municipal refuse processing facilities. The product has been considered as a high grade of solid recovered fuel (SRF), which can be converted into syngas and liquid fuels through the gasification process [13]. Alternatively, the high carbon and hydrogen content in Subcoal™ means that it is potentially suitable for consideration as an alternative reductant for ironmaking in a blast furnace, where it could either be injected directly, after milling, through tuyeres, or pre-gasified and fed directly into the furnace that way.
The understanding of pyrolysis, gasification or combustion kinetics of Subcoal is important for chemical reactions and mechanical designs of gasifier reactors [14,15]. In this work, the kinetic parameters were evaluated in non-isothermal TGA under N2, CO2, and air atmosphere using Ozawa Flynn Wall (OFW) and the Kissinger-Akahira-Sonuse (KAS) model-free approaches. In addition, this is the first research paper studying the thermal and kinetic behaviours of Subcoal™ PAF using TGA. The thermal degradation (DTG) was carried out, and the conversion degree of Subcoal™ PAF was determined as a function of temperature. The E a of Subcoal™ PAF were compared with other similar solid waste and biomass examples from the literature.

2. Materials and Methods

2.1. Materials

Subcoal™ has been supplied by the international N+P Group B.V. (Bergen, The Netherlands). It is usually supplied in the form of pellets, but, for the purposes of this study, the Pulverised Alternative Fuel (PAF) has been used as a milled product as a powder <3 mm particle size. The outcomes of the proximate and ultimate analysis of Subcoal™ are listed in Table 1.
Thermogravimetry (TG) and the DTG was performed in a Mettler Toledo analyser (TGA/SDTA 851e) between temperature range of 25 °C to 900 °C. The effect of heating rates on the thermal decomposition process was examined and compared with the literature by adopting four heating rates: 5, 10, 15, and 20 °C/min. A crucible was made of alumina. To make sure the sample is well distributed, the crucible was gently tapped on a solid surface. Pyrolysis was performed under a N2 flow rate of 50 mL/min, while gasification was performed under CO2 flow rate of 100 mL/min and combustion was performed under air flow rate of 100 mL/min atmosphere. The flow rate setting for different gases was chosen based on the optimum operating condition of the TGA instrument and to compare the result with the literature.
Sample weight loss was continuously recorded against the temperature to obtain the TGA curve that was derived later for the first-order derivative to get the DTG curve. All experiments were repeated three times to eliminate experimental errors and to check the reproducibility of all experiments.

2.2. The Measurement of the Kinetic Parameters of the Reaction

The reaction kinetics depend on reactant concentrations, temperature, pressure, and the presence of catalysts. Among reaction kinetics components, rate of reaction (r), which describes the reaction speed, is expressed as follows:
r [ B ] n ,
where [ B ] is a reactant concentration, and n the reaction overall order. The rate of reaction is proportional to the reaction constant ( k ):
r = k [ B ] n ,
d [ A ] d t = k [ B ] n .
The response of reaction to the change in these factors is determined by the reaction constant ( k ). The value of k changes with temperature based on the mathematical correlation initially proposed by Arrhenius [16]:
k = A   e E a   R T .
Both ( E a ) and ( A ) are known as kinetic constants and independent on temperature. As the measurement of reactant concentration is unachievable during the process, reactant concentration [B] can be expressed as a function of fractional conversion ( x ). Therefore, the rate of reaction in Equation (3) can be given in the following expression:
d x d t = k ( T ) f ( x ) .
The f ( x ) represents the overall gasification reaction model. By combining Equations (4) and (5), the following equation is obtained:
d x d t = [ A   e E a   R T ] f ( x ) .
The sample mass loss from the analysis is used to calculate the conversion (x) based on the following formula:
x = m o m t m o m f .
The initial sample mass is given by m o , the measured mass m o as it changes, and m f , the final mass after complete conversion. Therefore, data of conversion degree, heating rate and temperature are then used by a kinetic analysis method to determine the kinetic parameters.

2.3. Ozawa–Flynn–Wall (OFW) Method

The OFW method is an iso-conversational and integral model free method that includes measurement of the temperature at given values of conversion at various heating rates [17]. In this method, Equation (9) is integrated utilizing Doyle’s approximation to evaluate the kinetic constants.
l n ( β ) = l n ( A   E a R   g ( x ) ) 4.9575 1.052 E a R T .
The E a can be obtained from the slope by plotting term l n ( β ) against 1 T , where the term ln ( A   E a R   g ( x ) ) 4.9575 is the integration constant that can be determined from the y-intercept. The following relationship can be used to determine A for known values of x and E a :
A = β   R E a   ( l n [ 1 x ] )   10 a ,
where a is a numerical integration constant based on the Doyle approximation.

2.4. Kissinger-Akahira-Sunose (KAS)

KAS is an alternative model free method that considers in the derivation the peak temperature ( T m ) at the maximum reaction rate value. Therefore, this method adopts the following equation to estimate the E a for different values of T m and β .
l n β T m 2 = l n ( R   A g ( x )   E a ) E a   R   T .
For a progressive value of conversion degree, the term ln β T m 2 is plotted against 1 T to give a straight-line slope of E a R ; hence, the apparent E a can be determined, while the value of A can be calculated from Equation (11).
A   ( β ) = β   E a R   T m 2   e E a R   T P .

3. Result and Discussion

3.1. Thermal Parameters

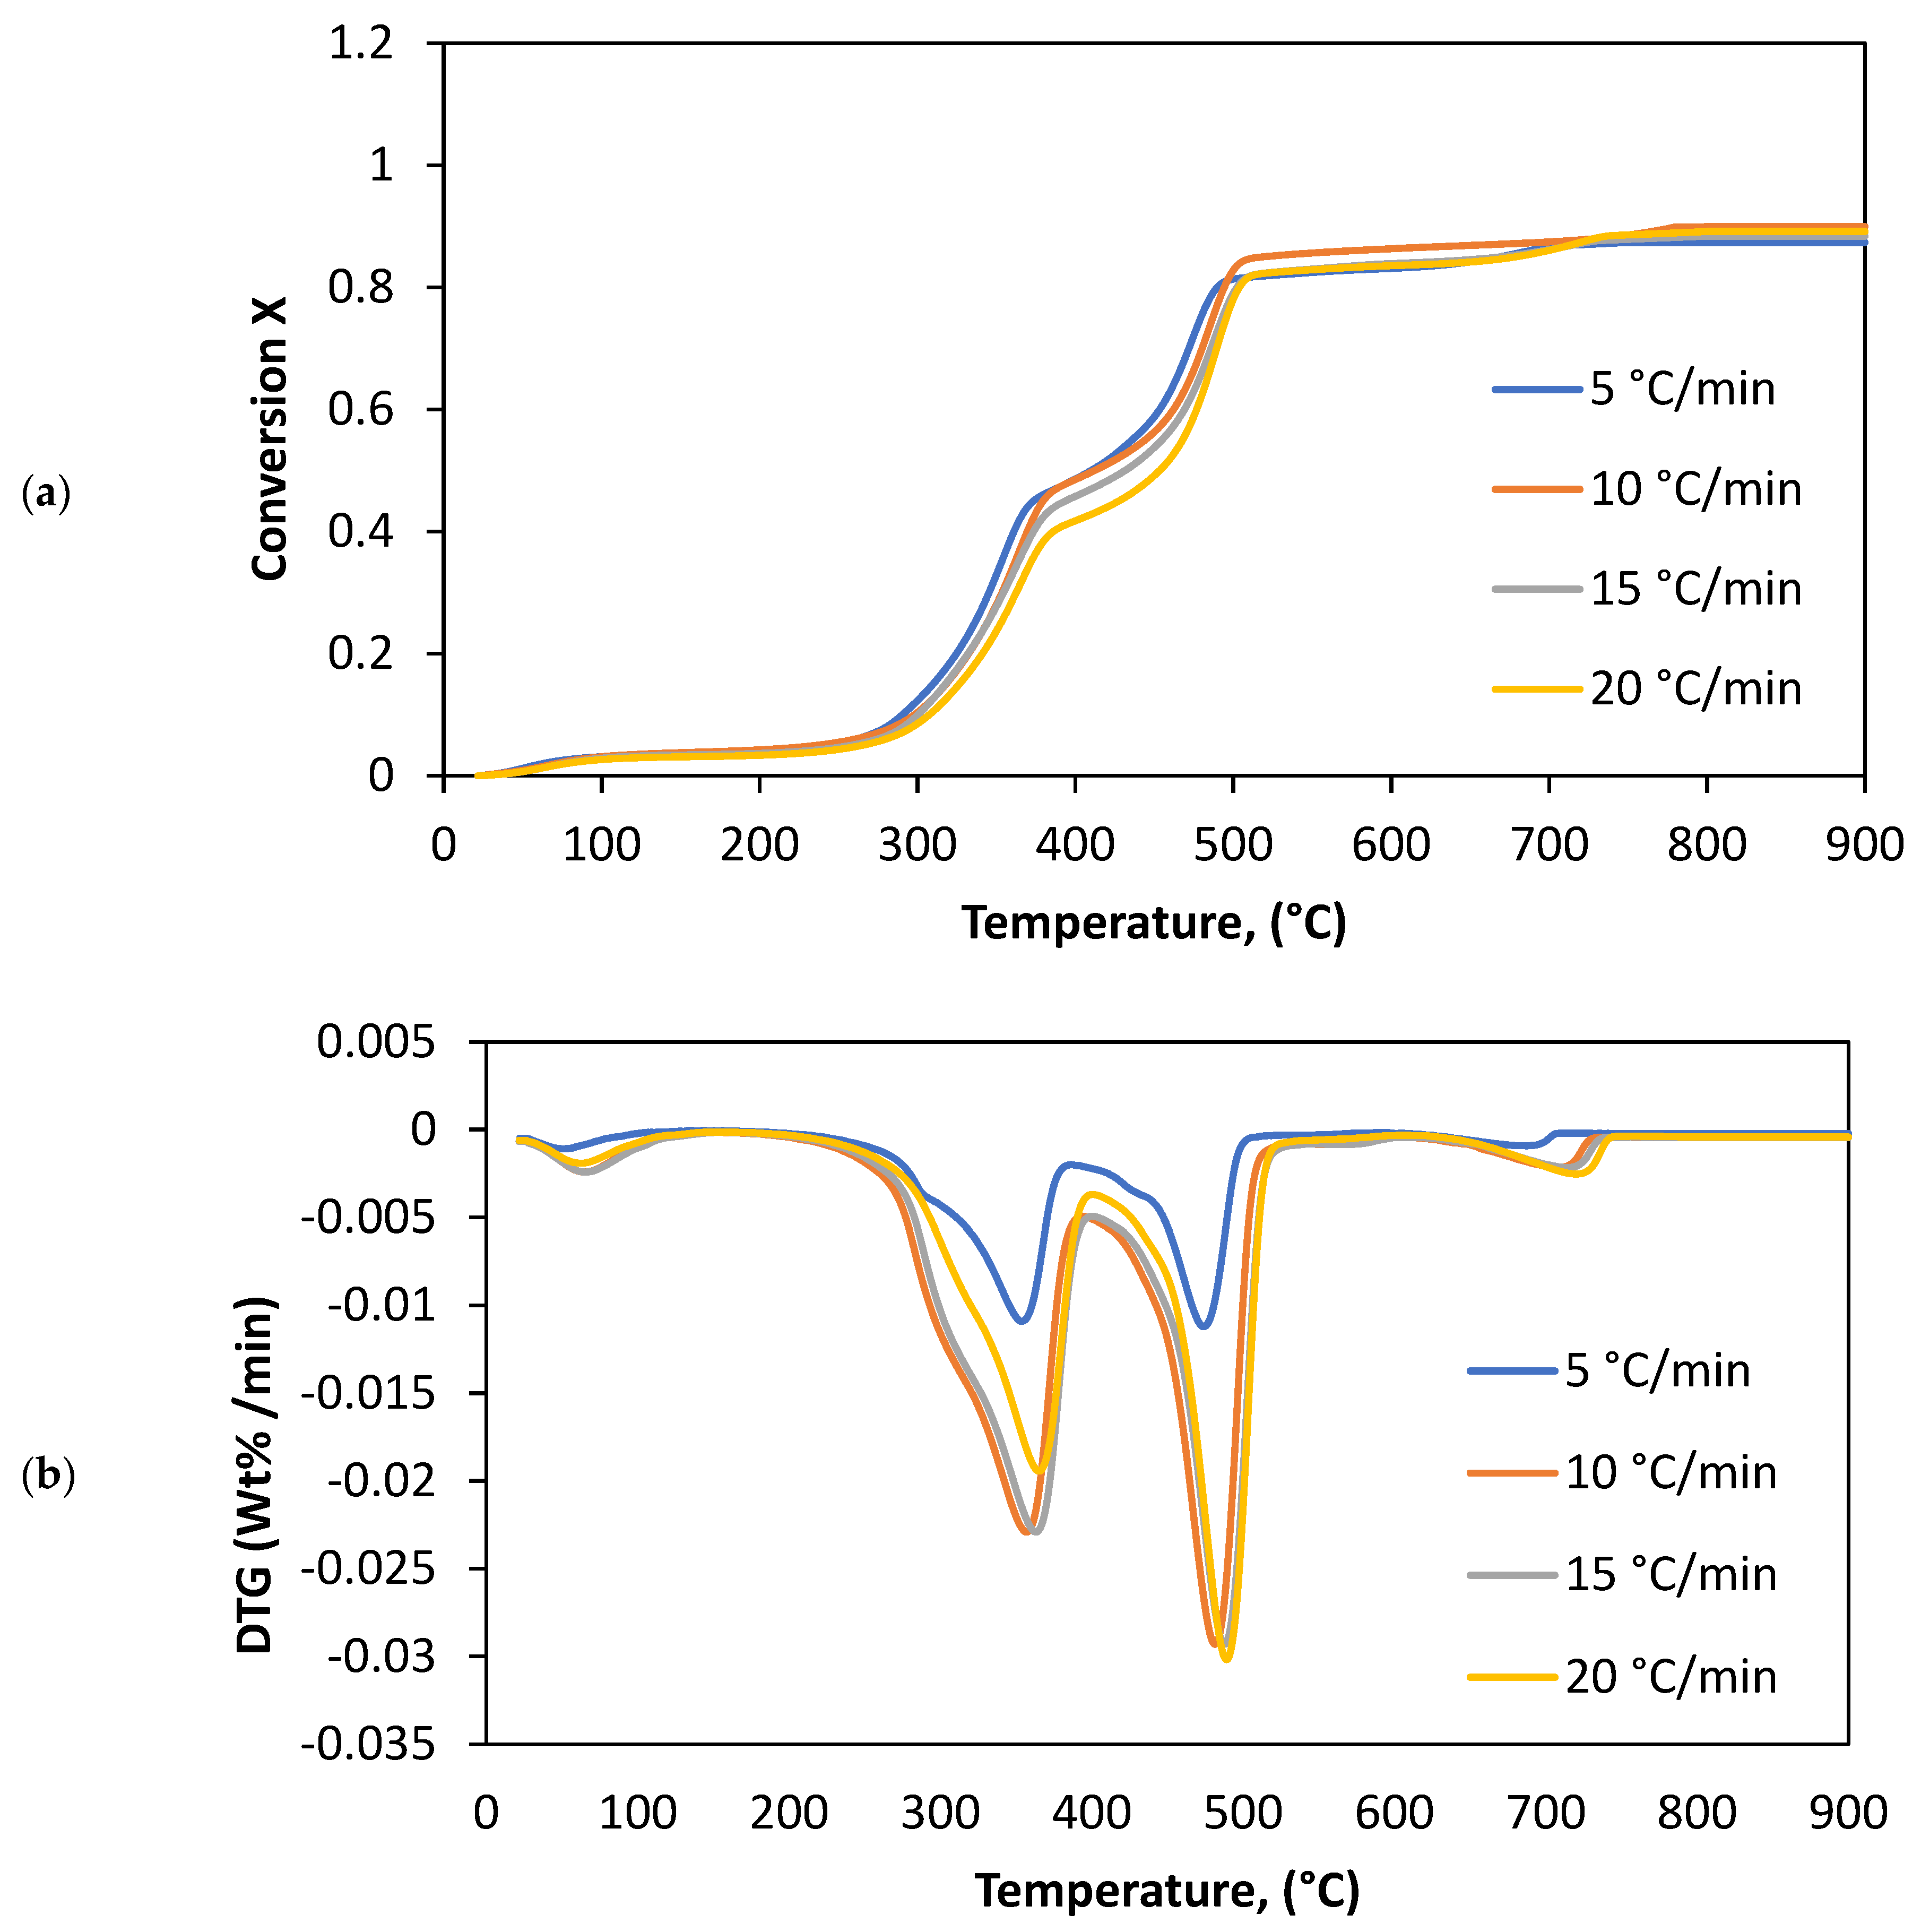
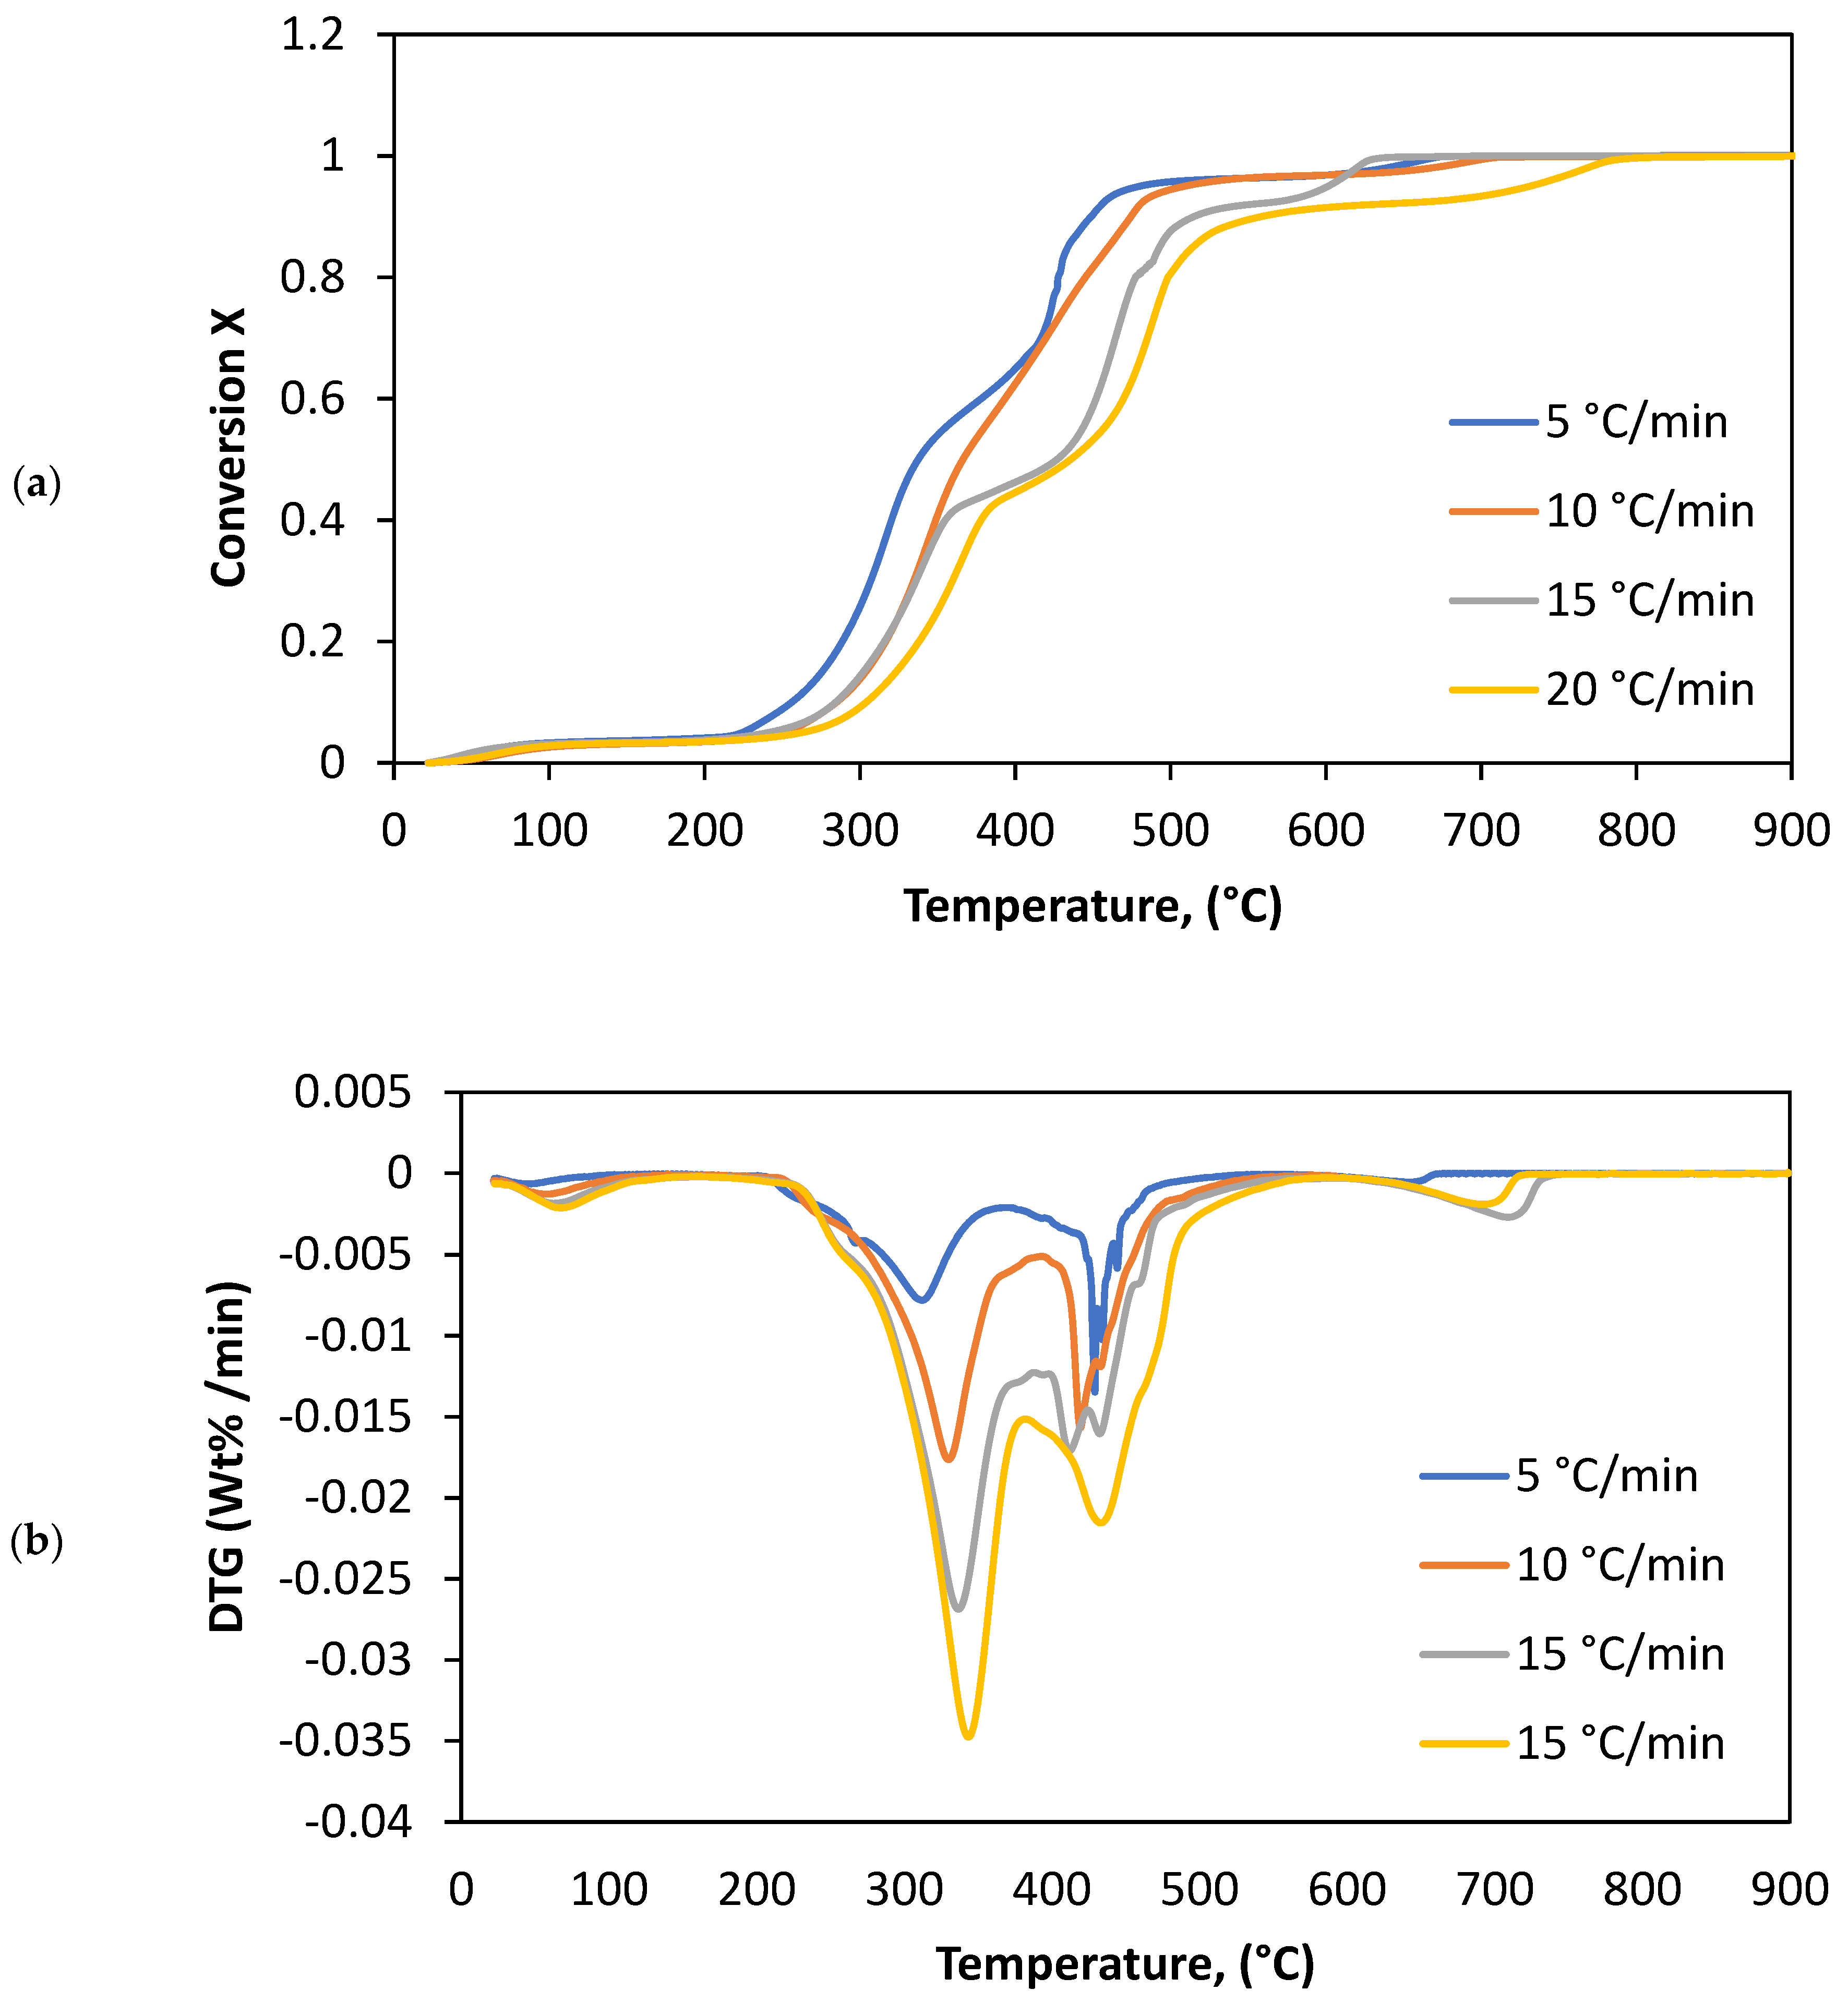
Figure 1, Figure 2 and Figure 3 display the reaction conversion (X) in (a) and show DTG weight loss (wt %/min) profile in (b) for different heating rates in N2, CO2, and air, respectively. The conversion is estimated as a reciprocal of the fractional mass loss. The higher the rate of conversion, the faster the thermal decomposition or rate of reaction. Table 2, Table 3 and Table 4 show thermal decomposition parameters of Subcoal™ PAF in N2, CO2, and air atmosphere. The results show that most of the sample material was converted to products in the temperature range of 250 °C to 550 °C as confirmed by Slopiecka et al., in 2012 [18]. The raising of heating rate shifts the curve of fractional extent conversion to a high temperature region. The heating rate increases the initial temperature of decomposition (Onset temperature) [19].
As the heating rates increases, the Tm within the sample rises, which leads to faster chemical reaction kinetics and Subcoal™ PAF conversion to gaseous products [20]. Moreover, the lower the heating rate, the longer the reaction residence time, and, hence, the lower amount of Subcoal™ PAF converts.
The conversion curve represents fourth stages of sample decomposition. In the first stage, for temperature less than 150 °C, it is during the dehydration process that the volatile material and moisture leave the sample with insignificant changes in the mass. Then, in the second and third stages, a region between 250 °C to 550 °C, which is known as active conversion, the sample losses most of its mass in the devolatilization process. In the final stage, only ash and char are left, which is less than 15% of the sample mass [21]. The weight slowly reduces in the first and the last stage, which is known as the passive reaction.
According to the DTG curves for Subcoal™ PAF under N2, CO2, and air at various heating rates, as the heating rate increase, the peaks become clearer and larger. The initial and the final temperature of the pyrolysis, gasification, and combustion stages are drifted with increase in heating rate. The results form TG and DTG illustrate that the thermal peak position is not fixed when the heating rate changed. The endothermic peaks, which are the decomposition reaction, are observed in the DTG curves at each tested heating rate [22]. The restriction of heat transmission from the surrounding to the test sample may explain the temperature shifting to higher values. At a high heating rate, the residence time of reaction is short, and the temperature needed to devolatilise becomes greater. However, when the process occurs at a low heating rate, the instantaneous thermal energy is high with a longer reaction time that makes the reaction temperature is lower [23]. Hence, its clearer to see that mass changes at higher heating rates.
Table 5 lists the maximum peak temperatures (Tm) at which there is the higher DTG (wt %/min). Tm increase with a heating rate increase during pyrolysis, gasification, and combustion process. The average standard deviation (±) values of peak temperature and degradation rate was calculated from the third run results.
The value of Tm increased from 471 ± 7 °C to 487.1 ± 1.1 °C, and DTGTM increased from −0.0094 ± 0.0014 wt %/min to −0.032 ± 0.006 wt %/min, for pyrolysis when the heating rate raised from 5 to 20 °C/min. In addition, Tm increased from 466 ± 5 °C to 488 ± 1.2 °C, and DTGTM increased from −0.0097 ± 0.0014 wt %/min to −0.032 ± 0.002 wt %/min, for gasification. However, combustion showing lowest temperature degradation results, Tm increased from 317 ± 4.2 °C to 340.3 ± 10.4 °C, and DTGTM increased from −0.0071 ± 0.0009 wt %/min to −0.016 ± 0.0082 wt %/min, thus the combustion process showing faster mass loss with lower Tm value due to high oxidation reaction. The rate of Subcoal™ PAF degradation DTG and Tm increased with the heating rate, which is coherent with the literature [24].
Comparing Subcoal™ PAF results in TGA to the literature, Gerassimidou et al., in 2020, found the N2 pyrolysis of SRF Tm = 500 °C and for paper waste Tm = 575 °C, at 20 °C/min. In addition, the pyrolysis results of paperboard show Tm = 732 °C, while the oxidation of SRF results show Tm = 600 °C. This result proves that thermal degradation of Subcoal™ pyrolysis and oxidation is lower than SRF, paper waste, and paperboard [25].

3.2. Kinetic Parameters

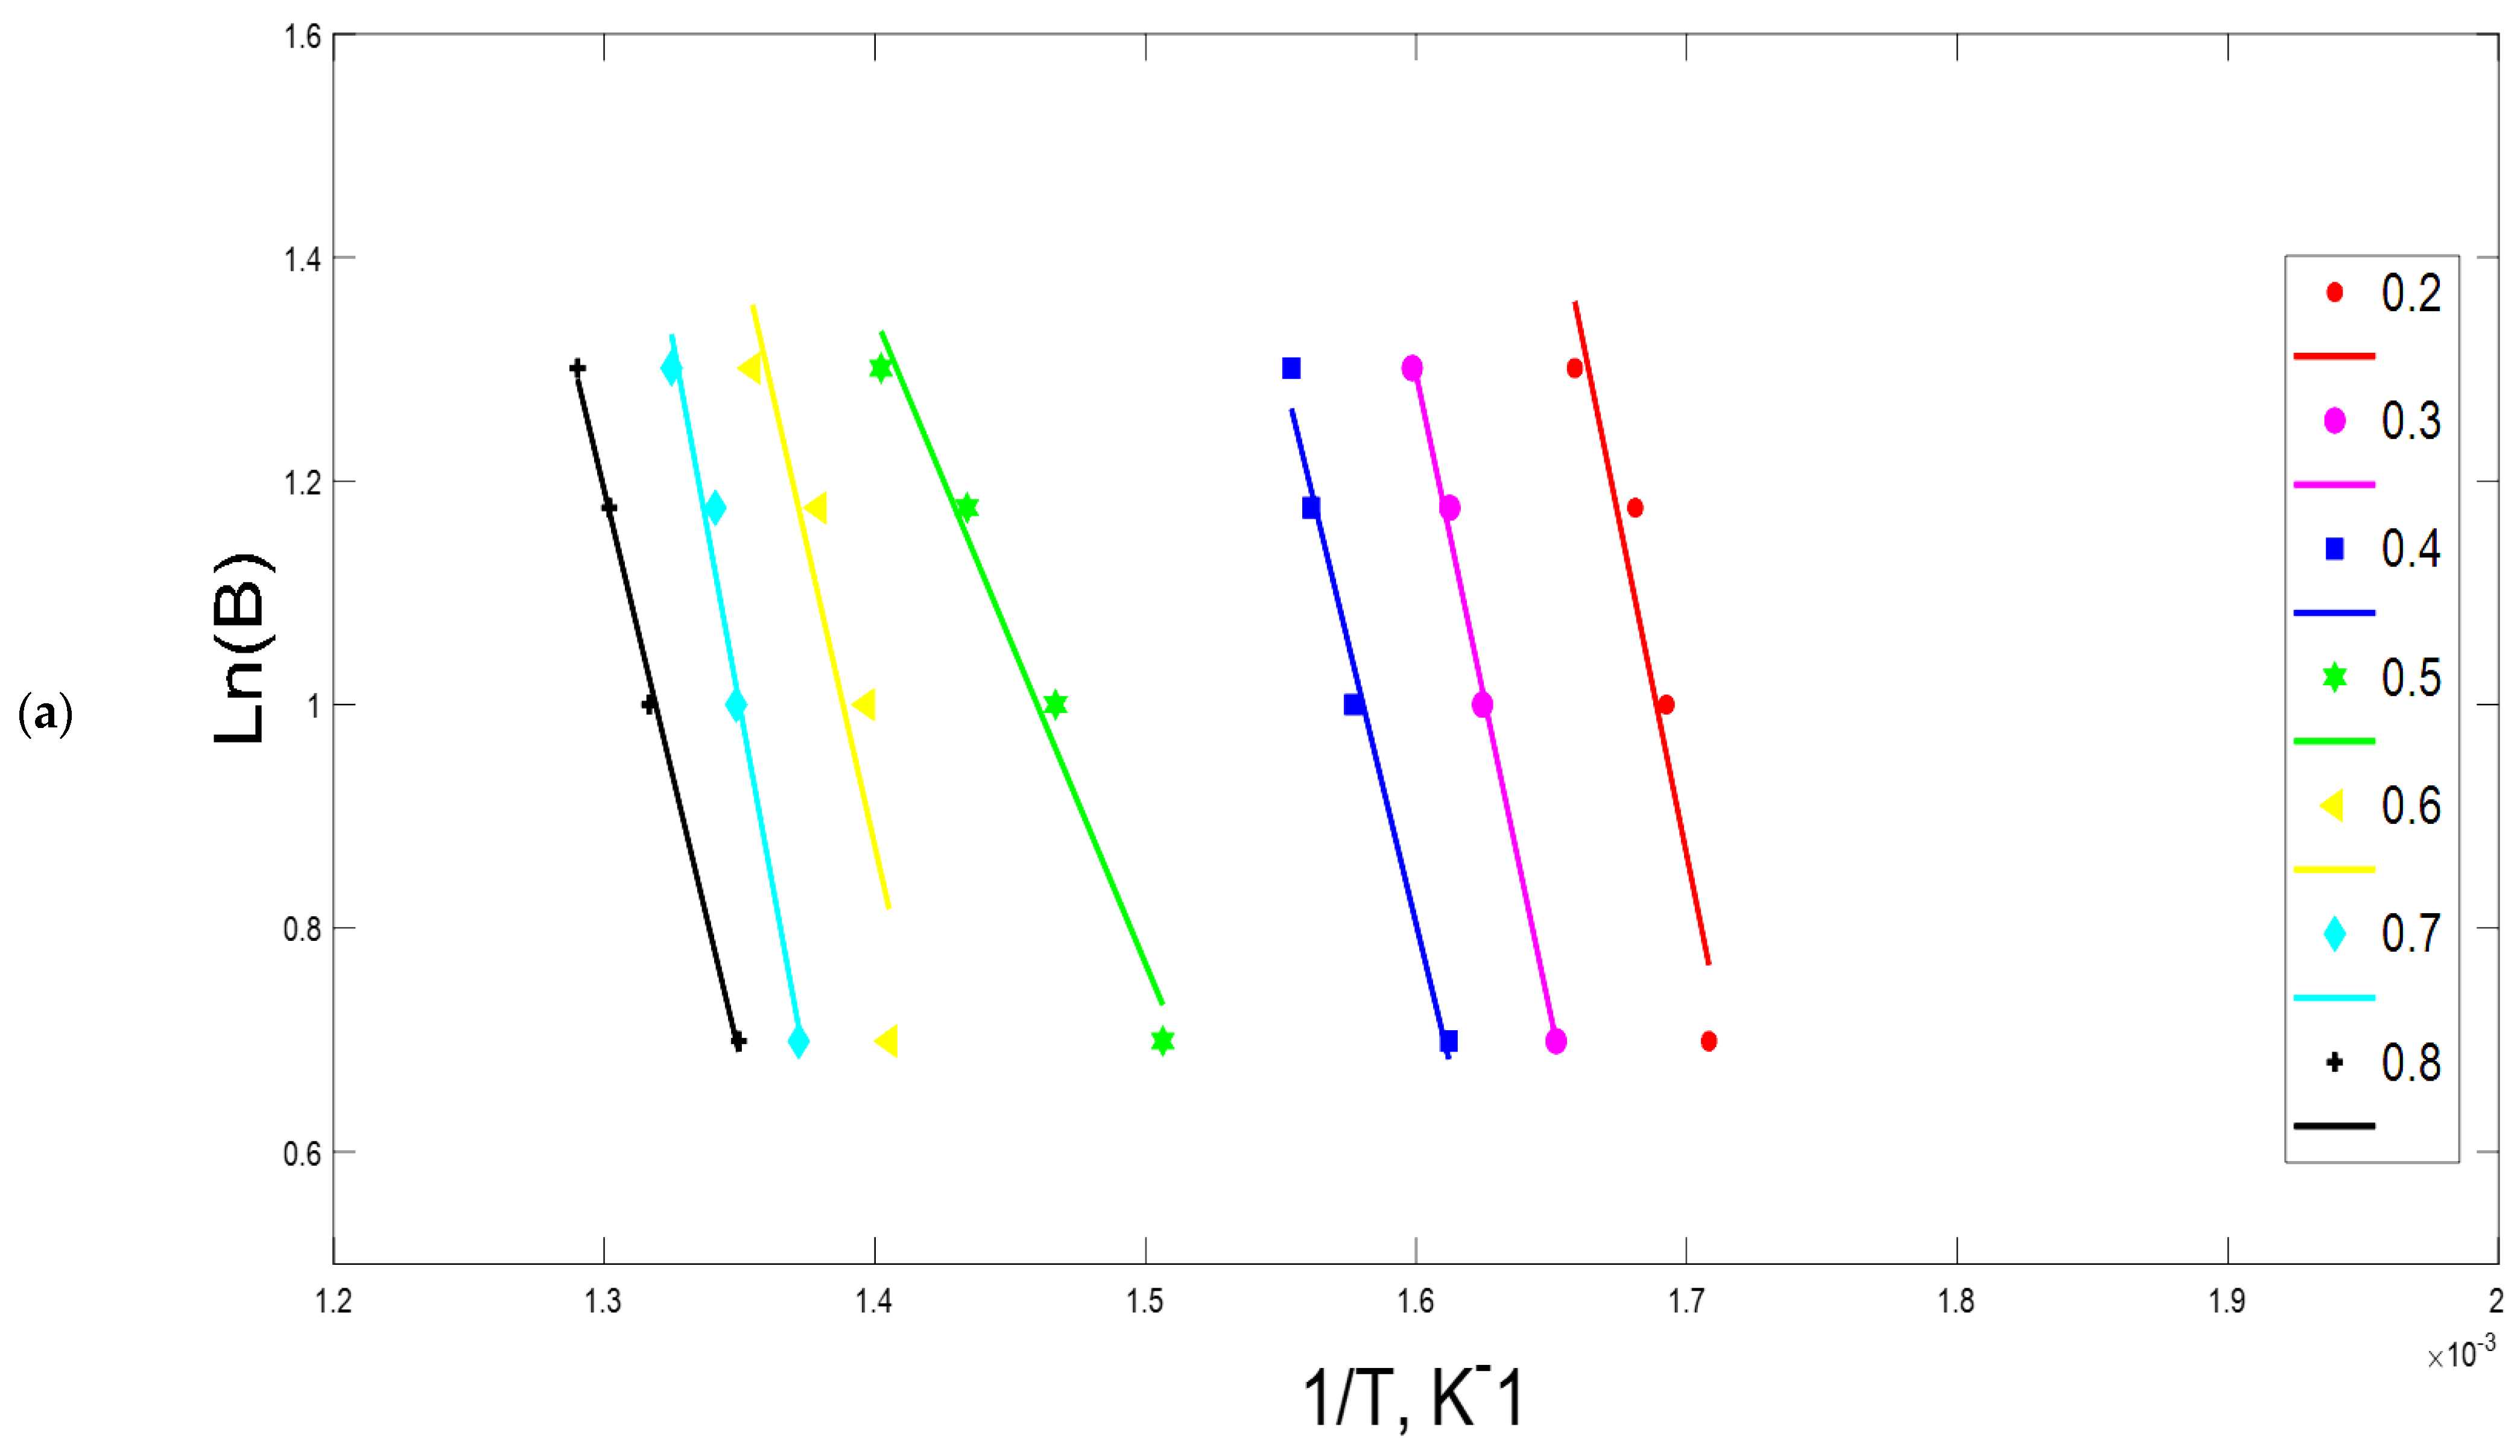
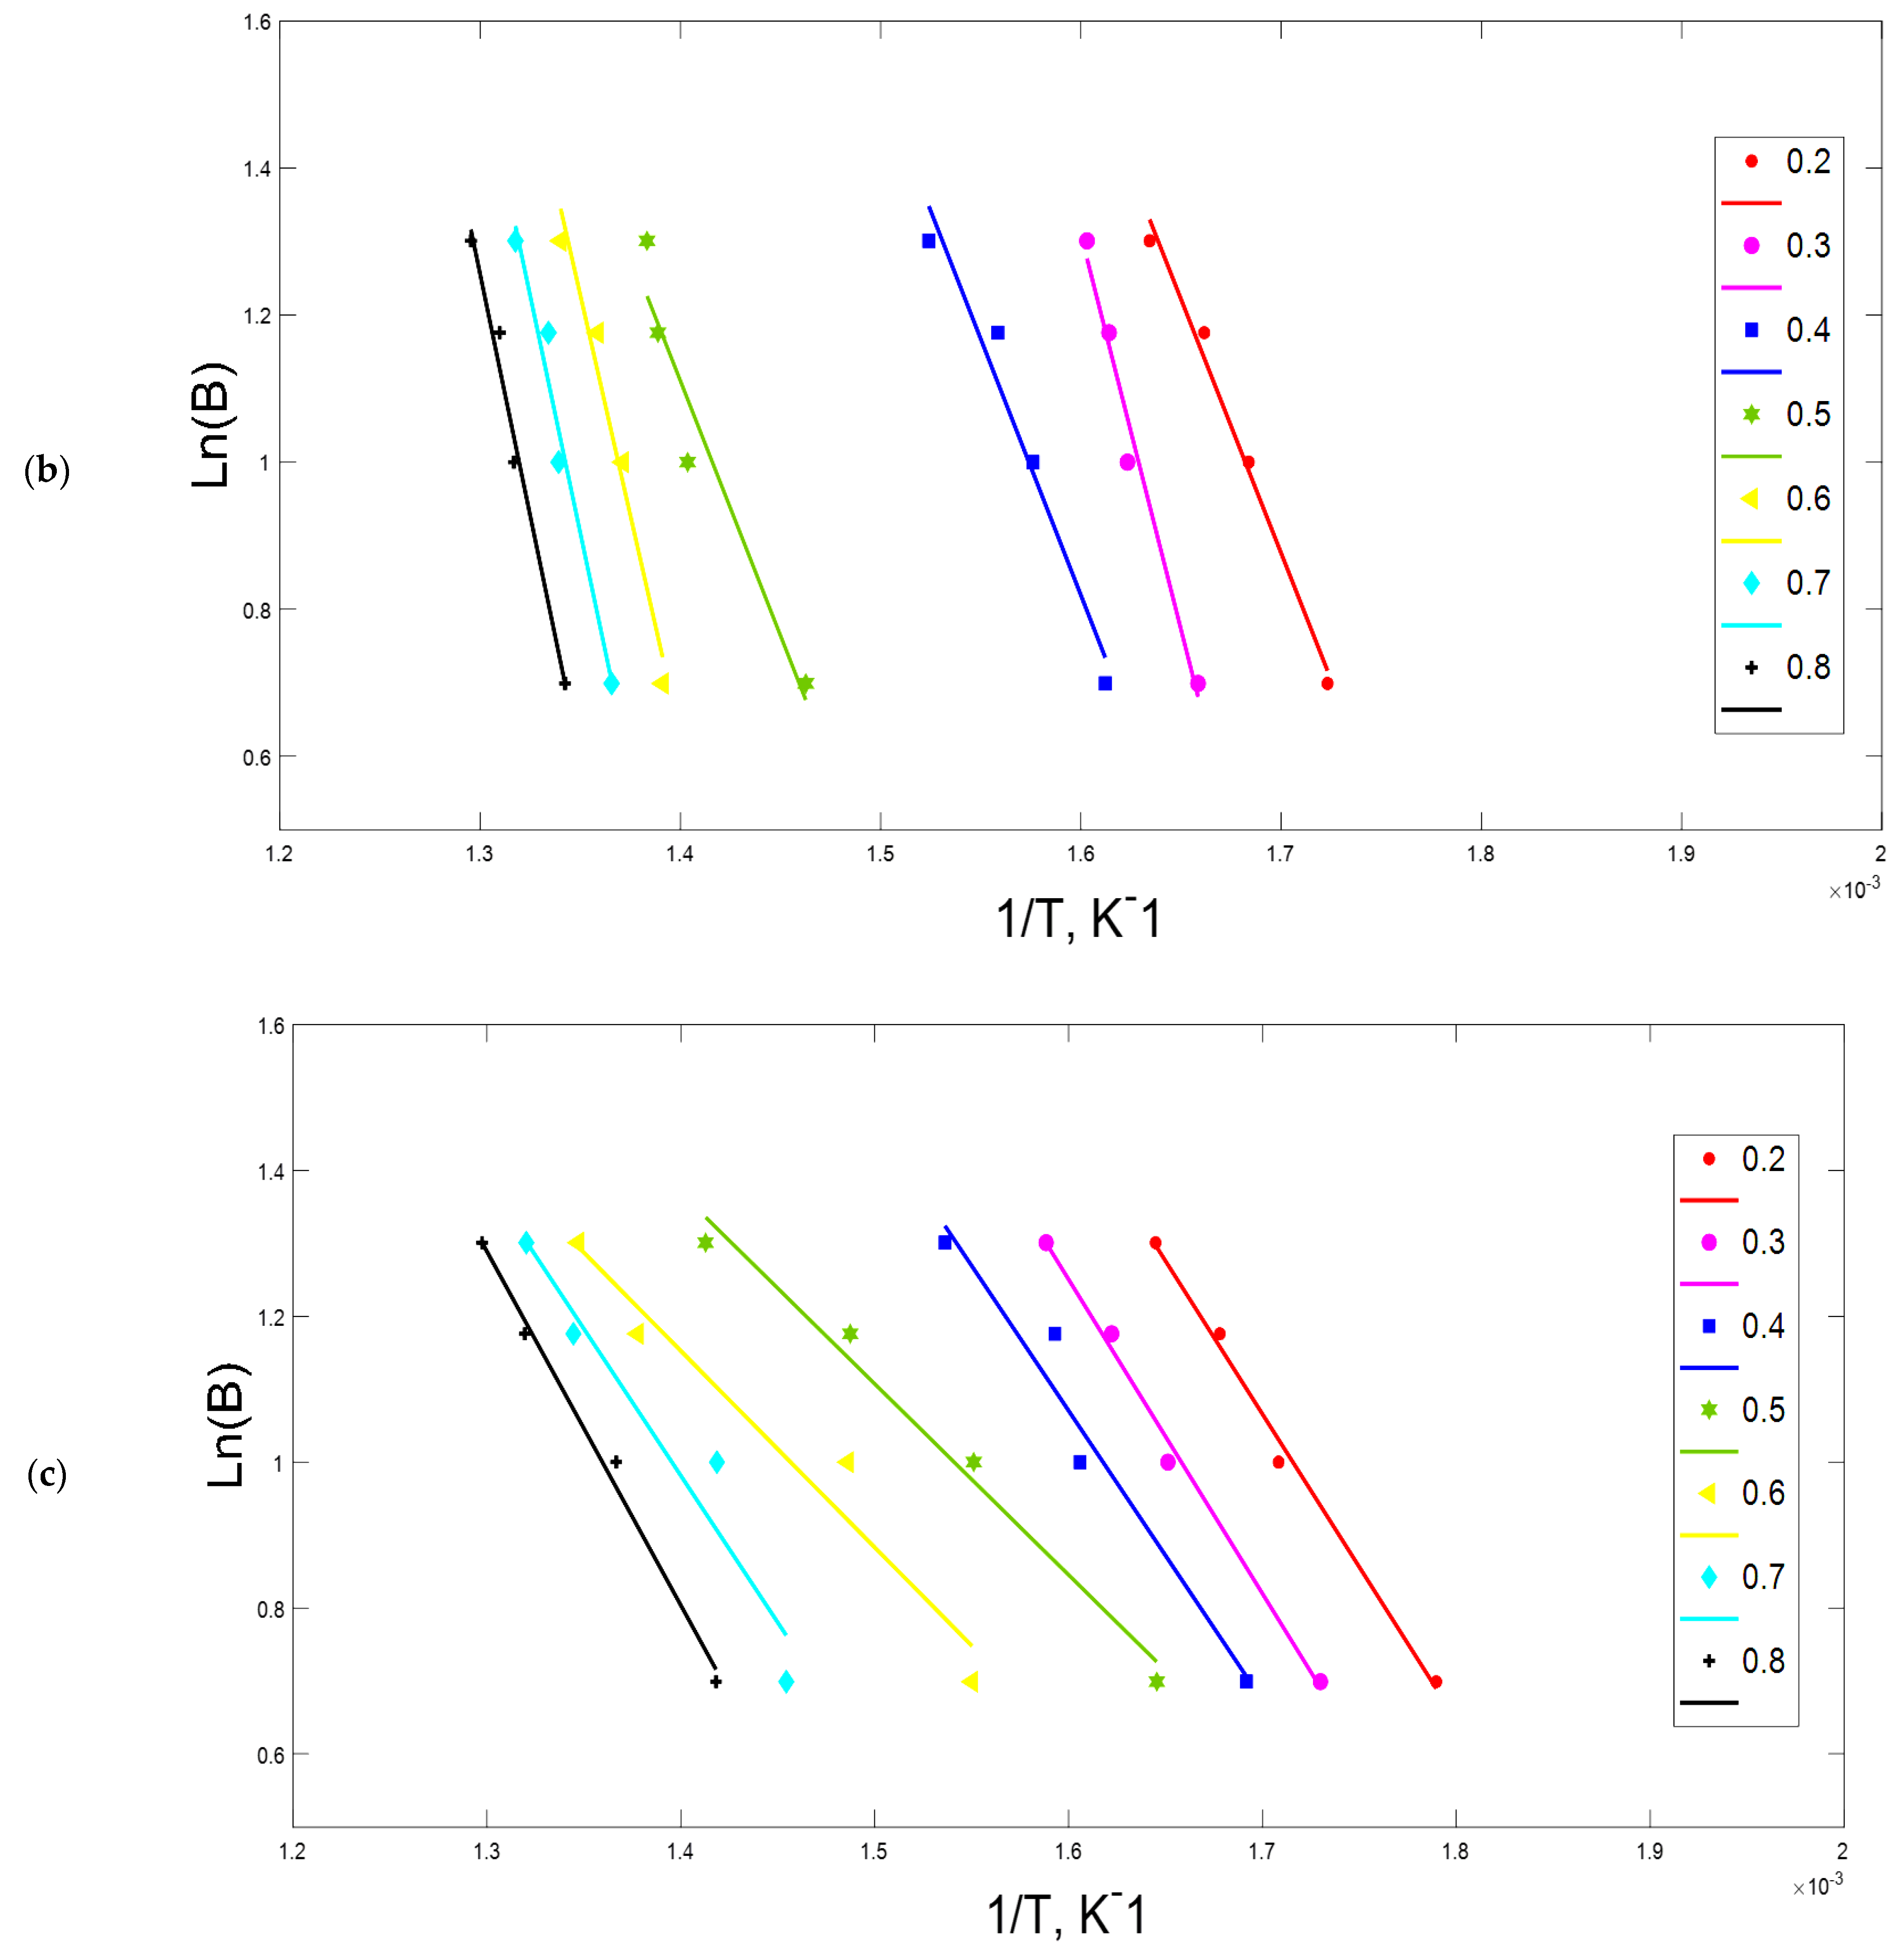
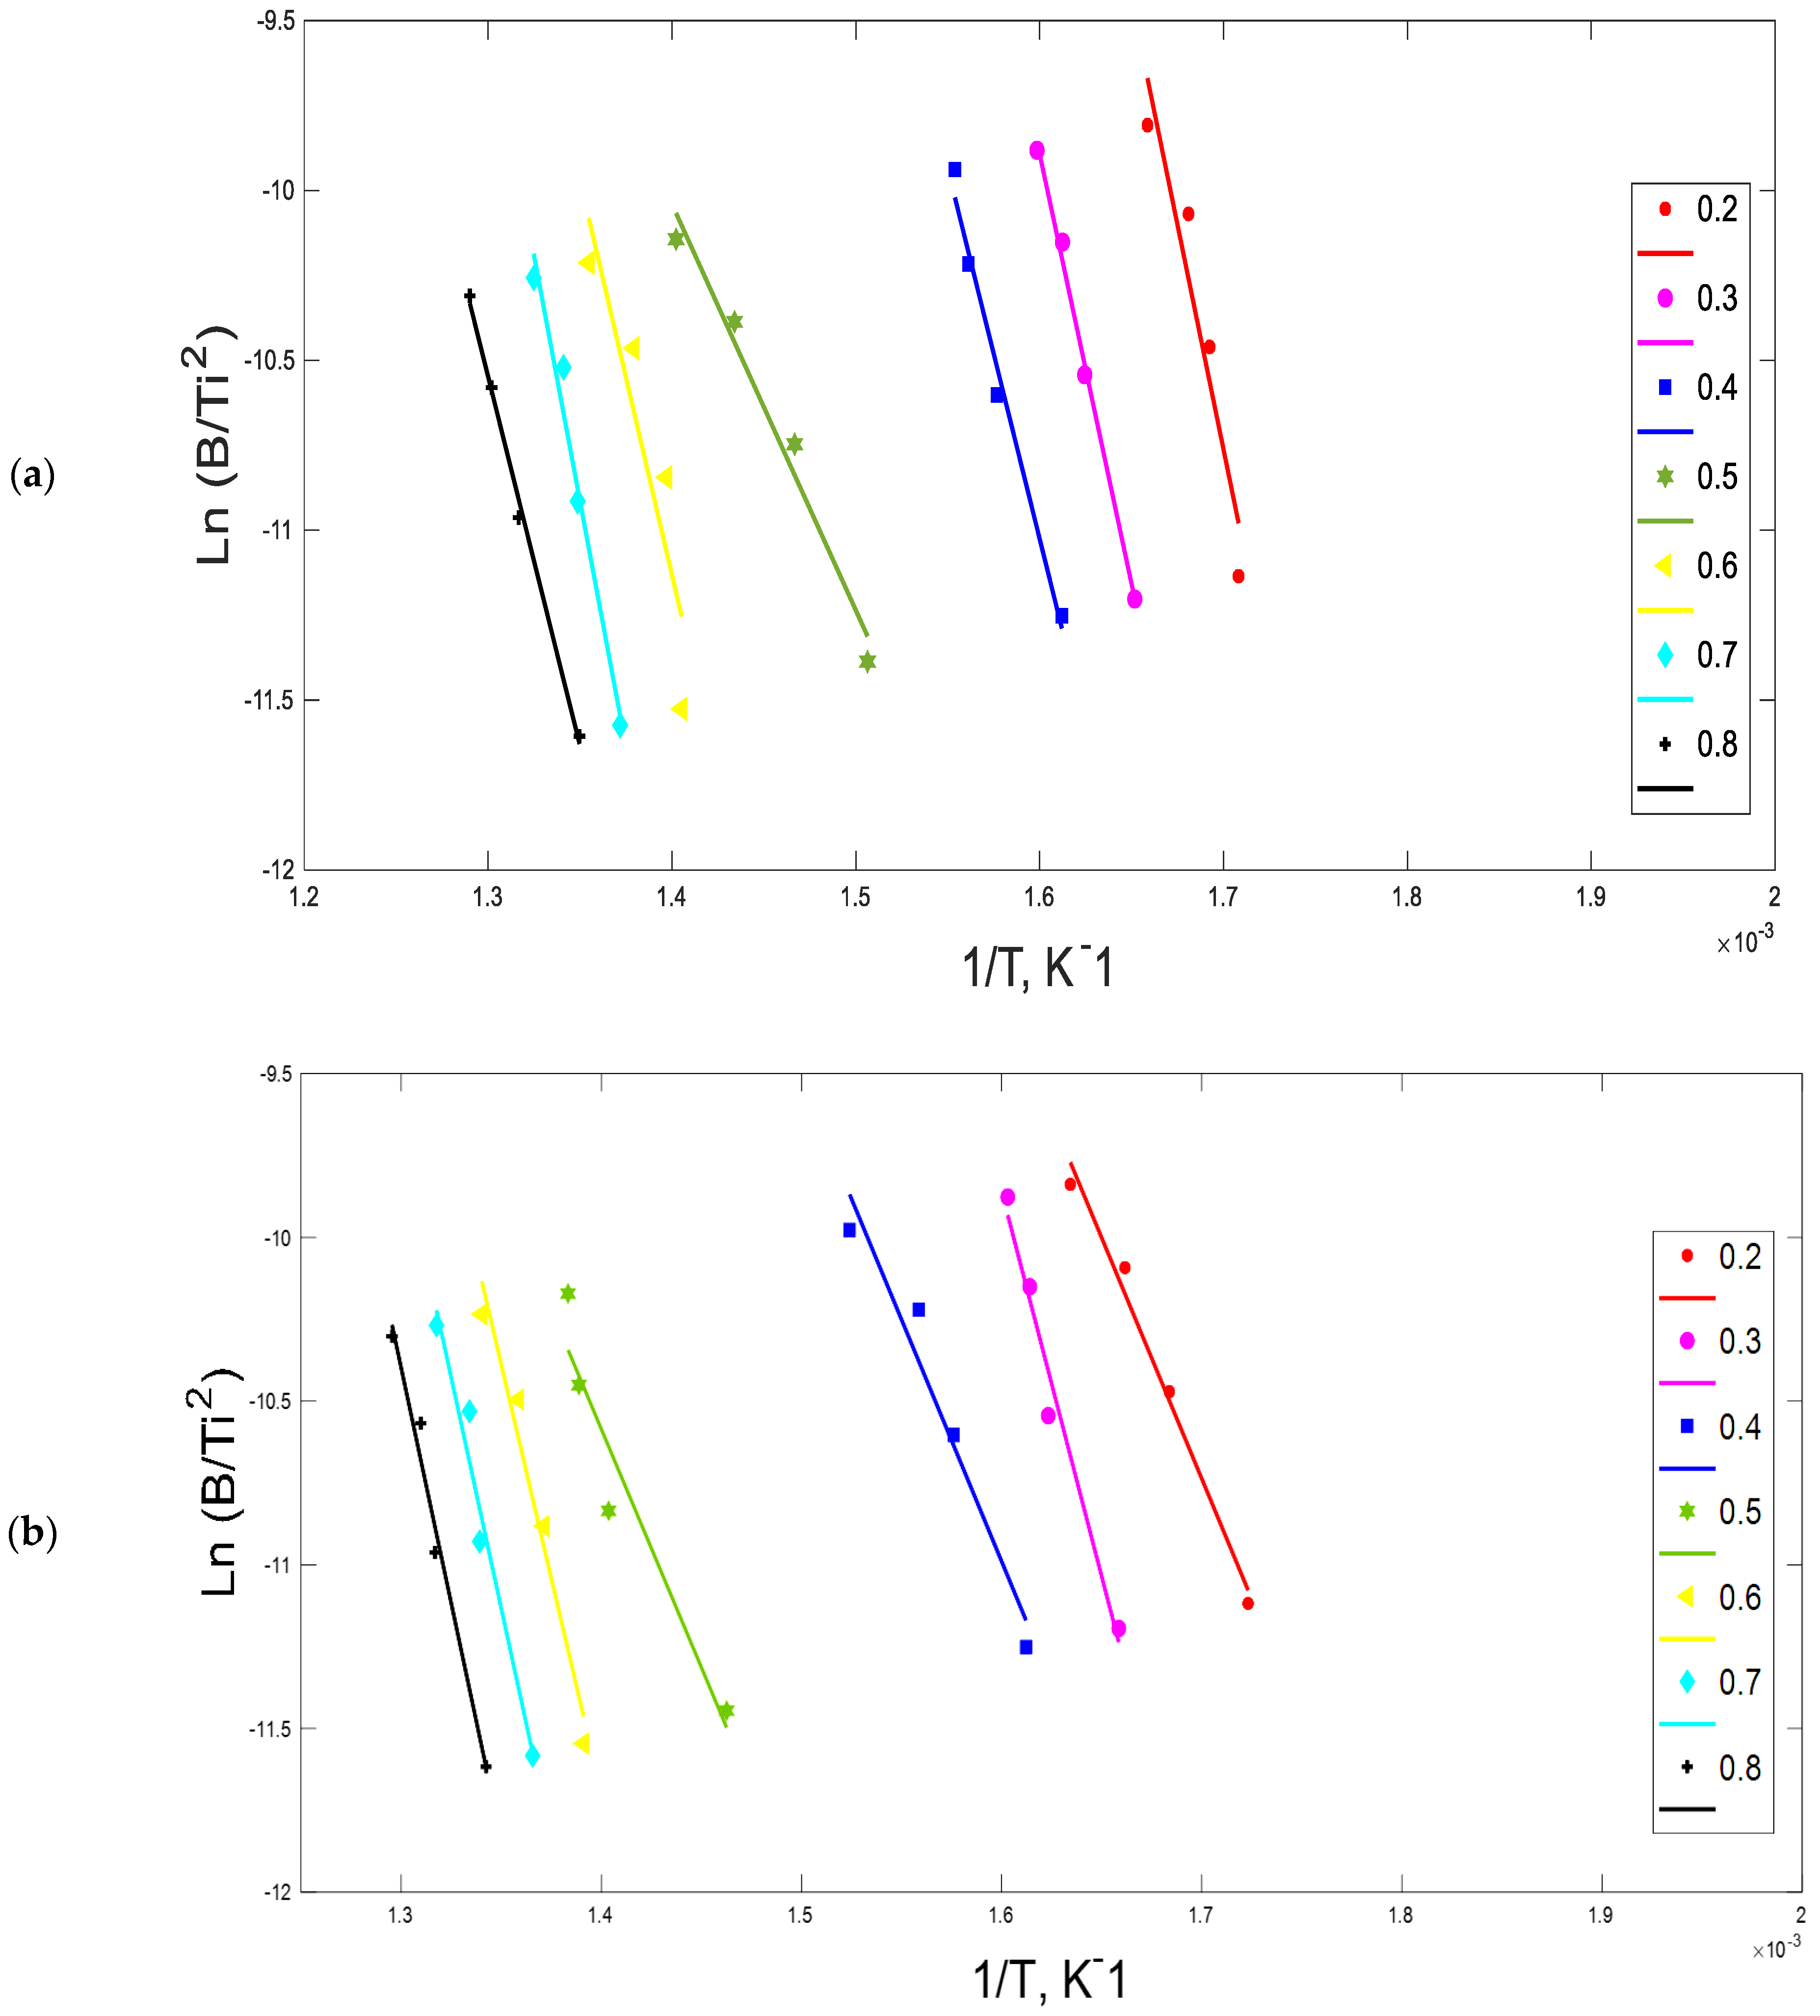
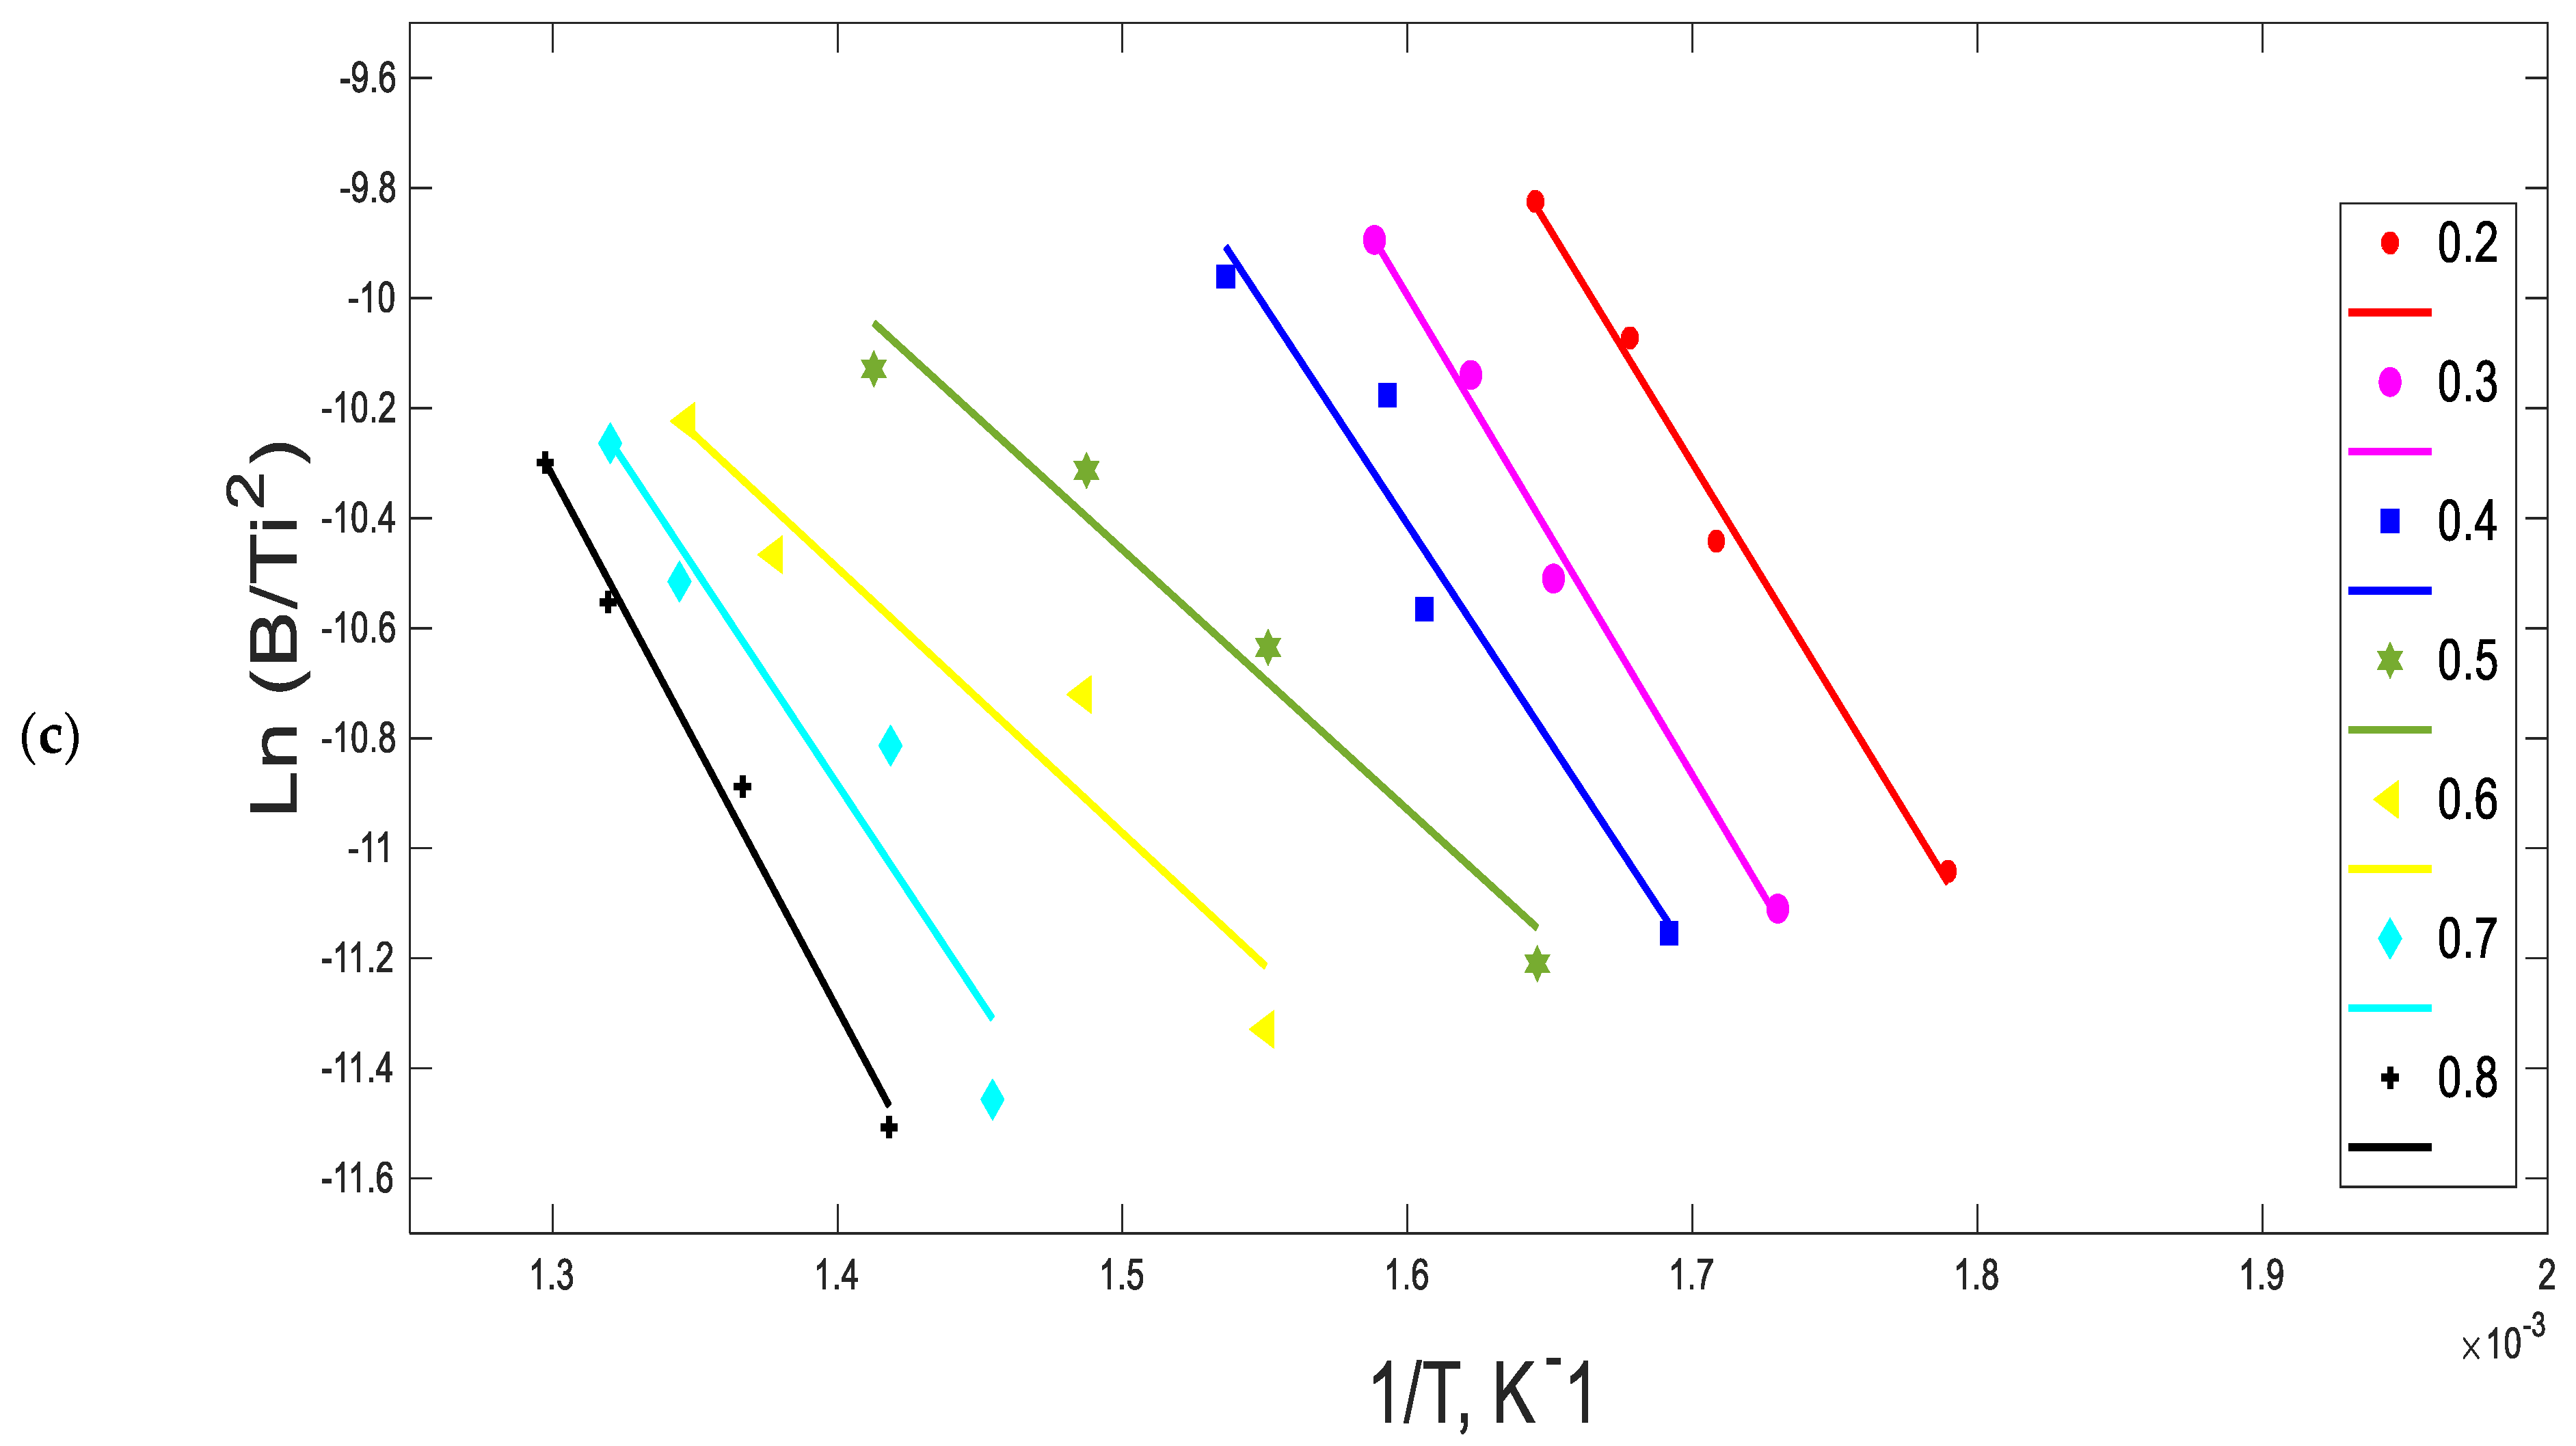
OFW and KAS methods were used in the present work to determine the E a and A of three decomposition processes of Subcoal™ PAF. In OFW, the E a was graphically estimated from the slope of Equation (9), as presented in Figure 4a–c, and A value was determined using Equation (10). Table 6 states the kinetic parameters from TGA. As observed, a significant variation is clear in the E a as the conversion increased from 0.2 to 0.8, which indicates the multistage characteristic of the reaction mechanism. Plots of KAS method in Figure 5a–c show a high degree of linearity, hence high numerical stability of the method. The average correlation coefficient ( R 2 ) of the three runs exceeds 0.9. The plot of E a and A estimation was executed according to Equation (11), summarised in Table 7.
The E a for pyrolysis obtained by OFW is 161.7 ± 24.7 kJ/mol and 142.6 ± 23.5 kJ/mol by KAS. In addition, the E a for gasification obtained by OFW is 200.2 ± 33.6 kJ/mol and 179.0 ± 31.9 kJ/mol by KAS. However, the E a for combustion obtained by OFW is 76.7 ± 15.4 kJ/mol and 71.0 ± 4.4 kJ/mol by KAS. Thus, combustion results show lower E a and indicate that shorter time required for Subcoal™ PAF degradation than pyrolysis or gasification. The slight differences in average E a might be owed to the improper approximation of temperature integration [26]. These findings are confirmed by (Guida et al., 2019).
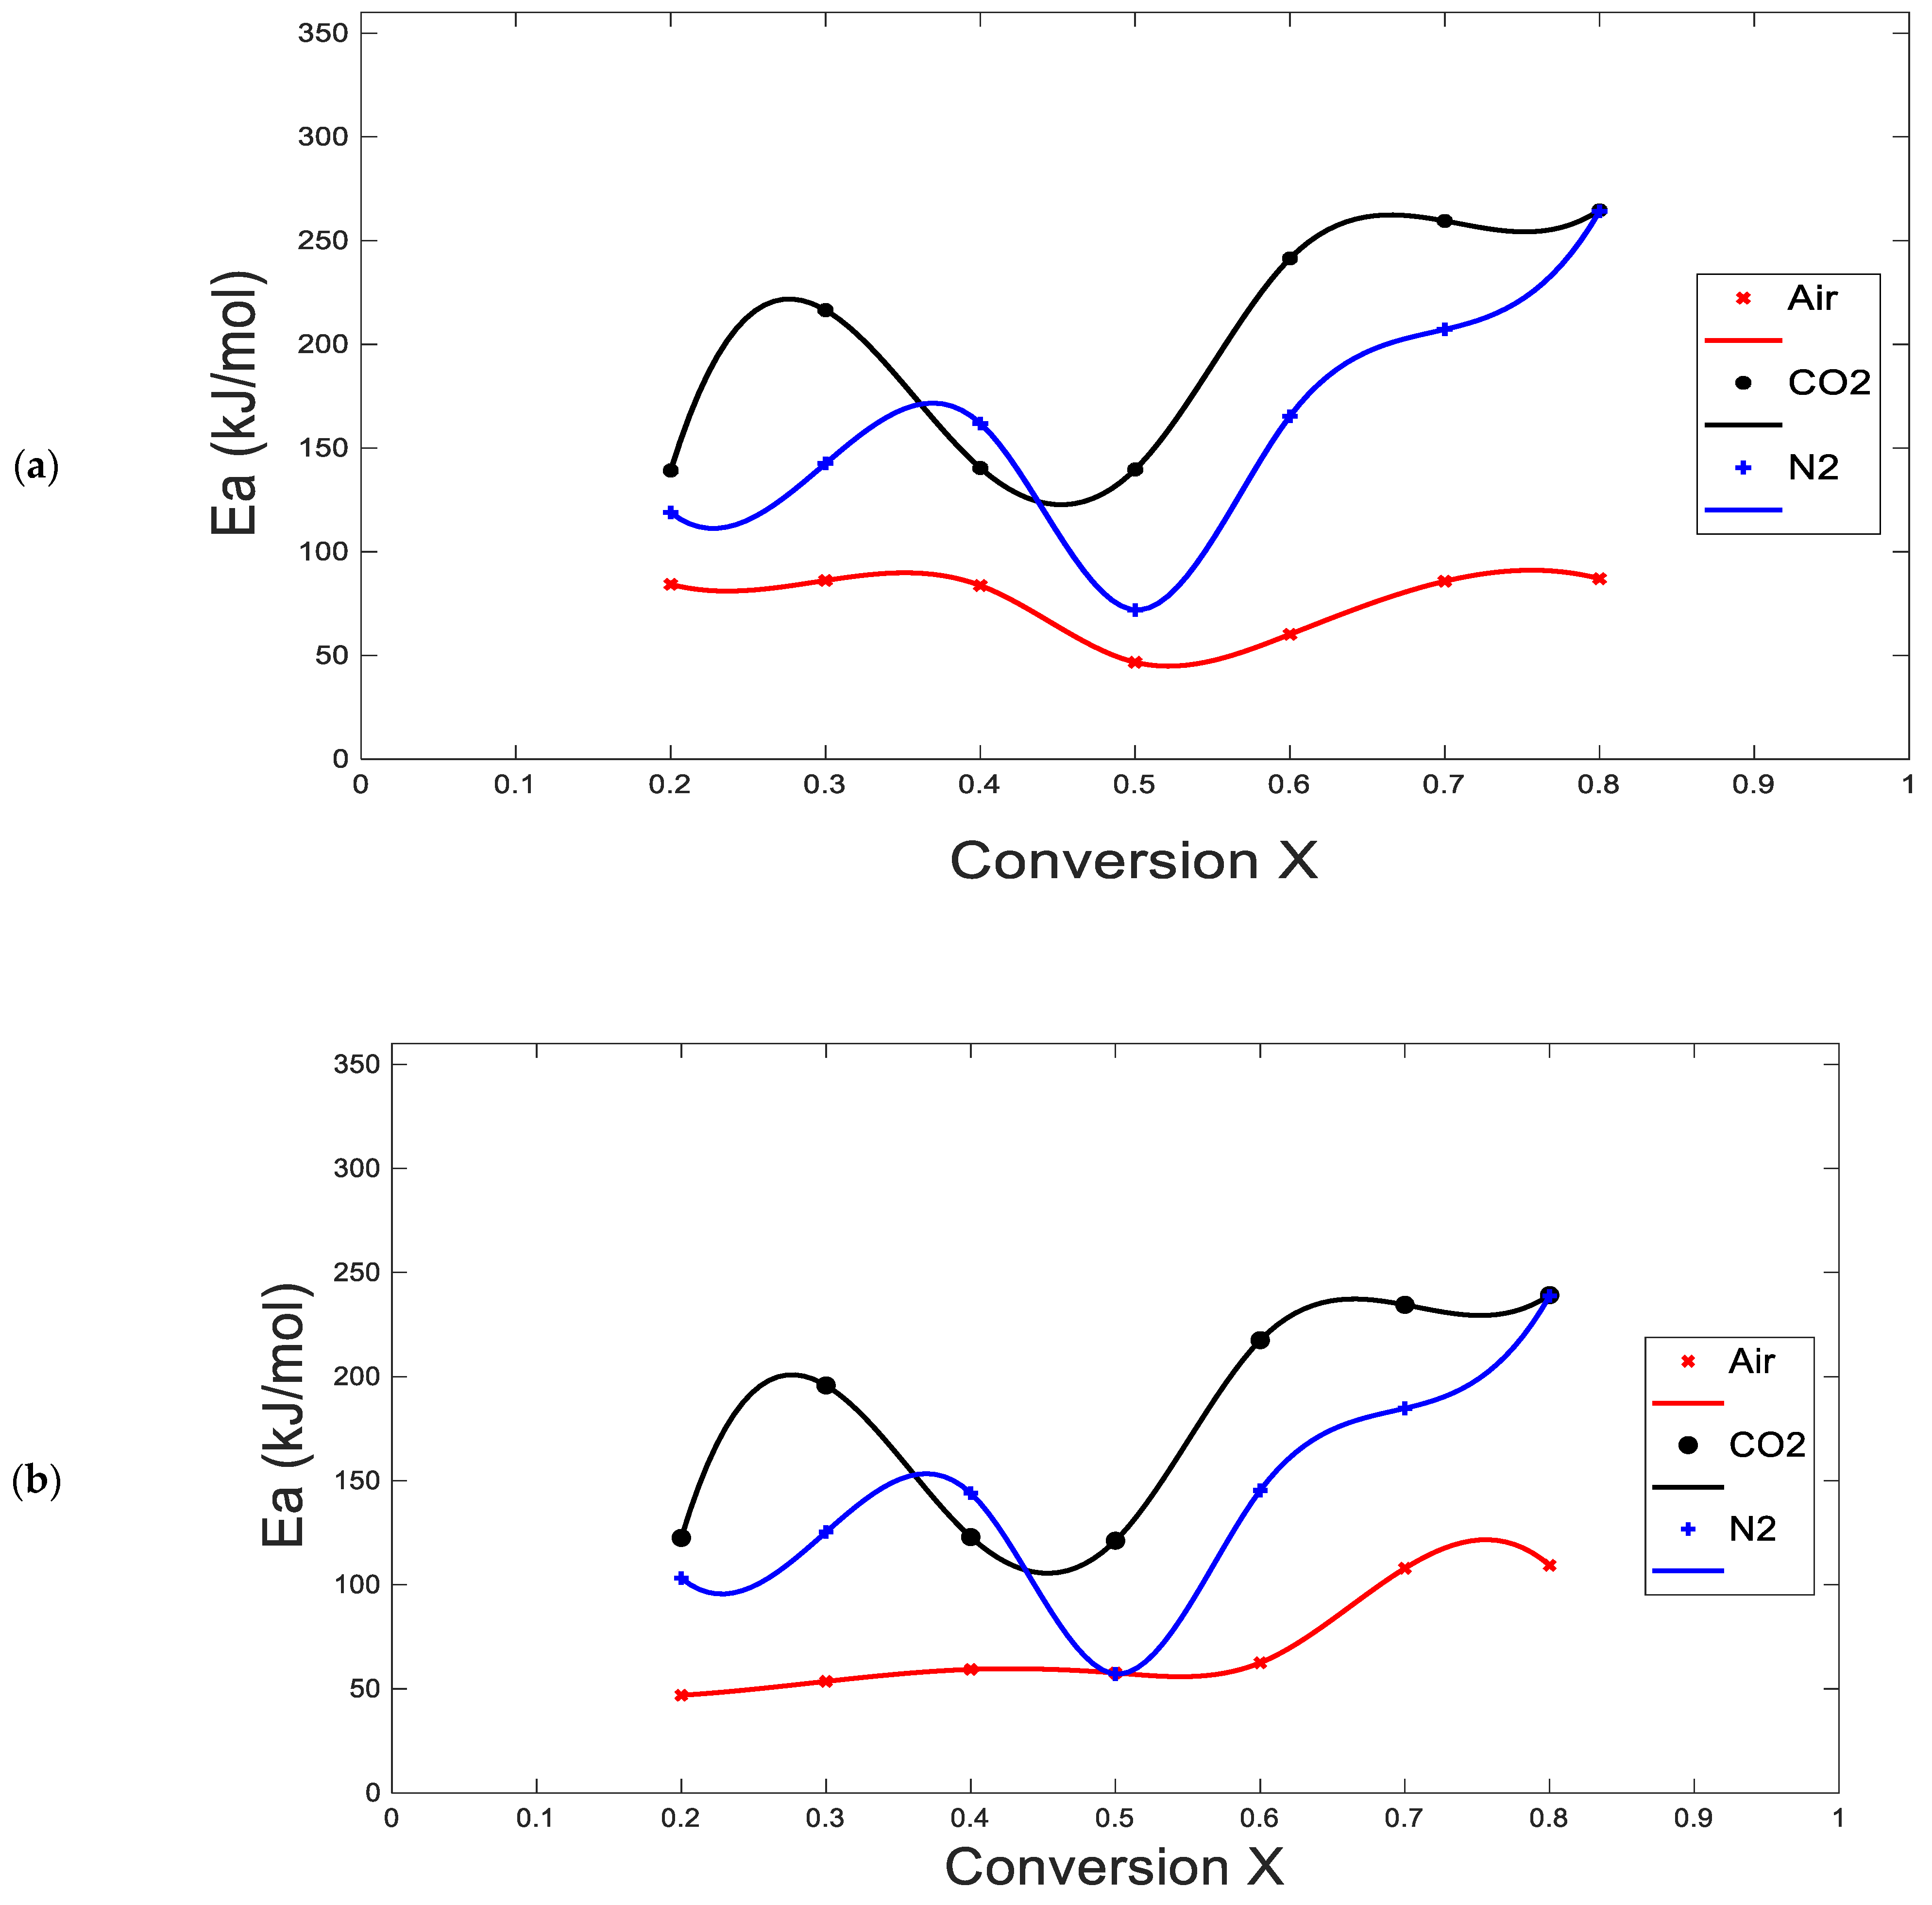
Figure 6a,b shows OFW and KAS methods are in good relation to each other and indicate that the reaction mechanism of Subcoal™ is a complex multi-step reaction. The degradation rate from 0.2 to 0.5 shows that the E a is almost stable, referring to the fact that one reaction one reaction mechanism is taking place in the solid phase. Then, from 0.5 to 0.8 conversion, the E a raises and fall again by both methods.
Comparing E a of Subcoal™ results with the literature, Singh et al., in 2012, found that pyrolysis of MSW E a 294.8 kJ/mol [27], and Chen et al., in 2015, reported that the E a of MSW in CO2 gasification for polyester fabrics is 211 kJ/mol, and polyethylene (PE) is 221 kJ/mol [28]. In addition, (Azam), in 2019, identified the E a of MSW combustion as 116.1 kJ/mol [29]. However, the E a of refuse derived fuel (RDF) and SRF combustion are 203 kJ/mol and 86.8 kJ/mol [30]. In addition, the E a of RDF and SRF pyrolysis are 252.5 kJ/mol and 238.3 kJ/mol [31]. These results prove that the E a of Subcoal™ PAF is lower than others biomass from the literature, resulting in an upsurge in chemical reaction, and more particles will collide, with enough energy.

4. Discussion

4.1. Thermal Analysis

Thermal behaviour of Subcoal™ PAF is described as a complex of non-recyclable paper-plastic mixture consists of four decomposition stages. Heating rate is an essential parameter in the estimation of the E a and A using the non-isothermal TGA data. It provides an important parameter of sample concerning decomposition temperature ranges and kinetics. In addition, at various heating rates, exposure of biomass particles (residence time) varies, which changes the thermal degradation process. An inaccurate determination of the heating rate may lead to imprecise estimation of the kinetic constants. Miscalculation of the heating rate is one of the significant sources of error in the kinetic evaluation. The assumption of the actual heating rate is the main reason for the heating rate miscalculation. Other factors may contribute to inaccurate determination of heating rate are self-heating/cooling and purge gas cooling [32]. Increasing heating rates raised the reaction rates, and it speeds up the motion of molecules, which force the reaction to collide.
The combustion reaction began earlier than pyrolysis process since pyrolysis was undertaken without air or oxygen. Instead, in combustion, a high amount of oxygen can help and accelerate the heating process. For gasification, it can be identified that, at the beginning of the process, pyrolysis occurred.
The degradation of Subcoal™ PAF in CO2 atmosphere looks like a complex mechanism, more than N2 and air, due to presence of high oxygen content that promotes successive oxidation reactions affecting the degradation rate [33]. However, Tm values are directly proportional to the heating rate; hence, pyrolysis needs more time to reach complete conversion [34]. In all experiments, mass loss curves at 15 °C/min and 20 °C/min are close to each other and are overlapping at some points. This may explain the complexity of Subcoal™ PAF degradation process, especially in CO2 and air atmosphere. However, in this situation, the limitations of diffusion and heat transfer restrictions had a pronounced impact [35].
The final stage (stage IIII) is where the char and ash forms and degrades to volatile gases in the temperature range of 600 to 800 °C, with small variation in the mass loss [26]. The temperature range in the fourth stage is known as a critical temperature because of an insignificant change of mass with a continuous increase in temperature [36]. The heating rate plays a vital role in the thermal degradation process of Subcoal™ PAF in TGA. The results indicate that the increase in heating rate increases reaction rate of the decomposition process and decrease the time required to start stages. In addition, the lower the heating rate, the greater the temperature is needed to initiate the degradation. Moreover, the heating rate prolongs the period to achieve the equilibrium; therefore, it was shifted to a higher temperature region as a result of slow heat diffusion [37]. Subcoal™ PAF is decomposed in a large temperature range at lower levels than fossil fuels because of its low fixed-carbon and high volatile matter. Thus, combining Subcoal™ PAF with other biomass or fuels, such as coal, can mitigate emissions and provide some economic solutions to energy sectors.
In the DTG analysis, the degradation rate in wt %/min is plotted against the temperature. The peaks that appear in the graph show the amount of degradation that occurred at a specific temperature range. The value of Tm determines the performance of Subcoal™ PAF degradation in TGA. The results show that two small peaks are corresponding to degradation in the first and fourth stages, respectively, as well as two large peaks in the second stage [21]. Tm increases with increase in heating rate, which indicates that shorter reaction time is required to complete the reaction [22]. The peaks overlapping and the irregularity of peak shape indicate the occurrence of simultaneous reactions [26].

4.2. Kinetic Analysis

The kinetic evaluation is very important for identifying the operating conditions of thermal degradation process for Subcoal™ PAF [38]. The E a of pyrolysis, gasification, and combustion were evaluated in TGA to identify the minimum energy required for a reaction to occur. OFW and KAS are most popular and accurate model-free techniques and were used during analysis. Linear regression results obtained from the OFW and KAS methods indicate that the E a and A increase as the conversion increased [18]. The E a obtained by OFW was slightly different than KAS in the average standard deviation due to the improper approximation of temperature integration, as confirmed by Guida et al. (2019). This variation in estimation can be neglected for some applications of the OFW method, which refers to the complexity of the reaction mechanism [39]. The findings of both methods stated that the E a is dependent on conversion. The higher complexity of dehydration process, the greater the variation of E a [40]. Thus, Subcoal™ PAF ignition point is considerably low compared to RDF or SRF. Pyrolysis, gasification and combustion results of Subcoal™ PAF in TGA results provide lower E a than MSW, RDF, and SRF.
As part of Qatar national vision 2030 one of the aims is to have the lowest possible CO2 footprint, and, instead of MSW incineration or landfill, the non-recyclable paper and plastic waste can be utilised as a substitute fuel in waste-to-energy plant for sustainable power production. It is a good substitute for fossil fuels that will help generate energy sustainably [41].
In addition, Subcoal™ can be used to replace fossil fuels in cement and lime plants, steel blast furnaces, and power generation facilities. The N+P won huge contracts to supply Subcoal™ to the Uskmouth coal-fired power station in south Wales and Teesside plant in the United Kingdom because of its high conversion efficiency to renewable energy.

5. Conclusions

The kinetic parameters of biomass thermal degradation are essential for the design of the chemical reactor. This work aims to investigate the E a and A of non-recyclable paper and plastic waste (Subcoal™ PAF) in N2, CO2, and air environment. The kinetic evaluation of the experimental TGA data carried out using OFW and KAS model-free methods. The experiments of thermal conversion were performed using the TGA method, whereby the sample mass loss was measured as a function of time and temperature at various heating rates. The DTG data was also obtained in terms of the degradation rate. Four peaks were obtained during degradation process may be attributed to Subcoal™ heterogeneity. From the TGA results, the Subcoal™ PAF degradation includes three process: dehydration, devolatilization, and char and ash degradation. The heating rate shifts the temperature range of the devolatilization process to higher values. The degradation of Subcoal™ in CO2 atmosphere tends to be a complex mechanism, as shown by the DTG graphs, while combustion results obtained excellent E a and A parameters.
The E a of Subcoal™ PAF obtained in this work for pyrolysis, CO2 gasification, and combustion are lower than E a of SRF/RDF obtained in the literature. This result proves that Subcoal™ PAF provides a faster chemical reaction time than SRF/RDF and other biomass.
Subcoal™ technology improves utilisation of MSW and prevents landfill, as a result of meeting the increasing demand for lower emissions and high-calorie fuels. It is a crucial sustainable technology that helps utilisation of non-recyclable materials in energy sectors that could otherwise be lost into landfills.

Author Contributions

Conceptualization, A.M.S.H.A.-M., R.M. and J.S., investigation, A.M.S.H.A.-M.; resources, A.M.S.H.A.-M.; writing—original draft preparation, A.M.S.H.A.-M.; writing—review and editing, R.M. and J.S.; supervision, R.M., and J.S. All authors have read and agreed to the published version of the manuscript.

Funding

This work is financially supported by Qatar National Research Found, member of Qatar Foundation for Education, Science and Community Development for doctoral project number GSRA5-1-0404-18034.

Institutional Review Board Statement

Not applicable.

Informed Consent Statement

Not applicable.

Data Availability Statement

Not applicable.

Acknowledgments

The authors thank Cardiff University for its technical support.

Conflicts of Interest

The authors declare that there is no conflict of interest.

Nomenclature

E a Activation energy (kJ/mol)
A Pre-exponential factor (min−1)
X Conversion
T M trademark
k Rate constant of reaction
m o Initial mass of sample (mg)
m t Instantaneous mass of sample (mg)
T ¯ Absolute temperature (K)
T m Maximum peak temperature (°C)
βHeating rate (°C/min)
R Universal gas constant (kJ/mol.K)
T Temperature (°C)
m f Final residual mass of sample (mg)
t Time (min)

References

  1. Kweku, D.W.; Bismark, O.; Maxwell, A.; Desmond, K.A.; Danso, K.B.; Oti-Mensah, E.A.; Quachie, A.T.; Adormaa, B.B.; Koomson, D. Greenhouse Effect: Greenhouse Gases and Their Impact on Global Warming. J. Sci. Res. Rep. 2018, 17, 1–9. [Google Scholar] [CrossRef]
  2. Hassanpouryouzband, A.; Joonaki, E.; Edlmann, K.; Haszeldine, R.S. Offshore Geological Storage of Hydrogen: Is This Our Best Option to Achieve Net-Zero? ACS Energy Lett. 2021, 6, 2181–2186. [Google Scholar] [CrossRef]
  3. Ahmad, T.; Zhang, D. A critical review of comparative global historical energy consumption and future demand: The story told so far. Energy Rep. 2020, 6, 1973–1991. [Google Scholar] [CrossRef]
  4. Rahman, M.; Rahman, S.; Rahman, M.; Hasan, M.; Shoaib, S.; Rushd, S. Greenhouse Gas Emissions from Solid Waste Management in Saudi Arabia—Analysis of Growth Dynamics and Mitigation Opportunities. Appl. Sci. 2021, 11, 1737. [Google Scholar] [CrossRef]
  5. De la Barrera, B.; Hooda, P. Greenhouse gas emissions of waste management processes and options: A case study. Waste Manag. Res. 2016, 34, 658–665. [Google Scholar] [CrossRef] [Green Version]
  6. Klass, D.L. Biomass for Renewable Energy, Fuels, and Chemicals; Academic Press: San Diego, CA, USA, 1998. [Google Scholar]
  7. Saidur, R.; Abdelaziz, E.; Demirbas, A.; Hossain, M.; Mekhilef, S. A review on biomass as a fuel for boilers. Renew. Sustain. Energy Rev. 2011, 15, 2262–2289. [Google Scholar] [CrossRef]
  8. Adhikari, S.; Nam, H.; Chakraborty, J.P. Conversion of Solid Wastes to Fuels and Chemicals Through Pyrolysis. Waste Biorefinery 2018, 239–263. [Google Scholar] [CrossRef]
  9. Harjanne, A.; Korhonen, J. Abandoning the concept of renewable energy. Energy Policy 2019, 127, 330–340. [Google Scholar] [CrossRef] [Green Version]
  10. Zafar, S. Municipal Solid Wastes in Qatar|Blogging Hub. 2019. Available online: https://www.cleantechloops.com/municipal-solid-waste-in-qatar/ (accessed on 20 October 2020).
  11. Diaz-Barriga-Fernandez, A.; Santibañez-Aguilar, J.; González-Campos, J.; Nápoles-Rivera, F.; Ponce-Ortega, J.; El-Halwagi, M. Strategic planning for managing municipal solid wastes with consideration of multiple stakeholders. Comput. Aided Chem. Eng. Elsevier. 2018, 44, 1597–1602. [Google Scholar]
  12. Alam, O.; Qiao, X. An in-depth review on municipal solid waste management, treatment and disposal in Bangla-desh. Sustain. Cities Soc. 2020, 52, 101775. [Google Scholar] [CrossRef]
  13. Syguła, E.; Świechowski, K.; Hejna, M.; Kunaszyk, I.; Białowiec, A. Municipal Solid Waste Thermal Analysis—Pyrolysis Kinetics and Decomposition Reactions. Energies 2021, 14, 4510. [Google Scholar] [CrossRef]
  14. Wang, Y.; Kinoshita, C. Kinetic model of biomass gasification. Sol. Energy 1993, 51, 19–25. [Google Scholar] [CrossRef]
  15. Arshad, M.A.; Maaroufi, A.; Benavente, R.; Pinto, G. Kinetics of the Thermal Decomposition Mechanisms of Con-ducting and Non-conducting epoxy/Al Composites. J. Mater. Environ. Sci 2014, 5, 1342–1354. [Google Scholar]
  16. Nakamura, S. Fundamentals of Chemical Reaction Kinetics. Sol. Chem. Energy Convers. Theory Appl. Cham Springer Int. Publ. 2016. Available online: https://link.springer.com/chapter/10.1007/978-3-319-25400-5_4 (accessed on 12 May 2021).
  17. Mamleev, V.; Bourbigot, S.; Le Bras, M.; Lefebvre, J. Three model-free methods for calculation of activation energy in TG. J. Therm. Anal. Calorim. 2004, 78, 1009–1027. [Google Scholar] [CrossRef]
  18. Slopiecka, K.; Bartocci, P.; Fantozzi, F. Thermogravimetric analysis and kinetic study of poplar wood pyrolysis. Appl. Energy 2012, 97, 491–497. [Google Scholar] [CrossRef]
  19. Benhacine, F.; Yahiaoui, F.; Hadj-Hamou, A. Thermal stability and kinetic study of isotactic polypropyl-ene/Algerian bentonite nanocomposites prepared via melt blending. J. Polym. 2014, 2014, 1–9. [Google Scholar] [CrossRef] [Green Version]
  20. Cui, H.W.; Jiu, J.; Sugahara, T.; Nagao, S.; Suganuma, K.; Uchida, H.; Schroder, K. Using the Friedman method to study the thermal degradation kinetics of photonically cured electrical-ly conductive adhesives. J. Therm. Anal. Calorim. 2015, 119, 425–433. [Google Scholar] [CrossRef]
  21. Nelson, J. Determination of Kinetic Parameters of Six Ablation Polymers by Thermogravimetric Analysis. 1967. Available online: https://apps.dtic.mil/sti/citations/ADA306600 (accessed on 12 May 2021).
  22. Kessler, M.R.; White, S.R. Cure kinetics of the ring-opening metathesis polymerization of dicyclopentadiene. J. Polym. Sci. Part A: Polym. Chem. 2002, 40, 2373–2383. [Google Scholar] [CrossRef]
  23. Li, A.; Gao, N.; Quan, C. Thermogravimetric analysis and kinetic study on large particles of printed circuit board wastes Furfural clean production View project MSW Gasification View project Thermogravimetric analysis and kinetic study on large particles of printed circuit board wastes. Waste Manag. 2009, 29, 2353–2360. [Google Scholar]
  24. Morais, L.C.; Maia, A.A.D.; Guandique, M.E.G.; Rosa, A.H. Pyrolysis and Combustion of Sugarcane Bagasse; Springer: Berlin/Heidelberg, Germany, 2017; Volume 129, pp. 1813–1822. [Google Scholar]
  25. Gerassimidou, S.; Velis, A.C.; Williams, P.T.; Komilis, D. Characterisation and composition identification of waste-derived fuels obtained from municipal solid waste using thermogravimetry: A review. Waste Manag. Res. 2020, 38, 942–965. [Google Scholar] [CrossRef]
  26. Guida, M.Y.; Lanaya, S.; Rbihi, Z.; Hannioui, A. Thermal degradation behaviors of sawdust wood waste: Pyrolysis kinetic and mechanism. J. Mater. Environ. Sci. 2019, 10, 742–755. [Google Scholar]
  27. Singh, S.; Wu, C.; Williams, P. Pyrolysis of waste materials using TGA-MS and TGA-FTIR as complementary characterisation techniques. J. Anal. Appl. Pyrolysis 2012, 94, 99–107. [Google Scholar] [CrossRef]
  28. Chen, S.; Meng, A.; Long, Y.; Zhou, H.; Li, Q.; Zhang, Y. TGA pyrolysis and gasification of combustible municipal solid waste. J. Energy Inst. 2015, 88, 332–343. [Google Scholar] [CrossRef]
  29. Azam, M.; Setoodeh Jahromy, S.; Raza, W.; Jordan, C.; Harasek, M.; Winter, F. Comparison of the combustion characteristics and kinetic study of coal, municipal solid waste, and refuse-derived fuel: Model-fitting methods. Wiley Online Libr. 2019, 7, 2646–2657. [Google Scholar] [CrossRef] [Green Version]
  30. Szűcs, T.; Szentannai, P.; Szilágyi, I.M.; Bakos, L.P. Comparing different reaction models for combustion kinetics of solid recovered fuel. J. Therm. Anal. Calorim. 2019, 139, 555–565. [Google Scholar] [CrossRef] [Green Version]
  31. Miskolczi, N.; Buyong, F. Thermogravimetric analysis and pyrolysis kinetic study of Malaysian refuse derived fuels Production of methane gas from biomass by using anaerobic digestion View project FACE Project UKM View pro-ject. Taylor Fr. 2010, 83, 125–132. [Google Scholar]
  32. Liu, Z.; Jiang, Z.; Fei, B.; Liu, X.E. Thermal decomposition of Chinese fir. BioResources 2013, 8, 2013. [Google Scholar] [CrossRef] [Green Version]
  33. Zan, R.; Wang, W.; Xu, R.; Schenk, J.; Zheng, H.; Wang, H. Gasification Characteristics and Kinetics of Unburned Pulverized Coal in Blast Furnaces. Energies 2019, 12, 4324. [Google Scholar] [CrossRef] [Green Version]
  34. Jess, A.; Andresen, A.-K. Influence of mass transfer on thermogravimetric analysis of combustion and gasification reactivity of coke. Fuel 2010, 89, 1541–1548. [Google Scholar] [CrossRef]
  35. Jayaraman, K.; Gokalp, I.; Bonifaci, E.; Merlo, N. Kinetics of steam and CO 2 gasification of high ash coal–char produced under various heating rates. Fuel 2015, 154, 370–379. [Google Scholar] [CrossRef]
  36. Gu, X.; Zhou, X.; Wu, M.; Wang, X.; Chen, Y.; Cheng, K. Kinetic Study of Pine Sawdust Pyrolysis via TG/DTG Analysis. Cellulose Chem. Technol. 2017, 51, 387–394. [Google Scholar]
  37. Nisar, J.; Khan, M.A.; Iqbal, M.; Shah, A.; Khan, R.A.; Sayed, M.; Mahmood, T. Comparative Study of Kinetics of the Thermal Decomposition of Polypropylene Using Different Methods. Adv. Polym. Technol. 2018, 37, 1168–1175. [Google Scholar] [CrossRef]
  38. Chew, J.J.; Soh, M.; Sunarso, J.; Yong, S.-T.; Doshi, V.; Bhattacharya, S. Isothermal kinetic study of CO2 gasification of torrefied oil palm biomass. Biomass Bioenergy 2020, 134, 105487. [Google Scholar] [CrossRef]
  39. Muravyev, N.V.; Pivkina, A.N.; Koga, N. Critical Appraisal of Kinetic Calculation Methods Applied to Overlapping Multistep Reactions. Molecules 2019, 24, 2298. [Google Scholar] [CrossRef] [Green Version]
  40. Wong, F.F.; Lin, C.M.; Chen, K.-L.; Shen, Y.-H.; Huang, J.-J. Improvement of the thermal latency for epoxy-phenolic resins by novel amphiphatic imidazole catalysts. Macromol. Res. 2010, 18, 324–330. [Google Scholar] [CrossRef]
  41. Government Communications Office. Qatar National Vision 2030. Fourth Pillar Environ. Dev. 2020, 209–230. [Google Scholar]
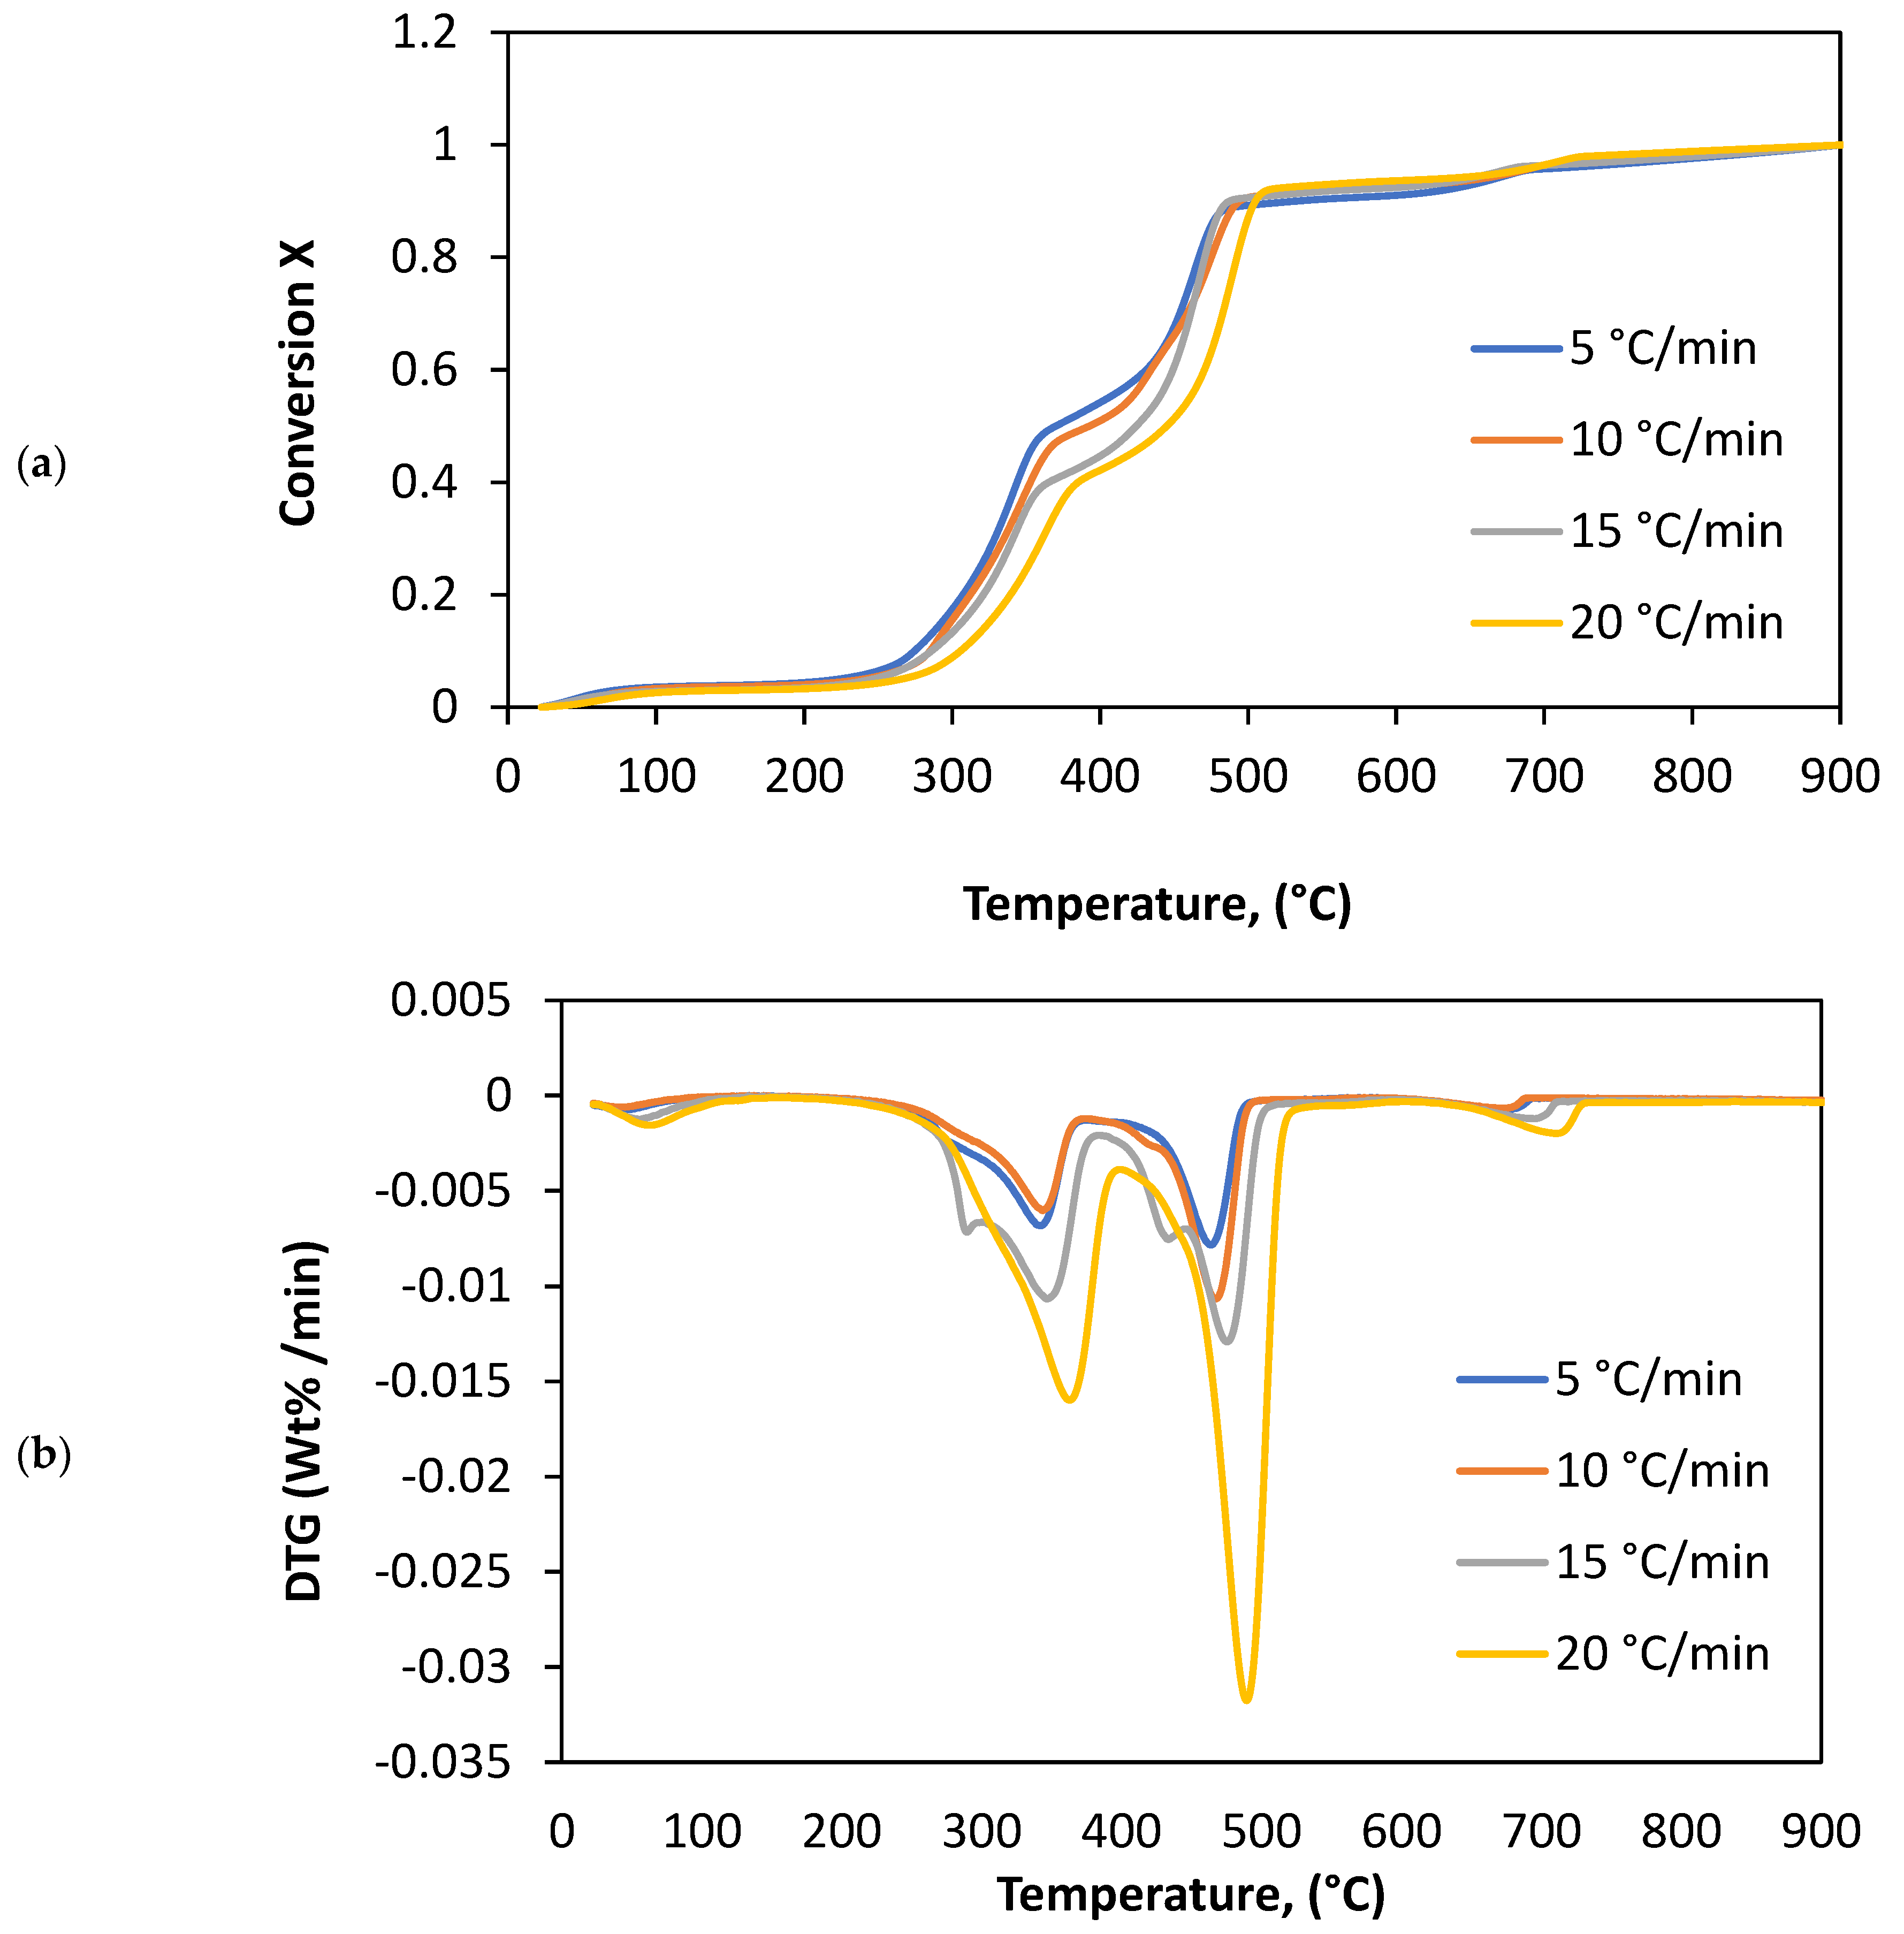
Figure 1. The effect of the heating rate in N2: (a) conversion degree and (b) DTG weight loss.
Chemengineering 05 00054 g001
Figure 2. The effect of the heating rate in CO2: (a) conversion degree and (b) DTG weight loss.
Chemengineering 05 00054 g002
Figure 3. The effect of the heating rate in air: (a) conversion degree and (b) DTG weight loss.
Chemengineering 05 00054 g003
Figure 4. The approximated curves of OFW method of pyrolysis (a), gasification (b), and combustion (c) of Subcoal™ PAF for different values of conversion at heating rates of 5, 10, 15, and 20 °C/min.
Chemengineering 05 00054 g004aChemengineering 05 00054 g004b
Figure 5. KAS diagrams of pyrolysis (a), gasification (b), and combustion (c) of Subcoal™ PAF for given values of conversion at heating rates of 5, 10, 15, and 20 °C/min.
Chemengineering 05 00054 g005aChemengineering 05 00054 g005b
Figure 6. Compression plots of E a as a function of conversion ( X ) : (a) OFW and (b) KAS.
Chemengineering 05 00054 g006
Table 1. Proximate and ultimate analysis of Subcoal™.
Proximate Analysis (wt, %) Ultimate Analysis (wt, %)
Moisture content3.1 ± 0.4C45.7 ± 2.7
Ash11.8 ± 0.5H6.4 ± 0.2
Volatile matter content77.6 ± 1.4S0.2 ± 0.06
Fixed carbon7.5 ± 1.4N0.6 ± 0.2
Gross calorific value, (MJ/kg)23.1 ± 2.8O (by difference)35.3 ± 1.9
Density, kg/m3450
Table 2. Thermal decomposition of Subcoal™ PAF in N2 from TGA curves.
First StageSecond StageThird StageFourth Stage
βStart *End **WeightStart *End **WeightStart *End **WeightStart *End **Weight
°C/min(°C)(°C)Loss (%)(°C)(°C)Loss (%)(°C)(°C)Loss (%)(°C)(°C)Loss (%)
528.2156.93.6233.5376.334.2376.3471.441.4636.6688.111.2
1028.8156.54.7233.5378.635.6378.6493.842.6638.6693.711.4
1528.1157.34.9233.5395.637.6395.6510.445.7640.5712.49.2
2027.7158.95.2233.5426.739.6426.7522.248.5641.6732.44.7
Average28.2157.44.6233.5394.336.8394.3499.544.3639.3706.79.1
* Start refers to start (onset) temperature of an indicated decomposition step. ** End refers to end (offset) temperature of an indicated decomposition step.
Table 3. Thermal decomposition of Subcoal™ PAF in CO2 from TGA curves.
First StageSecond StageThird StageFourth Stage
βStart *End **WeightStart *End **WeightStart *End **WeightStart *End **Weight
°C/min(°C)(°C)Loss (%)(°C)(°C)Loss (%)(°C)(°C)Loss (%)(°C)(°C)Loss (%)
528.6167.63.4199.2380.434.2380.4483.451.2622.2658.33.8
1028.5166.23.6199.2410.334.6410.3489.650622.2692.23.9
1528.4164.43.8199.2412.237.3412.2550.641.6622.2708.94.4
2028.7163.83.9198.3428.638.5428.6558.442.3623.4792.75.5
Average28.6165.53.7198.9407.936.2407.9520.546.3622.5713.04.4
* Start refers to start (onset) temperature of an indicated decomposition step. ** End refers to end (offset) temperature of an indicated decomposition step.
Table 4. Thermal decomposition of Subcoal™ PAF in air from TGA curves.
First StageSecond StageThird StageFourth Stage
Β
°C/min
Start *
(°C)
End **
(°C)
Weight
Loss (%)
Start *
(°C)
End **
(°C)
Weight
Loss (%)
Start *
(°C)
End **
(°C)
Weight
Loss (%)
Start *
(°C)
End **
(°C)
Weight
Loss (%)
528.4140.34.3214.2332.533.4332.5478.652.7615.5655.33.2
1028.2150.44.6214.2347.534.3347.5524.652.1615.5690.23.7
1528.6150.24.4214.3358.335.3358.3534.542.3616.3705.94.5
2028.2160.45.3214.5385.138.9385.1546.242.6617.5745.85.4
Average28.3150.34.7214.3355.935.5335.952147.4616.2699.34.2
* Start refers to start (onset) temperature of an indicated decomposition step. ** End refers to end (offset) temperature of an indicated decomposition step.
Table 5. Thermal decomposition of Subcoal™ PAF parameters in different atmospheres.
N2CO2Air
β
°C/min
TmDTGTmTmDTGTmTmDTGTm
°Cwt %/min°Cwt %/min°Cwt %/min
5471 ± 7.0−0.0094 ± 0.0014466 ± 5−0.0097 ± 0.0014317 ± 4.2−0.0071 ± 0.0009
10481 ± 6.7−0.019 ± 0.0057474 ± 6−0.019 ± 0.0079335 ± 13.4−0.015 ± 0.0024
15486 ± 4.8−0.021 ± 0.0056482 ± 5−0.029 ± 0.0073336 ± 2.0−0.025 ± 0.0027
20487 ± 1.1−0.032 ± 0.006488 ± 1.2−0.032 ± 0.002340.3 ± 10.5−0.016 ± 0.0082
Table 6. Kinetic parameters obtained by OFW method.
N2CO2Air
X E a R 2 A E a R 2 A E a R 2 A
/(kJ/mol)/(min−1)(kJ/mol)/(min−1)(kJ/mol)/(min−1)
0.2118.90.8022.7 × 109139.20.9881.5 × 101184.60.9932.7 × 106
0.3142.50.9951.6 × 1011216.50.9776.4 × 101086.80.9932.2 × 106
0.4161.90.9962.7 × 1013140.40.9595.1 × 101080.00.9572.2 × 106
0.571.90.9666.9 × 104139.60.9344.1 × 10952.80.9812.0 × 106
0.6165.40.9702.7 × 1011241.40.9681.4 × 10954.20.9511.0 × 106
0.7207.20.8572.4 × 1014259.50.9671.1 × 10981.10.9344.6 × 105
0.8264.20.9312.4 × 1018264.60.9819.5 × 10897.70.9913.5 × 105
Average161.70.9313.4 × 1017200.20.9684.0 × 101076.70.9711.6 × 106
E a 161.7 ± 24.7 200.2 ± 33.6 76.7 ± 15.4
Table 7. Kinetic parameters obtained by KAS method.
N2CO2Air
X E a R 2 A E a R 2 A E a R 2 A
/(kJ/mol)/(min−1)(kJ/mol)/(min−1)(kJ/mol)/(min−1)
0.2103.20.7711.8 × 108122.50.9864.8 × 10746.90.9579.9 × 102
0.3125.30.9942.0 × 1010195.70.9741.1 × 101353.60.9584.3 × 103
0.4143.90.9969.8 × 1011122.90.9525.2 × 10759.30.9771.5 × 104
0.557.10.9519.4 × 103121.10.9223.8 × 10757.60.9181.1 × 104
0.6145.30.9651.3 × 1012217.40.9643.9 × 101462.50.9143.0 × 104
0.7184.70.8404.9 × 1015234.80.9636.6 × 1015107.90.8565.0 × 108
0.8238.80.9243.7 × 1020239.50.9791.4 × 1016109.30.9276.8 × 108
Average142.60.9205.3 × 1019179.60.9633.1 × 101571.00.9251.7 × 108
E a 142.6 ± 23.5 179.0 ± 31.9 71.0 ± 4.4
Publisher’s Note: MDPI stays neutral with regard to jurisdictional claims in published maps and institutional affiliations.