Article

Performance Evaluation of the Electric Machine Cooling System Employing Nanofluid as an Advanced Coolant

Department of Industrial and Information Engineering and Economics, University of L’Aquila, 67100 L’Aquila, Italy
*
Author to whom correspondence should be addressed.
ChemEngineering 2021, 5(3), 53; https://doi.org/10.3390/chemengineering5030053
Submission received: 7 July 2021 / Revised: 22 August 2021 / Accepted: 23 August 2021 / Published: 28 August 2021
(This article belongs to the Special Issue Feature Papers in Chemical Engineering)

Abstract

:
In this paper, the overall performance of an electric machine cooling system was examined in terms of heat transfer and fluid flow. The structure of the cooling system was based on the cooling jacket method. The cooling jacket contains spiral channels surrounding the stator and end-windings of the electric machine. Al2O3-water nanofluid is used inside the channels as the cooling fluid. The concentration of nanoparticles and the geometric structure of the cooling system have special effects on both aspects of heat transfer and fluid flow. Therefore, in this paper, the overall performance of the cooling system was evaluated by considering these effects. This study compared the importance of heat transfer and fluid flow performances on the overall performance of the cooling system. Numerical analyses were performed by 3D computational fluid dynamics and 3D fluid motion analysis. The analyses were carried out based on the 3D finite element method using the pressure-based solver of the Ansys Fluent software in steady mode.

1. Introduction

Manufacturing cost is one of the barriers to the widespread use of electric vehicles (EVs). As the electric motor is one of the most important components in the powertrain structure of EVs, their cost can play an important role in the production cost of EVs. Therefore, maximum utilization of the electric motor torque production capability is desired for EV applications [1]. This becomes more important when considering the power/torque demand profile of an electric motor used in electric vehicles, which is due to the highly dynamic nature of the power/torque demands, which is, in turn, a function of the driver’s behavior and the number of frequent stops and starts, so peak torque can be several times the rated torque of the electric motor.
One of the factors that is effective in sizing the electric motor is the ratio of peak power to rated power. On the other hand, the most important factor involved in the ability of the electric motor to produce a peak torque several times greater than its nominal torque is the ability of the electric motor cooling system [2,3]. Thus, for a given peak power and rated power, the electric motor size can be reduced if the electric motor cooling system possesses a high performance.
In addition to the effect of the cooling system on the sizing of electric motors, the performance of the electric motor can be negatively affected by the increase in temperature if the cooling system is incapable of controlling the temperature by dissipating the heat flux generated by the electric motor [4,5,6]. Therefore, the cooling system is key to satisfying the performance and reliability of electric motors.
Conventional cooling systems for electric motors commonly employ air or water as their coolant media [7,8,9,10]. As a solution to increase the heat transfer capability of air-cooled electric motors, fins attached to the body of the electric motor are employed [11], which, in some cases, is not a practical solution, due to space constraints. As air is a relatively poor coolant, for compact powertrains, employing cooling systems with a liquid coolant is a superior choice [12,13,14,15]. In the case the fluid is used for cooling, the temperature of the electric motor can be reduced by increasing the heat transfer coefficient of the coolant. In [16], an empirical investigation of an enclosed cooling system for an electric motor was performed.
One of the most common cooling methods for electric motor applications is the use of cooling jackets, in which a coolant absorbs the heat flux generated by the electric motor, avoiding the excessive rise in temperature [17,18,19,20]. Reducing the thermal capacity of the coolant fluid and increasing the speed of the coolant fluid are common methods for improving the heat transfer of a cooling system [21].
Regarding enhancing the heat transfer capability through increasing the velocity of the coolant, vortex generators were used in cooling channels to increase the heat transfer capability of the cooling system [22]. Vortex generators increase the heat transfer coefficient by changing the fluid velocity profile, changing the boundary layer arrangements, and generating the secondary flow. In [23,24], the use of the winglet vortex generator, triangular barrier, and rib-roughened channels was investigated. In [25], the performance of a half-coiled jacket with a delta winglet vortex generator was examined. The results showed that the heat transfer is unpredictable in the case where the angle of the delta winglet is 25 to 30°.
Employing advanced coolants such as nanofluids with high heat transfer coefficients and good fluid flow performance is an effective way to improve the heat transfer performance of cooling systems [26]. Recently, the usage of adding nanoparticles to coolant fluids has attracted much research attention due to its advantage of increasing the heat transfer capability of cooling systems [27]. Nanoparticles, due to their high thermal conductivity coefficients, increase the heat transfer rate and improve the performance of the cooling system.
The heat transfer performance of SiO2-water nanofluid with different nanoparticle concentrations in an automotive radiator consisting of flattened tubes was experimentally studied in [28]. It was reported that the maximum increment in convection heat transfer was noticed for the highest nanoparticle concentration of SiO2-water nanofluid. However, fluid flow performance was not considered. Thermal performances of Al2O3/CNC and Al2O3/TiO2 nanofluid coolants for radiator applications were studied in [29]. According to the experimental results, it was shown that heat transfer parameters such as the heat transfer coefficient have a proportional relationship with the volumetric flow rate. The heat transfer improvement in thermoelectric-based automotive waste heat recovery systems by using nanofluid was studied in [30]. The analyses were carried out based on mathematical models. It was shown that employing nanofluids can effectively improve the heat transfer performance of the waste heat recovery system, and the increase in the nanofluid concentration has a positive effect on the output performance of the system. However, in this study, the effect of increasing the concentration of nanoparticles from the point of view of fluid flow has not been investigated. In [31], the application of nanofluid in the electric motor cooling system has been studied from both aspects of heat transfer and fluid flow using Ansys Fluent CFD analysis. However, the concentration range of nanoparticles has been limited and only the positive effect of adding nanoparticles to the base fluid has been investigated, and its negative effect on the temperature gradient at the channel walls and the increase in diameter of the boundary conditions have not been investigated.
It is worth noting that, although adding nanoparticles to coolants leads to the increase in heat transfer capability of the coolant, due to the increase in the density and viscosity of the fluid because of the addition of nanoparticles, the pressure drops, and the required pumping power in the fluid increases. This is not a desirable fluid flow phenomenon. Therefore, to justify the performance of cooling systems employing nanofluid coolants, both thermal and fluid flow performance analyses are necessary [32].
In this paper, the thermal performance of an indirect cooling system of the electric motor employing a cooling jacket and Al2O3-water nanofluid coolant was investigated. Modeling approaches were described and used to establish a numerical model of the cooling system. Effects of various heat transfer and fluid flow parameters on the heat transfer performance of the cooling system were investigated. The dual effect of adding nanoparticles to the base fluid on heat transfer performance was investigated. Apart from evaluating the overall performance of the cooling system based on both heat transfer and fluid flow aspects, as one of the main contributions of this study, the beneficial level of increasing nanoparticle concentration was investigated. To examine the overall performance of the cooling system, a performance evaluation index was defined that is able to determine the pros and cons of using nanofluids in different conditions.

2. Modeling

Physical, mathematical, and numerical modeling approaches were employed to establish a model of the problem and provide a platform for the cooling system performance analysis.

2.1. Geometry

The designed cooling system in this paper consisted of a cooling jacket with spiral cooling channels. Figure 1 shows a schematic of the meshed model of the studied cooling system and solid and fluid domains of the cooling system with different turns numbers. The cooling jacket was designed with spiral channels extracting heat from stator and end-winding surfaces. The diameter of the electric machine was 190 mm. The diameter of the cooling jacket was 210 mm. The thickness of the cooling jacket was 10 mm. In this study, three different models of cooling systems with 4, 6, and 8 channel turns were developed. The cooling channels were filled with Al2O3-water nanofluid. Cooling channels carrying nanofluid were made of aluminum and the material of the electric motor body was steel. Geometric values of the cooling system and electric motor models are listed in Table 1.

2.2. Mathematical Model

A mathematical model was employed to solve the fluid flow and heat transfer. In fact, the mathematical model was the basis of the numerical model and numerical analysis. Therefore, in this section, required equations for the calculation of the physical properties of nanofluids are presented.
Using valid empirical relationships for parameters such as density, specific heat capacity, thermal conductivity coefficient, and nanofluid viscosity, the determination of thermophysical properties to determine the flow behavior and heat transfer at different volume fractions of the nanofluid was implemented as follows.
The density of the nanofluid is expressed as:
ρ n f = 1 φ ρ f b + φ ρ p  
where ρnf and ρp are the density of the base fluid and nanoparticles, respectively. φ refers to the volume fraction of nanoparticles.
The specific heat of the nanofluid is:
ρ C p n f = 1 φ ρ C p f b + φ ρ C p p
where Cpnf, Cpfb, and Cpp are the specific heat of the nanofluid, base fluid, and nanoparticles, respectively.
The effective thermal conductivity of the nanofluid is calculated as [33]:
k e f f , n f k f b = k p + 2 k f b + 2 φ k p k f b k p + 2 k f b φ k p k f b
where keff,nf is the effective thermal conductivity of the nanofluid. kp and kfb are the thermal conductivities of the nanoparticles and base fluid, respectively.
According to the numerical model of dynamic viscosity obtained from experimental studies in [34], viscosity is given by:
μ n f = μ f b 123 φ 2 + 7.3 φ + 1
where μnf and μfb are viscosities of the nanofluid and base fluid, respectively.
The Reynolds number is defined by
R e = ρ n f u i n D h μ n f
where uin is the inlet velocity and Dh is the hydraulic diameter. In this study, cooling channels were rectangular with cross-sections of 6 × 6 mm. Therefore, Dh in this study was 6 mm.
The heat transfer coefficient (h) is derived by
h = q w T w T b
where qw is the wall heat flux. Tw and Tb are wall and bulk temperatures, respectively. In this study, qw was considered constant and its value was 3500 W/m2.
Tb and Tw are calculated as follows:
T W = 1 A C T d A c
T b = T m x = 1 u ¯ A C A u T d A c
where Ac is the cross-sectional area and u ¯ is the mean velocity. T and u are temperature and velocity profiles, respectively.
The Nusselt number is expressed as:
N u = h · D h k n f
The fanning friction factor (f) is defined by
f = Δ P / L · D h 2   ρ n f   u i n 2
where ∆P is the pressure drop and L is the length of the channel.

2.3. Numerical Model

The electric machine and the cooling jacket were meshed and analyzed by CFD simulations. Simulations were run for different volume fractions of nanoparticles. Heat transfer and fluid flow parameters such as the heat transfer coefficient, Nusselt number, Reynolds number, fanning friction factor, and pressure drop were calculated for each volume fraction of nanoparticles. Using the single-phase modeling approach that is commonly used for the heat transfer analysis of nanofluids, the resulting nanofluid was considered as a homogeneous single-phase fluid with enhanced thermophysical properties [35,36]. Thermophysical properties of the resulting nanofluid for various nanoparticle concentrations can be estimated by (1) to (4) based on the thermophysical properties of the base fluid and nanoparticles. The estimated nanofluid thermophysical properties are presented in Section 2.3.3.
As the single-phase modeling approach was adopted in this study, thermophysical properties of the nanofluid were taken as temperature-independent. This is the most commonly employed modeling approach in the heat transfer study of nanofluids [35,36]. In [36], the accuracy of the single-phase homogenous fluid model for the heat transfer study of nanofluids was compared with two-phase and discrete phase modeling approaches. It was found that the single-phase model offers the fastest simulation with results that are in good agreement with the experimental test results.

2.3.1. Grid Independence Validation

As the accuracy of the obtained numerical results is strongly affected by the number of nodes in the meshed model, as a preprocessing step, the accuracy and independence of the results from the number of mesh nodes must be investigated. Different simulations were performed at a Reynolds number of 2000 for the cooling jacket with 8 turns using water as the coolant. An inflation layer with y+ < 5 was used near the channel walls that, according to [35,37], was in a range with fine accuracy. The computed heat transfer coefficients versus the number of nodes are listed in Table 2. As can be seen, as the number of nodes exceeded 6 × 10⁶, the variation in the computed heat transfer coefficient was only 0.11%. Therefore, 6 × 10⁶ nodes provided satisfactory numerical accuracy. According to the density of meshes, to overcome the high volume of calculations, a computer server with 48 cores and 124 GB of RAM was employed.

2.3.2. Validation of the Numerical Model

Simulation results were compared with an empirical correlation proposed in [38] for the Nusselt number derived from experimental results as follows:
N u = 0.7068   H e 0.514   P r 0.563   φ 0.112
where Pr and He the are Prandtl and spiral coil number, respectively, which are defined as follows:
Prandtl:
P r = μ · C p k
Spiral coil number:
H e = D e 1 + b 2 π R 2 1 2
where b is the coil pitch and R is the radius of curvature of spiral channels. De is the dean number and is defined as:
D e = R e D h 2 R  
In the validation model, the nanoparticle concentration was 0.01, the hydraulic diameter was 6 mm, the coil pitch was 26 mm, and the radius of coil curvature was 103 mm. The validation was carried out for the cooling system with a turns number of 8. The results obtained from the simulation and the results obtained from the calculation of the Nusselt number using the correlation are listed in Table 3. As can be seen, the simulated Nu values were in good agreement with the calculated Nu values with an average error of 5.77%.

2.3.3. Boundary Conditions

At the inlet, the thermal boundary condition was a constant temperature of the inlet fluid at 70 °C. At the outlet, a zero temperature gradient was applied as the outlet thermal boundary condition. The stator, cooling jacket, and channel solid walls were considered to be under a constant heat flux of 3500 W/m2. The outer surface and side surfaces of the cooling jacket were assumed to be adiabatic. Regarding the inlet fluid velocity, the inlet Reynolds numbers were 500, 1000, 1500, and 2000 corresponding to four different inlet velocities. Shear conditions at the walls were considered as no-slip.
The employed nanofluid was Al2O3-water. The effects of adding nanoparticles on the fluid flow and thermal performance of the cooling system were studied for different volume fractions of the nanoparticles. Thermo-physical properties of the nanofluid and the base fluid (water) are listed in Table 4 [39].

3. Results

The cooling system was analyzed by 3D CFD simulations. Numerical simulations were performed under the boundary conditions described in the previous section. The effect of different geometries of the cooling jacket and concentrations of nanoparticles were studied. The applied heat flux was constant. Thermophysical properties of the nanofluids were considered temperature-independent and are listed in Table 4. It should be mentioned that in all simulations, the inlet temperature considered was 70 °C. The fluid flow, thermal characteristics, and performance of the cooling system for different given concentrations of nanoparticles and different geometries of the cooling jacket are discussed, and the computed results were compared with the results obtained from the use of water as the coolant. The CFD simulations were carried out for different values of Reynolds number, nanoparticle concentration, and channel turns number. The Reynolds numbers ranged between 500 to 2000 with steps of 500 (500, 1000, 1500, and 2000). In addition, the cooling systems with various combinations of channel turns numbers (4, 6, and 8) and nanoparticle concentrations (0, 1%, 2%, 4%, and 5%) were studied. In total, 60 cases were studied.

3.1. Heat Transfer Characteristics

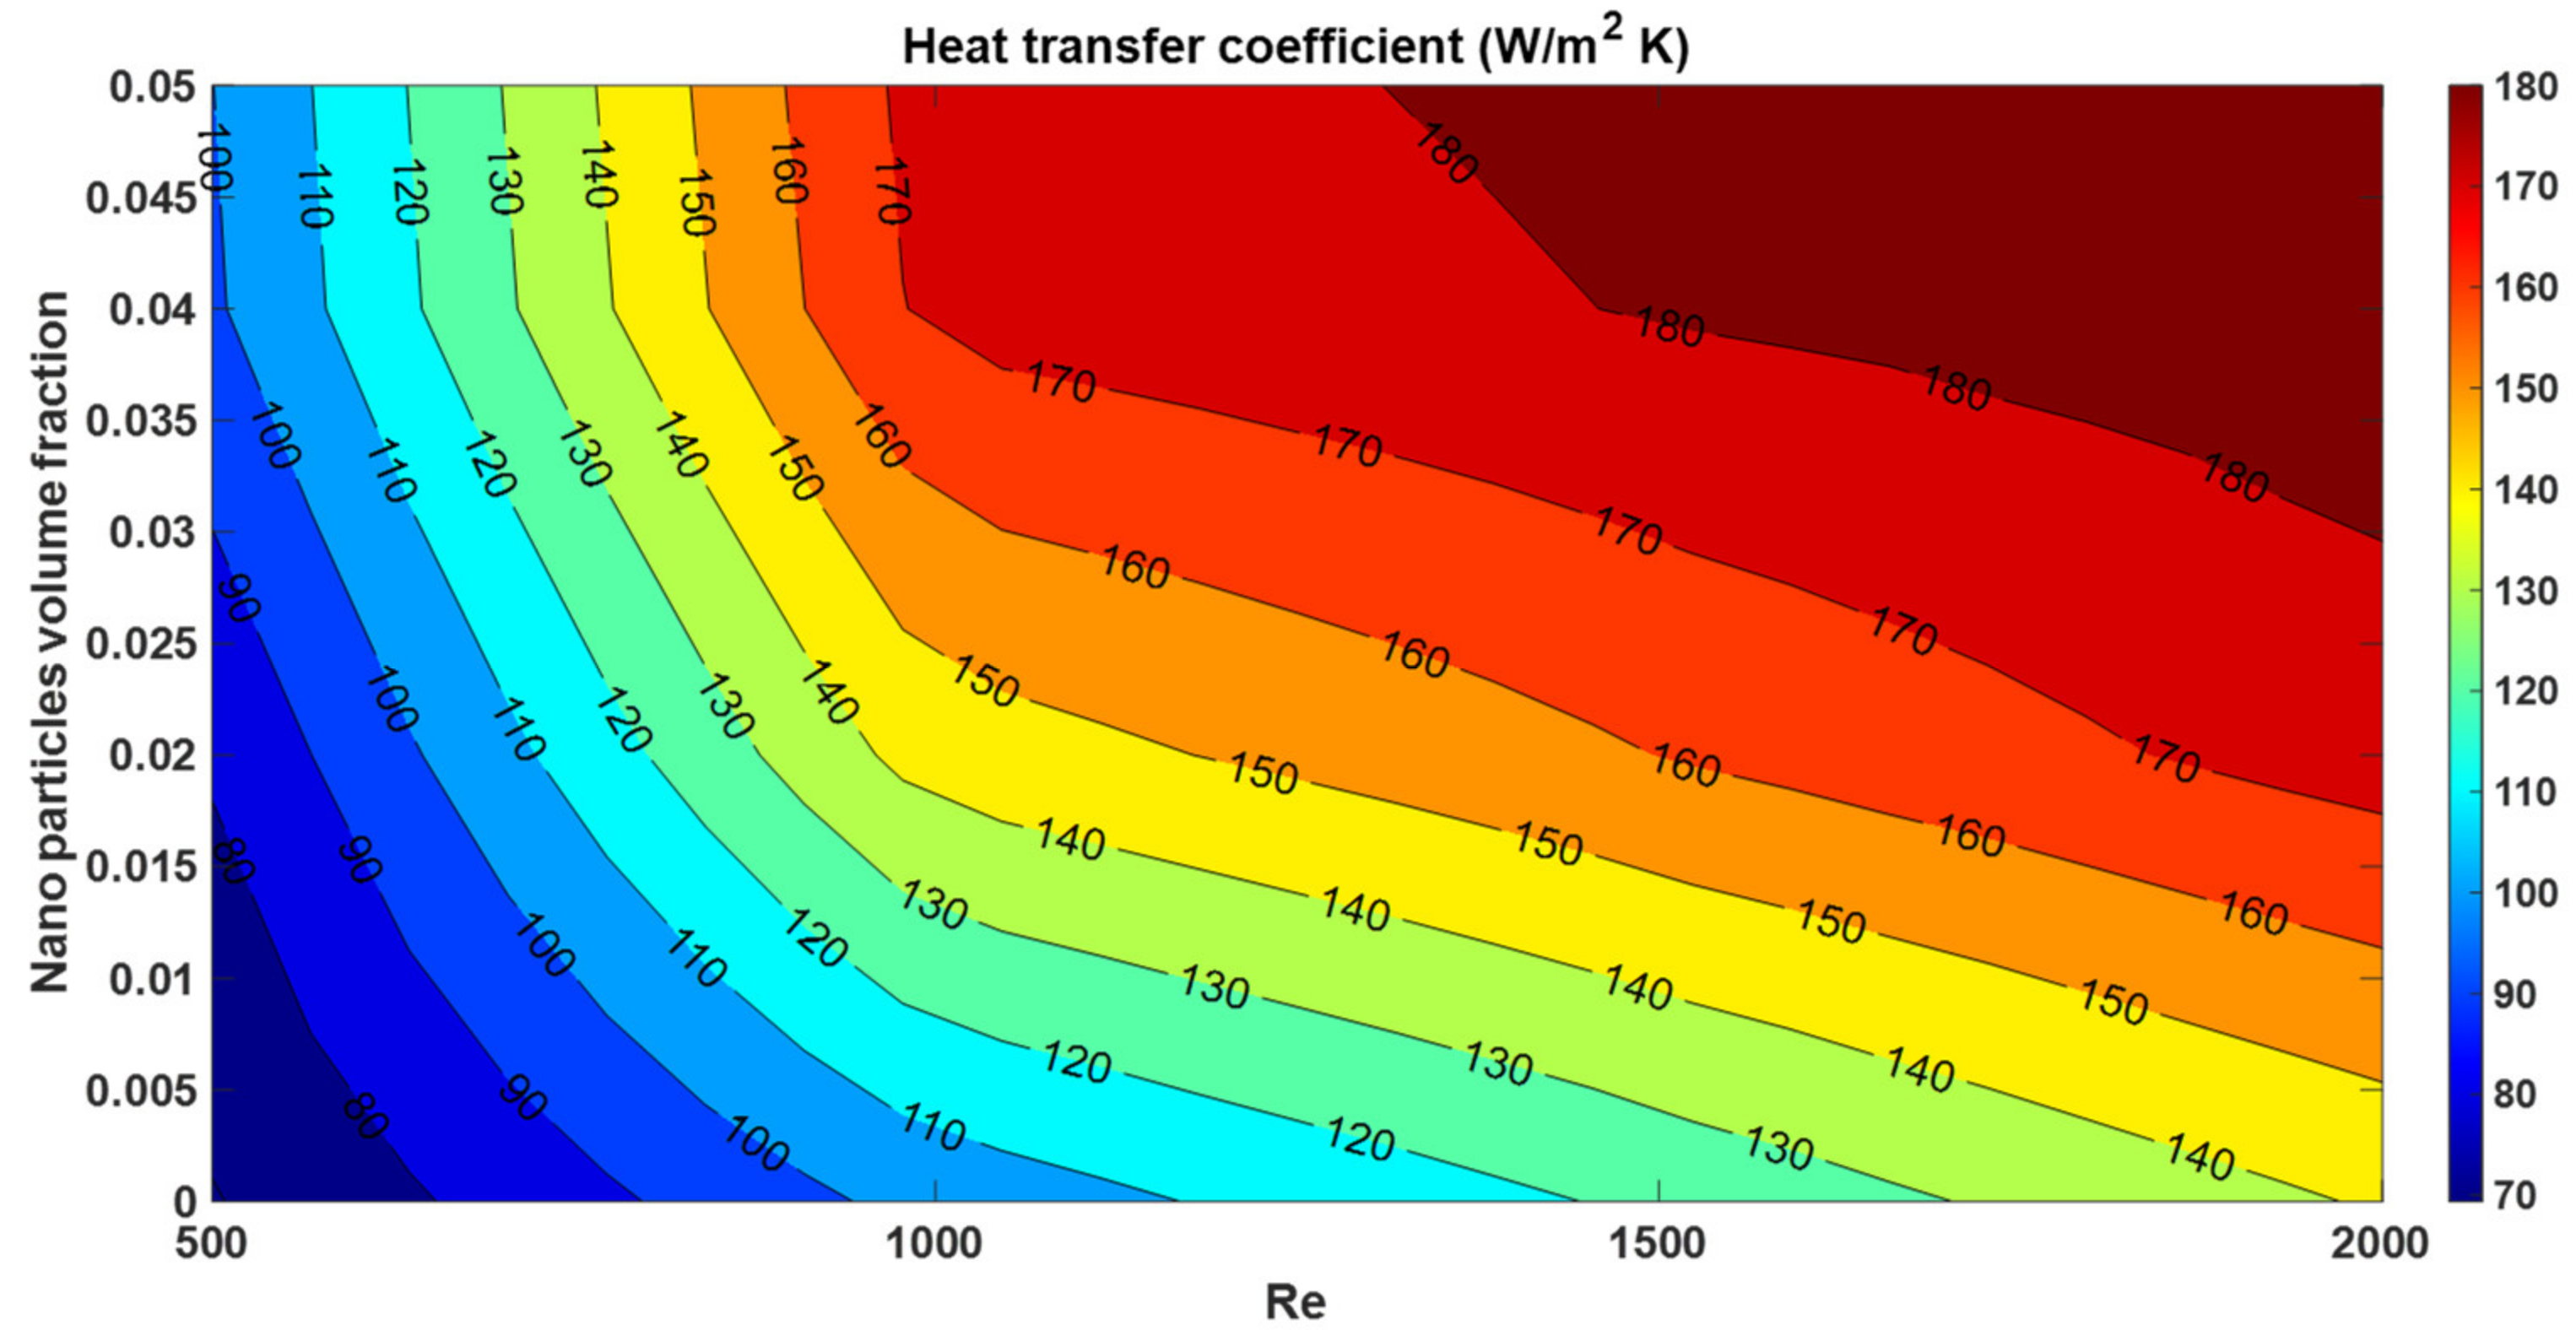
Figure 2 shows a contour plot of heat transfer coefficient variations against the variation in pumping power (Reynold number) and nanoparticle concentrations for nanofluids flowing in cooling channels with 8 turns. This figure shows the variation in heat transfer coefficient for Reynolds numbers of 500, 1000, 1500, and 2000 and nanoparticle concentrations of 0, 1%, 2%, 4%, and 5% (20 cases). The contour plot shows that the heat transfer coefficient increases with the Reynolds number. In addition, at any pumping power, increasing the concentration of nanoparticles increases the heat transfer coefficient.
To better illustrate the effect of the Reynolds number and the concentration of nanoparticles on changes in the heat transfer coefficient, relative heat transfer coefficient changes to water are plotted in Figure 3 for φ = 2%, φ = 4%, and φ = 5%. According to the results, compared to water, the maximum enhancement percentage of the heat transfer coefficient occurs at a Reynolds number of around 1000 and its values are 39.1%, 66.02%, and 67.7% for nanoparticle volume fractions of 2%, 4%, and 5%, respectively.
The increase in heat transfer coefficient due to the addition of nanoparticles in the base fluid results from the fact that the addition of nanoparticles to the base fluid increases its thermal conductivity. This improves the thermal penetration depth of the coolant fluid. In addition, according to Table 4, the presence of nanoparticles in the base fluid leads to a reduction in the specific heat capacity of the base fluid. As the specific heat capacity is defined as the amount of thermal energy required to raise the temperature of the coolant by one degree Celsius, the reduced specific heat capacity causes the coolant temperature to rise faster due to the exposure to heat flux. Therefore, according to (6), as the specific heat capacity of the coolant decreases, the temperature difference between the spiral channel wall and the coolant (the denominator of Equation (6)) decreases and the heat transfer coefficient increases. In other words, the decreased special heat capacity increases the amount of the absorbed heat flux by the coolant fluid. Therefore, the nanofluid with the nanoparticle concentration of 5% shows the largest heat transfer coefficient increase. However, the increase in the relative heat transfer coefficient enhancement for increasing the volume fraction from 4% to 5% is much smaller than the case of increasing the volume fraction from 2% to 4%. In fact, adding nanoparticles to a base fluid affects the heat transfer coefficient in two different ways. While the increase in nanoparticle concentration enhances the heat transfer coefficient by increasing the thermal conductivity of the nanofluid, increasing the nanoparticle concentration can lead to a reduction in the temperature gradient at the wall of the channels (increasing thickness of the boundary layer).
Therefore, there are two factors that positively and negatively affect the heat transfer coefficient enhancement. Here, in the case of using the nanofluids with 5% volume fractions in a cooling jacket with 8 turns, the wall temperature gradient reduces significantly, leading to a small heat transfer coefficient improvement.
As it was mentioned, the maximum enhancement percentage of heat transfer coefficient occurs at a Reynolds number of around 1000. This is because, by the increase in Reynolds number, friction resistance reduces, leading to the improvement of convective heat transfer. On the other hand, from a specific Reynolds number onward, due to viscosity, the slope of the friction resistance changes decreases. Therefore, the heat transfer coefficient increases with the Reynolds number, but at higher Reynolds numbers, the slope of the increasing heat transfer coefficient decreases.
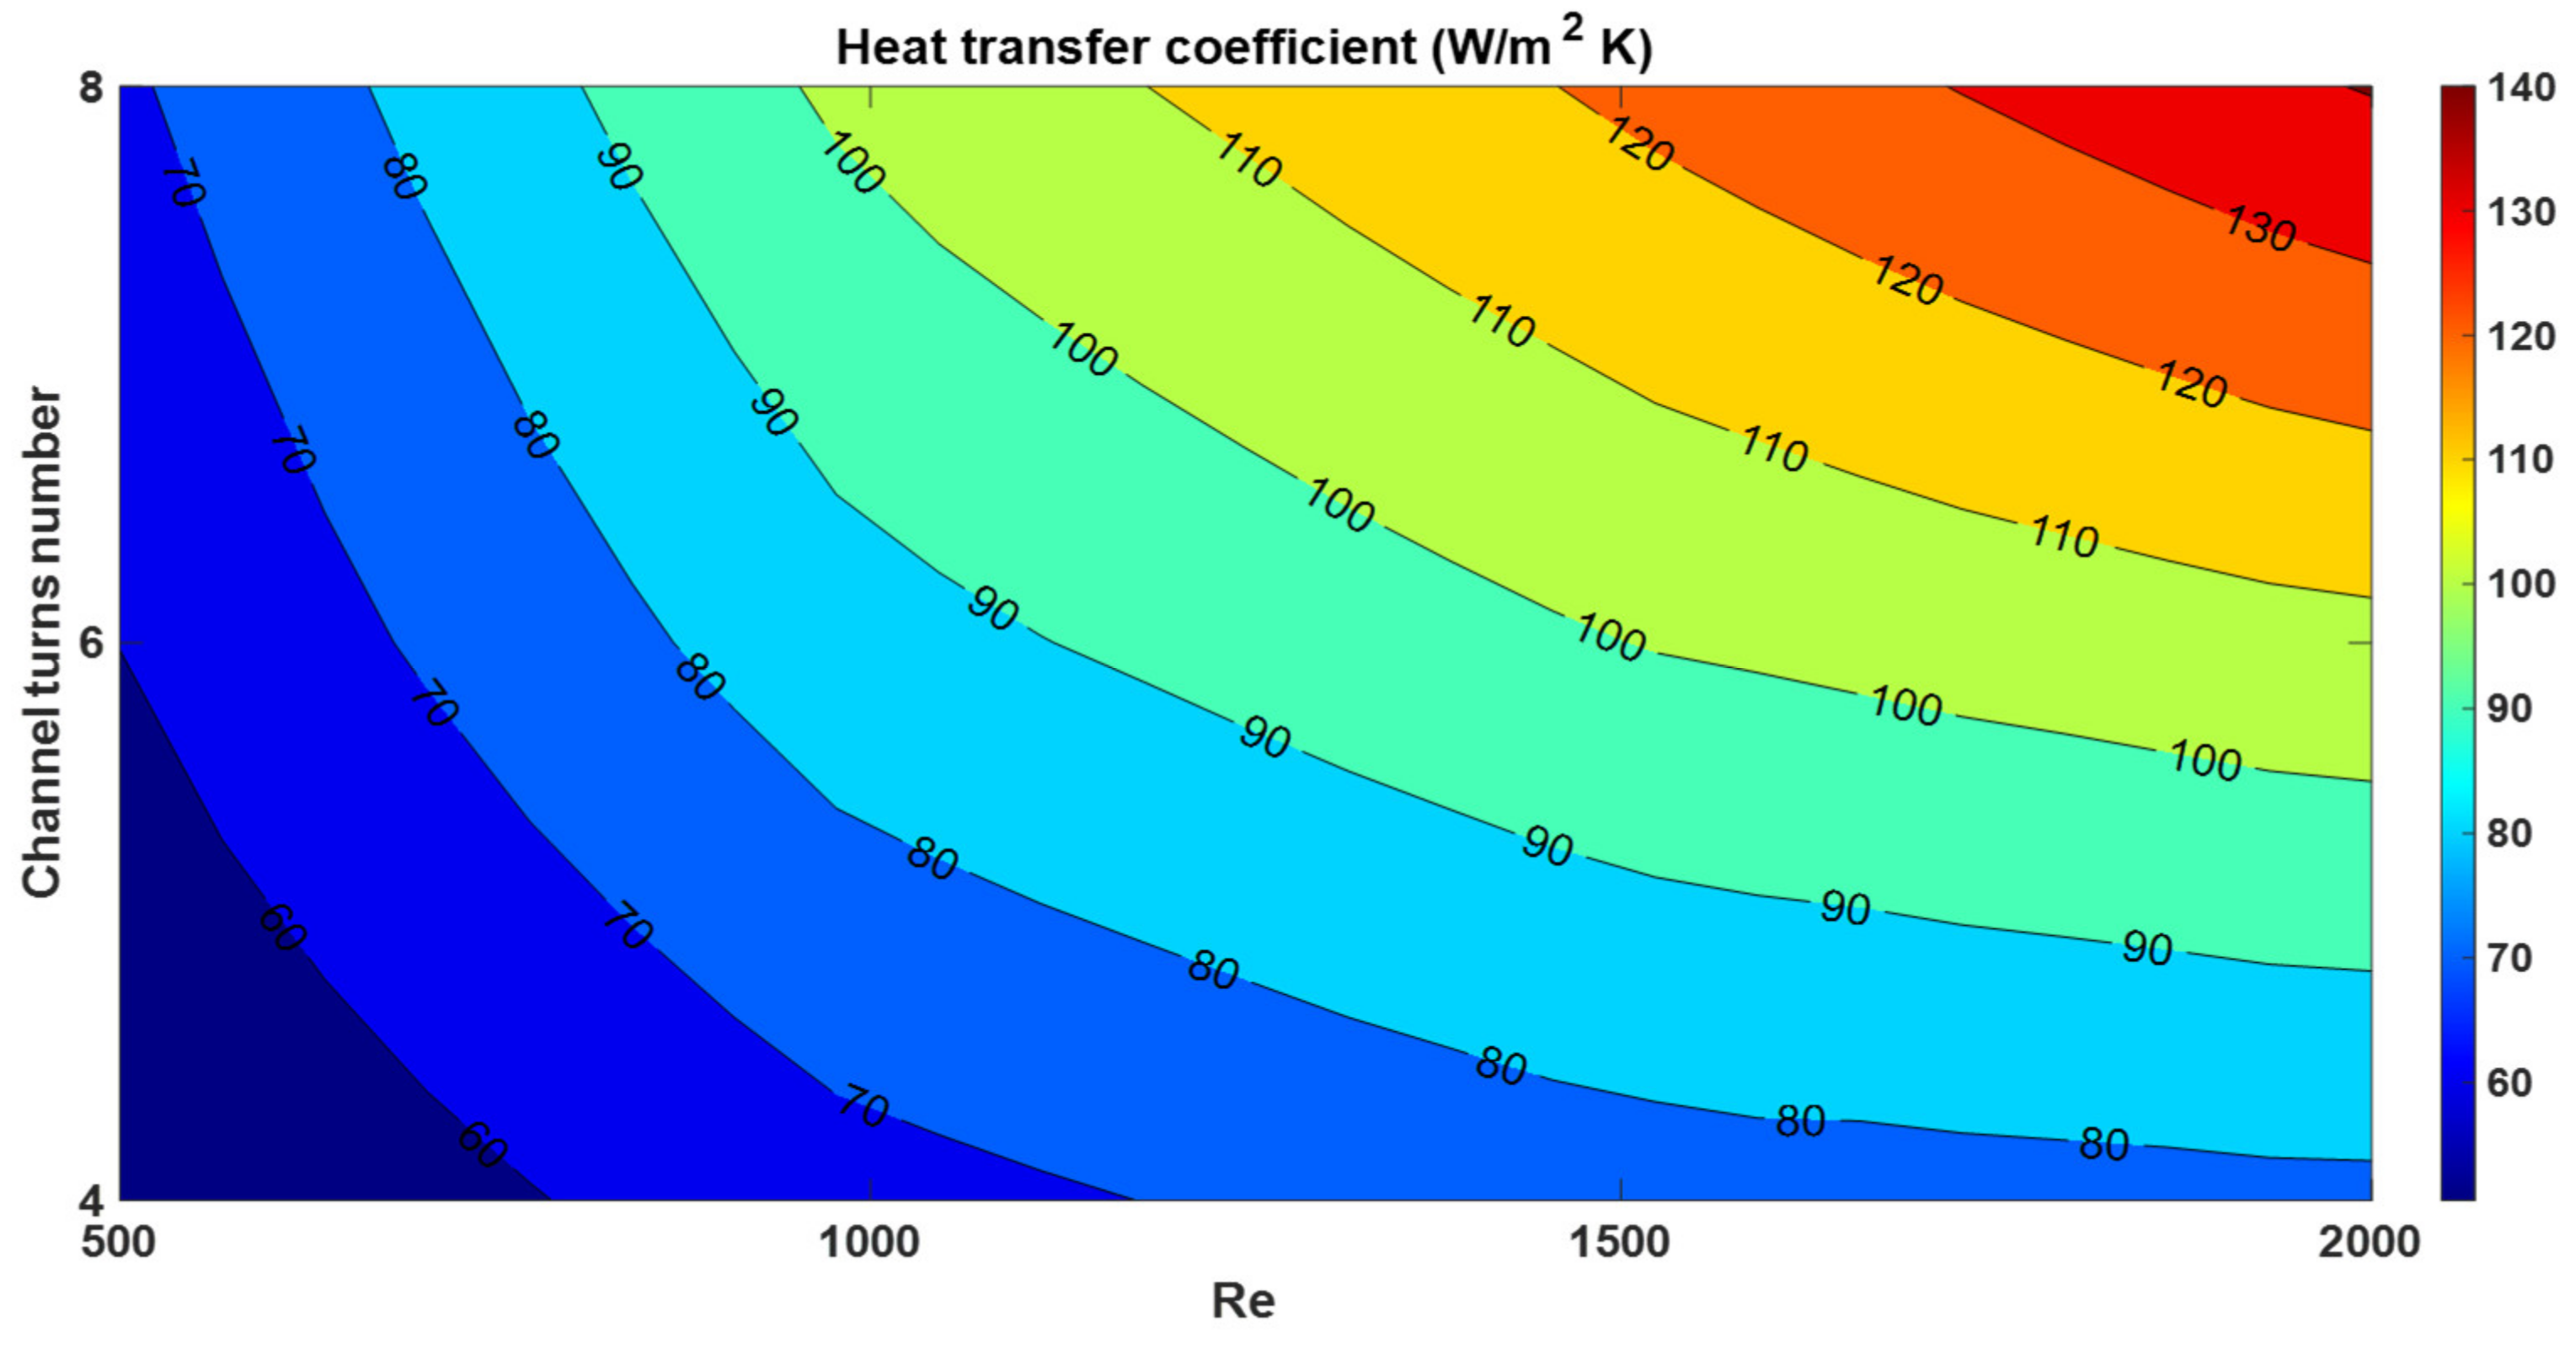
The effect of different channel turns numbers (4, 6, and 8) at Reynolds numbers of 500, 1000, 1500, and 2000 on the heat transfer coefficient for a cooling system using water as the coolant is shown in Figure 4. As it is shown in Figure 5, due to the increase in the cooling cross-sectional area, increasing the turns number of the channel improves the heat transfer from the electric motor to the coolant fluid, thus increasing the heat transfer coefficient.
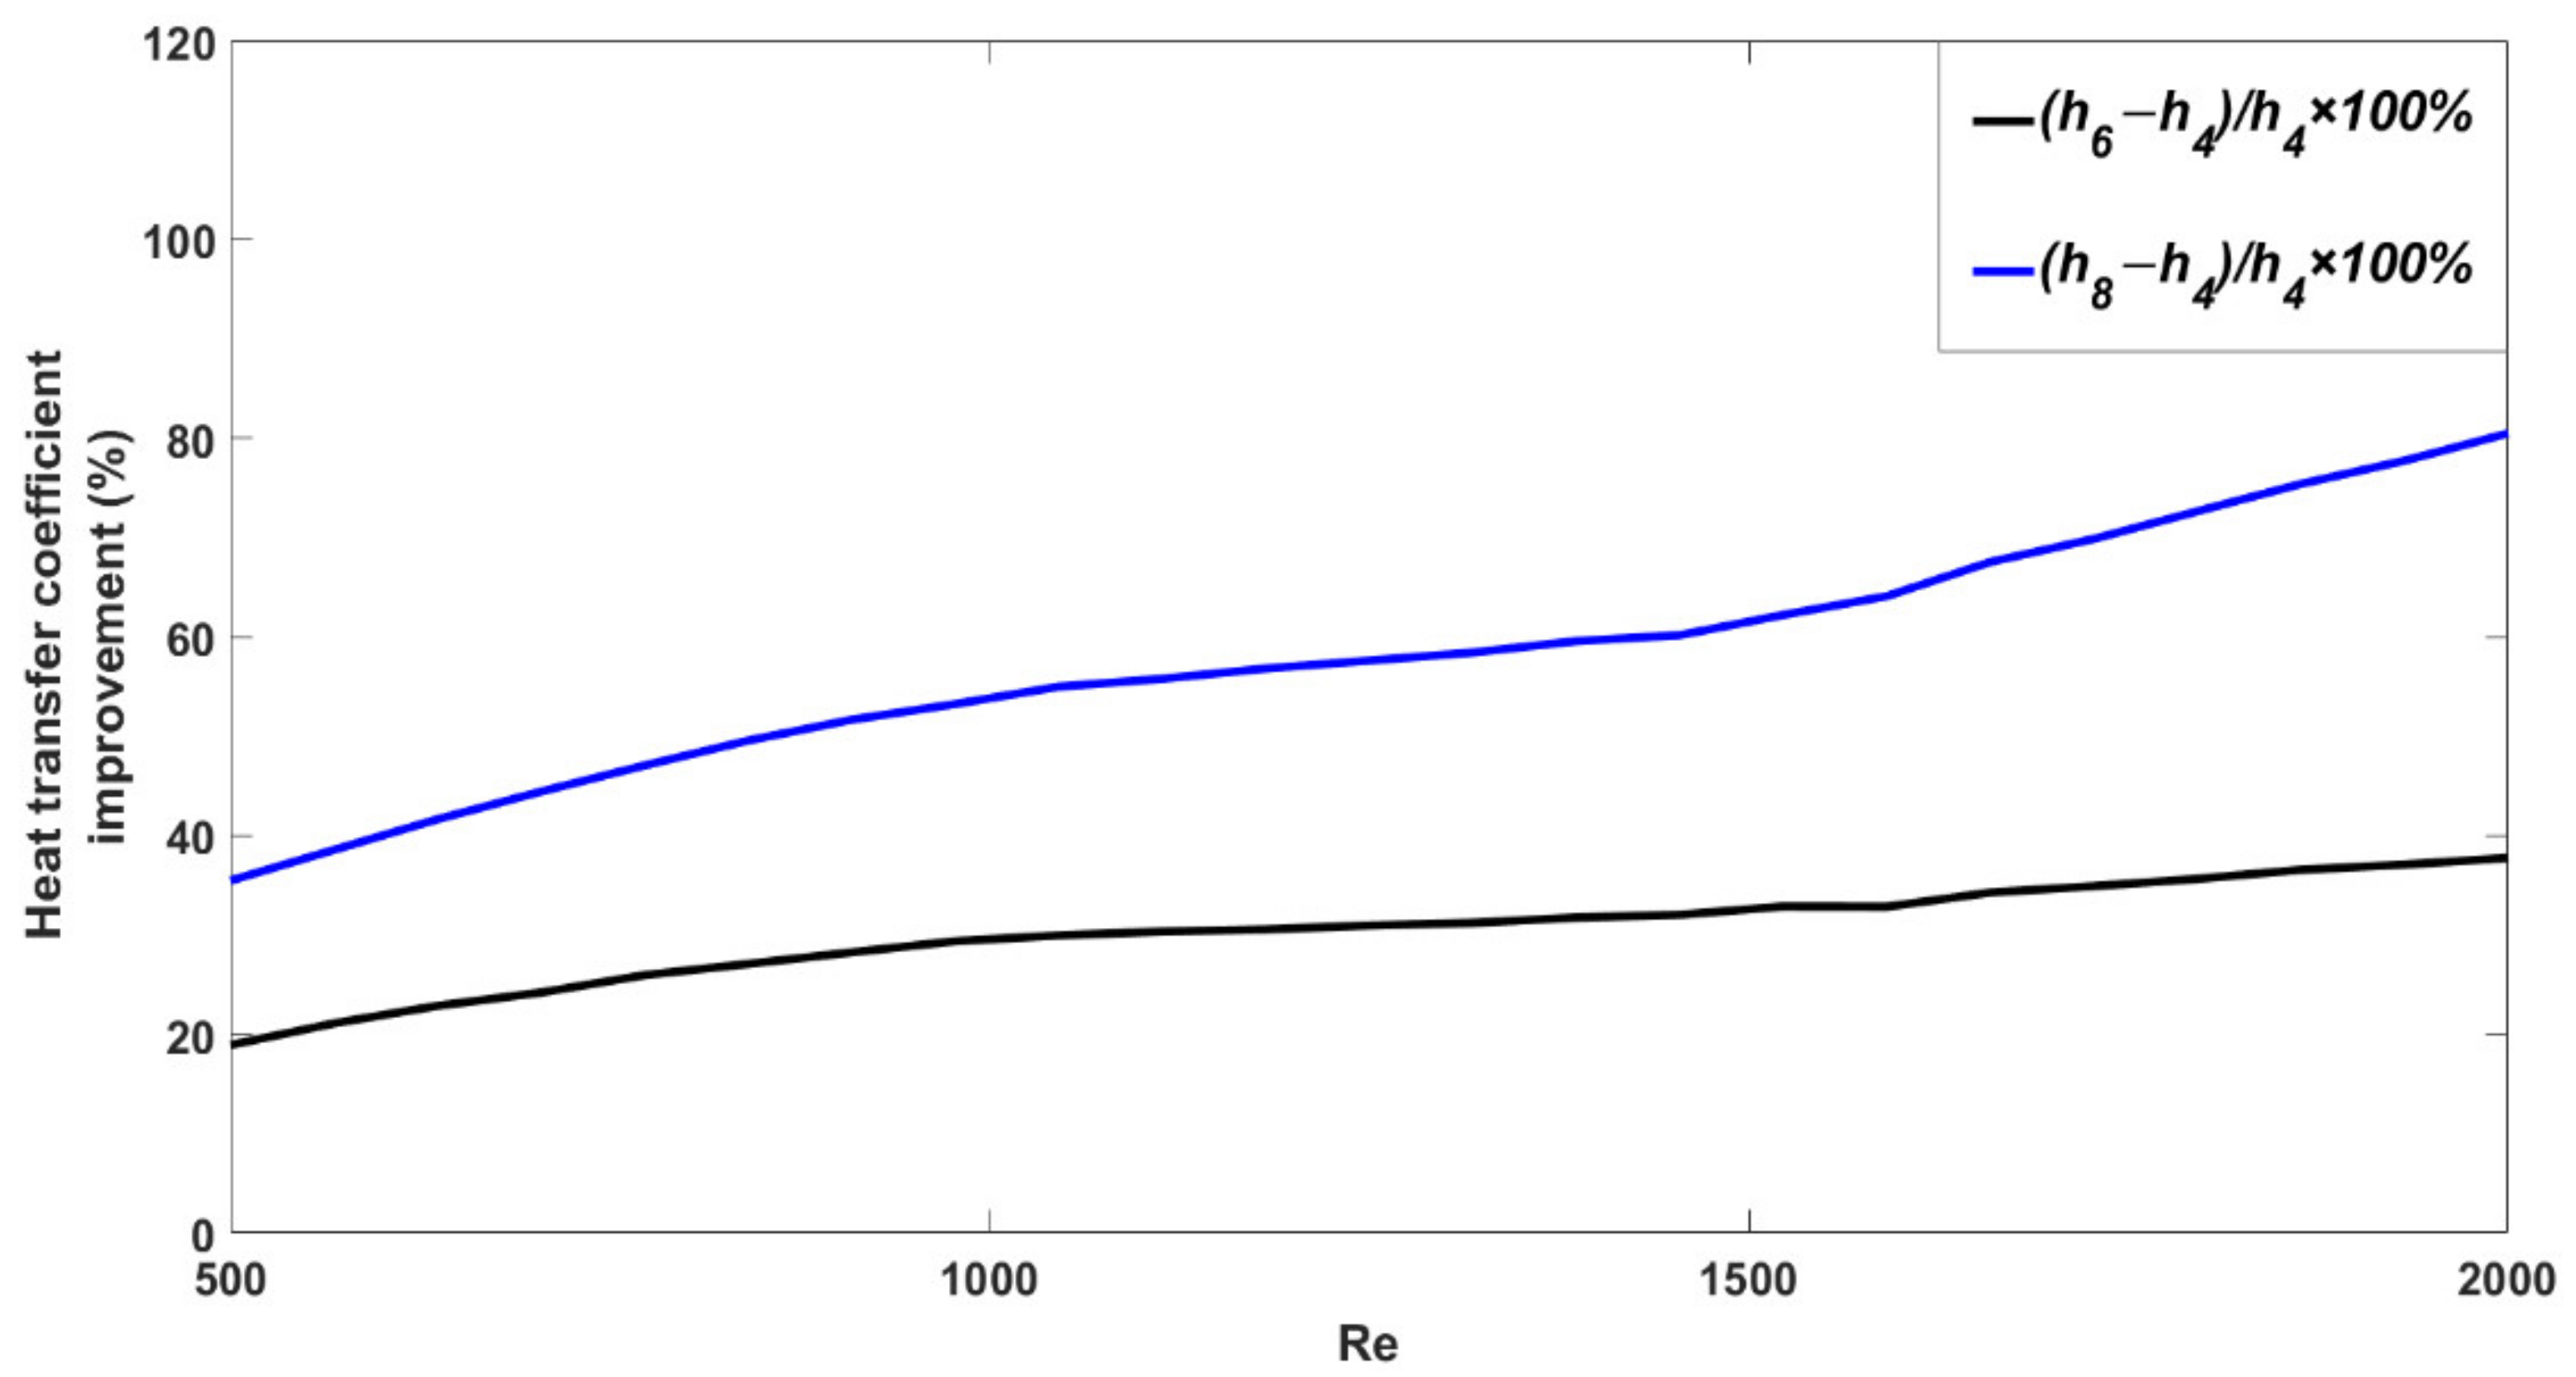
To compare the amount of the increase in heat transfer coefficient due to the increase in the turns number of channels, Figure 5 shows the relative increase in heat transfer coefficient for channels with 6 and 8 turns compared to the channel with 4 turns. According to Figure 5, as the Reynolds number increases, the heat transfer coefficient increases for both cases (6 and 8 turns), but in the case of the channel with 8 turns, this increase for larger Reynolds numbers is greater than in the case of the channel with 6 turns. This difference in the amount of improvement in heat transfer coefficient at larger Reynolds numbers is due to the fact that the pitch of the channel with 8 turns is smaller than that of the channel with 6 turns. The smaller pitch of spiral channels causes the friction factor to decrease further by increasing the Reynolds number [40]. The further reduction in the friction factor at larger Reynolds numbers further enhances the convective heat transfer.
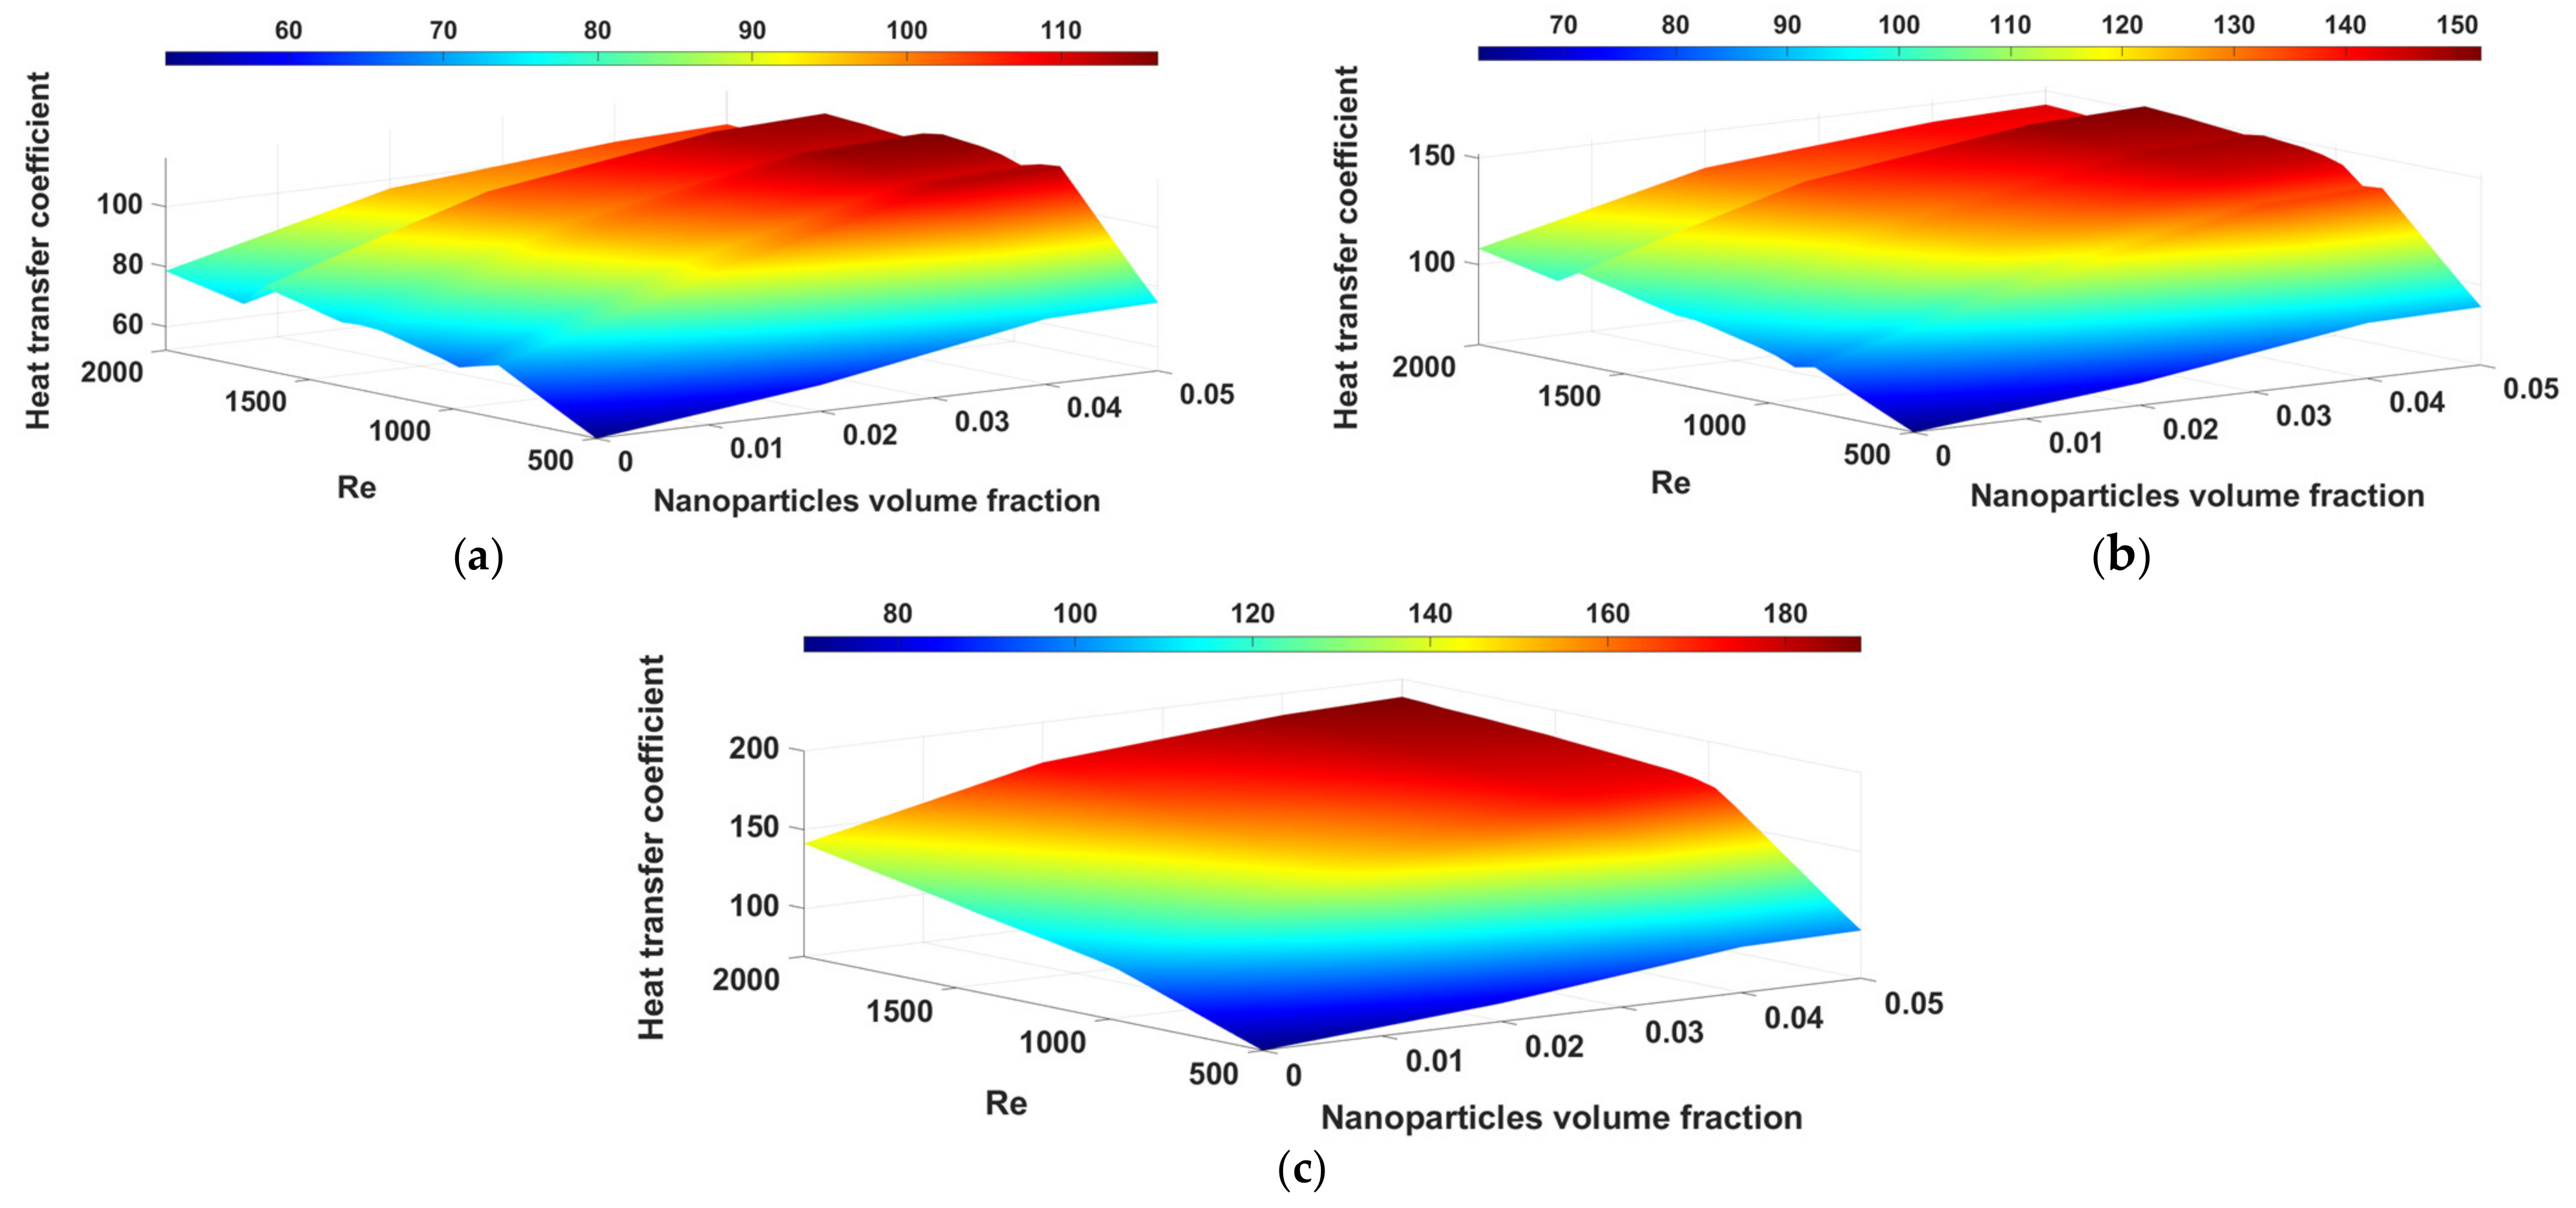
The effects of nanoparticle concentration and turns number of channels on the heat transfer coefficient at different Reynolds numbers have been illustrated separately in Figure 2, Figure 3, Figure 4 and Figure 5. Figure 6 shows the effect of these factors on the heat transfer coefficient for nanoparticle concentrations from 0 to 5% (where φ = 0 refers to the base fluid, water) and channels with turns numbers of 4, 6, and 8 at different Reynolds numbers.
According to Figure 6, from the heat transfer perspective, it can be concluded that the highest heat transfer improvement at all pumping powers was obtained for the case of using the channel with 8 turns and employing the nanofluid with a higher nanoparticle concentration.

3.2. Fluid Flow Characteristics

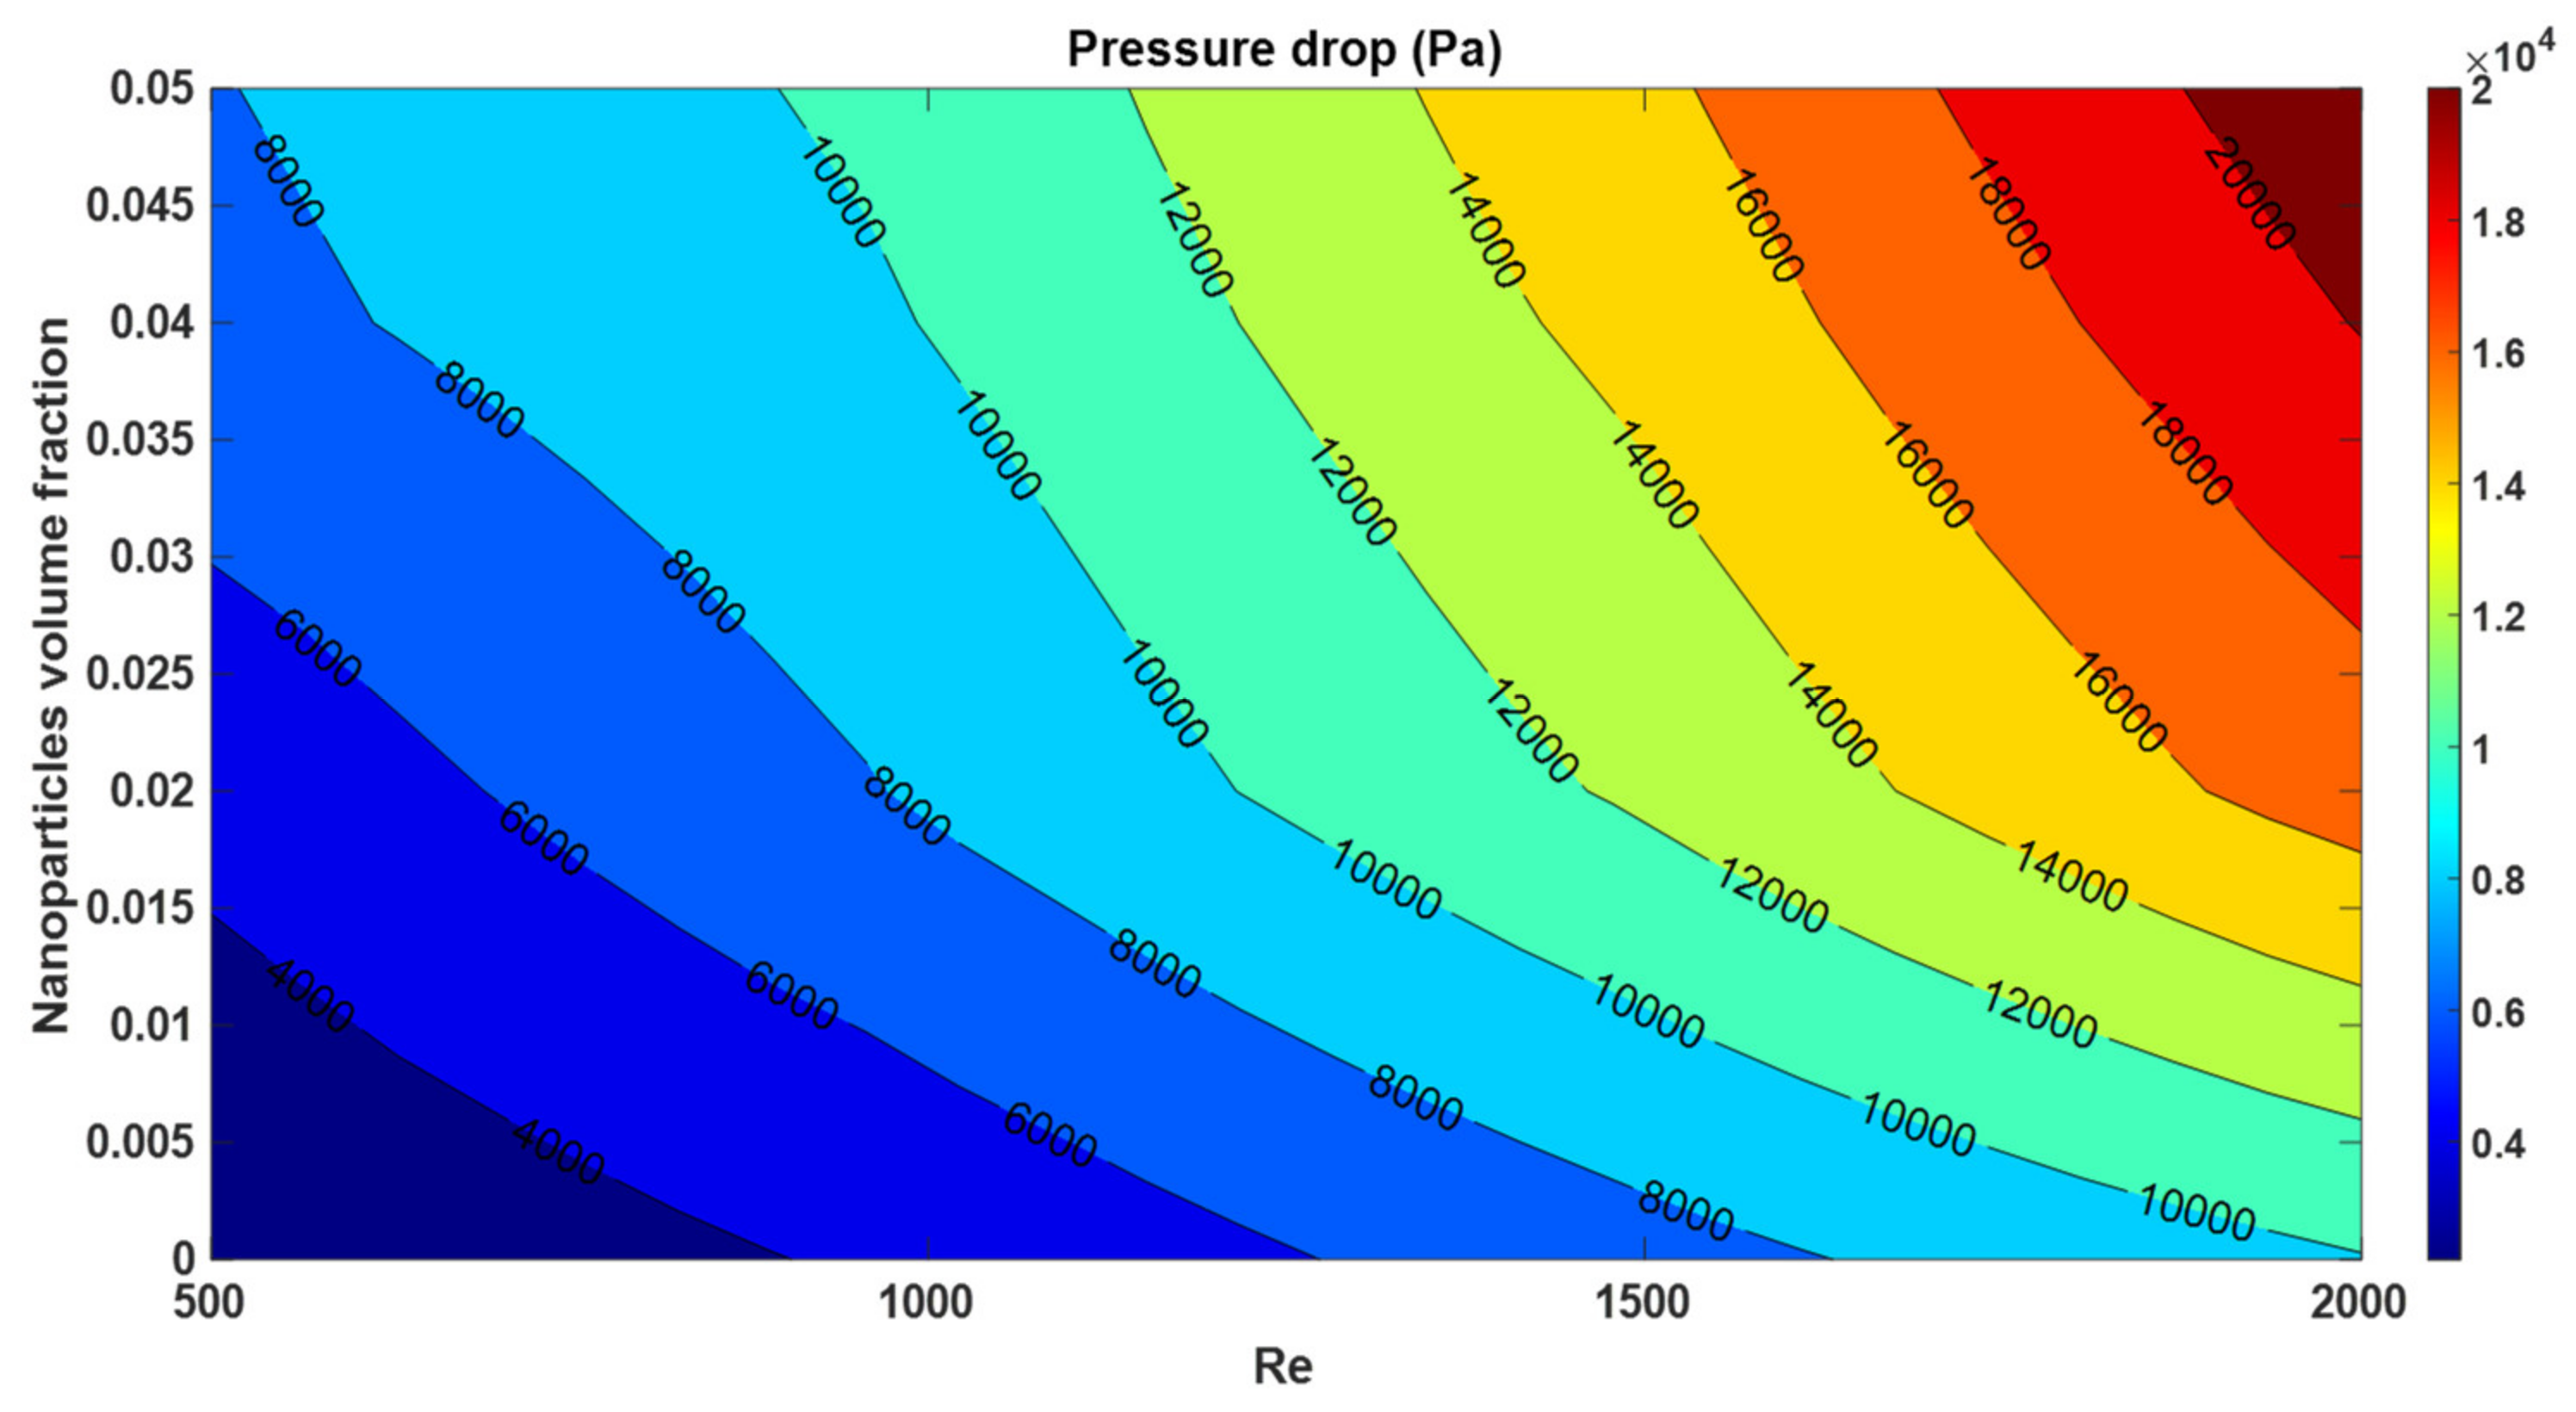
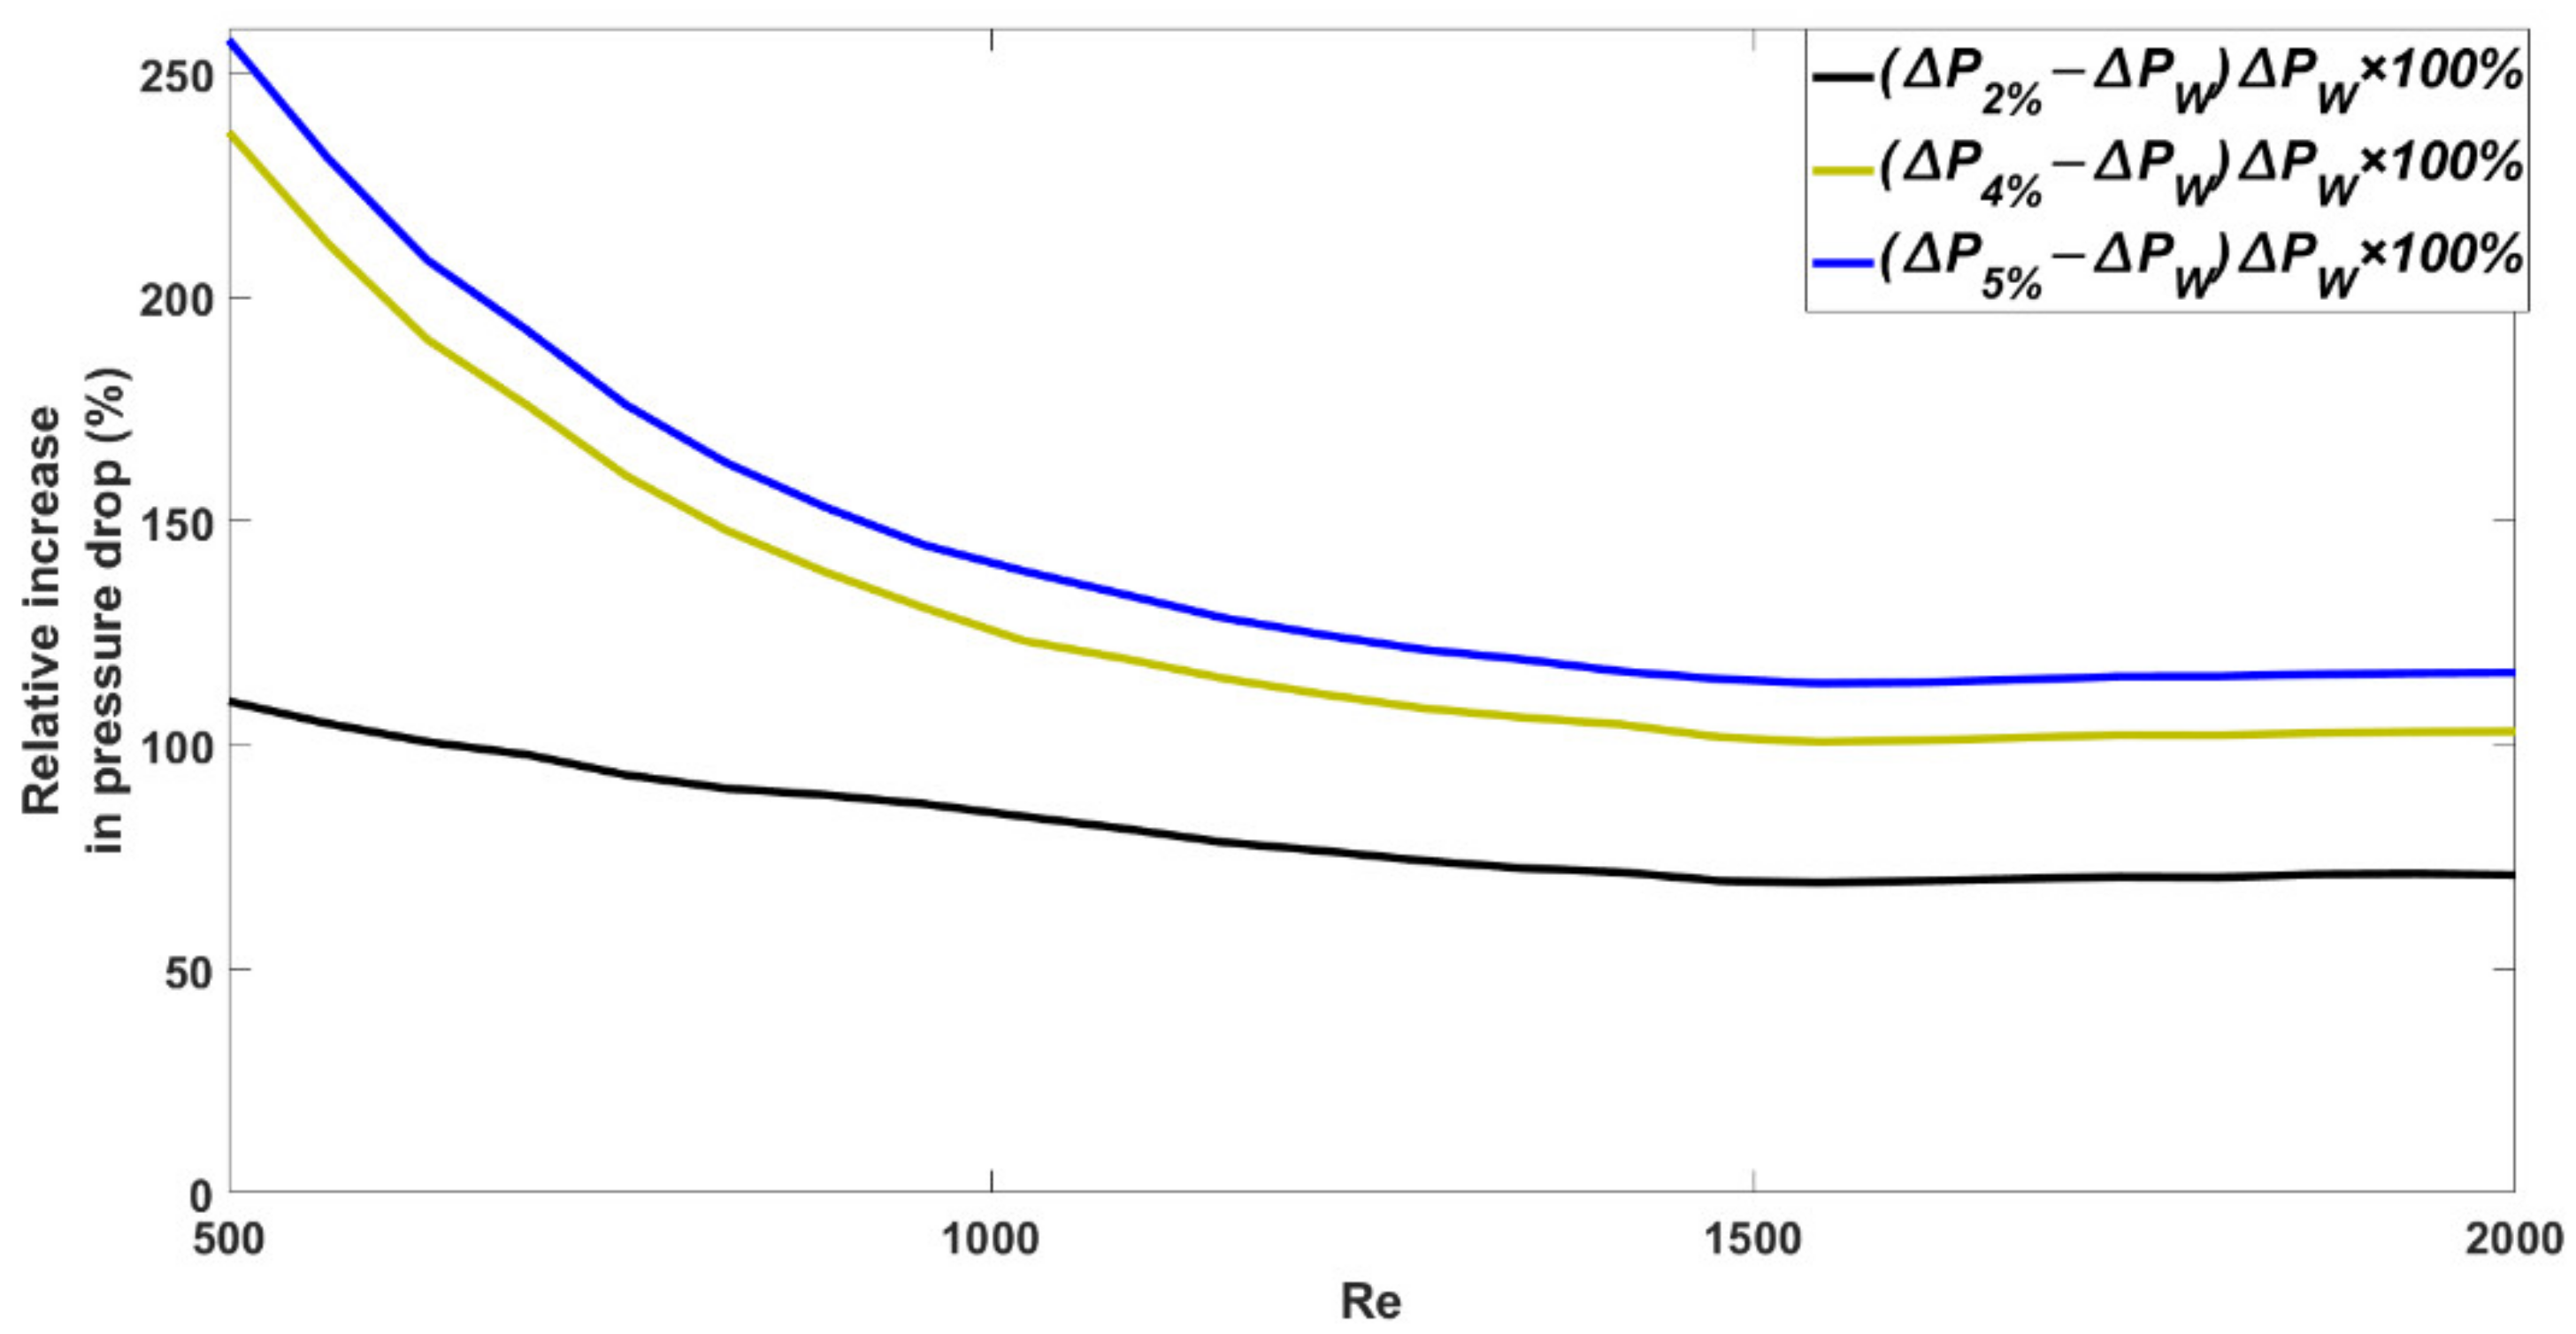
This subsection discusses the effect of geometry and fluid characteristics from the fluid flow perspective. Variations in the coolant pressure drop in the channel with 8 turns at different Reynolds numbers (500, 1000, 1500, and 2000) for nanofluids with different nanoparticle concentrations (0, 1%, 2%, 4%, and 5%) are shown in Figure 7. As can be seen, increasing the concentration of nanoparticles increases the viscosity and increases the pressure drop. The percentage of the increase in pressure drop relative to the base fluid at different Reynolds numbers is depicted in Figure 8. According to the plot, at a smaller Reynolds number, the effect of increasing the nanoparticle concentration on the pressure drop is much greater than that at large Reynolds numbers. The reason for this phenomenon is that at small Reynolds numbers, the friction factor is high, and at large Reynolds numbers, the friction factor decreases; especially, this reduction in the friction factor is greater for nanofluids with higher nanoparticle concentrations.
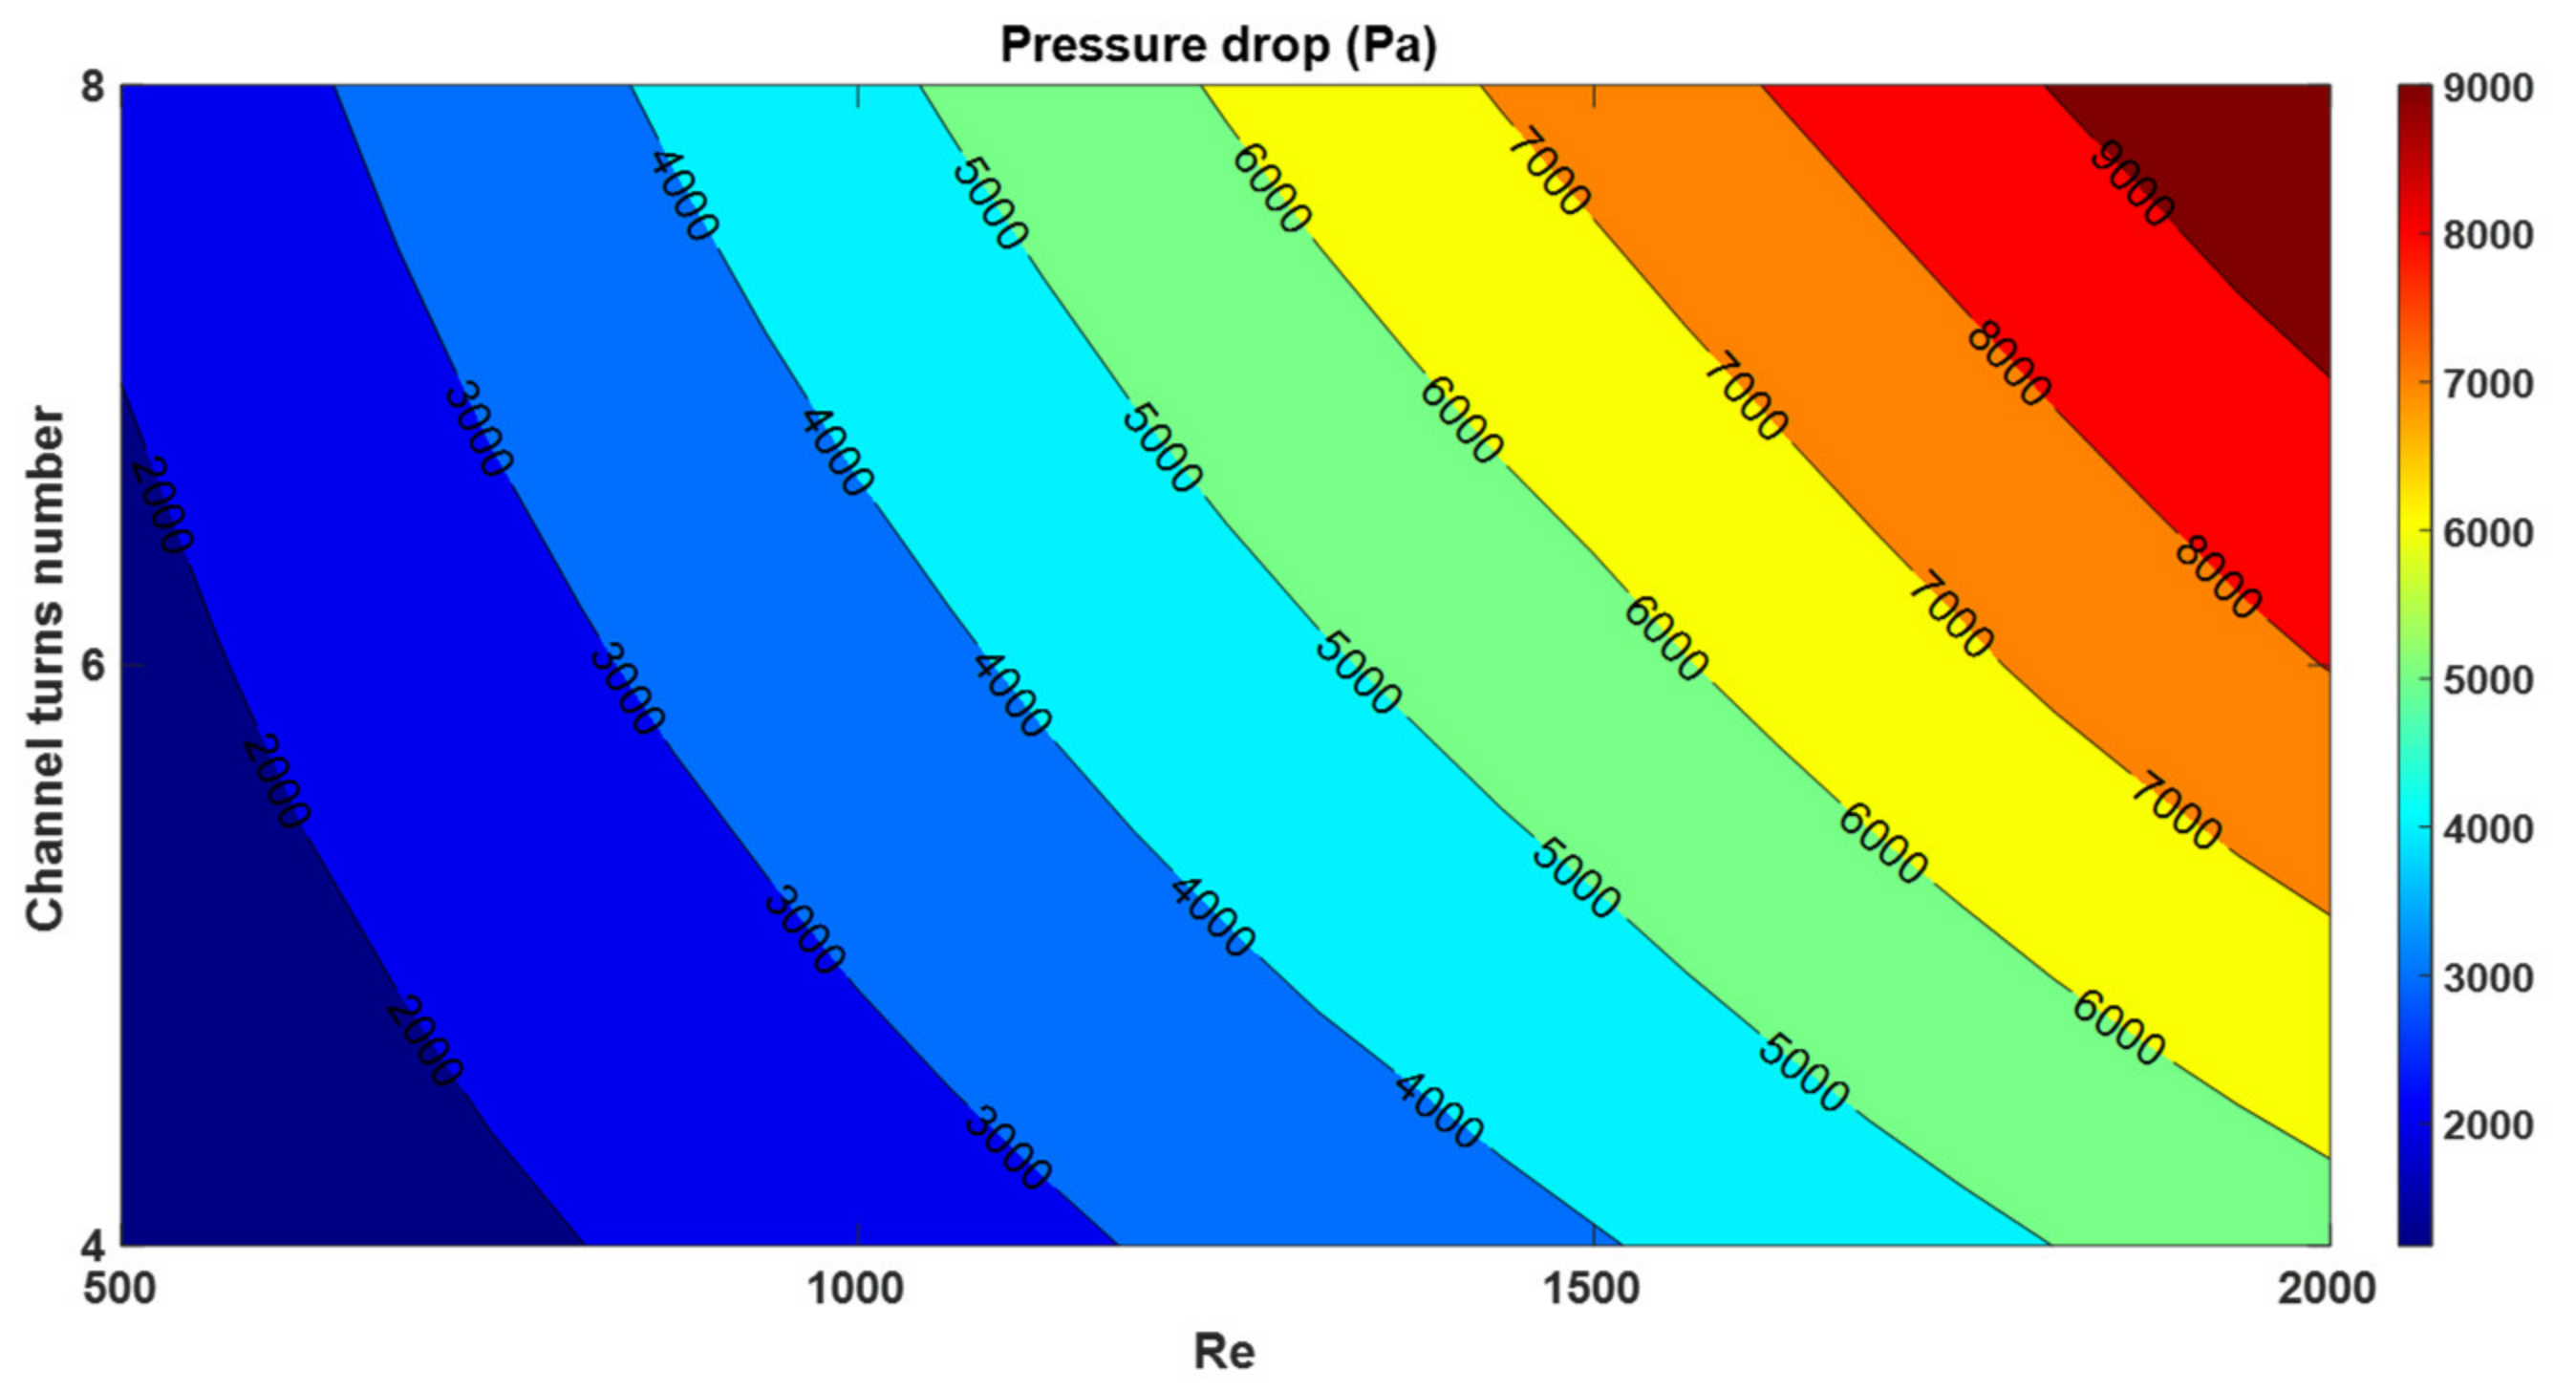
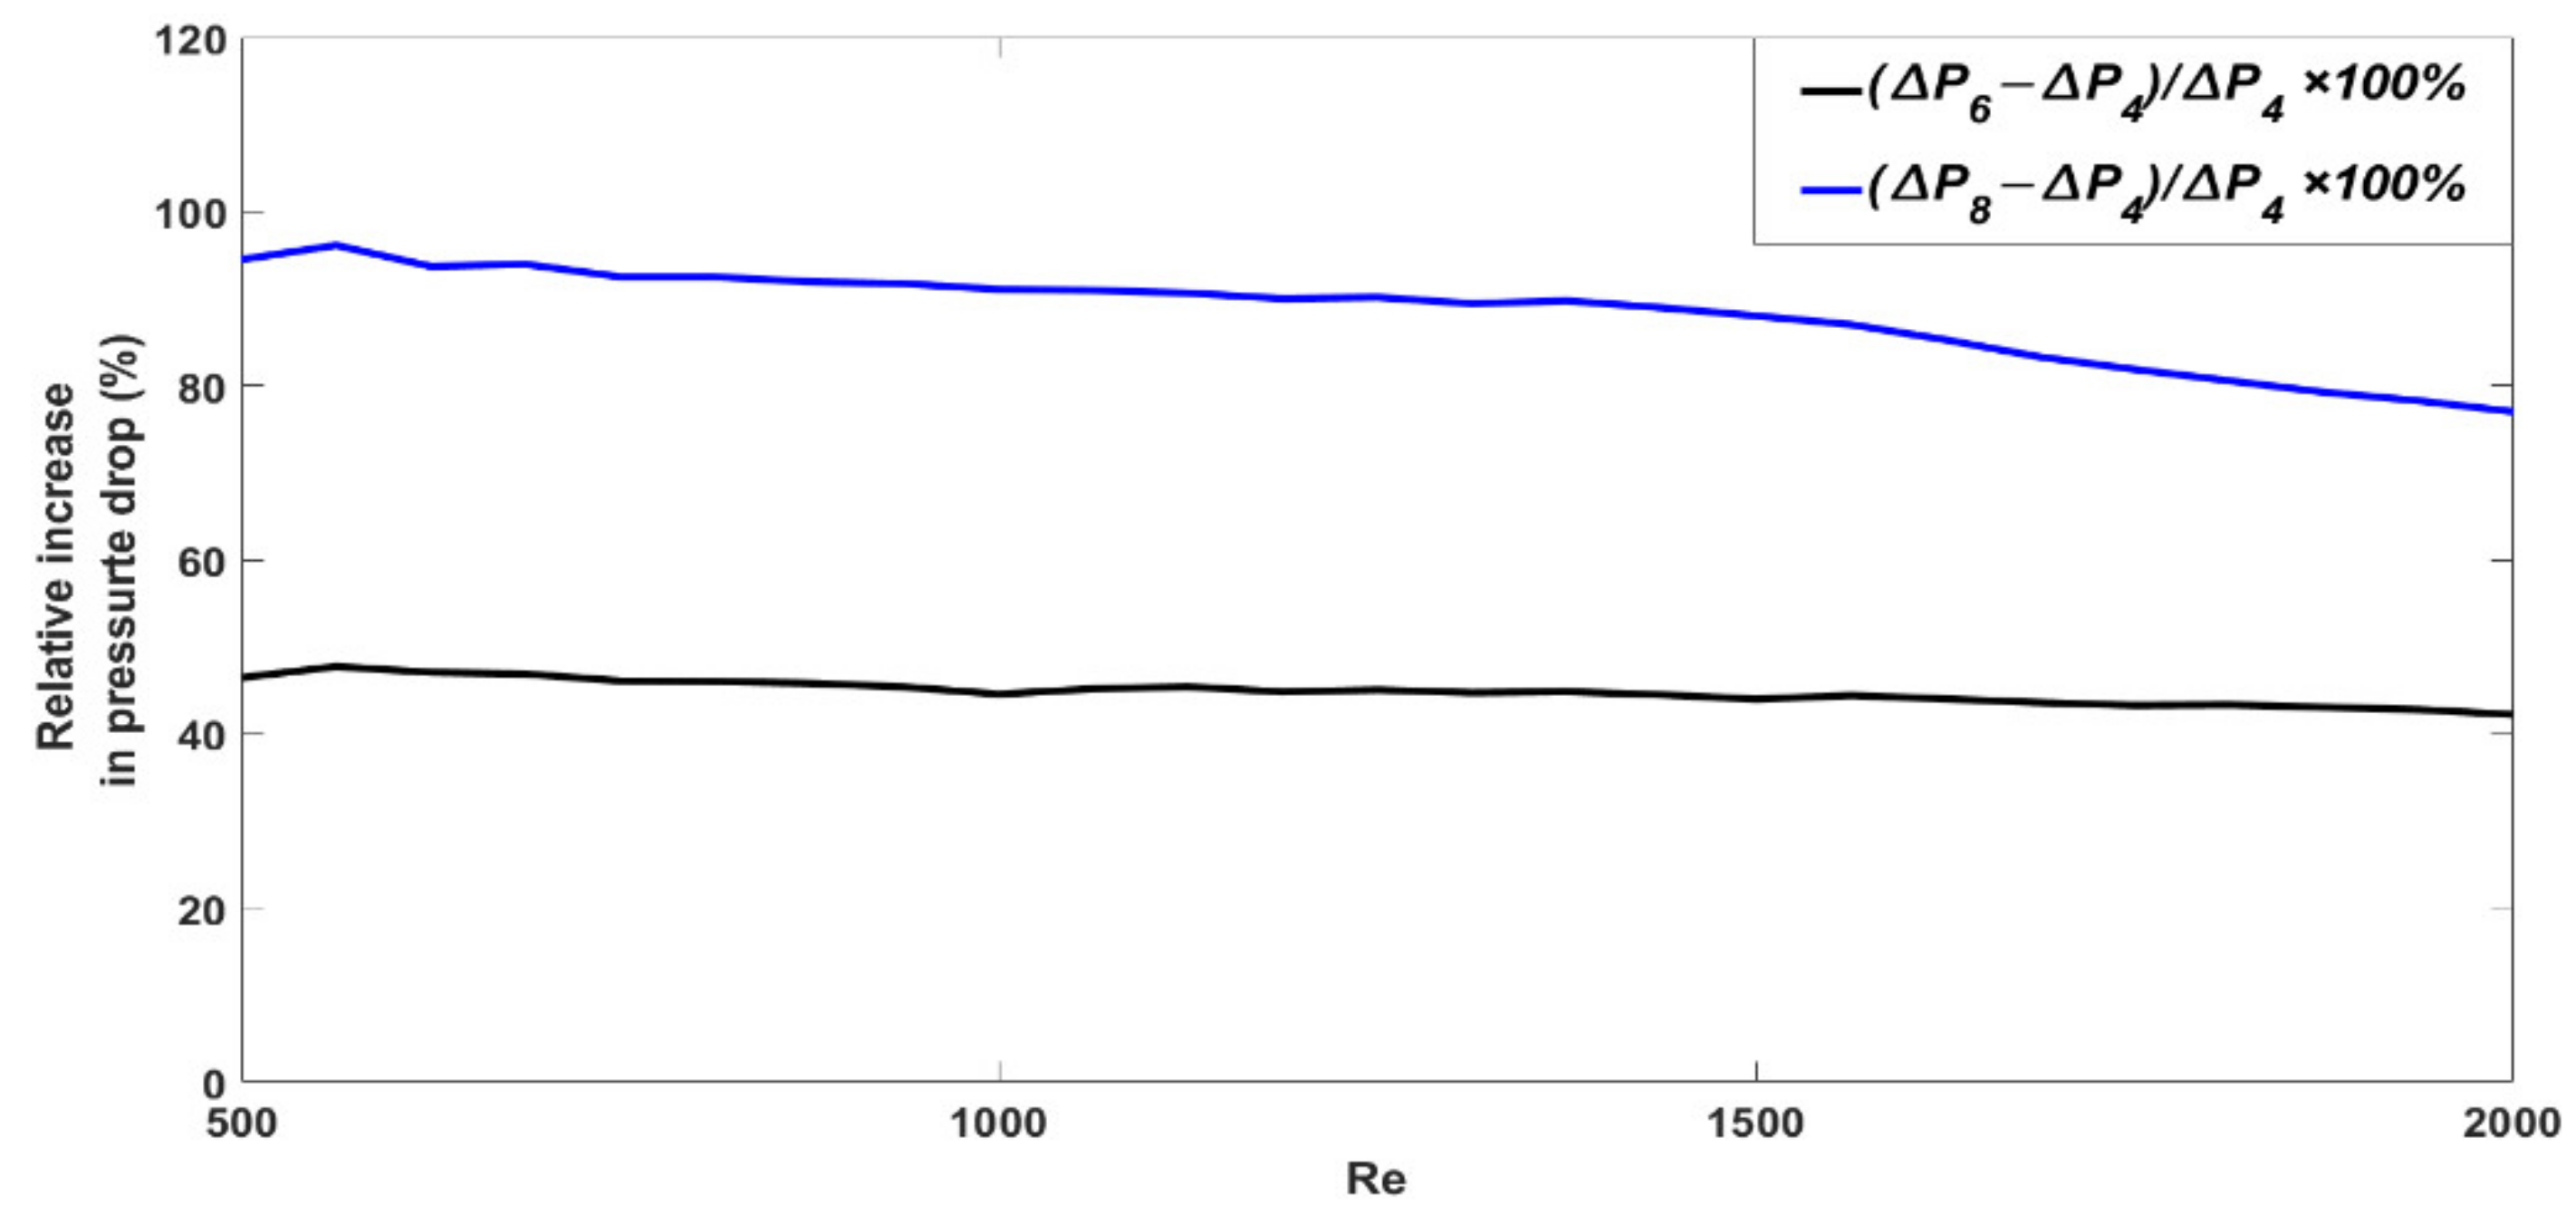
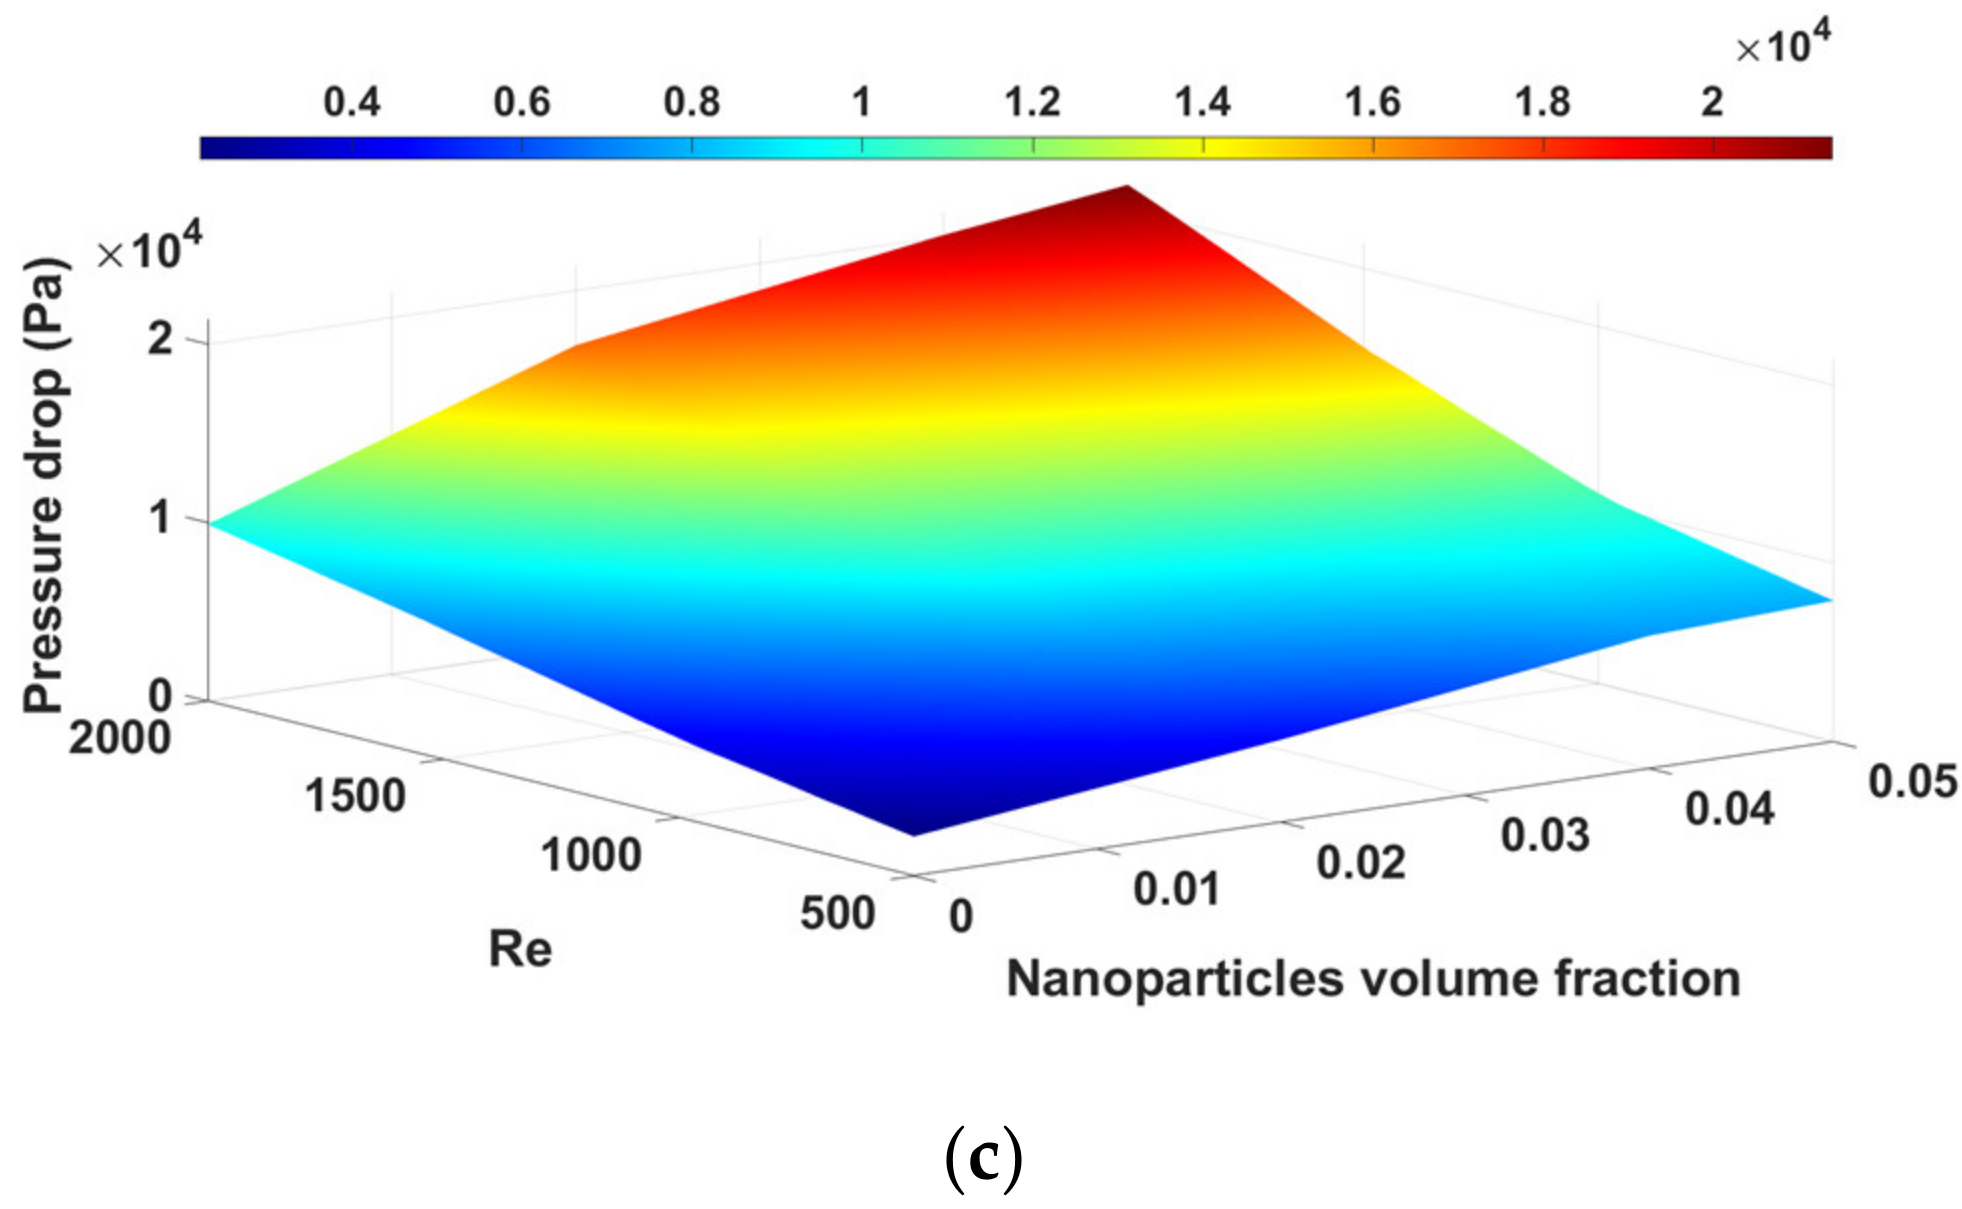
The contour plot of pressure drop variations versus Reynolds number (500, 1000, 1500, and 2000) due to different channel turns numbers (4, 6, and 8) for a cooling system using water as the coolant is shown in Figure 9. This figure illustrates that for all Reynolds numbers, increasing the turns number of channels increases the pressure drop because the channel length increases. The percentage of the relative increase in pressure drop for channels with turns numbers of 6 and 8 with respect to the pressure drop of the coolant flowing in the channel with 4 turns is shown in Figure 10. Due to the smaller pitch of the channel with 8 turns, at larger Reynolds numbers, the friction factor decreases more than in the channel with 6 turns, so the percentage of the relative increase in pressure drop decreases at larger Reynolds numbers for the case of the channel with 8 turns.
To illustrate the effect of channel turns number and nanoparticle concentration, Figure 11 shows 3D plots of pressure drop variations with respect to different channel turns numbers and different concentrations of nanoparticles at Reynolds numbers from 500 to 2000.

3.3. Overall Performance Evaluation

As the addition of nanoparticles affects both the heat transfer and fluid flow characteristics, the performance of the system should be evaluated from both aspects. In this study, the enhancement of heat transfer and friction factor are considered as evaluation factors. In other words, the cooling system performance is evaluated based on the ratio of heat transfer improvement to the increase in the required pumping power. Therefore, the best performance is achieved when the maximum amount of heat transfer improvement is obtained in exchange for the minimum need to increase the pumping power. To evaluate the performance of the cooling system based on the results obtained from the CFD analysis and considering both the heat transfer and the fluid flow performances of the cooling system, the Performance Evaluation Criteria (PEC) is defined as [41]:
P E C = N u n f N u b f n f f b 1 / 3  
where Nunf and fnf are the Nusselt number and Fanning friction factor computed for nanofluids, respectively. Nub and fb are the Nusselt number and Fanning friction factor of the base fluid, respectively. In (15), the Nusselt number represents the heat transfer performance factor and the Fanning factor signifies the fluid flow performance of the cooling system.
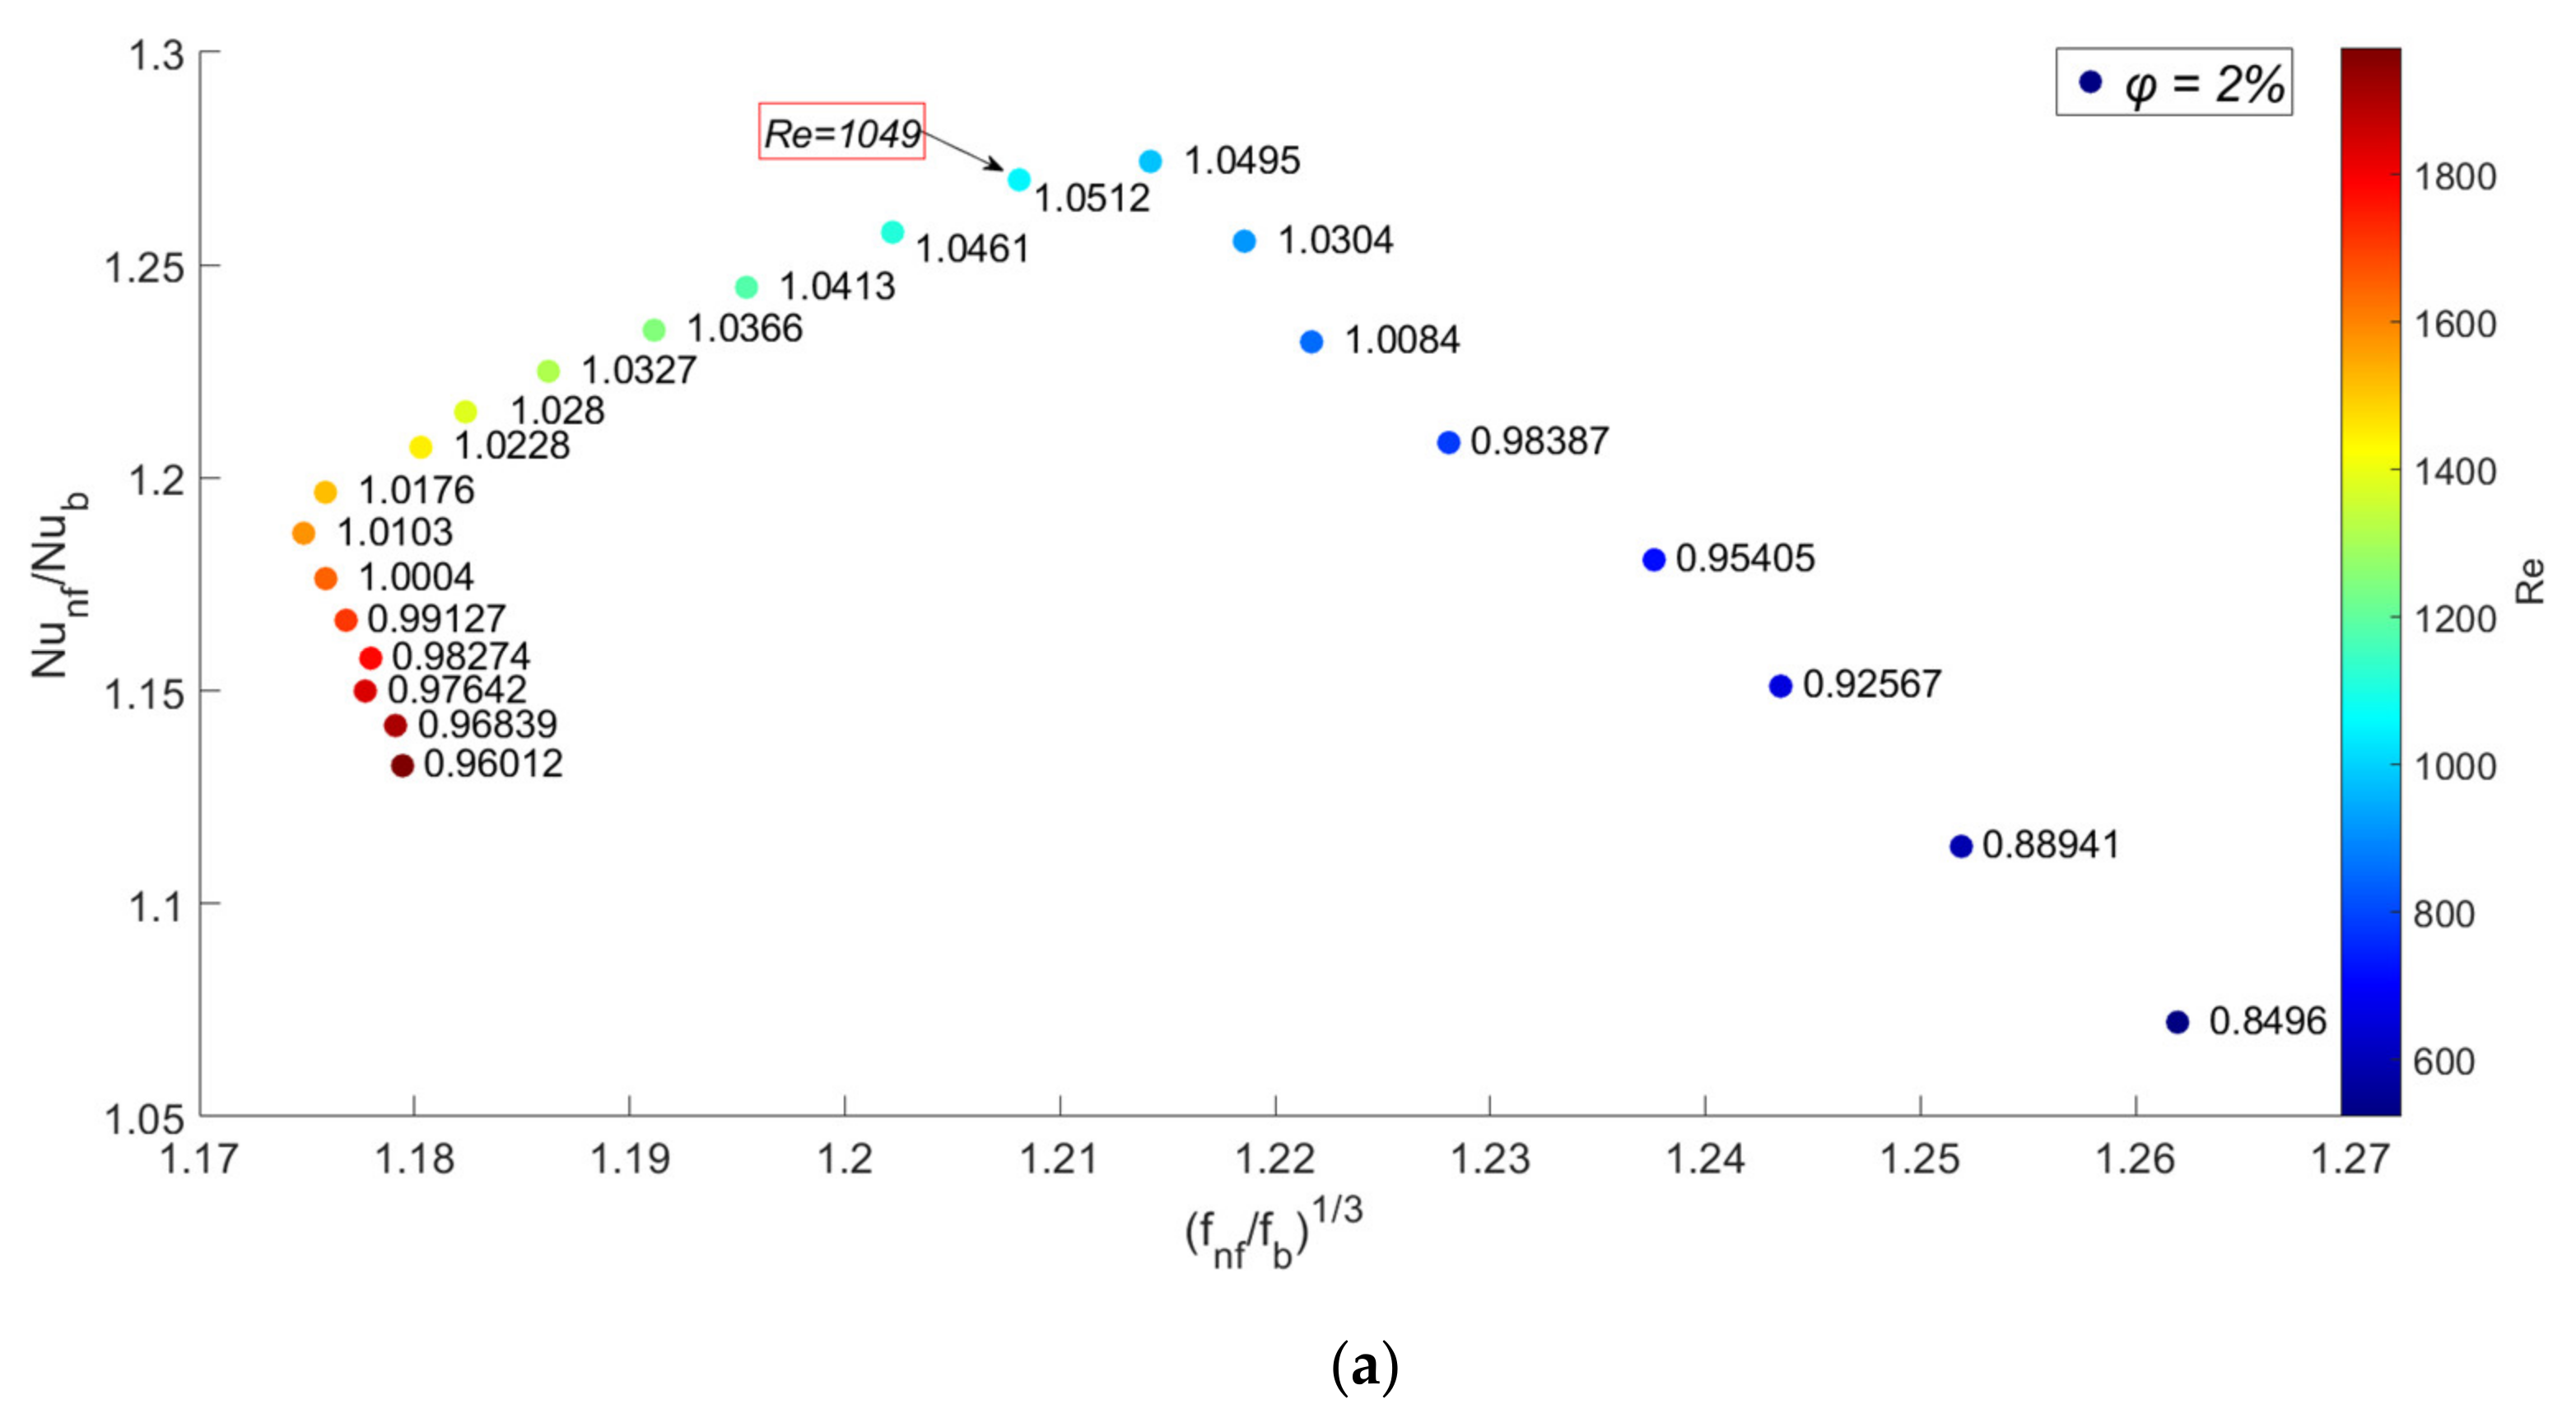
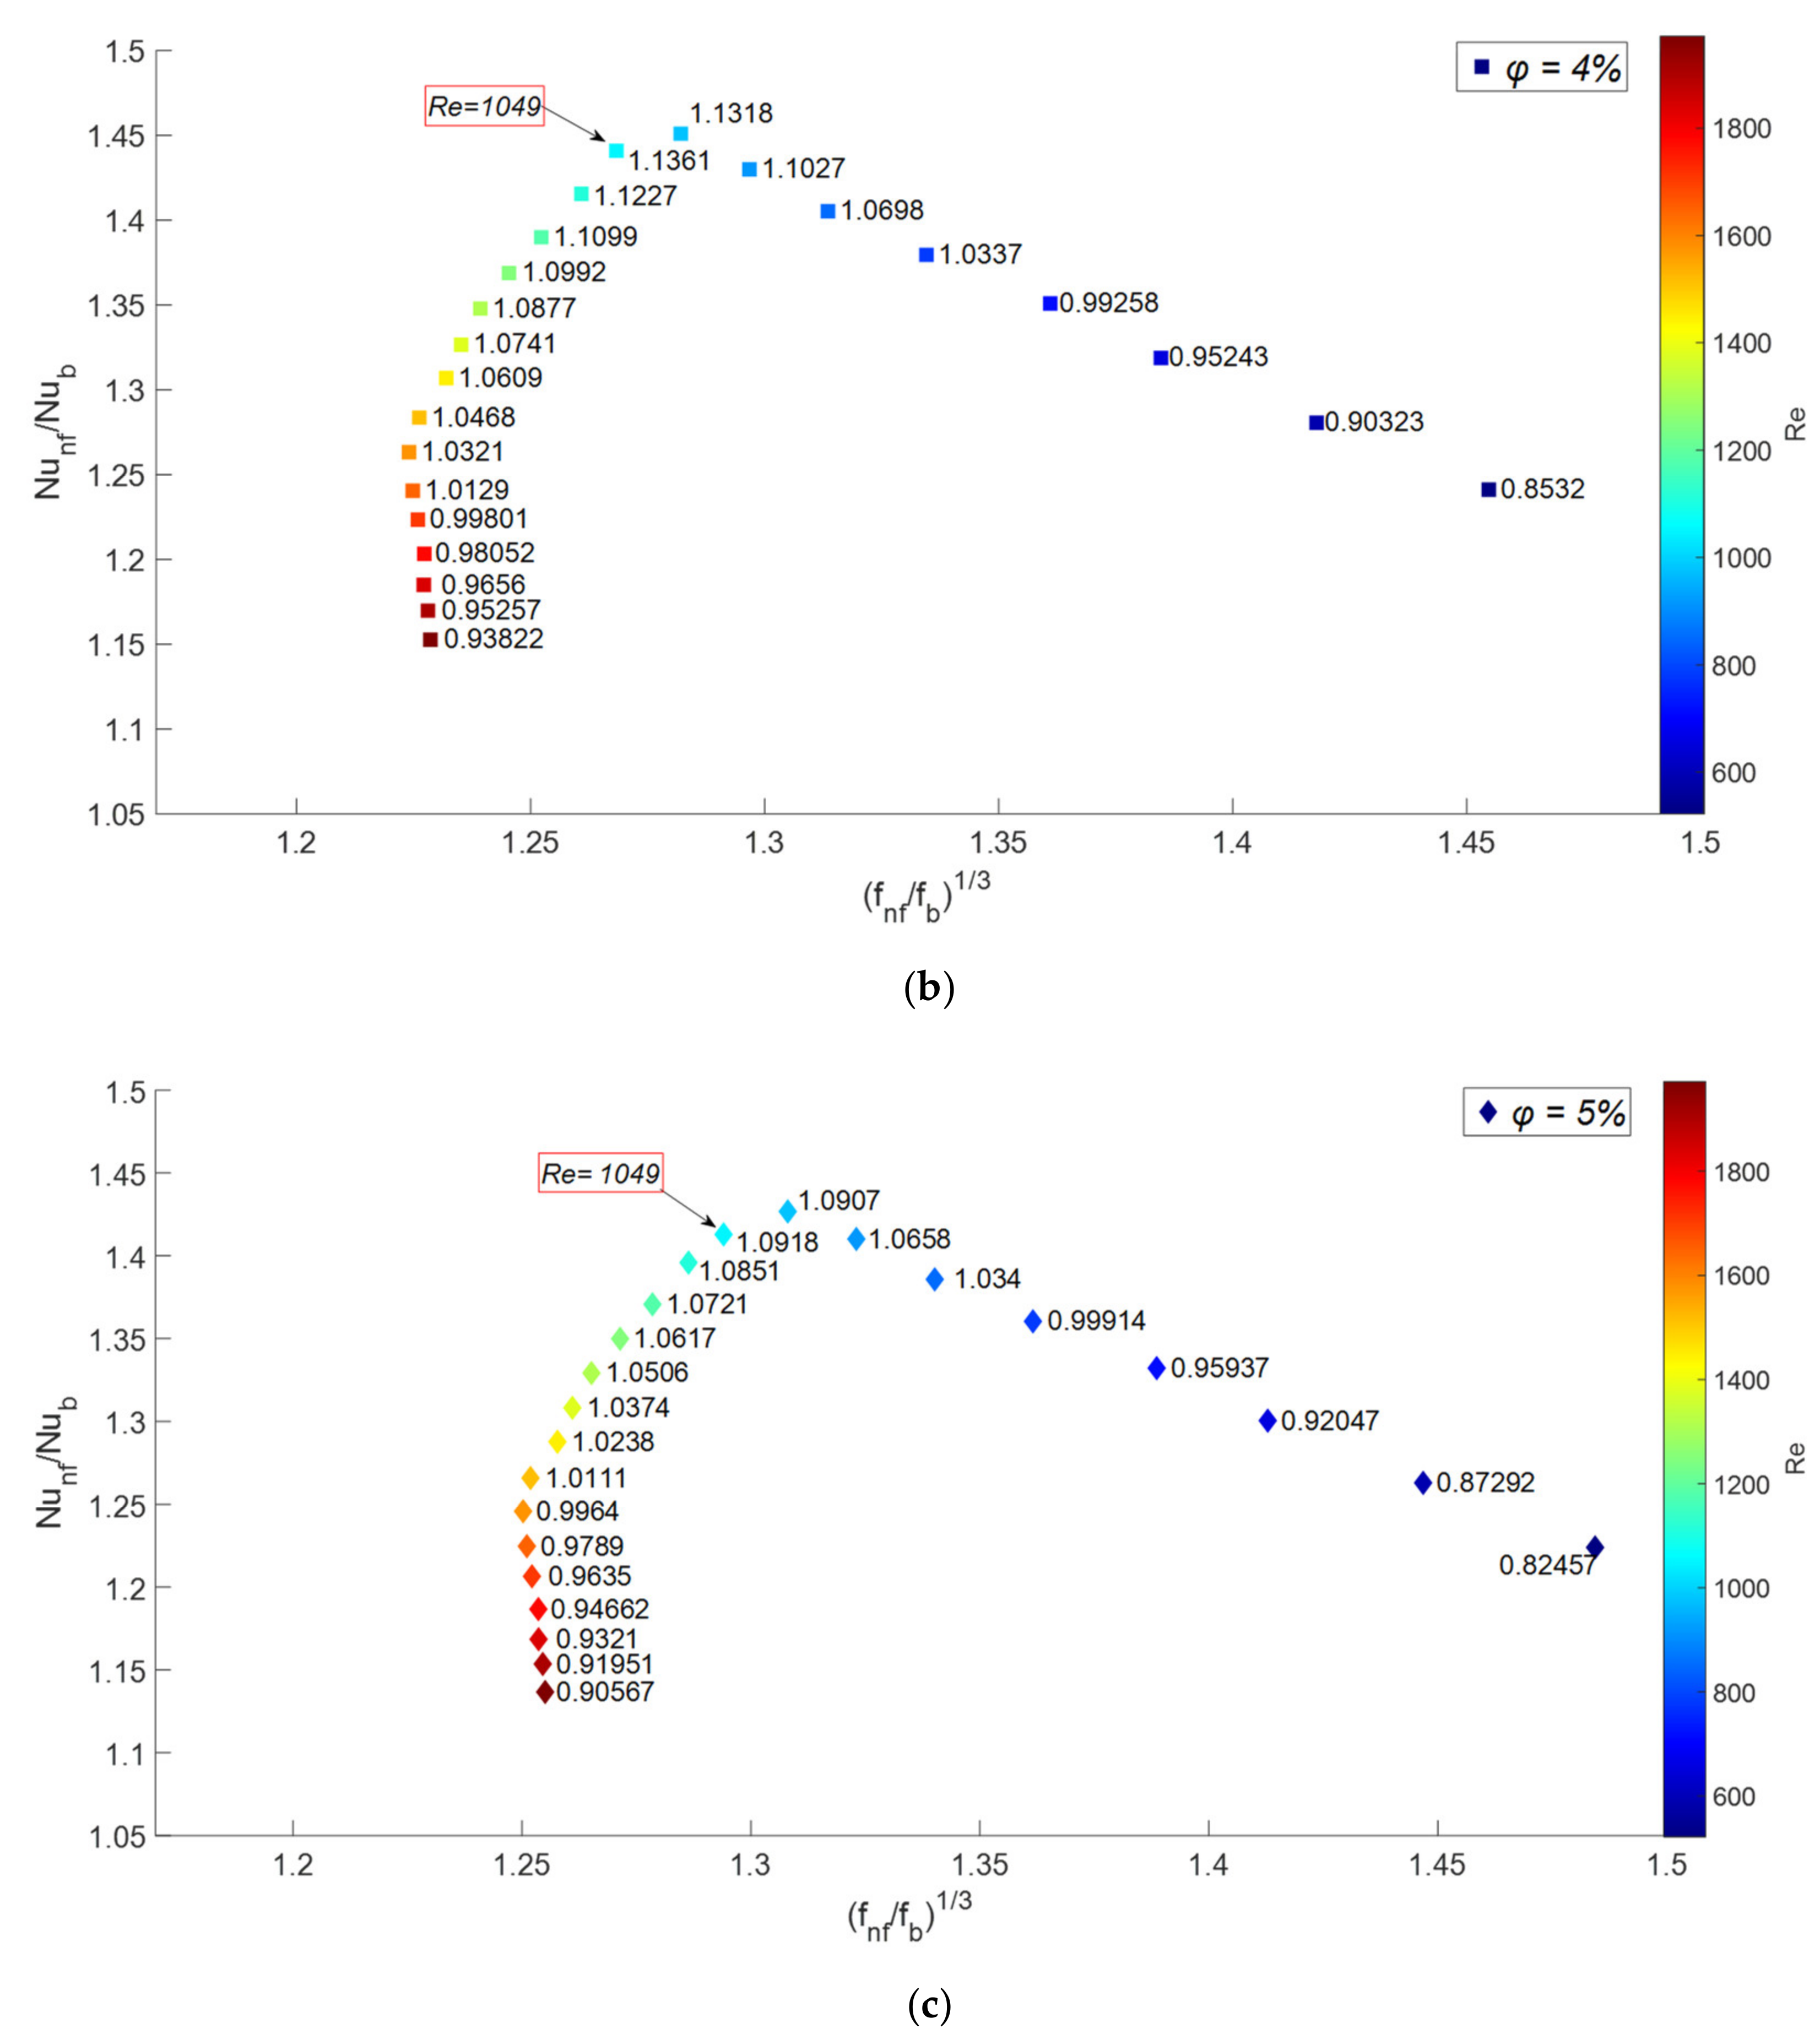
In order to provide a clear picture of the cooling system performance based on the heat transfer and fluid flow indices, the numerator value changes of PEC versus the denominator value changes for nanoparticle concentrations of 2%, 4%, and 5% for the channel with 8 turns are plotted in Figure 12. According to the plot, for the case of using the nanofluid with 2% volume fraction, the performance of the cooling system at Reynolds numbers equal to or smaller than 780 and larger than 1700 is worse than its performance when water is used. A similar condition occurs for the nanofluid with a 4% volume fraction when the Reynolds number is smaller than 700 or larger than 1700. In the case of the nanofluid with 5% volume fraction, worse performances are noticed for Reynolds numbers smaller than 780 and larger than 1575. Therefore, compared to water, the use of the nanofluid with a volume fraction of 4% in more cases improves the performance of the cooling system. In other words, with the increase in concentration of nanoparticles, the rate of heat transfer improvement exceeds the rate of increase in pressure losses. However, the excessive increase in nanoparticle concentration (here 5%) leads to decreased heat transfer and fluid flow performances.
As mentioned before, the heat transfer performance is impaired due to the dual effect of increasing the nanoparticle concentration, which increases the thickness of the channel wall boundary layer.
Figure 13a–c show PEC index values for nanofluids with nanoparticle concentrations of 2%, 4%, and 5%, respectively. For all cases, the highest value of the PEC index is obtained at a Reynolds number of 1049. As can be seen in Figure 13, it can be concluded that the greatest improvement in the overall performance of the cooling system, for all nanoparticle concentrations, is obtained in the situation where the heat transfer performance enhancement due to the addition of nanoparticles is almost at its maximum value, while the increase in pressure drop is moderate. This demonstrates that the key factor in the overall performance of cooling systems employing nanofluids is the amount of heat transfer enhancement. This finding demonstrates that the main factor in improving the overall performance of the cooling system is improving its heat transfer performance. Therefore, the key factor that causes nanofluids with excessive nanoparticle concentrations to have a lower overall performance is the dual effect of adding nanoparticles on heat transfer rather than the negative effect of increasing pressure drop.

4. Conclusions

The effect of the structural geometry of the cooling system and volume fraction of the Al2O3 nanofluid on the heat transfer and fluid flow performances of the cooling system for electric machine applications were analyzed in this paper. The effect of adding nanoparticles to the base fluid and different geometries were examined on a cooling system based on the cooling jacket method. The core idea was to demonstrate these relationships so that the best combination of structural geometry and nanofluid volume fraction can be chosen to design a high-performance cooling system. In addition, this study aimed at demonstrating and comparing the importance of two factors of the heat transfer and fluid flow on the overall performance of the cooling system. The main conclusions are as follows.
(a)
For the same structural geometry, the heat transfer coefficient increases with the increase in Reynolds number. In addition, at any pumping power, the increase in the concentration of nanoparticles increases the heat transfer coefficient.
(b)
In reference to (a), from a specific Reynolds number onward, due to the viscosity, the slope of the friction resistance changes decreases. Therefore, the heat transfer coefficient increases with the Reynolds number, and at higher Reynolds numbers, the slope of the increasing heat transfer coefficient decreases.
(c)
Adding nanoparticles to a base fluid affects the heat transfer coefficient in two different ways. While increasing the nanoparticle concentration enhances the heat transfer coefficient by increasing the thermal conductivity of the nanofluid, increasing the nanoparticle concentration can lead to a reduction in the temperature gradient at the wall of the channels. In this study, numerical results for the nanofluid with a volume fraction of 5% in the cooling jacket channels with 8 turns show a very small heat transfer coefficient enhancement resulting from a significant decrease in temperature gradient at the channel walls.
(d)
Due to the increase in the cooling cross-sectional area, increasing the turns number of the channel improves the heat transfer from the electric motor to the coolant fluid, thus increasing the heat transfer coefficient.
(e)
Increasing the turns number of channels leads to a greater enhancement of heat transfer coefficient at larger Reynolds numbers. This is due to the fact that the pitch of the channel decreases with the turns number. As the smaller pitch of spiral channels causes the friction factor to decrease further by increasing the Reynolds number, a greater enhancement of the heat transfer coefficient is achieved.
(f)
Due to the smaller pitch of the channel with a higher number of turns, at larger Reynolds numbers, the friction factor decreases more than in the channel with a lower number of turns, so the percentage of the relative increase in pressure drop decreases at larger Reynolds numbers for spiral channels with a higher number of turns.
(g)
According to the results and discussions, it was demonstrated that the main factor in improving the overall performance of the cooling system is the increase in its heat transfer performance. Therefore, the key factor that causes nanofluids with excessive nanoparticle concentrations to have a lower overall performance is the dual effect of adding nanoparticles on the heat transfer rather than the negative effect of increasing pressure drop.

Author Contributions

Conceptualization, A.D. and F.d.M.; methodology, A.D. and F.d.M.; software, A.D.; validation, A.D.; formal Analysis, A.D. and F.d.M.; investigation, A.D.; resources, A.D. and F.d.M.; data Curation, A.D.; writing—Original Draft Preparation, A.D.; writing—review and editing, A.D. and F.d.M.; visualization, A.D.; supervision, F.d.M.; project administration, F.d.M.; funding acquisition, A.D. All authors have read and agreed to the published version of the manuscript.

Funding

This research received no external funding.

Acknowledgments

The authors warmly thank the ReFree Drive project manager M. Villani.

Conflicts of Interest

The authors declare no conflict of interest.

References

  1. Naidu, M.; Nehl, T.W.; Gopalakrishnan, S.; Wurth, L. Keeping cool while saving space and money: A semi-integrated, sensorless PM brushless drive for a 42-V automotive HVAC compressor. IEEE Ind. Appl. Mag. 2005, 11, 20–28. [Google Scholar] [CrossRef]
  2. Chen, Q.; Shao, H.; Huang, J.; Sun, H.; Xie, J. Analysis of temperature field and water cooling of outer rotor in-wheel motor for electric vehicle. IEEE Access 2019, 7, 140142–140151. [Google Scholar] [CrossRef]
  3. Lindh, P.; Petrov, I.; Immonen, P.; Pyrhönen, J.; Niemelä, M.; Anttila, J.; Paakkinen, M.; Scherman, E. Performance of a direct-liquid-cooled motor in an electric bus under different load cycles. IEEE Access 2019, 7, 86897–86905. [Google Scholar] [CrossRef]
  4. Gundabattini, E.; Kuppan, R.; Solomon, D.G.; Kalam, A.; Kothari, D.P.; Bakar, R.A. A review on methods of finding losses and cooling methods to increase efficiency of electric machines. Ain Shams Eng. J. 2021, 12, 497–505. [Google Scholar] [CrossRef]
  5. Huang, J.; Naini, S.S.; Miller, R.; Rizzo, D.; Sebeck, K.; Shurin, S.; Wagner, J. A hybrid electric vehicle motor cooling system—Design, model, and control. IEEE Trans. Veh. Technol. 2019, 68, 4467–4478. [Google Scholar] [CrossRef]
  6. Canders, W.-R.; Hoffmann, J.; Henke, M. Cooling technologies for high power density electrical machines for aviation applications. Energies 2019, 12, 4579. [Google Scholar] [CrossRef] [Green Version]
  7. Tikadar, A.; Johnston, D.; Kumar, N.; Joshi, Y.; Kumar, S. Comparison of electro-thermal performance of advanced cooling techniques for electric vehicle motors. Appl. Therm. Eng. 2021, 183, 116182. [Google Scholar] [CrossRef]
  8. Galloni, E.; Parisi, P.; Marignetti, F.; Volpe, G. CFD analyses of a radial fan for electric motor cooling. Therm. Sci. Eng. Prog. 2018, 8, 470–476. [Google Scholar] [CrossRef]
  9. Fujita, H.; Itoh, A.; Urano, T. Newly developed motor cooling method using refrigerant. World Electr. Veh. J. 2019, 10, 38. [Google Scholar] [CrossRef] [Green Version]
  10. Lim, D.H.; Lee, M.-Y.; Lee, H.-S.; Kim, S.C. Performance evaluation of an in-wheel motor cooling system in an electric vehicle/hybrid electric vehicle. Energies 2014, 7, 961–971. [Google Scholar] [CrossRef] [Green Version]
  11. Grabowski, M.; Urbaniec, K.; Wernik, J.; Wołosz, K.J. Numerical simulation and experimental verification of heat transfer from a finned housing of an electric motor. Energy Convers. Manag. 2016, 125, 91–96. [Google Scholar] [CrossRef]
  12. Zeinali, S.; Heris, M.; Shokrgozar, S.; Poorpharhang, M.; Shanbedi, S.H. Noie experimental study of heat transfer of a car radiator with cuo/ethylene glycol-water as a coolant. J. Dispers. Sci. Technol. 2014, 35, 677–684. [Google Scholar]
  13. Davin, T.; Pellé, J.; Harmand, S.; Yu, R. Experimental study of oil cooling systems for electric motors. Appl. Therm. Eng. 2015, 75, 1–13. [Google Scholar] [CrossRef]
  14. Cavazzuti, M.; Gaspari, G.; Pasquale, S.; Stalio, E. Thermal management of a Formula E electric motor: Analysis and optimization. Appl. Therm. Eng. 2019, 157, 113733. [Google Scholar] [CrossRef]
  15. Tian, Z.; Gan, W.; Zhang, X.; Gu, B.; Yang, L. Investigation on an integrated thermal management system with battery cooling and motor waste heat recovery for electric vehicle. Appl. Therm. Eng. 2018, 136, 16–27. [Google Scholar] [CrossRef]
  16. Farsane, K.; Desevaux, P.; Panday, P.K. Experimental study of the cooling of a closed type electric motor. Appl. Therm. Eng. 2000, 20, 1321–1334. [Google Scholar] [CrossRef]
  17. Rehman, Z.; Seong, K. Three-D Numerical thermal analysis of electric motor with cooling jacket. Energies 2018, 11, 92. [Google Scholar] [CrossRef] [Green Version]
  18. Richmond, C.; Kuppuswamy, R.; Khan, A. The effect of coolant velocity for enhancing the high-speed permanent magnet generator efficiency. Procedia CIRP 2020, 91, 21–26. [Google Scholar] [CrossRef]
  19. De Gennaro, M.; Juergens, J.; Zanon, A.; Gragger, J.; Schlemmer, E.; Fricasse, A.; Marengo, L.; Ponick, B.; Olabarri, E.T.; Kinder, J.; et al. Designing, prototyping and testing of a ferrite permanent magnet assisted synchronous reluctance machine for hybrid and electric vehicles applications. Sustain. Energy Technol. Assess. 2019, 31, 86–101. [Google Scholar] [CrossRef]
  20. Silwal, B.; Mohamed, A.H.; Nonneman, J.; De Paepe, M.; Sergeant, P. Assessment of different cooling techniques for reduced mechanical stress in the windings of electrical machines. Energies 2019, 12, 1967. [Google Scholar] [CrossRef] [Green Version]
  21. Siricharoenpanich, A.; Wiriyasart, S.; Naphon, P. Study on the thermal dissipation performance of GPU cooling system with nanofluid as coolant. Case Stud. Therm. Eng. 2021, 25, 100904. [Google Scholar] [CrossRef]
  22. Zhang, L.; Yan, X.; Zhang, Y.; Feng, Y.; Li, Y.; Meng, H.; Zhang, J.; Wu, J. Heat transfer enhancement by streamlined winglet pair vortex generators for helical channel with rectangular cross section. Chem. Eng. Process. Process Intensif. 2020, 147, 107788. [Google Scholar] [CrossRef]
  23. Biswas, G.; Chattopadhyay, H.; Sinha, A. Augmentation of heat transfer by creation of streamwise longitudinal vortices using vortex generators. Heat Transf. 2012, 33, 406–424. [Google Scholar] [CrossRef]
  24. Tiggelbeck, S.; Mitra, N.K.; Fiebig, M. Comparison of wing-type vortex generators for heat transfer enhancement in channel flows. J. Heat Transf. 1994, 116, 880–885. [Google Scholar] [CrossRef]
  25. Li, Y.; Wang, X.; Zhang, J.; Zhang, L.; Wu, J.H. Comparison and analysis of the arrangement of delta winglet pair vortex generators in a half coiled jacket for heat transfer enhancement. Int. J. Heat Mass Transf. 2019, 129, 287–298. [Google Scholar] [CrossRef]
  26. Sarafraz, M.M.; Safaei, M.R.; Leon, A.S.; Tlili, I.; Alkanhal, T.A.; Tian, Z.; Goodarzi, M.; Arjomandi, M. Experimental Investigation on Thermal Performance of a PV/T-PCM (Photovoltaic/Thermal) System Cooling with a PCM and Nanofluid. Energies 2019, 12, 2572. [Google Scholar] [CrossRef] [Green Version]
  27. Almurtaji, S.; Ali, N.; Teixeira, J.A.; Addali, A. On the role of nanofluids in thermal-hydraulic performance of heat exchangers—A review. Nanomaterials 2020, 10, 734. [Google Scholar] [CrossRef] [Green Version]
  28. Shah, T.R.; Ali, H.M.; Janjua, M.M. On aqua-based silica (sio2–water) nanocoolant: Convective thermal potential and experimental precision evaluation in aluminum tube radiator. Nanomaterials 2020, 10, 1736. [Google Scholar] [CrossRef]
  29. Benedict, F.; Kumar, A.; Kadirgama, K.; Mohammed, H.A.; Ramasamy, D.; Samykano, M.; Saidur, R. Thermal performance of hybrid-inspired coolant for radiator application. Nanomaterials 2020, 10, 1100. [Google Scholar] [CrossRef] [PubMed]
  30. Li, Z.; Li, W.; Chen, Z. Performance analysis of thermoelectric based automotive waste heat recovery system with nanofluid coolant. Energies 2017, 10, 1489. [Google Scholar] [CrossRef] [Green Version]
  31. Deriszadeh, A.; de Monte, F. On heat transfer performance of cooling systems using nanofluid for electric motor applications. Entropy 2020, 22, 99. [Google Scholar] [CrossRef] [PubMed] [Green Version]
  32. Parsaiemehr, M.; Pourfattah, F.; Ali Akbari, O.; Toghraie, D.; Sheikhzadeh, G. Turbulent flow and heat transfer of Water/Al2O3 nanofluid inside a rectangular ribbed channel. Phys. E Low Dimens. Syst. Nanostruct. 2018, 96, 73–84. [Google Scholar] [CrossRef]
  33. Shukla, K.N.; Koller, T.M.; Rausch, M.H.; Fröba, A.P. Effective thermal conductivity of nanofluids—A new model taking into consideration Brownian motion. Int. J. Heat Mass Transf. 2016, 99, 532–540. [Google Scholar] [CrossRef]
  34. Das, S.K.; Choi, S.U.; Yu, W.; Pradeep, T. Nanofluids Science and Technology; John Wiley & Sons: Hoboken, NJ, USA, 2008. [Google Scholar]
  35. Helvaci, H.U.; Khan, Z.A. Heat transfer and entropy generation analysis of HFE 7000 based nanorefrigerants. Int. J. Heat Mass Transf. 2017, 104, 318–327. [Google Scholar] [CrossRef]
  36. Albojamal, A.; Vafai, K. Analysis of single phase, discrete and mixture models, in predicting nanofluid transport. Int. J. Heat Mass Transf. 2017, 114, 225–237. [Google Scholar] [CrossRef]
  37. Salim, S.M.; Cheah, S. Wall y+ Strategy for Dealing with Wall-bounded Turbulent Flows. In Proceedings of the International Multiconference of Engineers and Computer Scientists, IMECS 2009, Hong Kong, China, 18–20 March 2009. [Google Scholar]
  38. Kahani, M.; Heris, S.Z.; Mousavi, S.M. Effects of curvature ratio and coil pitch spacing on heat transfer performance of Al2O3/water nanofluid laminar flow through helical coils. J. Dispers. Sci. Technol. 2013, 34, 1704–1712. [Google Scholar] [CrossRef]
  39. Akbari, O.A.; Toghraie, D.; Karimipour, A. Impact of ribs on flow parameters and laminar heat transfer of water–aluminum oxide nanofluid with different nanoparticle volume fractions in a three-dimensional rectangular microchannel. Adv. Mech. Eng. 2015, 7, 1687814015618155. [Google Scholar] [CrossRef] [Green Version]
  40. Tang, L.; Tang, Y.; Parameswaran, S. A numerical study of flow characteristics in a helical pipe. Adv. Mech. Eng. 2016, 8, 1687814016660242. [Google Scholar] [CrossRef] [Green Version]
  41. Li, P.; Zhang, D.; Xie, Y. Heat transfer and flow analysis of Al2O3–water nanofluids in microchannel with dimple and protrusion. Int. J. Heat Mass Transf. 2014, 73, 456–467. [Google Scholar] [CrossRef]
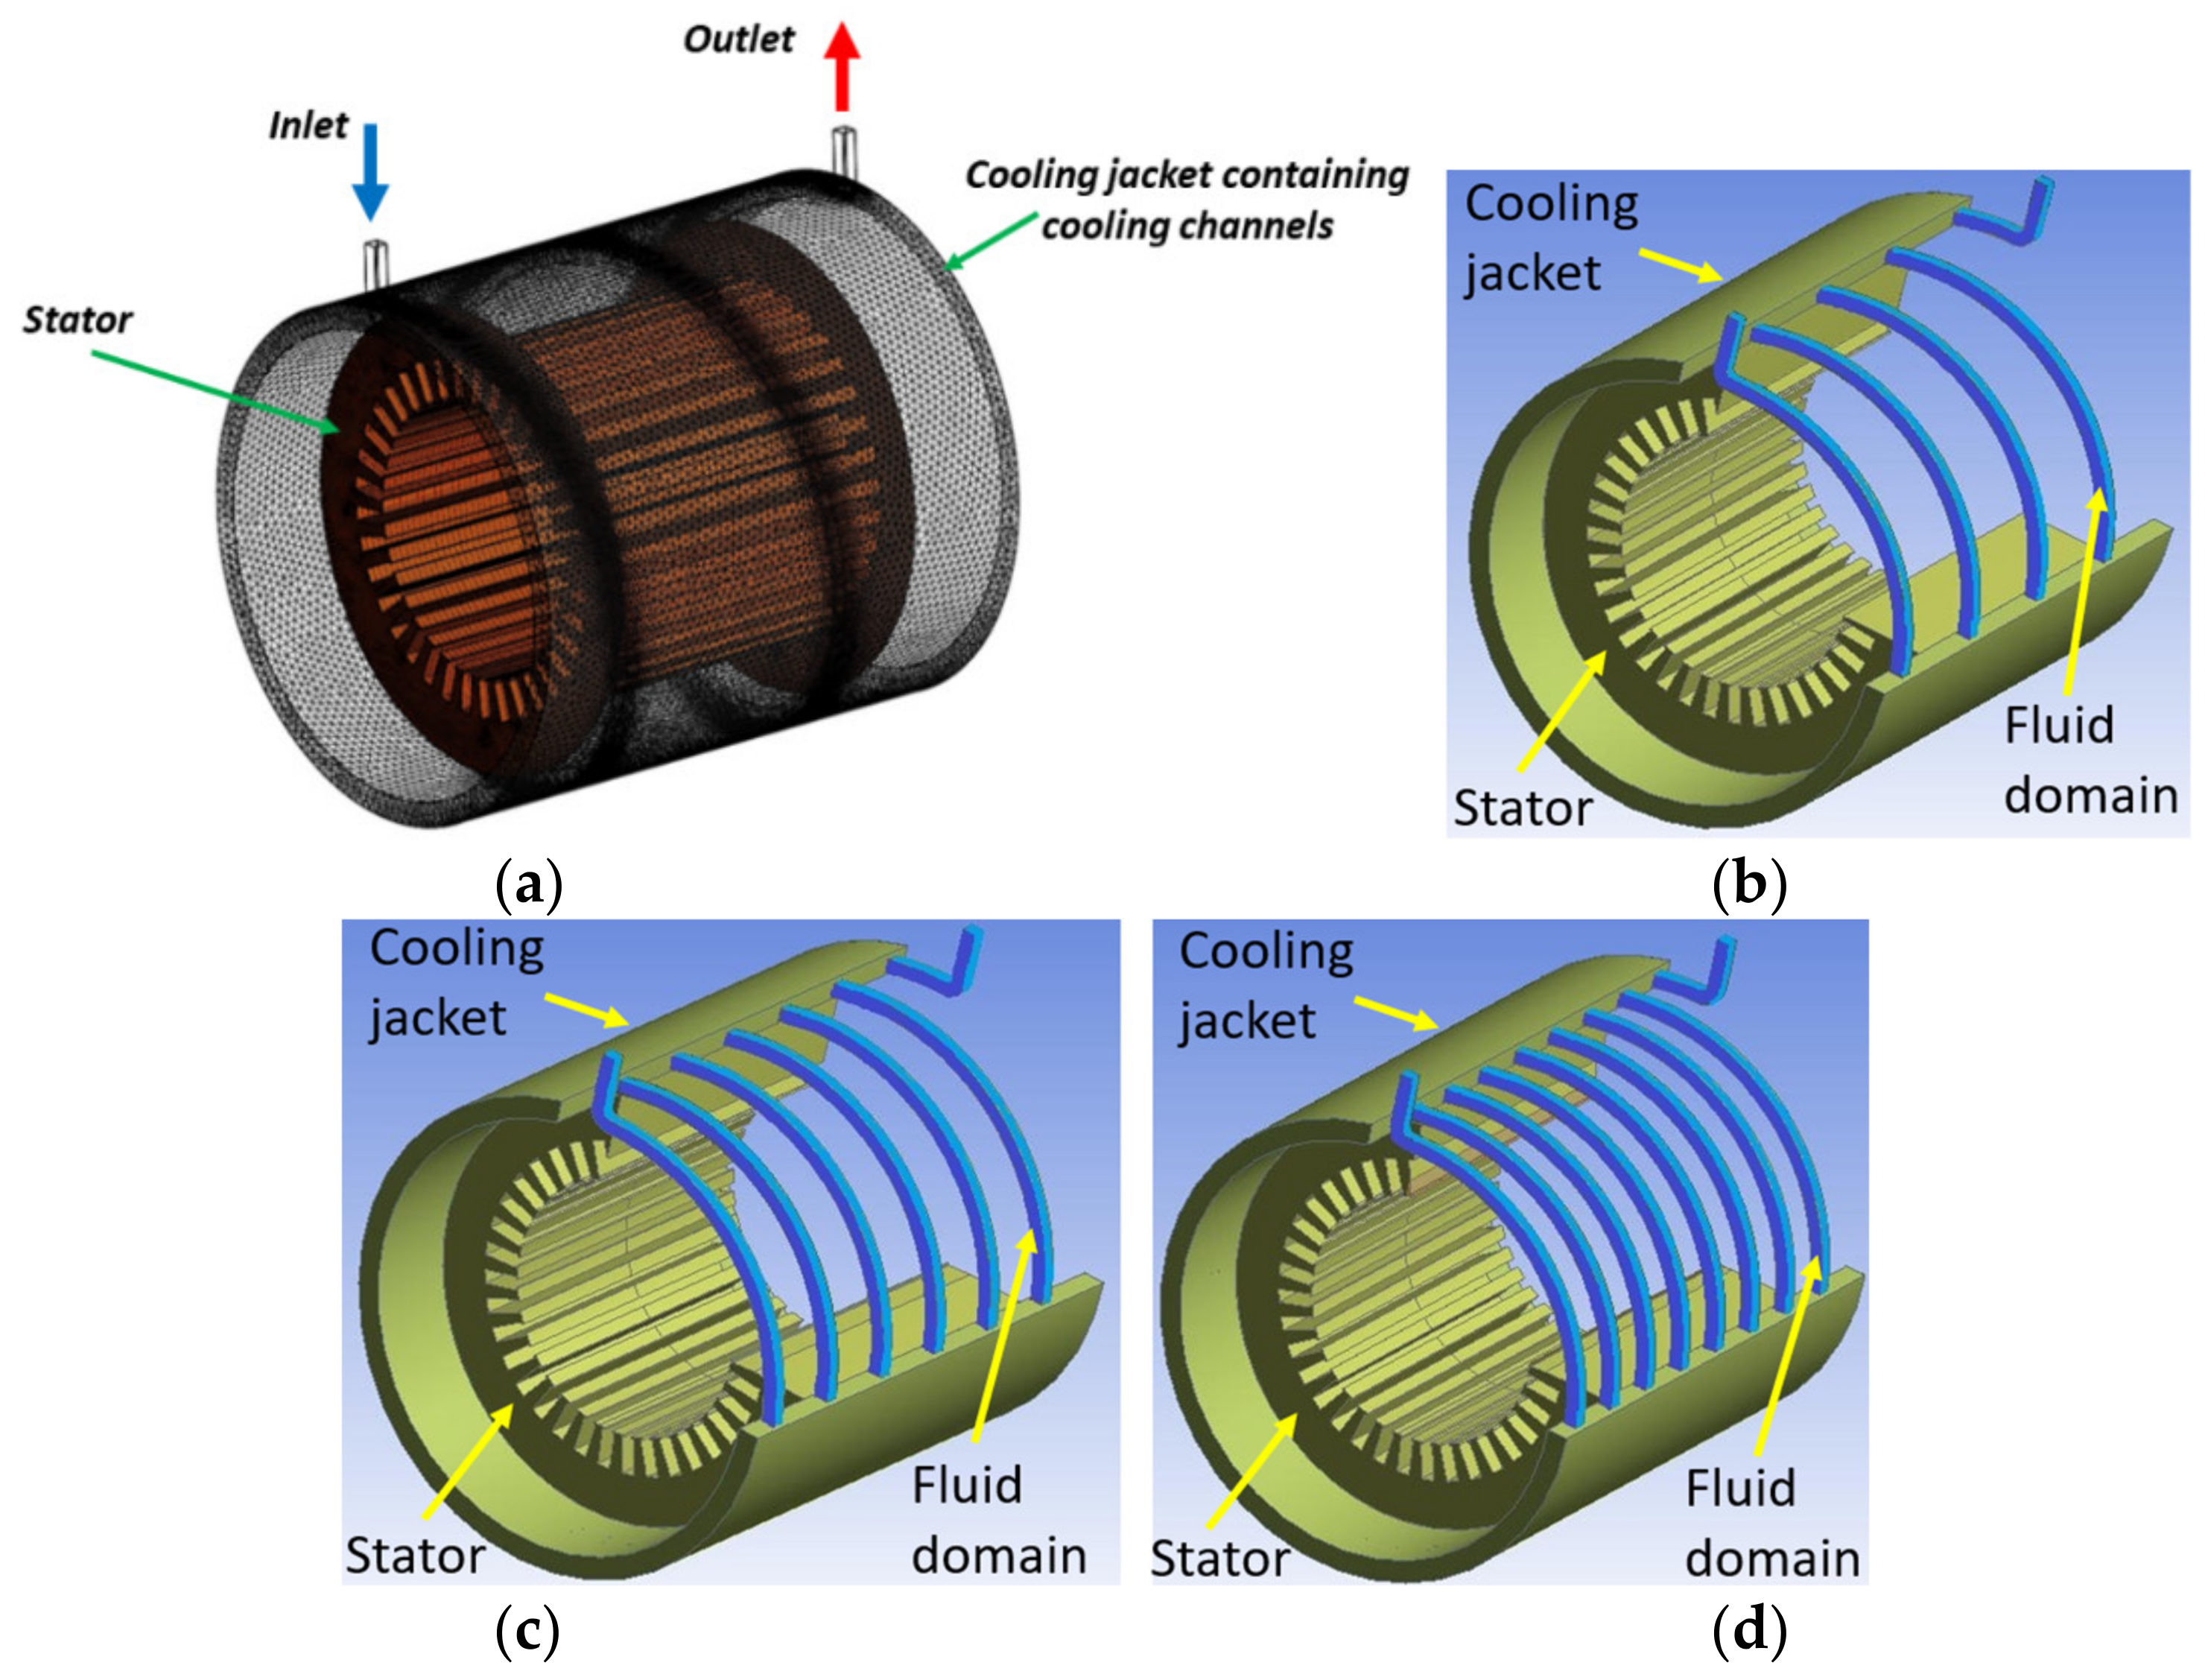
Figure 1. Schematic of the cooling system: (a) meshed, and with (b) 4 channel turns, (c) 6 channel turns, and (d) 8 channel turns.
Chemengineering 05 00053 g001
Figure 2. Contour plot of heat transfer coefficient versus volume fraction and Reynolds number for nanofluids flowing in cooling channels with 8 turns—results were obtained from 20 simulations.
Chemengineering 05 00053 g002
Figure 3. Relative heat transfer coefficient changes for nanofluids with 2%, 4%, and 5% volume fraction with respect to water.
Chemengineering 05 00053 g003
Figure 4. Contour plot of heat transfer coefficient versus channel turns number and Reynolds number for a cooling system using water as the coolant—results were obtained from 12 simulations.
Chemengineering 05 00053 g004
Figure 5. Relative increase in heat transfer coefficient for channels with turns numbers of 6 and 8 with respect to 4.
Chemengineering 05 00053 g005
Figure 6. Heat transfer coefficient versus Reynolds number, nanoparticle volume fraction, and channel turns number: (a) 4 turns, (b) 6 turns, and (c) 8 turns—results for each subfigure were obtained from 20 simulations.
Chemengineering 05 00053 g006
Figure 7. Variation in the pressure drop at different Reynolds numbers for nanofluids with different nanoparticle concentrations flowing in channels with 8 turns—results were obtained from 20 simulations.
Chemengineering 05 00053 g007
Figure 8. Relative increase in pressure drop with respect to water.
Chemengineering 05 00053 g008
Figure 9. Variations in pressure drop at different Reynolds numbers for channel turns numbers of 4, 6, and 8 for a cooling system using water as the coolant—results were obtained from 12 simulations.
Chemengineering 05 00053 g009
Figure 10. Relative increase in heat transfer coefficient for channel turns numbers of 6 and 8 with respect to 4.
Chemengineering 05 00053 g010
Figure 11. Pressure drop versus Reynolds number, nanoparticle volume fraction, and channel turns number: (a) 4 turns, (b) 6 turns, and (c) 8 turns—results for each subfigure were obtained from 20 simulations.
Chemengineering 05 00053 g011aChemengineering 05 00053 g011b
Figure 12. Numerator value changes of PEC versus the denominator value changes for nanoparticle concentrations of 2%, 4%, and 5%.
Chemengineering 05 00053 g012
Figure 13. PEC values (a) for φ = 2%, (b) for φ = 4%, and (c) for φ = 5%.
Chemengineering 05 00053 g013aChemengineering 05 00053 g013b
Table 1. Model dimensions.
Cooling JacketElectric Motor
Length (mm)240240 with coils
Diameter (mm)210190
Thickness (mm)10
Coil pitch (mm)26
Channel dimensions (mm)6 × 6
Table 2. Grid sensitivity analyses.
Number of NodesComputed Heat Transfer
Coefficient
Percentage Variation
2 × 106119.93
4 × 106133.5211.33
6 × 106131.921.2%
8 × 106131.780.11%
Table 3. Validation results.
Re100015002000
Simulated Nu16.761521.564924.5844
Calculated Nu by the correlation proposed in [38]16.22619.98623.171
Deviation3.3%7.9%6.1%
Table 4. Thermo-physical properties of Al2O3-water [39].
φρ (kg/m3)Cp (J/kg K)k (W/m K)μ (Pa s)
0.011026.840470.64089.13 × 10−4
0.021056.63922.40.66919.37 × 10−4
0.0411163693.20.70149.86 × 10−4
0.051140.153466.950.72059.96 × 10−4
Al2O3397076540
Water997.141790.6138.91 × 10−4
Publisher’s Note: MDPI stays neutral with regard to jurisdictional claims in published maps and institutional affiliations.