Article

Effect of Pyrolysis Temperature on the Electrical Property and Photosensitivity of a PAN-PMMA Derived Carbon Fiber

1
Walnut High School, 400 Pierre Rd, Walnut, CA 91789, USA
2
Department of Natural, Physical and Health Sciences, Citrus College, 1000 W Foothill Blvd, Glendora, CA 91741, USA
3
Department of Natural, Physical and Health Sciences, Cypress College, 9200 Valley View, Cypress, CA 90630, USA
4
Diamond Bar High School, 21400 Pathfinder Rd, Diamond Bar, CA 91765, USA
5
Department of Chemical and Biomolecular Engineering, The University of California, Los Angeles, 405 Hilgard Ave, Los Angeles, CA 90095, USA
6
Department of Electromechanical Engineering Technology, California State Polytechnic University, Pomona, 3801 W Temple Avenue, Pomona, CA 91768, USA
7
Department of Mechanical Engineering, California State Polytechnic University, Pomona, 3801 W Temple Avenue, Pomona, CA 91768, USA
*
Author to whom correspondence should be addressed.
ChemEngineering 2019, 3(4), 86; https://doi.org/10.3390/chemengineering3040086
Submission received: 28 July 2019 / Revised: 25 September 2019 / Accepted: 25 October 2019 / Published: 1 November 2019
(This article belongs to the Special Issue Carbon-Based Materials and Their Electrochemical Applications)

Abstract

:
Fibers are promising materials being utilized in electronics, principally in the areas of capacitors and sensors. In this study, we examine the effect of pyrolysis temperature on the electrical conductive behavior and photosensitivity of a carbon-based fiber, which was made by electrospinning a polymer solution containing polyacrylonitrile (PAN), polymethyl methacrylate (PMMA), and dimethylformamide (DMF). Converting the polymeric fiber into a carbon fiber was performed through the controlled pyrolysis during which oxidation, stabilization, and carbonization happened. After oxidation at an elevated temperature, the linear polymer fiber was stabilized to have a backbone structure. Then the oxidized fiber was treated in an even higher temperature range to be partially carbonized under the protection of argon gas. We utilized multiple samples of the fibers treated at various pyrolysis temperatures inside a heat furnace and examined the effects of the temperatures on the properties. The partially carbonized fiber is highly active in view of electron generation under photon energy excitation. The unique electrical and photovoltaic property are due to their semiconducting behavior. The morphology of the specimen before and after the pyrolysis was examined using scanning electron microscopy (SEM). The SEM images displayed the shrinkage of the fiber due to the pyrolysis. There are two stages of pyrolysis kinetics. Stage I is related to the oxidation of the PAN polymer. Stage II is associated with the carbonization and the activation energy of carbonization is calculated as 118 kJ/mol.

Graphical Abstract

1. Introduction

Traditionally, many lean towards the usage of metals in fiber and/or powder forms for good electrical conductivity [1,2,3] and ceramics for high photosensitivity [4,5,6]. In the current decade, the use of carbon-based nanofibers has expanded dramatically due to their relative low cost to produce, high stability, and unique structure [7,8,9,10]. In addition, it has low density and high surface area to volume ratio, where the individual tube within the nanofiber mat is accompanied by large gaps of space [11,12,13,14,15]. Carbon-based nanofibers have advantageous properties including good electrical conductivity and strong adsorptive performance [16,17,18,19,20] that can be utilized for applications in the fields of electronics and energy conversions. In contrast with most of the nanofibers heated to relatively lower temperatures, carbon-based nanofibers can be heated to higher temperatures and display fairly stable properties.
Although there is considerable research regarding the electrical conductivity of carbon nanofibers, the effect of temperature has not been fully examined and studied. Similarly, the photosensitivity of carbon-based nanofibers has been studied for biomedical applications [21], but there has not been much attention regarding the photosensitivity of nanofibers for photoelectric energy converters and optoelectronic sensors.
As a linear molecular chain polymer, polyacrylonitrile (PAN) can generate crosslinking through chemical reactions during the stabilization and carbonization processes, as shown by Cipriani et al. through the X-ray diffraction (XRD), Fourier transform infrared spectroscopy (FTIR), and Raman spectroscopy studies of specimens under various heat treatment temperature conditions [22]. Schierholz et al. [23] used the in-situ transmission electron microscopy (TEM) to examine the structural evolution of an electrospun PAN fiber at various temperatures. Changes in fiber diameter and surface morphology of the nanofiber were observed at the temperatures of 250 °C, 600 °C, 800 °C, and 1000 °C in the imaging mode. In the concomitant high resolution TEM and electron diffraction mode, roughening of the surface morphology and formation of turbostratic carbon with increasing carbonization temperature at identical locations were shown. A differential scanning calorimetry (DSC) experiment showed a broad exothermic peak at 308 °C in the stabilized PAN fiber, indicating the initial cyclization of the structure at such a temperature [24]. This temperature is slightly lower than the melting temperature of PAN (317 °C), but much higher than the glass transition temperature of PAN, which is 107.2 °C as determined by the dynamic mechanical analysis (DMA) [25].
The studies of heat treatment on PAN focus on two major categories, i.e., low temperature thermal oxidative stabilization [26,27,28,29,30] and high temperature carbonization [31,32,33,34]. Low temperature treatment of PAN refers to the temperature range from room temperature up to 300 °C [26,27]. The temperature range for the pre-carbonization of PAN-based carbon fiber is from 350 °C to 600 °C [28]. High temperature carbonization typically refers to the treatment in the temperature range from 800 °C to 1300 °C and graphitization of the fiber is in the temperature range from 1300 °C up to 2100 °C [29]. The change in structure of the polymer is significantly affected by various factors in this temperature range. The stereoregularity of the PAN precursor is one of such most important structural parameters because the spatial alignment of the nitrile groups determines how active they are in the cyclization reactions during thermal oxidative stabilization (TOS) procedures. Ghorpade et al. [26] found that the more stereoregular of the PAN (co)polymer precursors, the higher the extents of cyclization, resulting in higher concentrations of cyclized rings. The tensile strength and modulus of elasticity of the fiber decrease with the oxidation. But they increase after the low temperature carbonization. The oxidation and stabilization in the temperature range from 225 °C to 255 °C caused tensile strength and modulus to decrease from 0.51 GPa to 0.27 GPa and from 10.11 GPa to 8.97 GPa, respectively. After carbonization, the strength and modulus increase to 1.24 GPa and 69.39 GPa, respectively, as reported by Hameed et al. [27]. Jing et al. [28] investigated the chemical structure evolution and mechanism during the pre-carbonization of PAN-based stabilized fiber in the temperature range of 350–600 °C. They found that in the first stage in the temperature range from 300 °C to 450 °C, the stabilized fiber demonstrated cross-linking and aromatization reactions with gentle heat releasing. In the second stage at 450 °C to 550 °C, active pyrolysis occurred. After pyrolysis, the fiber shows a fully aromatized structure. The size of the aromatization rings is smaller than that of the rings before pyrolysis. Multiple steps of low temperature stabilization can improve the mechanical strength of the carbon fiber. In one of the examples, the PAN precursor was first stabilized at 120 °C for 30 days, followed by the second treatment in a multiple zone furnace with the four temperatures at 200 °C, 225 °C, 250 °C, and 275 °C. After being stabilized for 40 min, the fiber was fully carbonized in nitrogen in the temperature range from 900 °C to 1300 °C. The tensile strength was found 17% higher than the fiber processed by the regular stabilization [30].
Blending a lower thermally stable polymer, for example polymethyl methacrylate (PMMA), into polyacrylonitrile (PAN) prior to carbonization can change the physical and chemical properties of the carbon fiber after high-temperature thermal treatment [31]. This is due to the fusion of PMMA into PAN, which caused the expansion of the structure. PMMA addition can result in pore formation through the volatilization and give-off the thermal degradation products. Joo et al. [32] made carbon films from PMMA-PAN blends. The carbon films show the structures with a specific surface texture. The reason for this is from the electrohydrodynamic instability of the interface between PAN and PMMA during the precursor film formation in the electric field. PMMA and PAN have different dielectric constants. The electric susceptibility of PAN/PMMA and the polymer blend/air interfaces along the electric field changes. This facilitates some of the special pattern formation in the PAN and PMMA polymer blends. Nitrogen blowing core–shell drops of PMMA and PAN coupled with electrospinning was performed to make multilayered polymer fiber with PMMA core and PAN shell [33]. The subsequent heat treatment led to the complete elimination of the core and carbonization of the shell. Eventually, carbon tubes with an inner diameter of 50–150 nm and outer diameter of 400–600 nm, and their mats were obtained. Emulsion polymerization of PMMA and PAN was used to prepare PMMA core/PAN shell particles [34]. The PMMA/PAN composite particles were stabilized in air at 250 °C and then carbonized in nitrogen at 1000 °C during which all the PMMA cores turned into pores and the PAN shells were converted into carbon shells. In this way, hollow carbon nanospheres (HCNs) were produced with cracking at the carbon shells.
PAN fibers have found various applications as new structural or functional materials [35,36,37,38,39,40,41]. Li et al. [35] made porous carbon nanofiber derived from immiscible PAN/PMMA for high-performance lithium-sulfur batteries. The porous carbon nanofibers (PCNFs) served as coating layers on a glass fiber (GF) separator to block polysulfide diffusion in Li-S batteries. The polyacrylonitrile (PAN)/polymethyl methacrylate (PMMA) blends were electrospun and followed by thermal treatment, during which PAN was converted to carbon while PMMA was decomposed to generate small open pores in the carbon nanofiber matrix. In the review given by Gong et al. [36], it is described that the carbon precursor (PAN) can be pre-organized into a well-defined nanostructure through phase-separation-driven self-assembly induced by the presence of a sacrificial immiscible block such as butyl acrylate and methyl methacrylate. Upon pyrolysis, the PAN domains were converted into graphitic carbon, whereas the sacrificial phase was volatilized. The requirement for pore formation is that the PAN domains keep their cyclic, ladder, and eventually crosslinked structures upon thermal treatment. It is also demonstrated that even before the heat treatment, the electrospun PMMA/PAN blend polymer fiber mat has 10% higher porosity than the pure PAN fiber mat has [37]. The stabilization of PAN can be achieved mainly by thermal treatment in air [38]. The pre-heat-treatment irradiation of PAN can promote the crosslinking of the polymer and thus shorten the time and/or lower the onset temperature for cyclization and aromatization [39]. On the contrary, to ensure high mechanical strength of the carbonized fiber, pure PAN is used as the precursor and pore formation should be avoided. The homogeneous cross-section is the preferred nanofiber structure, which can eliminate the failure prone shell–core structure. The core-shell feature is taken as a major structural weakness in high strength nanofibers [40]. However, to increase the toughness of nanofibers, creating nanoscale interfaces using polymer blends was proposed [41].
In this work, a PMMA-PAN based fiber has been made by the electrospinning process. The polymer fiber underwent pyrolysis at various temperature conditions to obtain the partially carbonized nanofiber. We examined and analyzed the effects of pyrolysis temperature on the electrical conductive behavior and photosensitivity of the carbon-based nanofiber. The electrical resistance and conductance were tested and measured by using an electrochemical analyzer, whereas the heat treatment temperature was raised by using a high temperature furnace with resistive heating wires. Scanning electron microscopy (SEM) was used to reveal the difference in the structure and morphological features for the fiber before and after pyrolysis. The activation energy associated with the carbonization reaction has been determined.

2. Materials and Experimental Methods

0.25 g poly-acrylonitrile (PAN) polymer powder with the molecular weight of 150,000 and 0.25 g poly-methyl methacrylate (PMMA) polymer powder with the molecular weight of 550,000 were dissolved into 5 mL N,N-dimethylformamide (DMF) to form a precursor polymer solution. The PAN polymer was supplied by Scientific Polymer Products, Inc., located in Ontario, New York, NY, USA. The rest of the chemicals were purchased from Alfa Aesar, Ward Hill, MA, USA, without further purification.
The samples of the carbon-based nanofiber came from the process of electrospinning. The precursor solution was first drained into a medical-grade syringe which was obtained from McMaster-Carr, located in Santa Fe Spring, CA, USA. The syringe was tested and cleaned using compressive air to remove any particles and other clogging substances. There was a DC power supply (Mode CZE1000R made by Spellman, located in Hauppauge, NY, USA) that generates a high voltage difference of up to 30 kV between the electrospinning nozzle and the collector plate. In this work, the DC voltage for electrospinning was 10 kV. This voltage difference resulted in an electric force that slowly accelerates the polymer solution flowing out at 0.01 mL/min from the syringe as shown in Figure 1a. Once out of the spinning tip of the needle connected with the syringe, the precursor accelerated quickly and followed the convective flow that transformed the liquid into a solid state of a polymer fiber. The spinning collector plate collected the fiber strands that were extracted and prepared for the subsequent processing steps.
Following the extraction from the collector plate, the PAN-PMMA polymer fiber was cut into separate pieces for pyrolysis at different treatment temperatures. The samples were stored in a quartz glass tube that was placed in a high temperature heat furnace made by MTI Corp. in Richmond, CA, USA (Figure 1b). A variety of samples were oxidized at 250 °C through the reaction with oxygen in the air. Some of the oxidized samples were heated to various temperatures above 250 °C in the quartz tube chamber purged with Ar gas. Under the protection of the inert Ar gas, the polymer fiber was partially carbonized at different pyrolysis temperatures including 450 °C, 500 °C, 550 °C, 600 °C, 650 °C, 700 °C, 750 °C, and 800 °C. To test if there was sufficient Ar gas in the reaction compartment, one of the valves was shut off and the Ar gas was led through a tube into a cup of water. Bubbling in the water was an indication of an adequate supply of the Ar gas. Each sample was heated up towards a specific target temperature in the span of two hours. The selected temperature was maintained for another two hours and then the sample was naturally cooled down for about four to five hours, depending on the reached temperature. The experimental set-up for oxidation and carbonization is shown in Figure 1b.
Electrical conductivity testing experiments were done for specimens heat treated at various temperatures. The test on the electrical conductivity of the samples was performed with an electrochemical analyzer, Mode CHI6005E made by CH Instrument Inc. located at Austin, TX, USA. The samples of carbon-based fibers were strapped to a glass plate acting as a substrate, since glass is an insulator and has low conductivity at room temperature. Each specimen was bound to the glass plate with aluminum strips, a conducting material. The three probe method was utilized. The resistance and conductance of the samples were calculated from the output current in amperes under the added bias potential in the range of 0–1.0 V. To characterize the electrical conductive behavior of the samples, the measurement system was set in the linear sweep voltammetry test mode, in which the current is measured as a function of the linear increasing voltage between a working electrode and a reference electrode. The initial voltage is 0 that goes to a final voltage of 1.0 V. The electrochemical workstation had a scan rate of 0.1 V/s with a quiet time of 2 s and a data recording interval of 0.01 V during the total scan time of 12 s.
Photon induced voltage data were taken using the same electrochemical analyzer to examine the photovoltaic property of the fiber. The CHI6005E was set on the open circuit voltage function. A light source was used to shine the specimens. The light ‘ON’ state was maintained by switching on the fluorescent lamp. The ‘OFF’ state was achieved by using a dark screen blocking the light above the specimens. The voltage data were recorded by a computer for further analysis.
Photosensitivity was determined using the same CHI6005E electrochemical analyzer. To test the reaction to a switch of light, the open circuit potential (OCP) was recorded. The deviations in the OCP between the switching on of the light and the switching off of the light were evaluated based on the recorded time-dependent potential data. To implement this test, a screen that blocked out the light was put on top of the specimen for ten seconds, followed by its removal for another 10 s to allow for the light to shine through, and so on. The three probe method was used with the electrochemical analyzer that allowed for the testing of the potential, in volts, when compared to the time passed, in seconds.
A JEOL6500 scanning electron microscope purchased from JEOL USA, Inc. located in Peabody, Massachusetts, USA, with an energy dispersive X-ray diffraction attachment was used for the fiber morphology observation and composition analysis. The SEM imaging experiment on the fiber specimens processed under various conditions reveals the difference in morphological features, especially the relationship between the gaps of air and tubes of the nanofiber. Electrons are generated at the source (top of the column) and shoot out in a beam formation. The interaction of the electrons with the sample produces ‘backscattered’ electrons (secondary electrons) that are collected by a nearby detector and are able to form an image. Some samples were not conductive enough for a clear image generated by the electrons, so gold coating was used. Gold has a high electron density that increases the scattering of the electron beam and creates a clearer image with higher contrasts. The sputter coating instrument was evacuated of oxygen to prevent the oxidation of the sample until the pressure becomes 40 milli-Torr. Then, there was an injection of Ar gas to purge out the oxygen until the pressure reached 65 milli-Torr. The current was set at 15 mA and there was a plasma discharge that allows for the emission of gold nanoparticles onto the sample, and ready for SEM imaging.

3. Results and Discussion

3.1. Effect of Pyrolysis Temperature on Structure

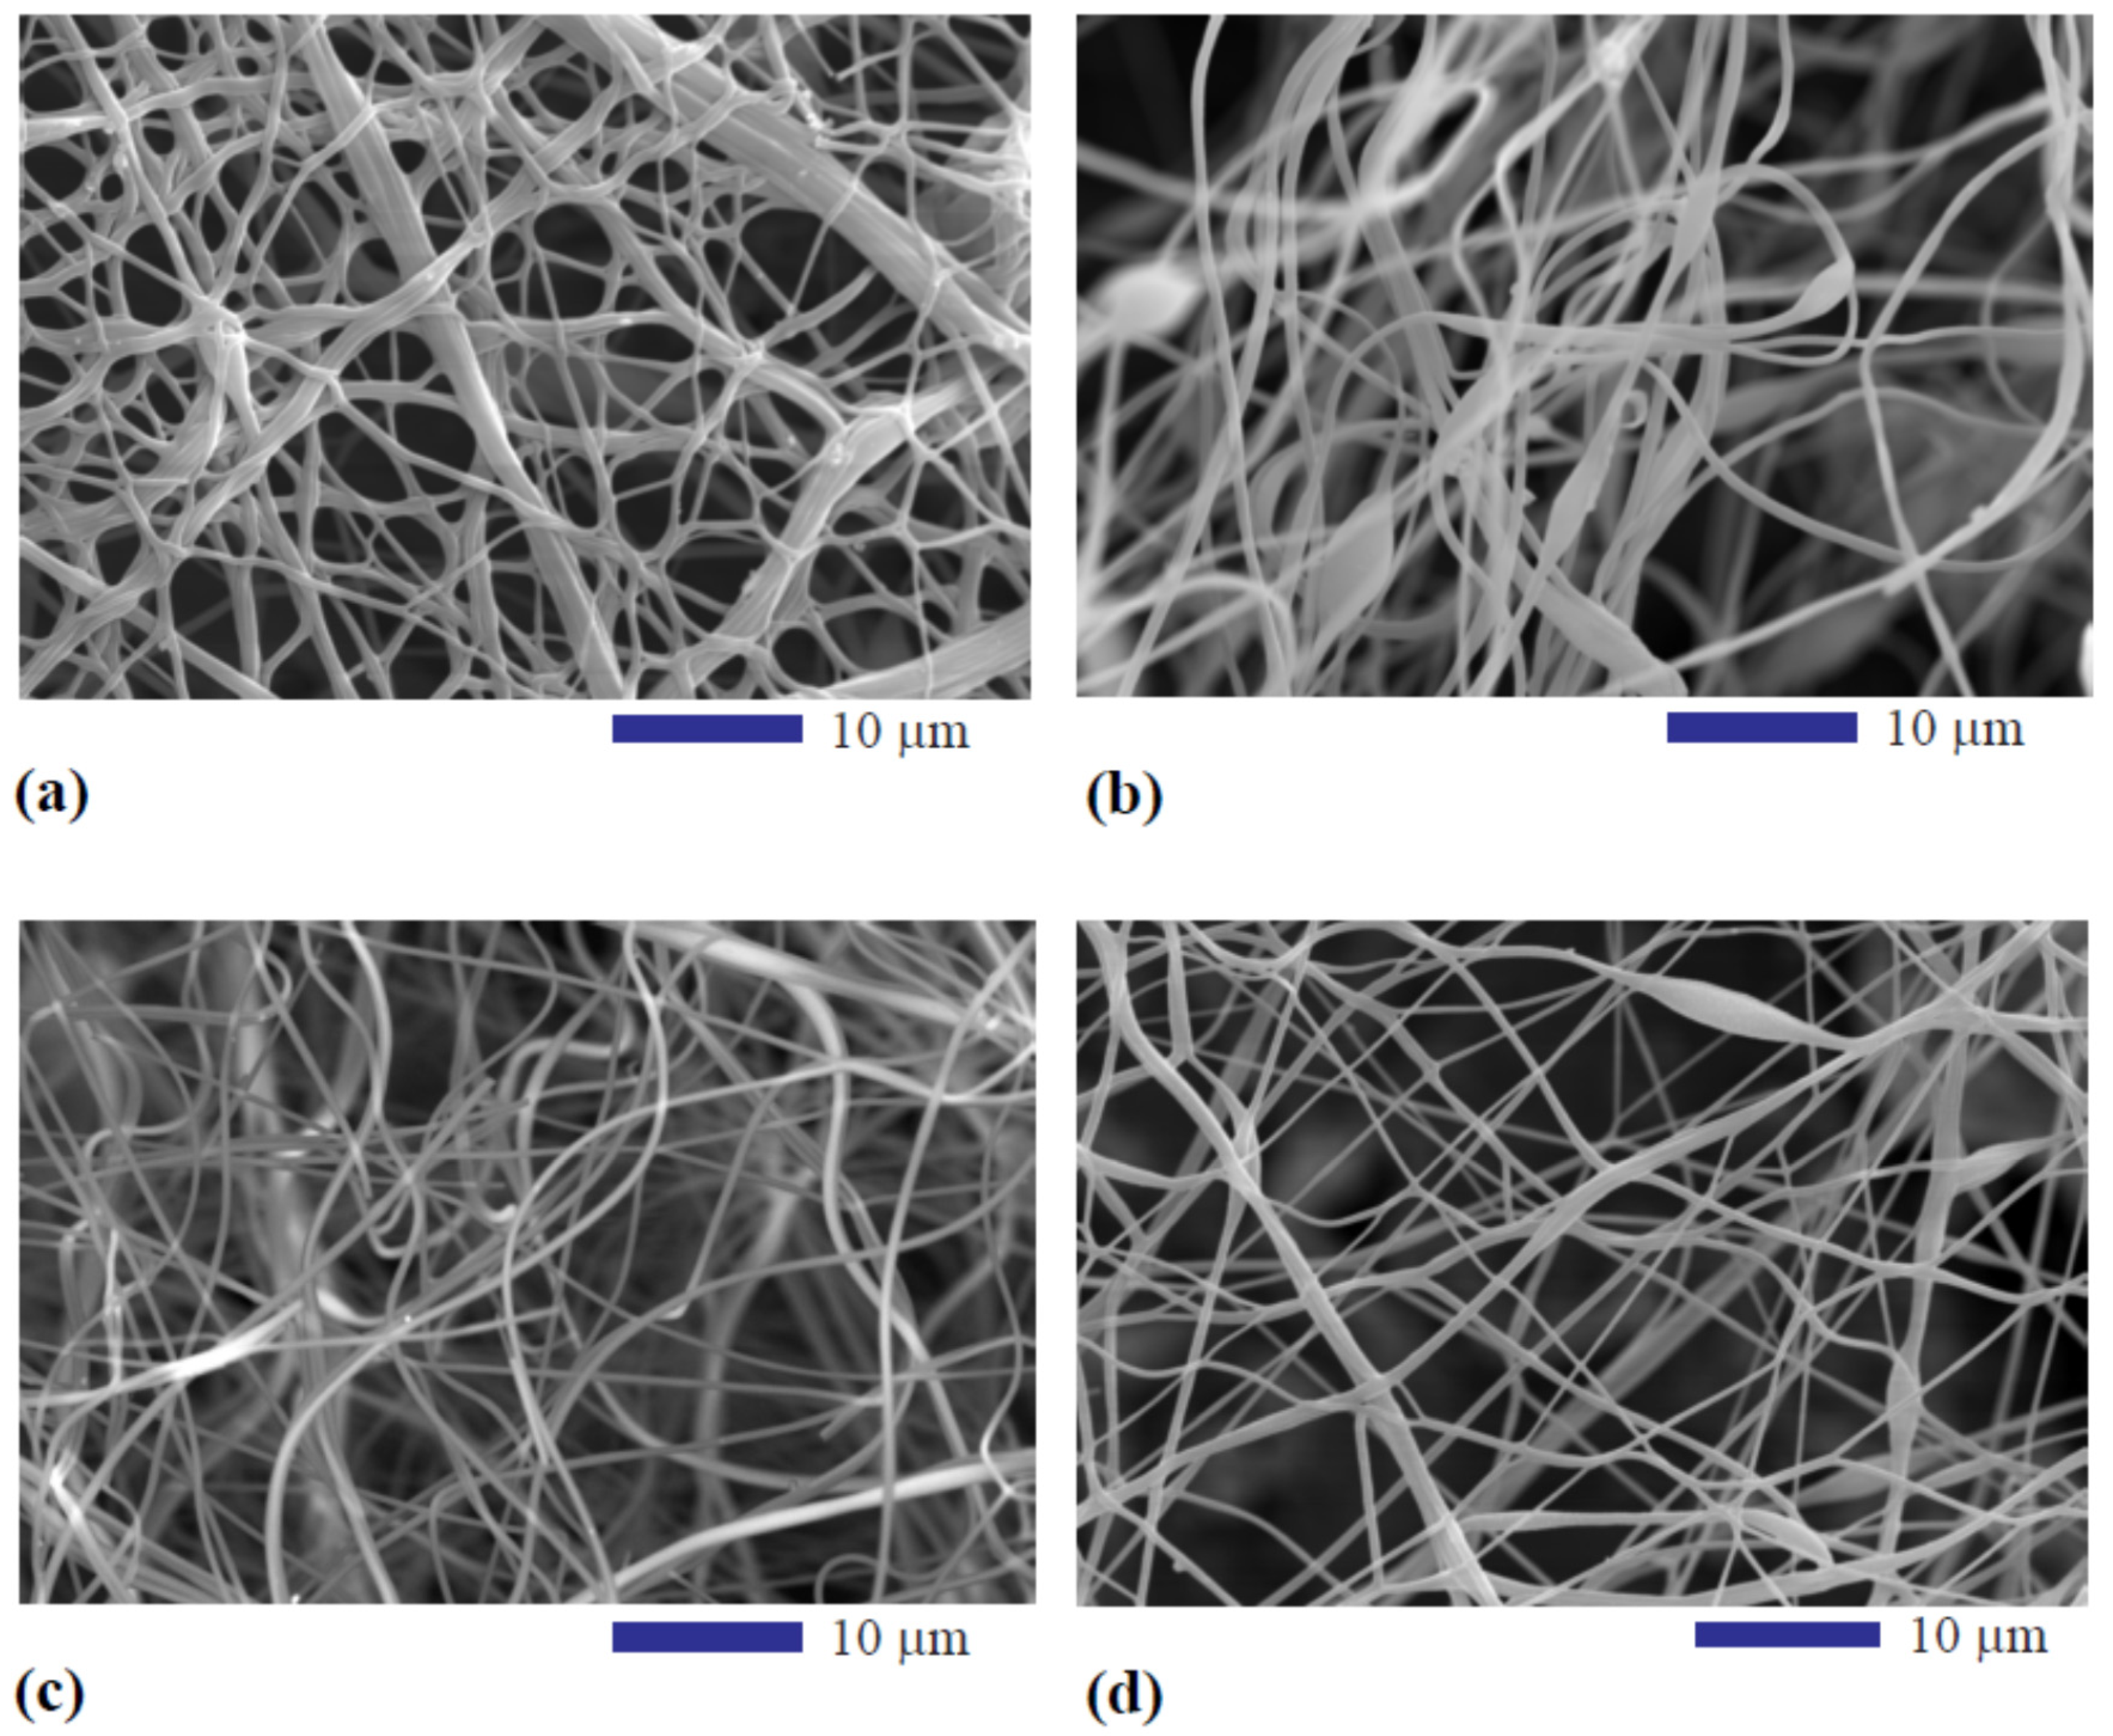
The effect of pyrolysis temperature on the structure was examined microscopically. The SEM image of the fiber heat treated at 250 °C is shown in Figure 2a. The transverse size of the fiber ranges from the nanometer to micrometer range. Fairly thick fibers with the transverse size around several microns are seen in this image, while most of the fibers are pretty fine in the size range of several hundred nanometers. Since 250 °C is a temperature for the oxidation and stabilization of the structure of PAN. Some PMMA may generate molecular chain scission due to the thermal instability of the PMMA [34,35]. That is why the cross section of the oxidization-processed fiber is not circular. Instead, irregular cross section shapes are found. The size of the fiber is from micron scale to nanoscale. Some of the large sized fiber has a diameter as thick as 5 µm, while some of the fine fiber is as thin as 600 nm. The average diameter of the fibers is estimated around 1.5 µm. Figure 2b is the SEM image of the PMMA/PAN fiber heat treated at 450 °C. Due to the dehydrogenation and ammonia gas give-off from the fiber, the weight loss could be as high as 40% as reported by Cipriani et al. based on the thermogravimetric analysis of PAN in the nitrogen inert gas [22]. Some oligomers can also be released in the temperature range from 300 °C to 400 °C [42,43]. This is why in Figure 2b, the size of the thicker fibers reduces to less than 2 µm. The average fiber size is about 1.0 µm. Further increase in the heat treatment temperature up to 600 °C increases the total weight loss of the PAN-PMMA polymer fiber to about 50% [31]. The SEM image of the fiber specimen heat treated at 600 °C is illustrated in Figure 2c. Due to the carbonization at this temperature, a further reduction in the size of the fiber of approximately 5–7% was found [22,31]. The average fiber size is reduced to about 900 nm. Much finer fiber filaments than those found in Figure 2a are seen in Figure 2d for the specimen heat treated at 650 °C. This indicates that the temperature can affect the thickness and density of the layers of carbon networks. In Figure 2a, the thickest fiber is almost 5 microns in diameter while in Figure 2d, the thickest fiber is only around 1 micron. Most of the fiber filaments are in the nanoscale level. Another noticeable difference in structure would be that in Figure 2a, the fibers are found to be compacted physically together. These fiber strands are condensed and have very little space inside, giving it a larger density. Figure 2d depicts strands that are not only thinner than those shown in Figure 2a, but also at a smaller density, with gaps of space in between the individual fibers. These contrasting structural differences should be the result of a different heating temperature and this may lead to differences in the properties related to filtering such as air or fluid permeation. Further increase in the heat treatment temperature to 800 °C does not change the size of the fiber significantly because the carbonized fiber shows less than 3% weight loss in protective gas [31].

3.2. Effect of Pyrolysis Temperature on the Electrical Property

The electrical conductive behavior of the carbon-based nanofiber was measured using the three-probe method.
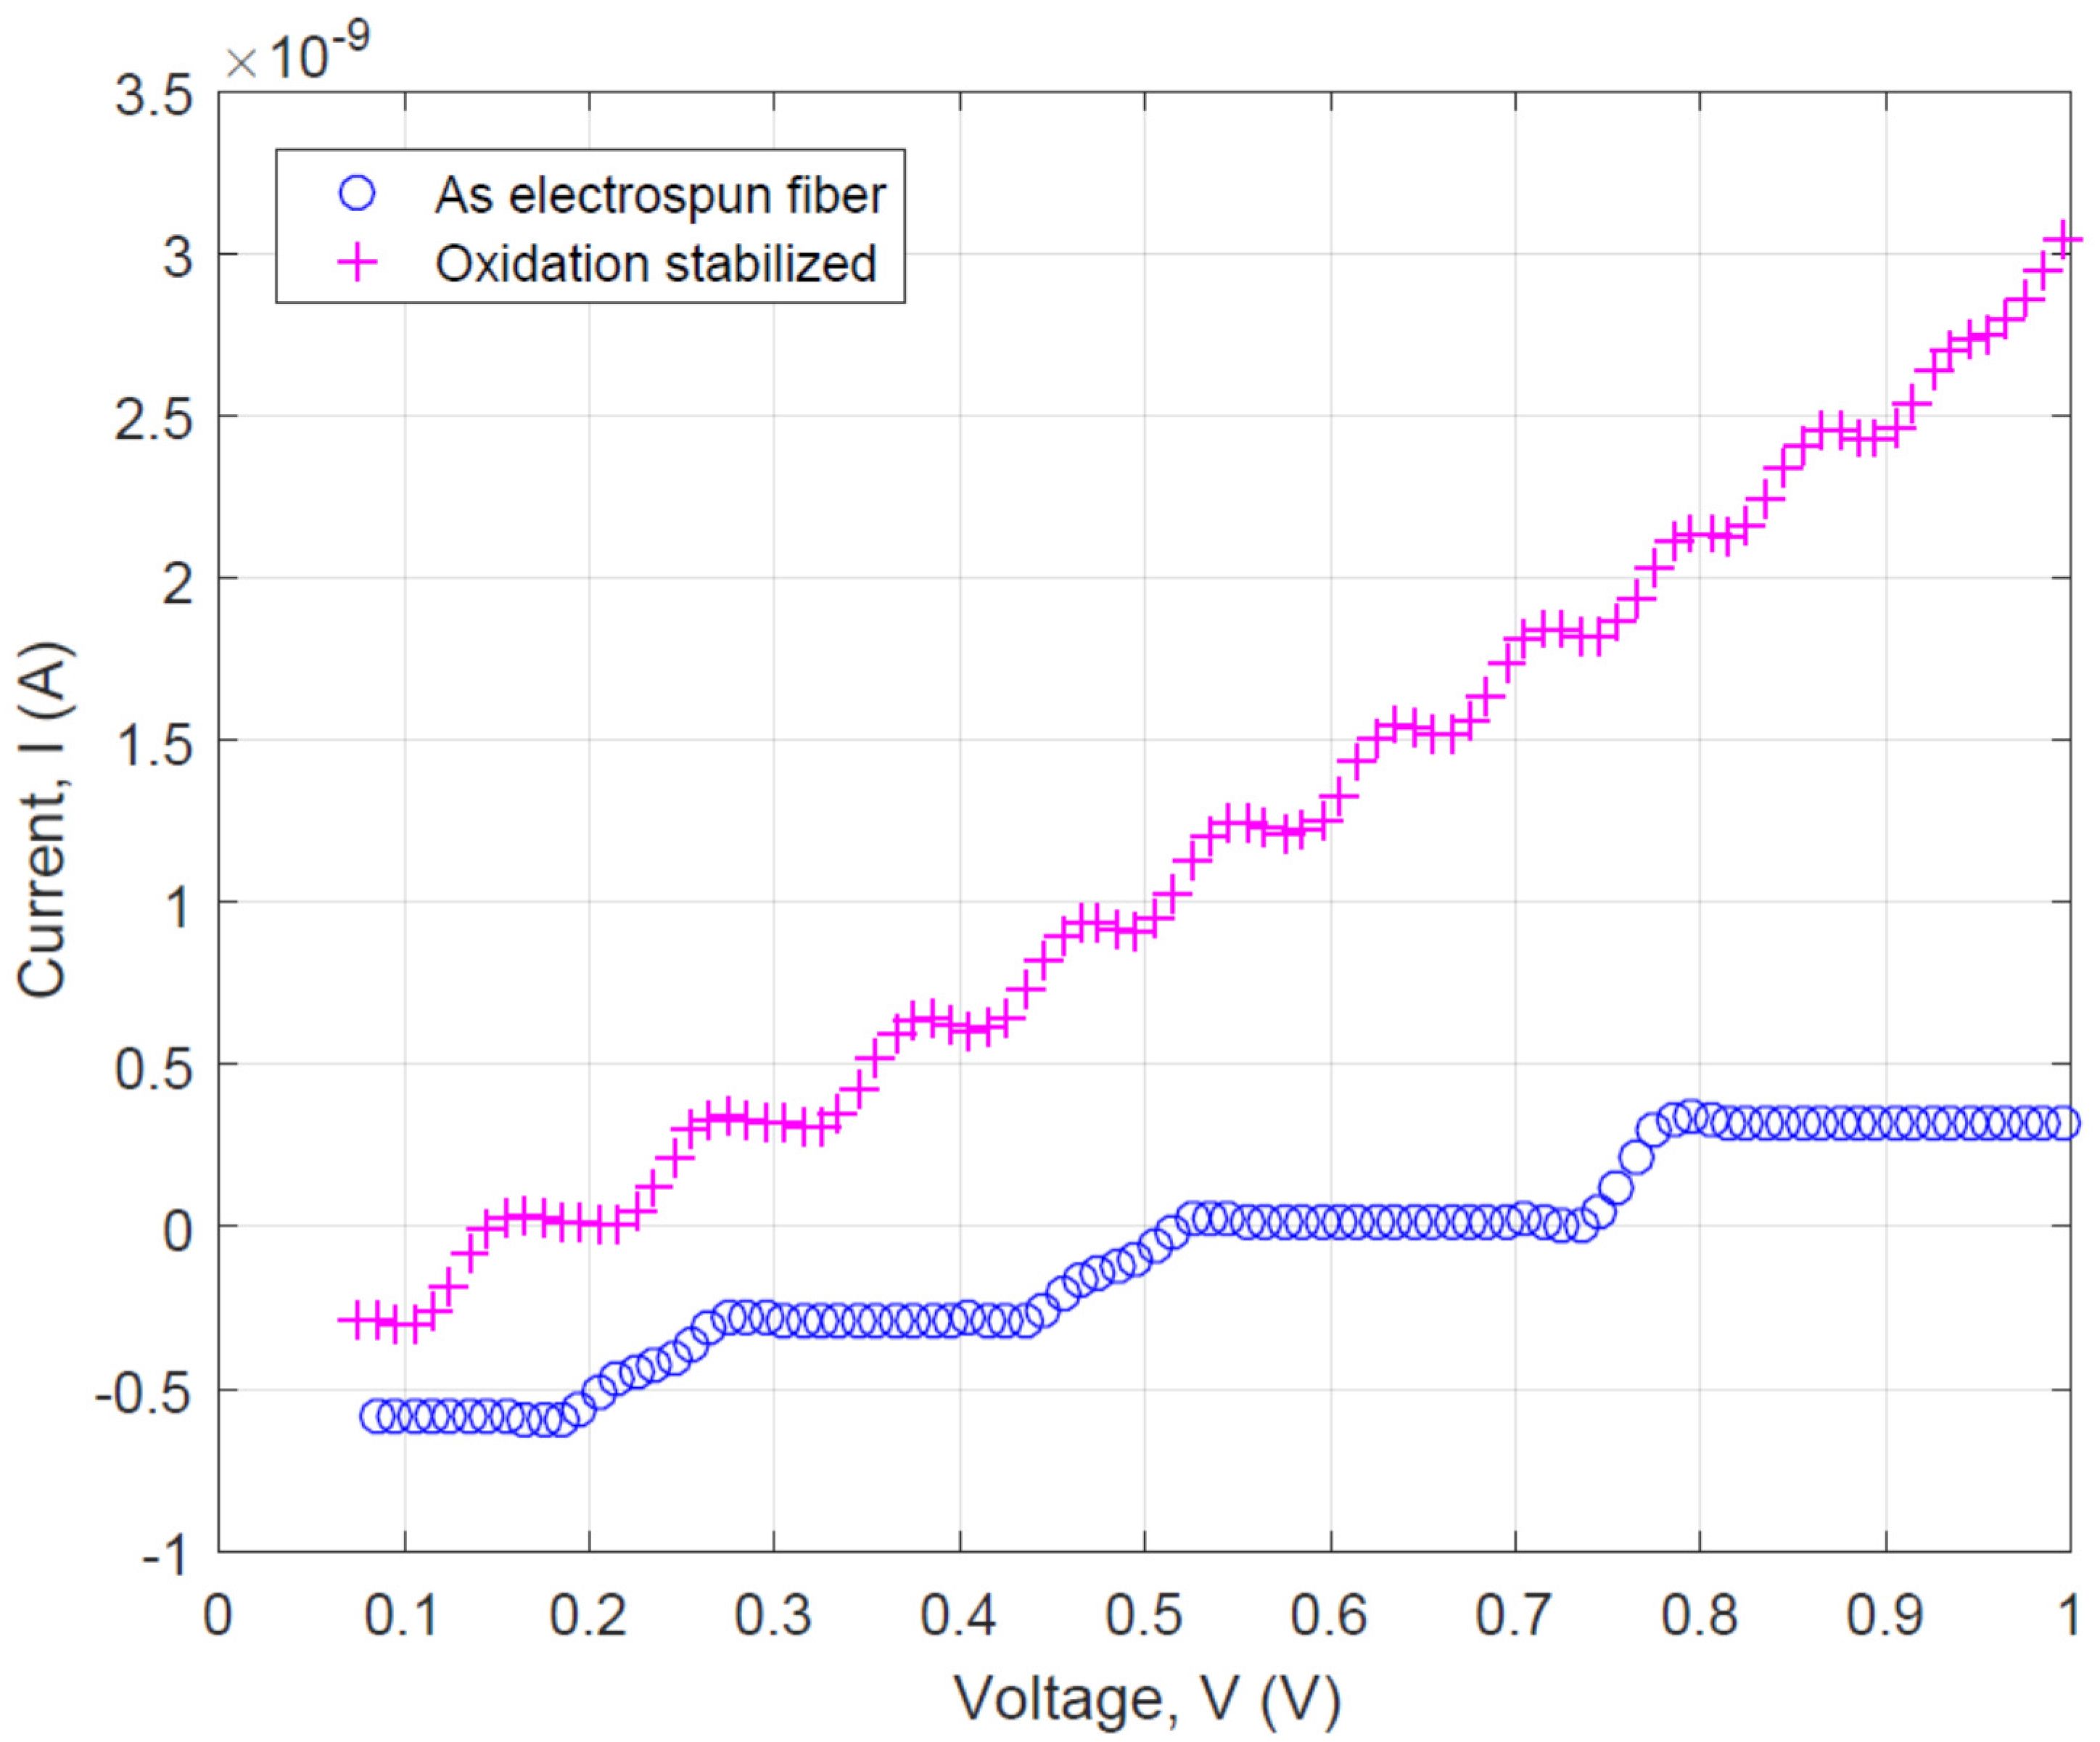
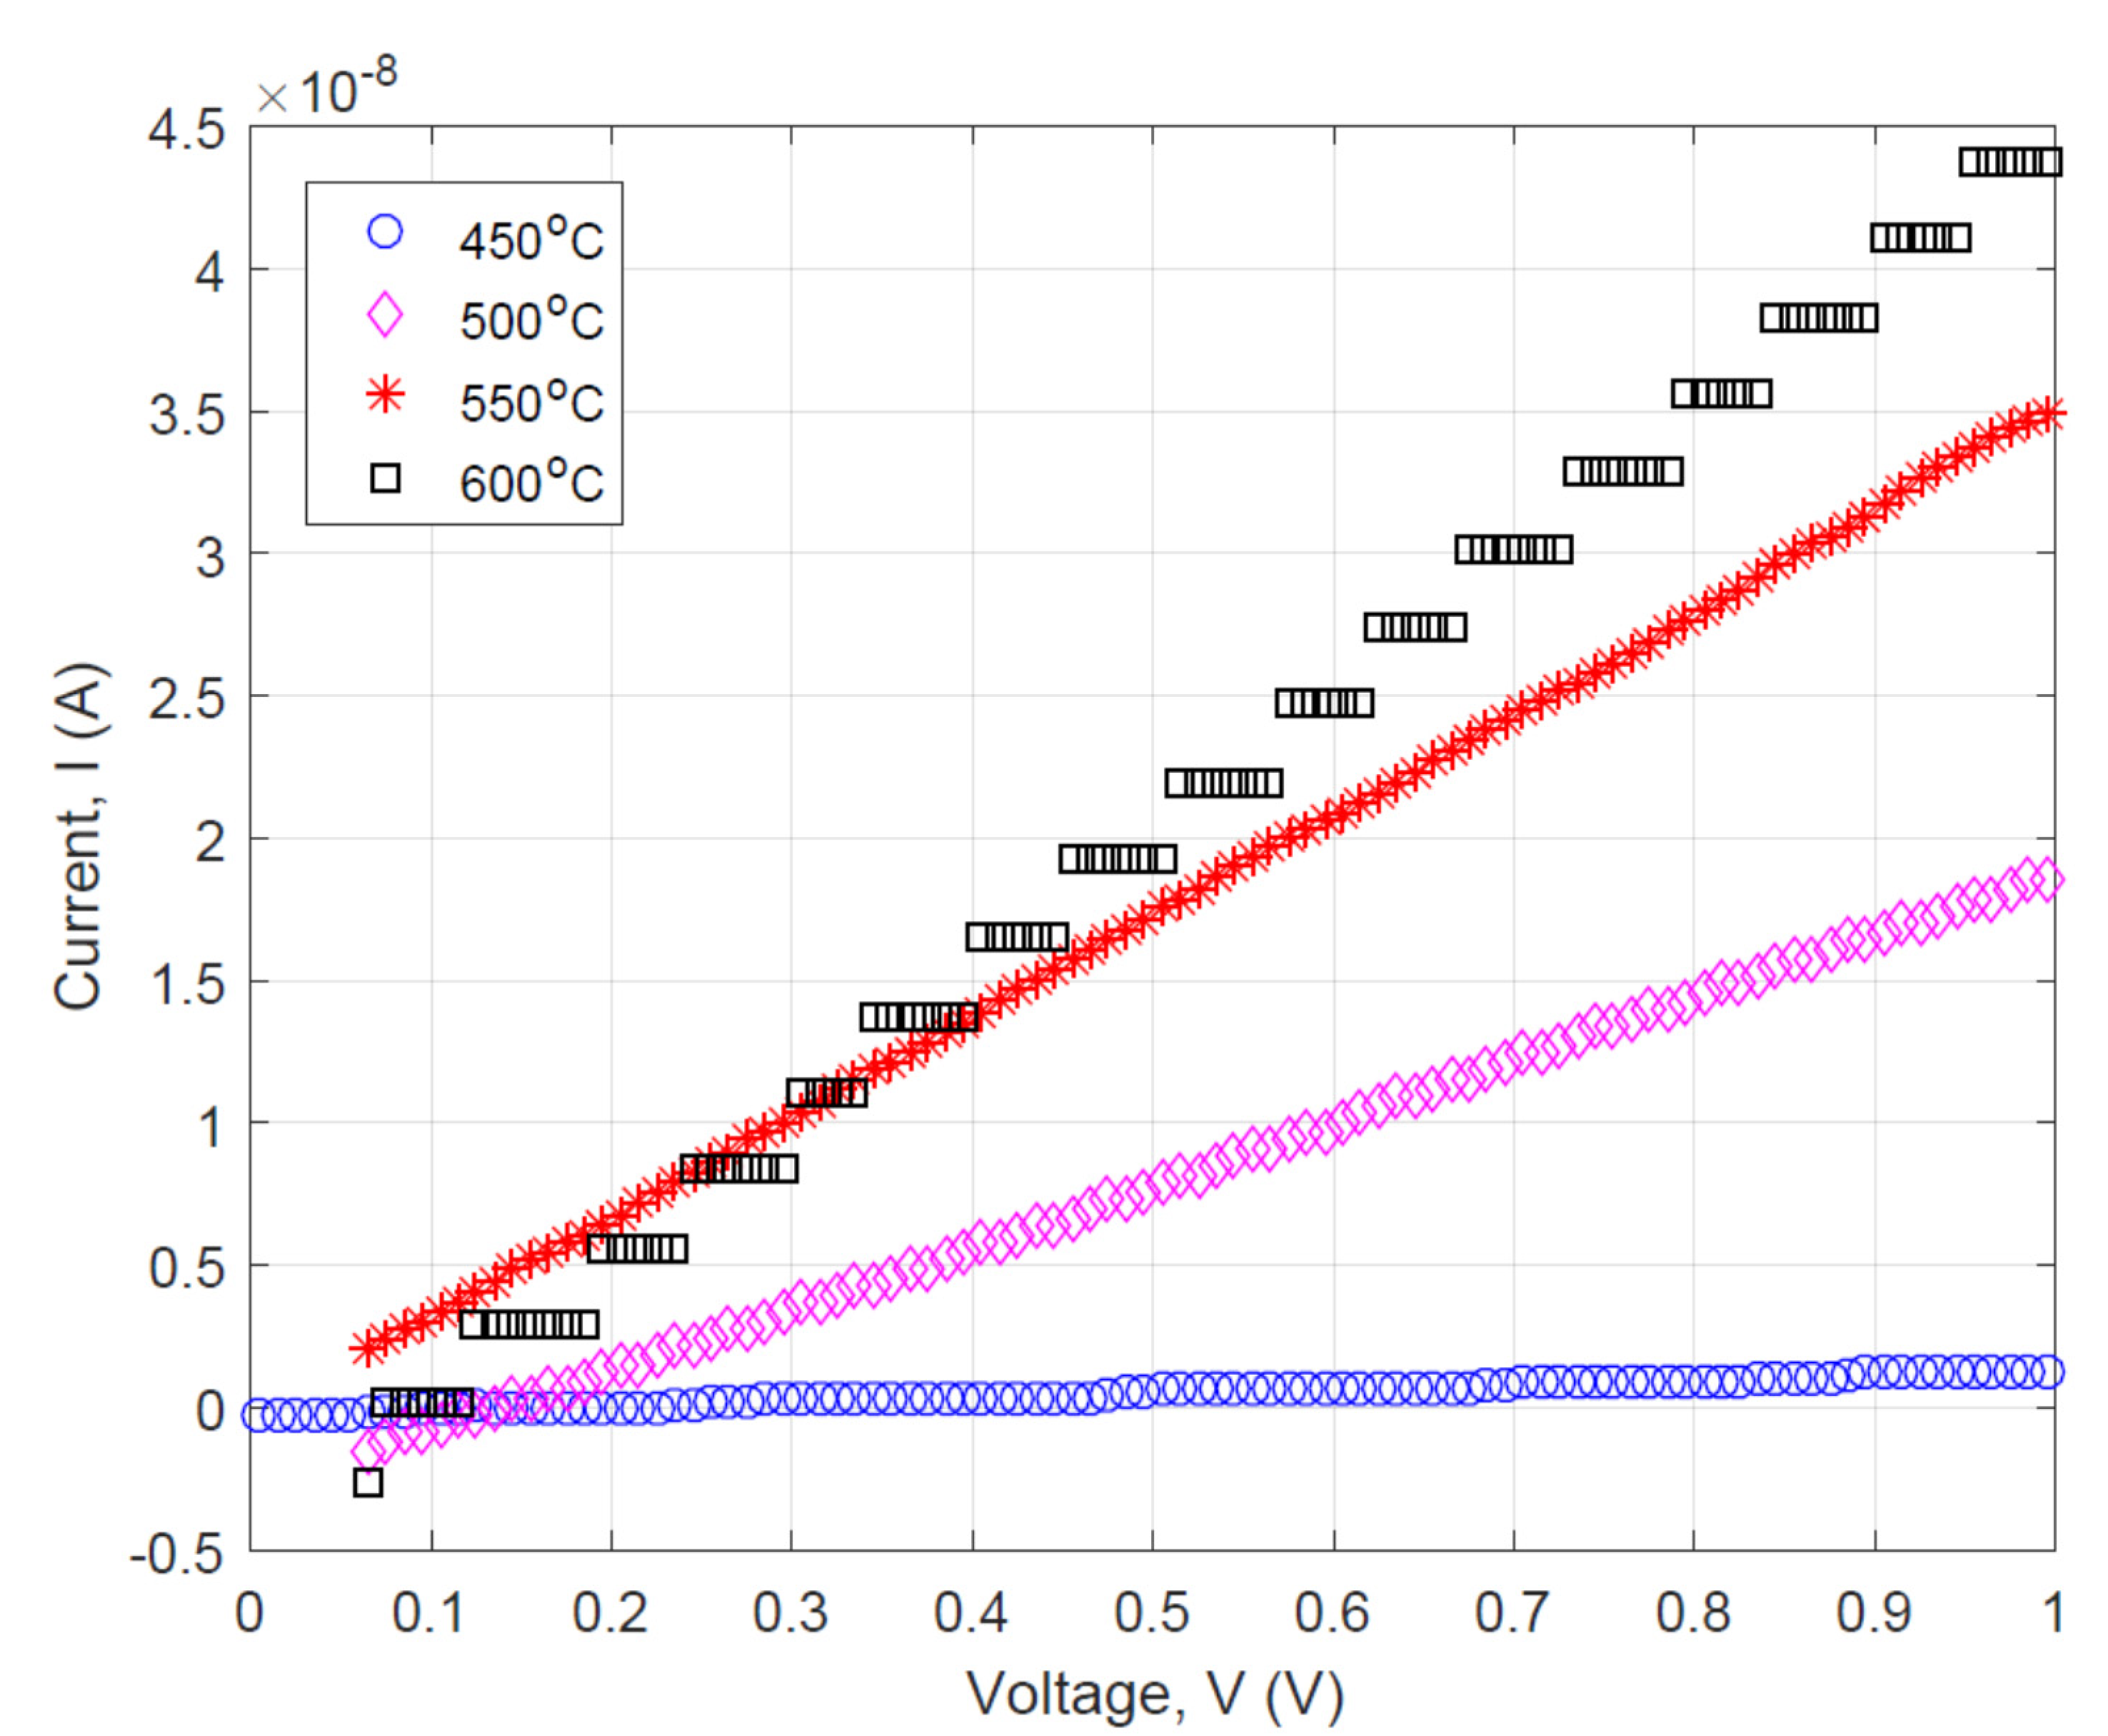
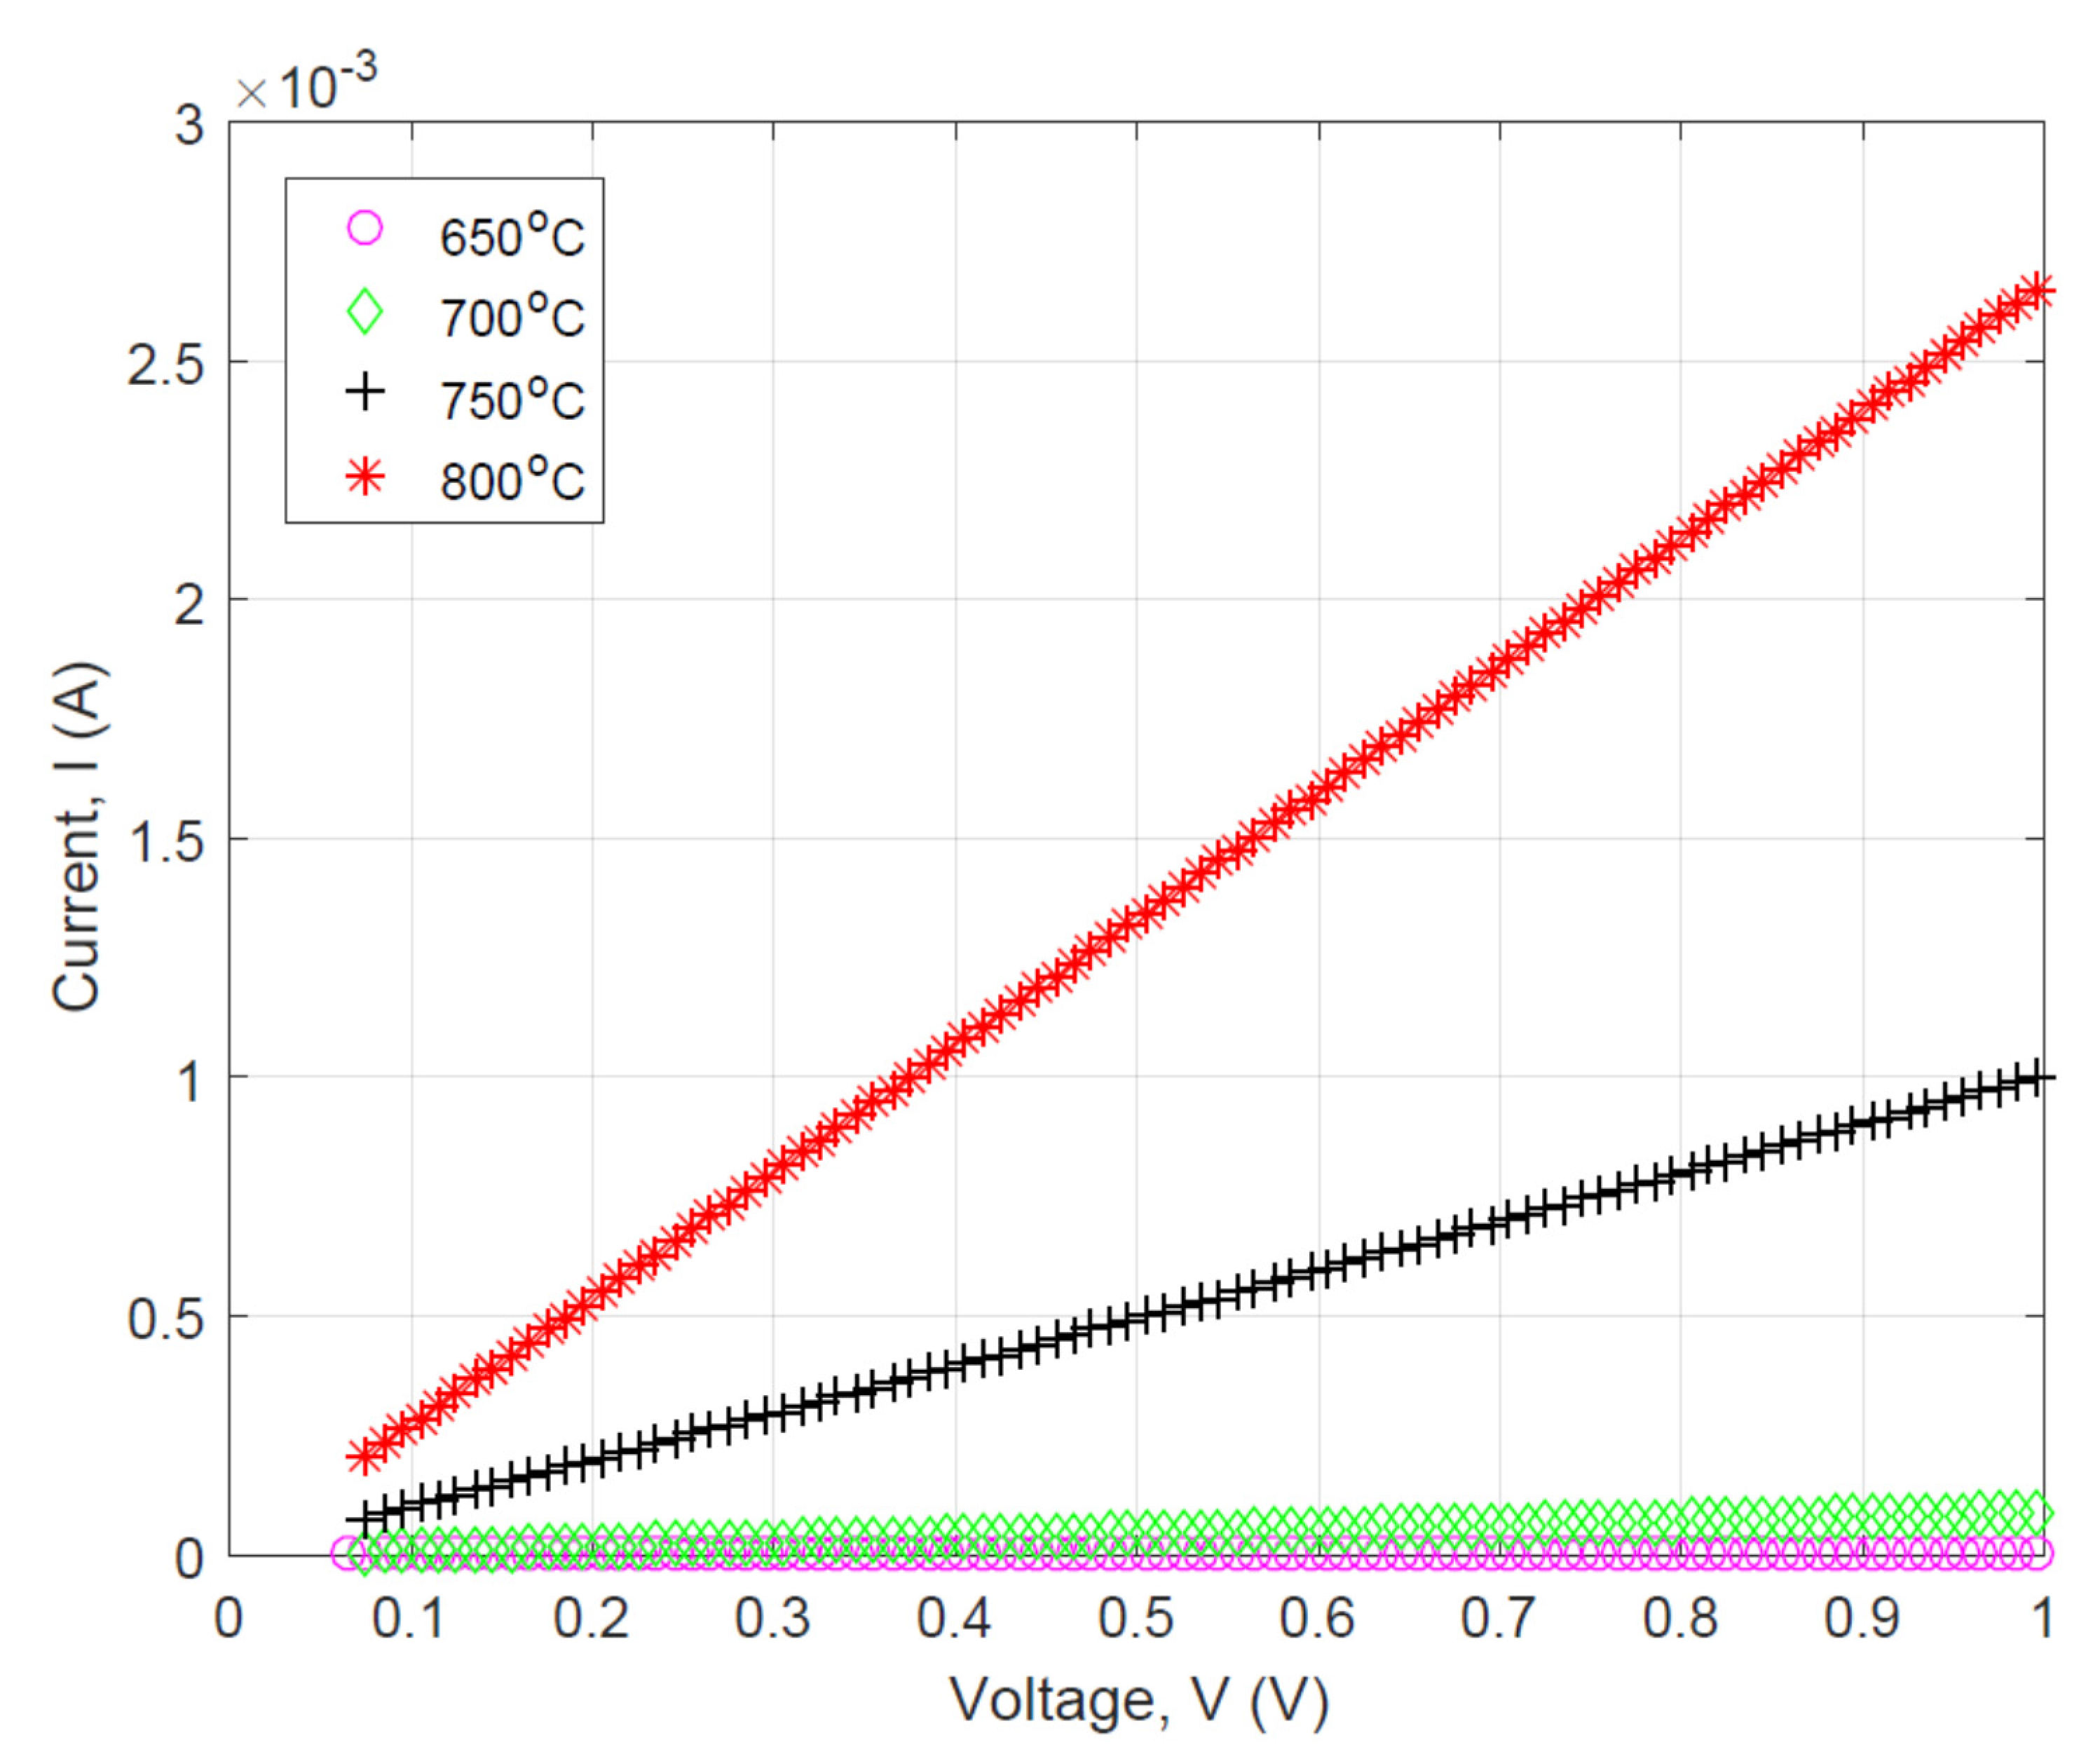
The relationship between the current, I, in amperes, and the scanning voltage, V, in volts are plotted in Figure 3, Figure 4 and Figure 5. Figure 3 show the I–V curves for the as-spun polymer fiber (at 20 °C) and the oxidized fiber (at 250 °C). Figure 4 reveals the I–V curves of the fiber specimens heat treated in the medium temperature range. Figure 5 presents the I–V curves of the carbonized fiber treated at even higher temperature. Consistent with Ohm’s Law, V = IR, the slope of the graph relating I = V(1/R) would be the reciprocal of the resistance (R) of the fiber. This property, known as electrical conductance, is measured in the unit of Siemens (S), formerly known as the reciprocal of one Ohm, and is also referred to as one Mho. While the resistance is the ability of a material to resist the current (flow of electrons), electrical conductivity is a measurement of how well a material is able to conduct that current. The I–V graph’s slope displays the conductance of the material, but is relative to the scale of the number of amperes. In our experiment, the more negative exponent of the amperes exhibits a lower conductance and higher resistance, while the less negative exponent of the ampere value displays a higher conductance and therefore smaller resistance of the carbon-based fiber.
Figure 3 shows the relatively low current, in amperes, and therefore a marginal electrical conductivity of the carbon-based nanofiber heat treated to lower temperatures. The current peaks at a power of 10 to the −9 in amperes, signifying that the material at that temperature is a largely insulating material and not conductive. Figure 4 shows four samples with the treatment temperatures of 450 °C, 500 °C, 550 °C, and 600 °C. Evidently, the current peaks at a power of −8 in amperes. Compared with the results shown in Figure 3, slightly larger current can be seen and therefore the fiber became slightly more conductive. Its conductance is comparable to that of an intrinsic semiconducting material such as high-purity Ge or Si [44,45,46,47].
Figure 5 shows a trend of increased conductivity due to the carbon fiber being heat treated in an even higher temperature range from 650 °C to 800 °C. The fiber being treated at 800 °C has a peak I value falling in 10 to the power of −3 in amperes, implying the highest conductivity of the material. In this temperature range, the treated fiber shows the linear I–V characteristic, indicating that electron hopping is the major conducting mechanism. From the results shown in Figure 3, Figure 4 and Figure 5, it is evident that the higher the treatment temperature, the higher the electrical conductivity of the fiber. After the heat treatment at the temperature of 650 °C, the fiber is mostly carbonized and its conductivity is comparable to that of a doped semiconductor. The pyrolysis in the temperature range from 700 °C to 800 °C allows the fiber specimens to be conductive as comparable to heavily doped semiconducting materials.

3.3. Activation Energy of the Carbonization Reaction

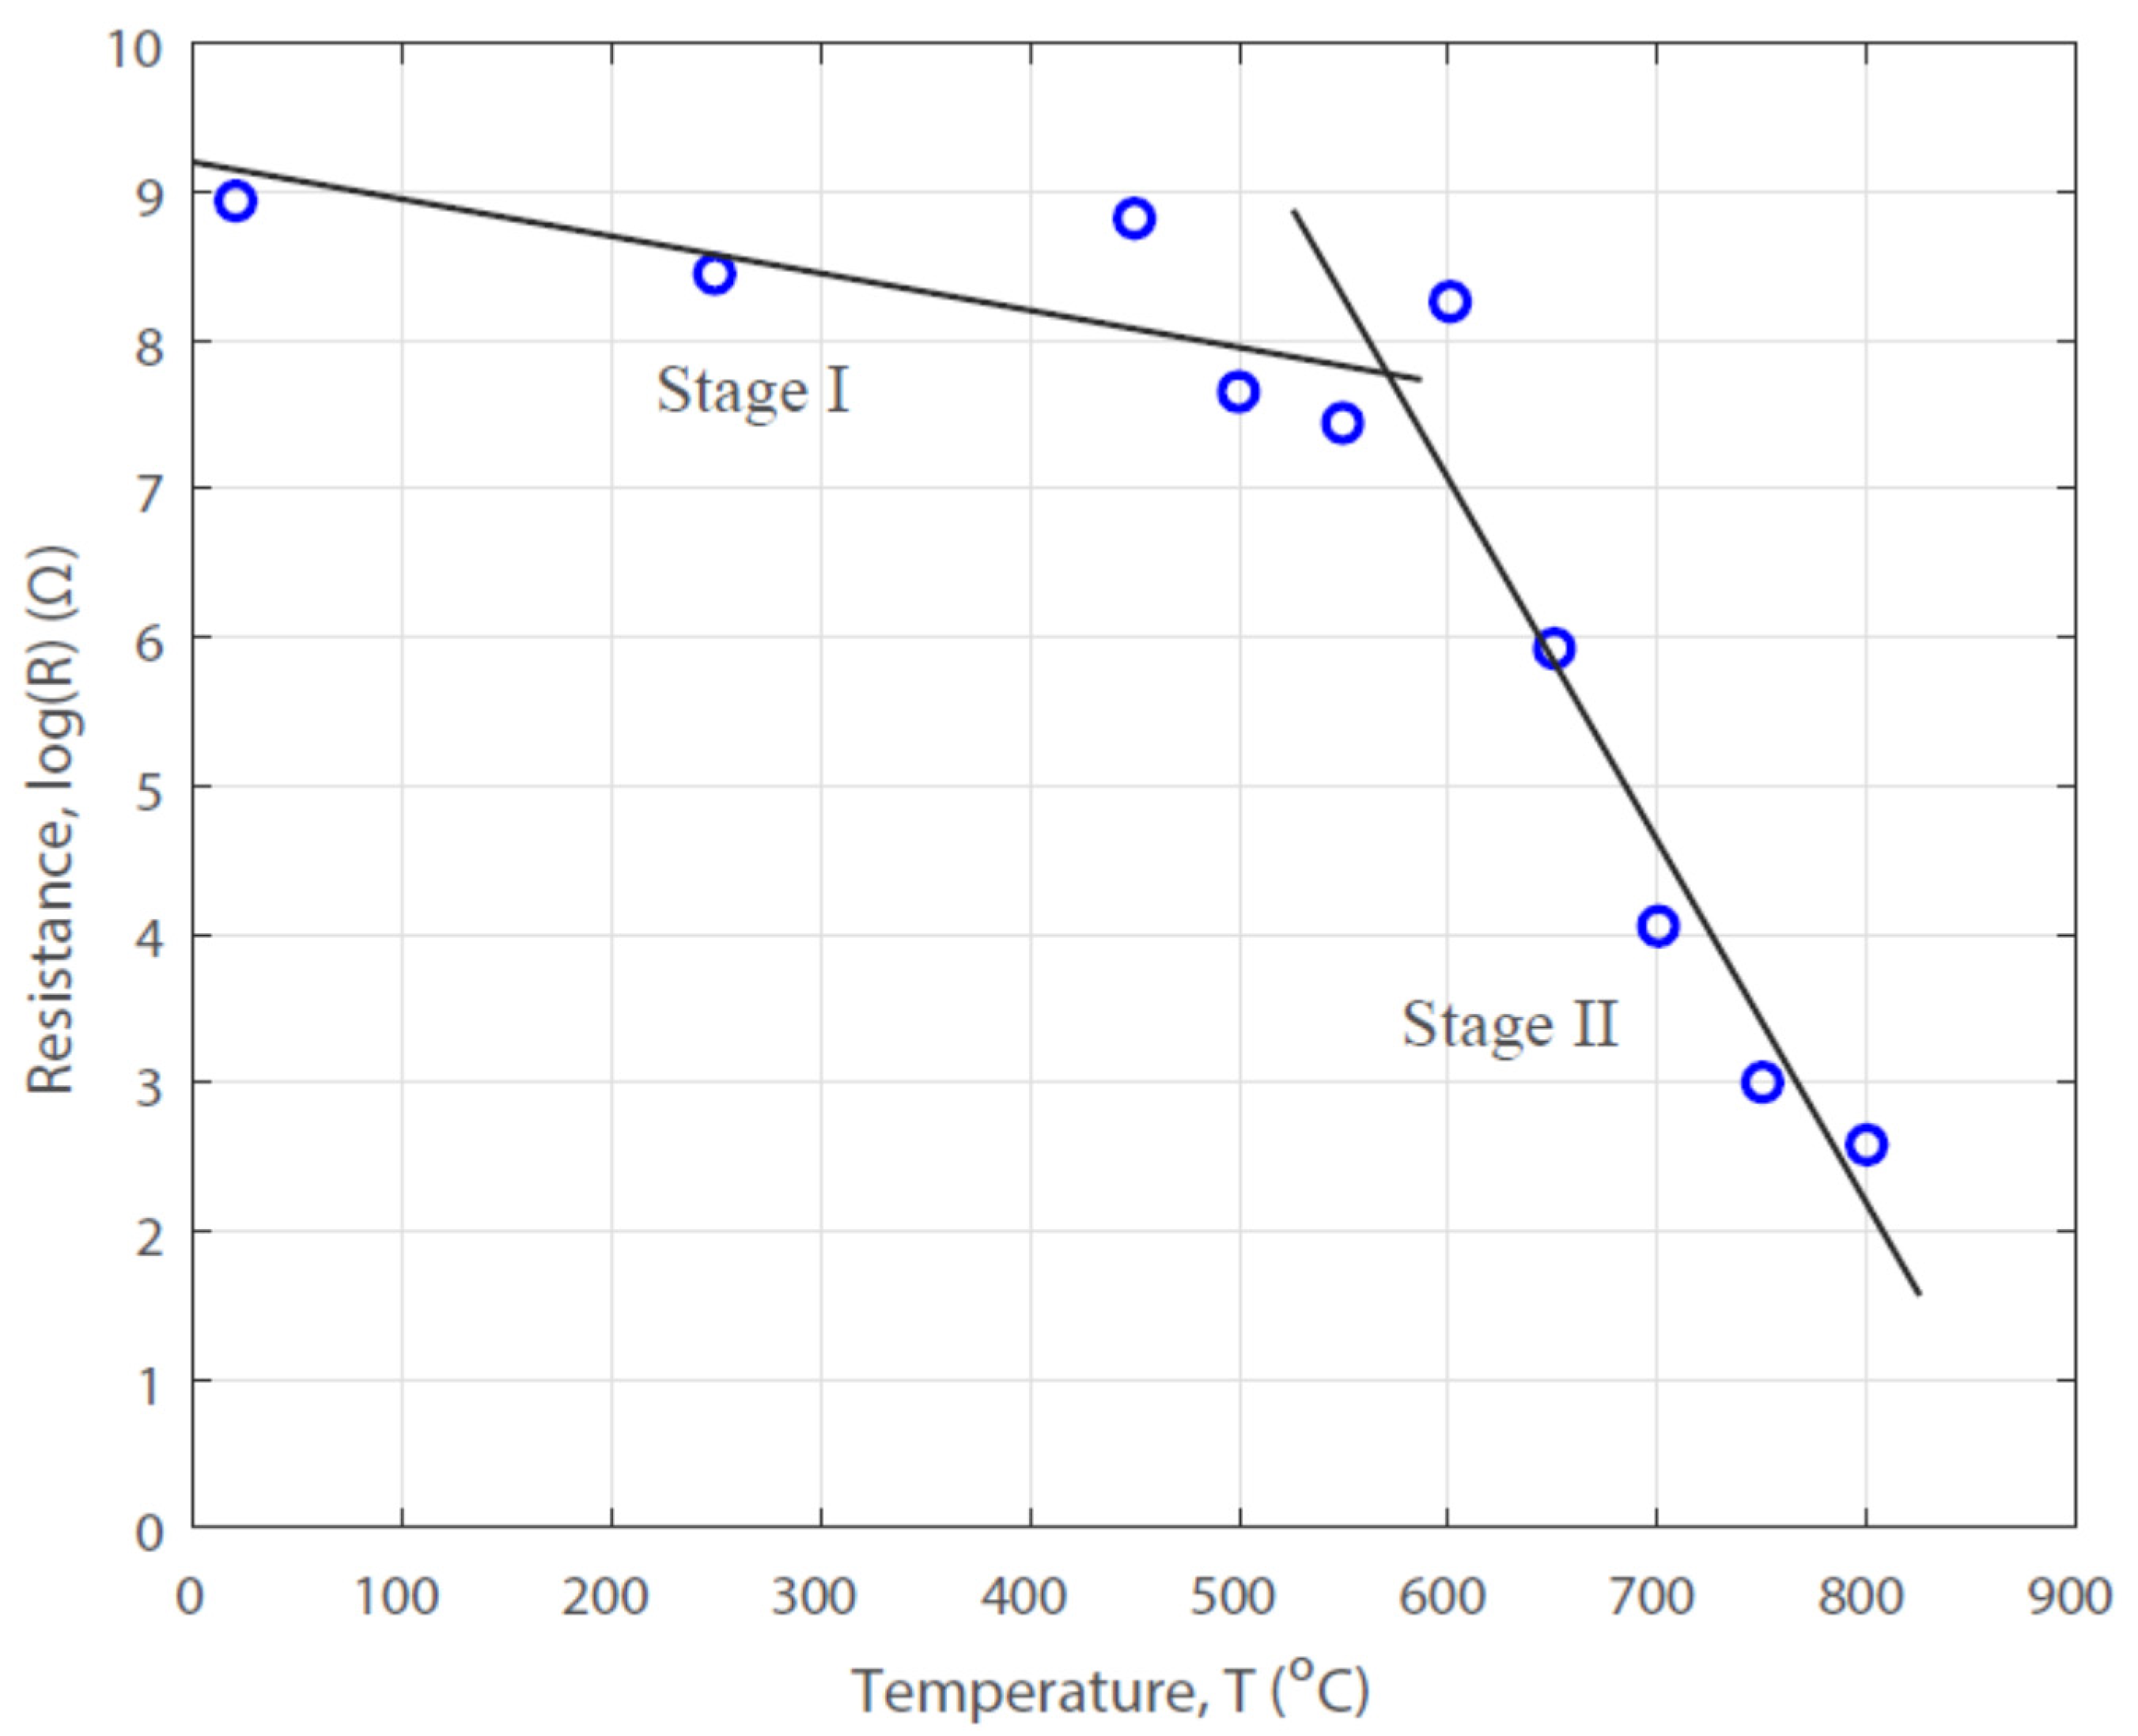
The I–V data obtained at various temperature conditions were processed for identifying the reaction mechanisms. First, the electrical resistance of the fiber, R, was calculated by V/I. Then the logarithmic values of R were obtained. By plotting log(R) vs. the temperature T, it is found that two straight lines can be obtained by linear fitting the data, indicating two stages of the pyrolysis reactions. By examining the curves as shown in Figure 6, we found that the first stage (Stage I as marked) corresponds to the temperature range from 20 °C up to 600 °C. In this stage, the polymer is condensed and release moieties such as H2O, N2, NH3, HCN, H2, etc. The linear molecule of PAN changes into a ring structure. The second stage (marked as Stage II) represents a change in the reaction mechanism. In this stage, carbonization is the main reaction because the temperature is high. There is a transition zone corresponding to the temperature range from 450 °C to 600 °C. The relation of log(R) vs. the temperature T in this temperature range is not strictly linear due to the change in the reaction mechanisms from oxidation control to carbonization control. Since multiple mechanisms exist in this transition zone, the carbonization is considered starting at 450 °C.
From the analysis of the results in Figure 6, it is clear that the carbonization of the fiber is essentially a thermally activated process. Therefore, the reaction should follow the well-known Arrhenius equation, i.e.,
σ σ o   =   e x p ( Q c k T )
where Qc is the activation energy for carbonization; σ is the conductance of the fiber at any selected temperature T; k is the Boltzmann constant; and σo is a material property related constant.
Taking log on both sides of Equation (1) and rearranging the terms yields
log ( σ )   =   Q c k T + l o g ( σ o )
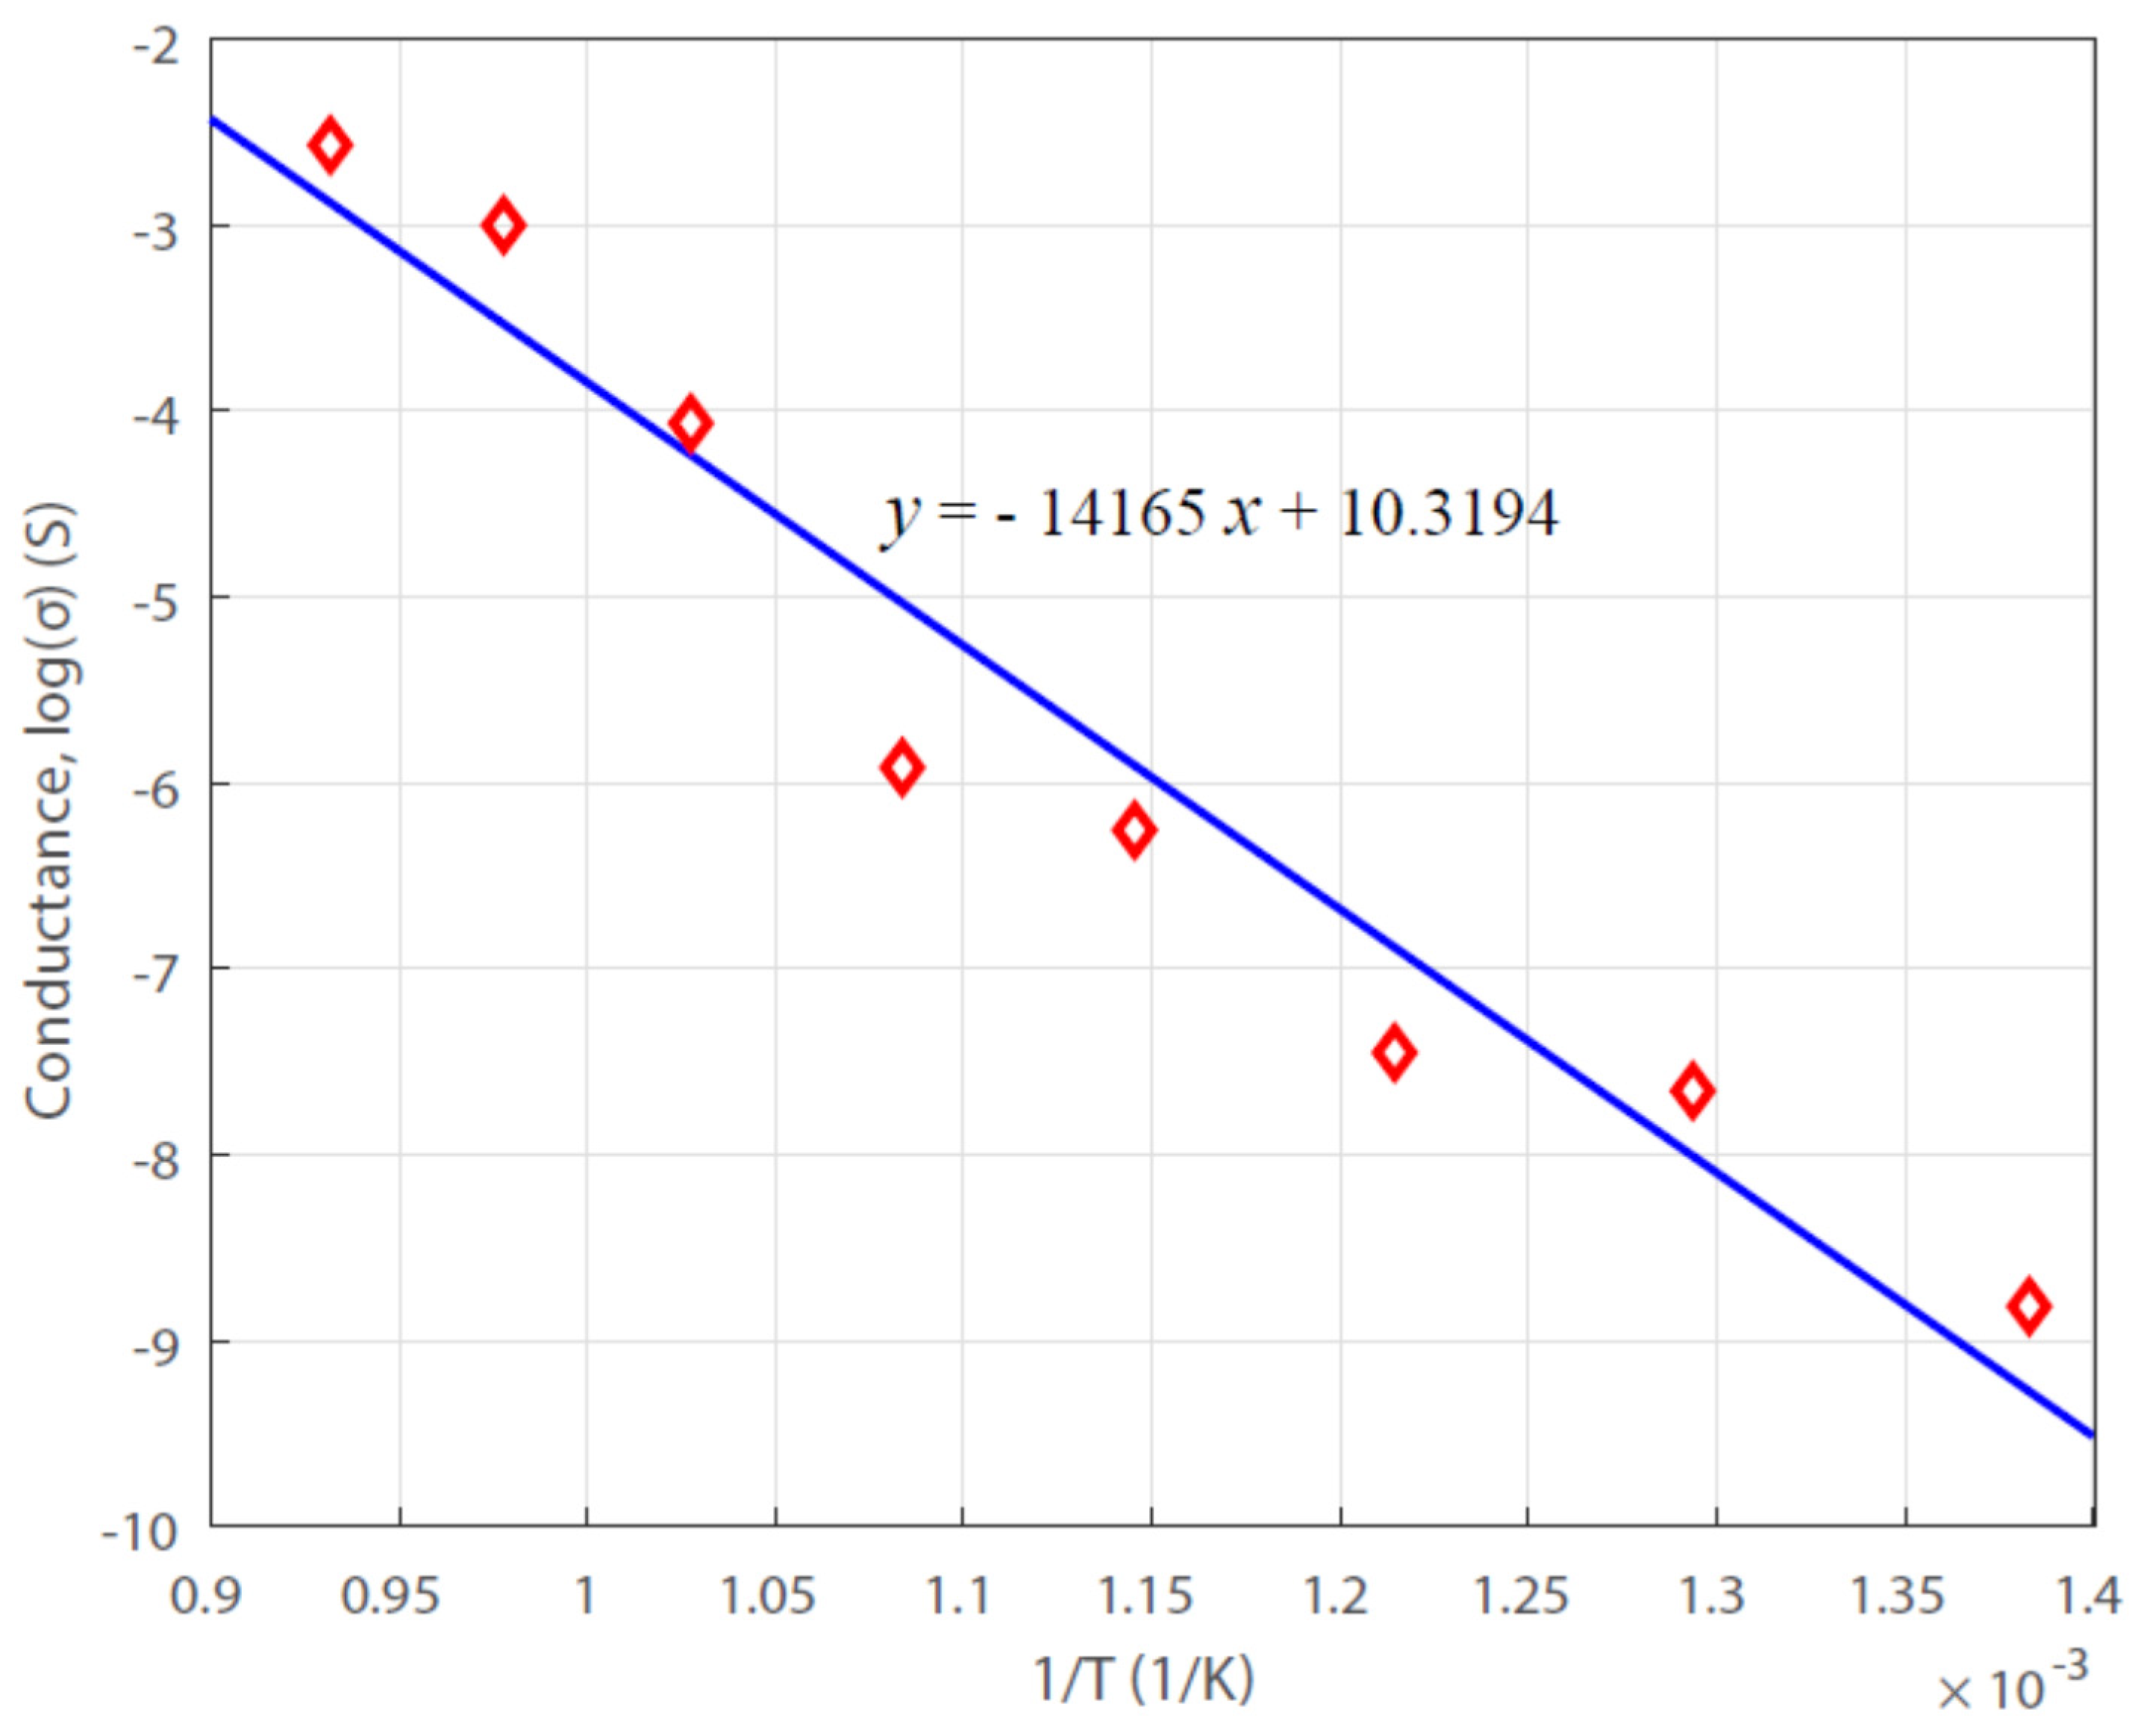
Equation (2) shows a straight line between log(σ) and 1/T. From the slope of the line, the activation energy can be determined. It is meaningful to examine the pyrolysis from the initiation of carbonization at 450 °C to the fast carbonization at 800 °C within the whole pyrolysis temperature range to understand the thermodynamics of the carbon fiber formation from polymers. Therefore, the data of logarithmic conductance, log(σ), and the reciprocal of temperature, 1/T, were presented in Figure 7. The data points can be fitted linearly and the line equation is shown on the plot. From the slope of the straight line, we can determine the activation energy value for the carbonization as 117.778 kJ/mol.

3.4. Photosensitive Property

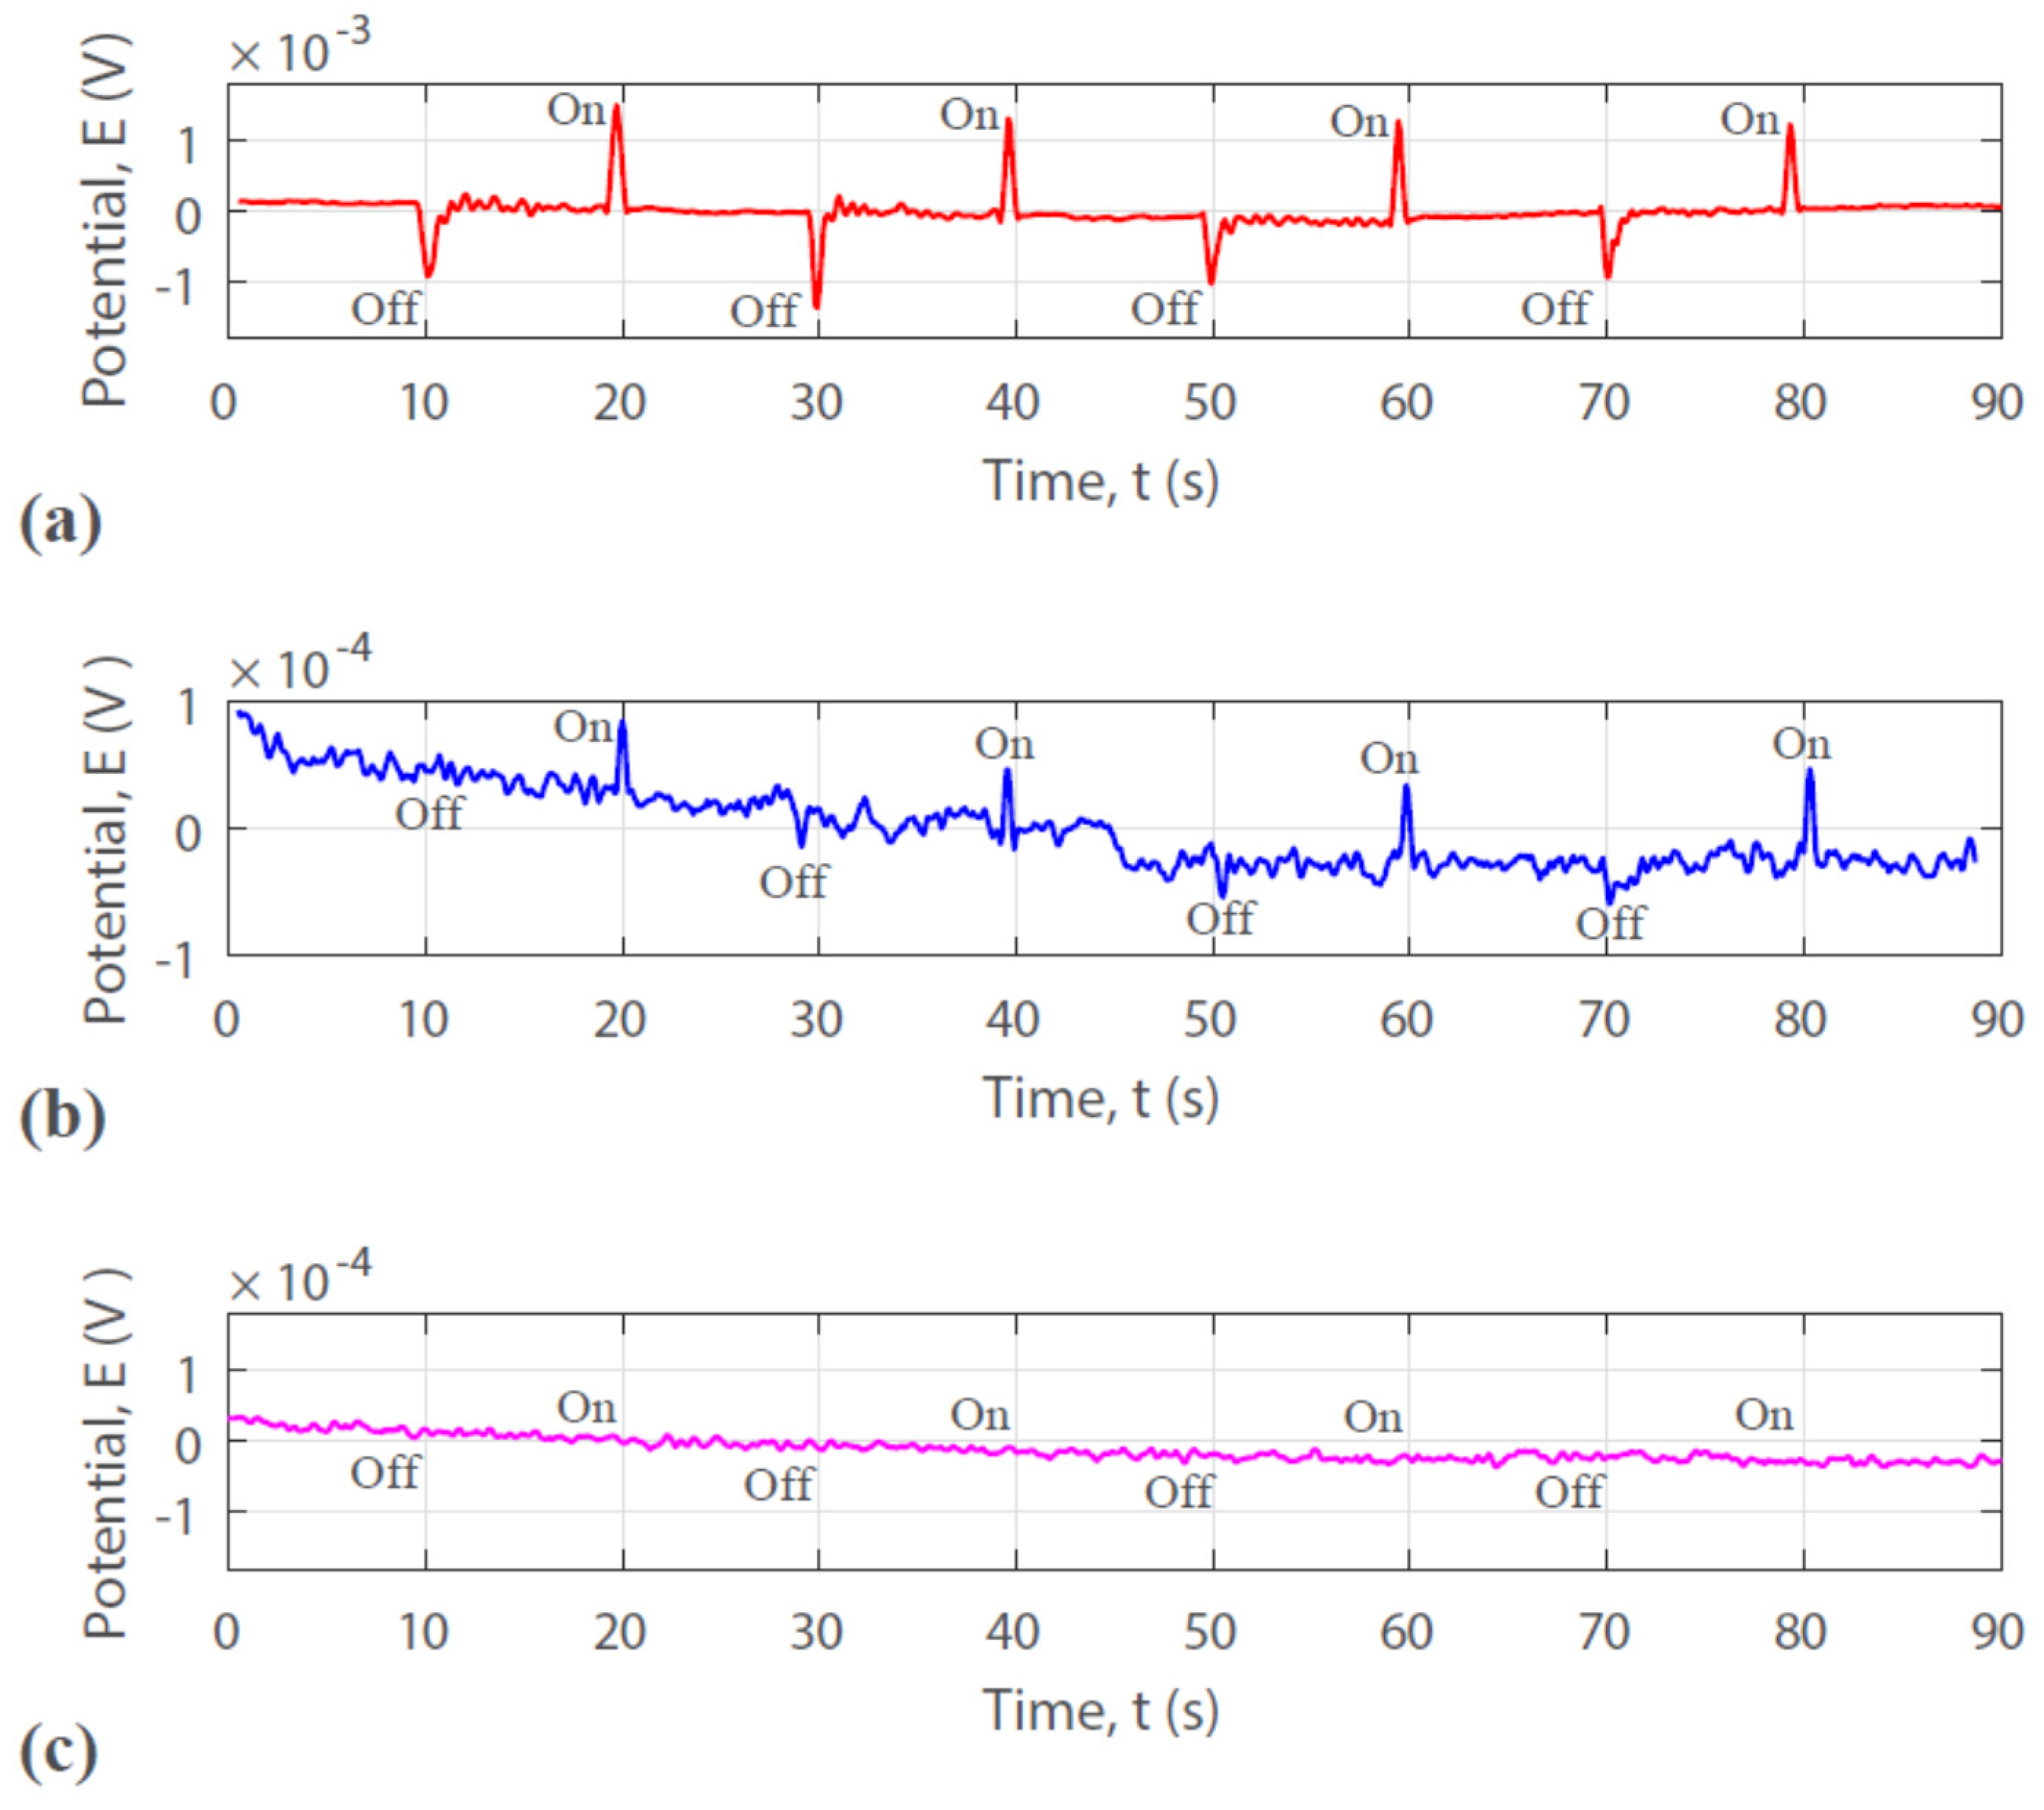
To illustrate the potential applications of the partially carbonized fiber, the photonic property of the fiber was examined. The semiconducting behavior of the fiber should allow the electron generation under photon energy excitation. Our experiment examined the response of the carbon-based fiber in relation to the turning on and off of a light source as shown in Figure 8a,b. The open circuit potential was recorded by the same three probe method using the same CHI6005E. The data collected from the specimen heat treated at 600 °C shown in Figure 8a reveals the behavior of a semiconducting fiber material when adjusting the electron dispersion onto the surface of the sample. The data were plotted to generate the graph as the open circuit potential, in volts, against the time, in seconds. The procedure consisted of allow light to shine down upon the sample for the first 10 s, then covered with a light blocking material 10 cm away from the surface of the material for the next 10 s, and so on.
The results in Figure 8a reveal the charge generation and electron–hole pair recombination behavior of a typical semiconducting material under the visible light illumination. As shown by earlier studies, the polymeric carbon obtained around 600 °C has the well-developed aromatic ring structure containing unsaturated bonds such as C=O and C=N as shown by the 1668 cm−1 peak on the FTIR absorbance spectra [22]. The conjugated nature of this structure allows localized electrons being excited by photon energy. As shown in Figure 8a, the sharp, vertical increases in potential is the reaction of the fiber to a suddenly ON of the light source. The light OFF period is characterized by a drop in the potential. Such a switching behavior should be very useful for developing flexible photon sensor. The photoelectric behavior is also applicable for the electricity generation by harvesting solar energy. With a higher heat treatment temperature of 650 °C, the FTIR signal at the 805 cm−1 peak goes down [22], indicating the decrease in the activities of the out-of-plane triazine rings. The in-plane electron mobility increases. This allows the fast recombination of the electron–hole pairs. Therefore, the photosensitivity of the carbonized fiber at this temperature as shown in Figure 8b dropped 10 times as compared with that of the fiber processed at 600 °C. At even higher temperature of 800 °C, it is reported that the formation of turbostratic carbon crystallites occurs [40]. The carbonization is pretty much completed and the carbonized structure starts reorganizing. Consequently, the electrical conductivity increased a lot (Figure 5). The photon-induced electrons can move freely in the material. Therefore, the photosensitivity disappeared as shown by the curve of Figure 8c.

3.5. Role of PMMA

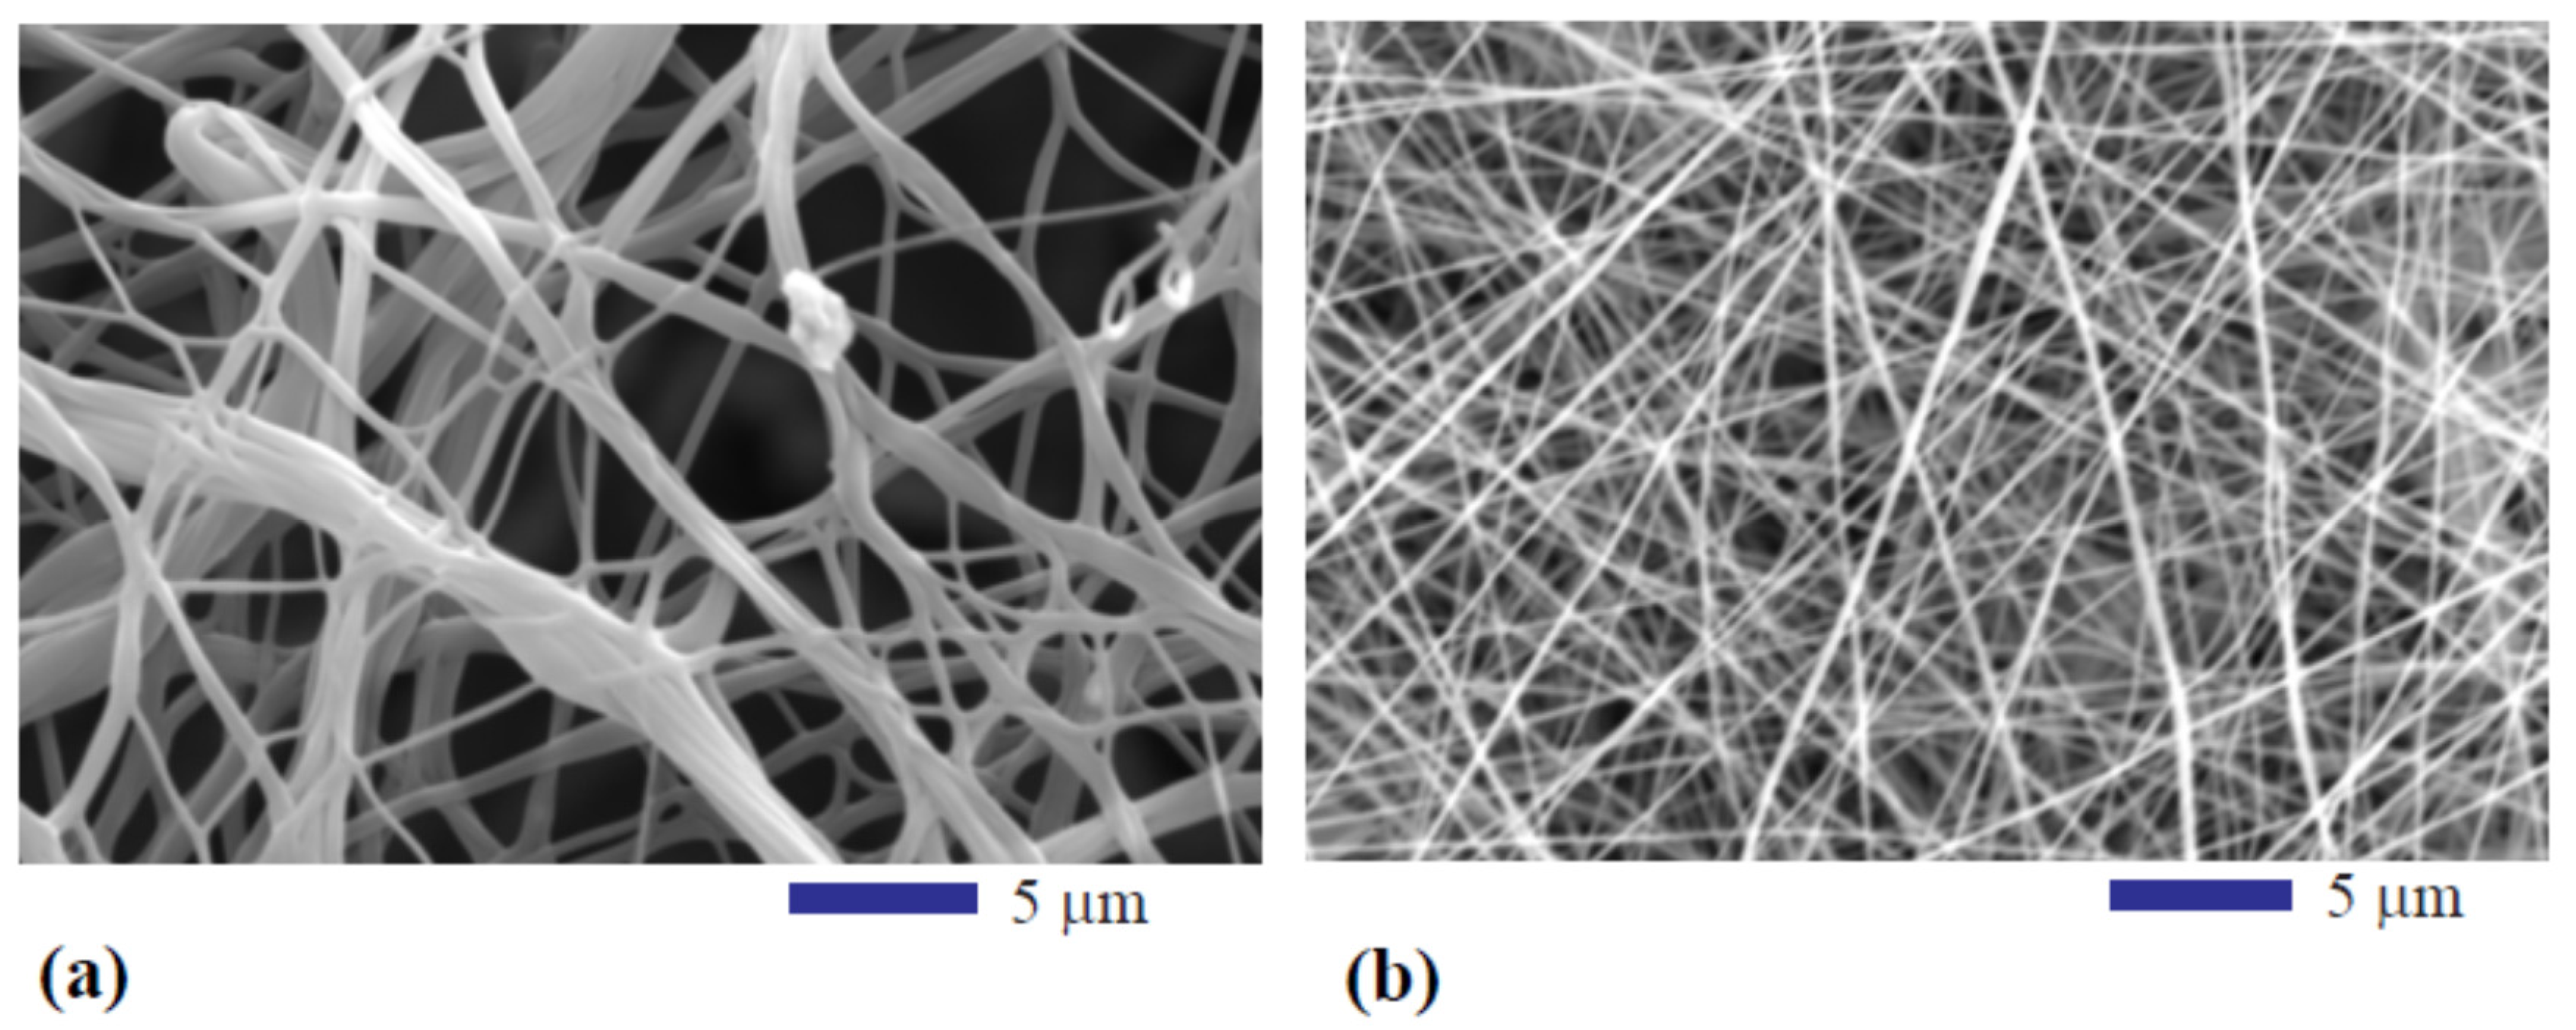
To examine the role of the polymer component PMMA in the fiber structure development during the electrospinning and the subsequent pyrolysis process, the same electrospinning parameters as described earlier in Section 2 were used to make PAN and PAN-PMMA fibers. Two solutions were made for the comparative studies. To obtain PAN polymer fiber, 0.5 g poly-acrylonitrile (PAN) polymer powder with the molecular weight of 150,000 was dissolved into 5 mL N,N-dimethylformamide (DMF). The PAN-PMMA blend solution consists of 0.25 g poly-acrylonitrile (PAN) and 0.25 g poly-methyl methacrylate (PMMA) in 5 mL N,N-dimethylformamide (DMF). The concentration of the total polymers in DMF was kept the same. After the PAN and PAN-PMMA fibers underwent heat treatment at 250 °C in air, high magnification (3000x) SEM images were taken from both types of fibers. Figure 9a is the image of the PAN-PMMA polymer blend fiber. Figure 9b shows the image of the PAN polymer fiber. Comparing the two images, we found that the size of the polymer blend is much bigger. The PAN polymer fiber is more uniform in size. It is also found that the surface of the polymer blend fiber is rougher; the fiber strands are connected to form a network structure.
The reason for such the difference in the morphology of the two types of fibers can be explained by the mass transport behavior of the polymers during the electrospinning process. Since PMMA and PAN are immiscible [35], the phase separation of PAN and PMMA happened. Under the action of the electric force during the electrospinning process, the PAN/PMMA interface is unstable because of the difference in the dielectric constants of PAN and PMMA [32]. The separation of PAN and PMMA can also promote the instability of the fiber/air interface. Consequently, the wavery interface formed and surface roughness developed. Trenches and grooves along the longitudinal direction of the PAN/PMMA fiber exist as shown by the large-sized filament in the lower left corner of Figure 9a. For the single polymer case, PAN solution has very good spinnability and the fast evaporation of the DMF allows the formation of the thin and uniform fiber filaments as illustrated in Figure 9b. In view of the high connectivity of PAN-PMMA nanofiber filaments, it is considered that the addition of PMMA can slow down the evaporation of the solvent DMF. Such a delay in the electrospinning makes the polymer blend still under stretching and splitting. Moreover, the surface of the fiber still kept wet when the fiber reached the target. Therefore, the collected fibers on the aluminum foil had the chance of sticking to each other and the network feature can be seen in Figure 9a. Upon carbonization, the connectivity of the fiber is helpful in forming continuous electron moving paths and improving the conductivity of the material.
Adding PMMA into the PAN solution also influences the carbonization process. As mentioned before in early studies, PMMA is a thermally decomposable polymer [34]. It completely decomposes at temperatures between 250 °C and 400 °C. The controlled removal of PMMA from PAN in the carbonization process can generate porous and core–shell nanostructures. Such nanostructures increase the adsorption capability of the fiber due to the high surface area for Li storage [37].

4. Conclusions

The temperature effects on the morphology, conductive behavior, and photosensitivity of a PAN-PMMA polymer derived carbon fiber were studied and the following concluding remarks can be made.
The addition of PMMA into PAN changes the electrospun fiber morphology by promoting the fiber filament connectivity and increasing the size of the fiber. The phase separation of PAN and PMMA causes the instability of the PAN/PMMA and polymer/air interfaces, which allows the development of fiber surface roughness.
From just oxidized state (250 °C) to the moderate carbonized state (650 °C), the size of the fiber reduced by more than 50% due to the structure change of the fiber. The higher the pyrolysis temperature, the more conductive of the fiber. Two stages of pyrolysis reactions were observed. At low to medium temperatures, the fiber undergoes oxidation and structure stabilization (Stage I). The polymer fiber starts carbonization at 450 °C. At a higher temperature, the pyrolysis entered Stage II, which is carbonization controlled. The carbonization reaction follows the Arrhenius law in the temperature range from 450 °C to 800 °C. In this temperature range, the activation energy for the carbonization reaction is determined as 118 kJ/mol.
Carbon-based nanofiber heat treated below 650 °C is highly sensitive to the presence of visible light. The graph of the open circuit potential versus time revealed an increase in voltage for the light ON phase and a decrease of voltage for the light OFF state, displaying the typical electron-hole pair generation and recombination characteristics. With the increasing pyrolysis temperature, the photosensitivity of the treated fiber changes. The polymeric carbon fiber obtained around 600 °C shows the best photonic response, which is due to the well-developed aromatic ring structure generated by pyrolysis. The conjugated structure allows localized electrons being excited effectively by photon energy. Therefore, optical switching behavior is established. At a higher heat treatment temperature of 650 °C, the decrease in the activities of the out-of-plane triazine rings leads to the in-plane electron mobility, which allows the fast recombination of the electron-hole pairs. Therefore, the photosensitivity of the carbonized fiber at this temperature is reduced 10-fold. At an even higher temperature of 800 °C, the completion of carbonization allows the photon induced electrons to move freely in the material. Therefore, the photosensitivity does not exist if the pyrolysis temperature is too high. The carbon-based nanofiber heat treated below 650 °C shows potential for usage as a sensor material due to its easily adjustable shape and high sensitivity along with its relatively cheap cost for production. The PAN-PMMA derived carbon fiber may also find application for electricity generation due to the demonstrated photovoltaic property.

Author Contributions

Data curation, T.X., A.N., I.F., N.R., C.C., J.B.G., A.S.H. and Y.X.G.; Formal analysis, T.X., A.N., I.F., J.B.G. and Y.X.G.; Funding acquisition, Y.X.G.; Investigation, T.X, A.N., I.F., N.R. and Y.X.G.; Methodology, Y.X.G.; Project administration, Y.X.G.; Resources, Y.X.G.; Supervision, Y.X.G.; Writing—original draft, T.X. and A.N.; Writing—review and editing, Y.X.G.

Funding

This research was funded in part by NSF, grant number CMMI-1333044. The SEM images were made possible through the NSF MRI grant DMR-1429674.

Acknowledgments

Y.X.G. acknowledges the California State Polytechnic University Pomona 2018–2019 Provost’s Teacher-Scholar support and the 2018–2019 Research, Scholarship, and Creative Activities (RSCA) Program funding support. I.F. acknowledges the summer support from the Cypress College STEM2 Program, co-managed by Yanet Garcia and Winny Dong, Directors for the Student Undergraduate Research Experience Program. A.N. and N.R. were supported by the Citrus College Undergraduate Research Experience Program.

Conflicts of Interest

The authors declare no conflict of interest.

References

  1. Ji, S.; Park, J.; Jo, Y.; Kim, Y.-B.; Jang, J.; Kim, S.-K.; Jeong, S.; Park, J.-U. Haze-free transparent electrodes using metal nanofibers with carbon shells for high-temperature stability. Appl. Surf. Sci. 2019, 483, 1101–1109. [Google Scholar] [CrossRef]
  2. Sun, X.; Li, C.; Bai, J. Amorphous cobalt carbon nanofibers decorated with conductive Ag as free-standing flexible electrode material for high-performance supercapacitors. J. Electron. Mater. 2019, 48, 2754–2760. [Google Scholar] [CrossRef]
  3. Ravindren, R.; Mondal, S.; Nath, K.; Das, N.C. Prediction of electrical conductivity, double percolation limit and electromagnetic interference shielding effectiveness of copper nanowire filled flexible polymer blend nanocomposites. Compos. Part B Eng. 2019, 164, 559–569. [Google Scholar] [CrossRef]
  4. Liu, J.; Liang, Y.; Wang, L.; Wang, B.; Zhang, T.; Yi, F. Fabrication and photosensitivity of CdS photoresistor on silica nanopillars substrate. Mater. Sci. Semicond. Process. 2016, 56, 217–221. [Google Scholar] [CrossRef]
  5. Gan, Y.X.; Yu, C.; Panahi, N.; Gan, J.B.; Cheng, W. Processing iron oxide nanoparticle-loaded composite carbon fiber and the photosensitivity characterization. Fibers 2019, 7, 25. [Google Scholar] [CrossRef]
  6. Su, L.; Gan, Y.X. Experimental study on synthesizing TiO2 nanotube/polyaniline (PANI) nanocomposites and their thermoelectric and photosensitive property characterization. Compos. Part B Eng. 2012, 43, 170–182. [Google Scholar] [CrossRef]
  7. Yang, Z.; Xu, J.; Wang, J.; Zhang, Q.; Zhang, B. Design and preparation of self-driven BSA surface imprinted tubular carbon nanofibers and their specific adsorption performance. Chem. Eng. J. 2019, 373, 923–934. [Google Scholar] [CrossRef]
  8. Zhu, M.; Wang, Y.; Long, L.; Fu, X.; Sui, G.; Yang, X. An optimal carbon fiber interlayer integrated with bio-based gel polymer electrolyte enabling trapping-diffusion-conversion of polysulfides in lithium-sulfur batteries. Chem. Eng. J. 2019, 370, 1068–1076. [Google Scholar] [CrossRef]
  9. Zhou, Y.; Zhou, X.; Ge, C.; Zhou, W.; Zhu, Y.; Xu, B. Branched carbon nanotube/carbon nanofiber composite for supercapacitor electrodes. Mater. Lett. 2019, 246, 174–177. [Google Scholar] [CrossRef]
  10. Ju, J.; Lv, Y.; An, X.; Liu, W.; Li, Z.; Kang, W.; Cheng, B. The stereoscopic honeycomb-like porous carbon nanofibers as a carrier of TiO2 nanoparticles for high-performance Li-ion capacitor. J. Alloys Compd. 2019, 791, 1248–1256. [Google Scholar] [CrossRef]
  11. Bian, Z.; Yuan, T.; Xu, Y.; Pang, Y.; Yao, H.; Li, J.; Yang, J.; Zheng, S. Boosting Li–S battery by rational design of freestanding cathode with enriched anchoring and catalytic N-sites carbonaceous host. Carbon 2019, 150, 216–223. [Google Scholar] [CrossRef]
  12. Gan, Y.X.; Dong, J.; Gan, J.B. Carbon network/aluminum composite made by powder metallurgy and its corrosion behavior in seawater. Mater. Chem. Phys. 2017, 202, 190–196. [Google Scholar] [CrossRef]
  13. Gan, Y.X.; Draper, C.W.; Gan, J.B. Carbon nanofiber network made by electrohydrodynamic casting immiscible fluids. Mater. Today Commun. 2017, 13, 248–254. [Google Scholar] [CrossRef]
  14. Niu, Q.; Zhao, S.; Gao, K.; Wang, L. Polyacrylonitrile-based nitrogen-doped carbon materials with different micro-morphology prepared by electrostatic field for supercapacitors. J. Electron. Mater. 2019, 48, 5264–5272. [Google Scholar] [CrossRef]
  15. Zhao, J.; Wen, X.; Xu, H.; Wen, Y.; Lu, H.; Meng, X. Salting-out and salting-in of protein: A novel approach toward fabrication of hierarchical porous carbon for energy storage application. J. Alloys Compd. 2019, 788, 397–406. [Google Scholar] [CrossRef]
  16. Ho, D.H.; Cheon, S.; Hong, P.; Park, J.H.; Suk, J.W.; Kim, D.H.; Han, J.T.; Cho, J.H. Multifunctional smart textronics with blow-spun nonwoven fabrics. Adv. Funct. Mater. 2019, 29, 1900025. [Google Scholar] [CrossRef]
  17. Pitkänen, O.; Tolvanen, J.; Szenti, I.; Kukovecz, Á.; Hannu, J.; Jantunen, H.; Kordás, K. Lightweight hierarchical carbon nanocomposites with highly efficient and tunable electromagnetic interference shielding properties. ACS Appl. Mater. Interfaces 2019, 11, 19331–19338. [Google Scholar] [CrossRef]
  18. Ren, H.; Zheng, L.; Wang, G.; Gao, X.; Tan, Z.; Shan, J.; Cui, L.; Li, K.; Jian, M.; Zhu, L.; et al. Transfer-medium-free nanofiber-reinforced graphene film and applications in wearable transparent pressure sensors. ACS Nano 2019, 13, 5541–5548. [Google Scholar] [CrossRef]
  19. Wang, L.; Chen, Y.; Lin, L.; Wang, H.; Huang, X.; Xue, H.; Gao, J. Highly stretchable, anti-corrosive and wearable strain sensors based on the PDMS/CNTs decorated elastomer nanofiber composite. Chem. Eng. J. 2019, 362, 89–98. [Google Scholar] [CrossRef]
  20. Li, Y.; Wang, H.; Wang, L.; Mao, Z.; Wang, R.; He, B.; Gong, Y.; Hu, X. Mesopore-induced ultrafast Na+-Storage in T-Nb2O5/carbon nanofiber films toward flexible high-power Na-ion capacitors. Small 2019, 15, 1804539. [Google Scholar] [CrossRef]
  21. Serdaroğlu, D.Ç.; Korkusuz, H.K.; Karakaya, M.; Donmez, I.; Ünal, M.A.; Gunasekaran, S. Nanoparticle embedded nanofiber synthesis and evaluation of usability on biomedical applications. MRS Adv. 2018, 3, 233–240. [Google Scholar] [CrossRef]
  22. Cipriani, E.; Zanetti, M.; Bracco, P.; Brunella, V.; Luda, M.P.; Costa, L. Crosslinking and carbonization processes in PAN films and nanofibers. Polym. Degrad. Stab. 2016, 123, 178–188. [Google Scholar] [CrossRef]
  23. Schierholz, R.; Kröger, D.; Weinrich, H.; Gehring, M.; Tempel, H.; Kungl, H.; Mayer, J.; Eichel, R.-A. The carbonization of polyacrylonitrile-derived electrospun carbon nanofibers studied by in situ transmission electron microscopy. RSC Adv. 2019, 9, 6267–6277. [Google Scholar] [CrossRef]
  24. Alarifi, I.M.; Khan, W.S.; Asmatulu, R. Synthesis of electrospun polyacrylonitrile- derived carbon fibers and comparison of properties with bulk form. PLoS ONE 2018, 13, e0201345. [Google Scholar] [CrossRef]
  25. Alarifi, I.M.; Alharbi, A.; Khan, W.S.; Rahman, A.S.; Asmatulu, R. Mechanical and thermal properties of carbonized PAN nanofibers cohesively attached to surface of carbon fiber reinforced composites. Macromol. Symp. 2016, 365, 140–150. [Google Scholar] [CrossRef]
  26. Ghorpade, R.V.; Cho, D.W.; Hong, S.C. Effect of controlled tacticity of polyacrylonitrile (co)polymers on their thermal oxidative stabilization behaviors and the properties of resulting carbon films. Carbon 2017, 121, 502–511. [Google Scholar] [CrossRef]
  27. Hameed, N.; Sharp, J.; Nunna, S.; Creighton, C.; Magniez, K.; Jyotishkumar, P.; Salim, N.V.; Fox, B. Structural transformation of polyacrylonitrile fibers during stabilization and low temperature carbonization. Polym. Degrad. Stab. 2016, 128, 39–45. [Google Scholar] [CrossRef]
  28. Jing, M.; Wang, C.G.; Wang, Q.; Bai, Y.; Zhu, B. Chemical structure evolution and mechanism during pre-carbonization of PAN-based stabilized fiber in the temperature range of 350–600 °C. Polym. Degrad. Stab. 2007, 92, 1737–1742. [Google Scholar] [CrossRef]
  29. Zhang, Y.; Tajaddod, N.; Song, K.; Minus, M.L. Low temperature graphitization of interphase polyacrylonitrile (PAN). Carbon 2015, 91, 479–493. [Google Scholar] [CrossRef] [Green Version]
  30. Chai, X.; Mi, H.; Zhu, C.; He, C.; Xu, J.; Zhou, X.; Liu, J. Low-temperature thermal stabilization of polyacrylontrile-based precursor fibers towards efficient preparation of carbon fibers with improved mechanical properties. Polymer 2015, 76, 131–139. [Google Scholar] [CrossRef]
  31. Korobeinyk, A.V.; Whitby, R.L.; Mikhalovsky, S.V. High temperature oxidative resistance of polyacrylonitrile-methylmethacrylate copolymer powder converting to a carbonized monolith. Eur. Polym. J. 2012, 48, 97–104. [Google Scholar] [CrossRef]
  32. Joo, S.; Park, J.Y.; Seo, S.; Moon, S.; Lee, K.J.; An, J.; Lee, C.-S.; Bae, J. Study on peculiar carbon pattern formation from polymer blend thin films under electric fields. Thin Solid Films 2018, 660, 846–851. [Google Scholar] [CrossRef]
  33. Sinha-Ray, S.; Yarin, A.; Pourdeyhimi, B. The production of 100/400 nm inner/outer diameter carbon tubes by solution blowing and carbonization of core-shell nanofibers. Carbon 2010, 48, 3575–3578. [Google Scholar] [CrossRef]
  34. Yang, G.-Z.; Xu, R.-S.; Chen, M.; Wang, X.; Ling, L.-C.; Zhang, R.; Yang, J.-H. Hollow carbon nanospheres prepared by carbonizing polymethylmethacrylate/polyacrylonitrile core/shell polymer particles. New Carbon Mater. 2008, 23, 205–208. [Google Scholar] [CrossRef]
  35. Li, Y.; Zhu, J.; Zhu, P.; Yan, C.; Jia, H.; Kiyak, Y.; Zang, J.; He, J.; Dirican, M.; Zhang, X. Glass fiber separator coated by porous carbon nanofiber derived from immiscible PAN/PMMA for high-performance lithium-sulfur batteries. J. Membr. Sci. 2018, 552, 31–42. [Google Scholar] [CrossRef]
  36. Gong, J.; Chen, X.; Tang, T. Recent progress in controlled carbonization of (waste) polymers. Prog. Polym. Sci. 2019, 94, 1–32. [Google Scholar] [CrossRef]
  37. Rao, M.; Geng, X.; Liao, Y.; Hu, S.; Li, W. Preparation and performance of gel polymer electrolyte based on electrospun polymer membrane and ionic liquid for lithium ion battery. J. Membr. Sci. 2012, 399, 37–42. [Google Scholar] [CrossRef]
  38. Nataraj, S.; Yang, K.; Aminabhavi, T. Polyacrylonitrile-based nanofibers—A state-of-the-art review. Prog. Polym. Sci. 2012, 37, 487–513. [Google Scholar] [CrossRef]
  39. Liu, W.; Wang, W.; Xing, Z.; Qi, Y.; Wu, G. Radiation-induced crosslinking of polyacrylonitrile fibers and the subsequent regulative effect on the peroxidation process. Radiat. Phys. Chem. 2012, 81, 622–627. [Google Scholar] [CrossRef]
  40. Arshad, S.N.; Naraghi, M.; Chasiotis, I. Strong carbon nanofibers from electrospun polyacrylonitrile. Carbon 2011, 49, 1710–1719. [Google Scholar] [CrossRef]
  41. Lin, S.; Cai, Q.; Ji, J.; Sui, G.; Yu, Y.; Yang, X.; Ma, Q.; Wei, Y.; Deng, X. Electrospun nanofiber reinforced and toughened composites through in situ nano-interface formation. Compos. Sci. Technol. 2008, 68, 3322–3329. [Google Scholar] [CrossRef]
  42. Xue, T.J.; McKinney, M.A.; Wilkie, C.A. The thermal degradation of polyacrylonitrile. Polym. Degrad. Stab. 1997, 58, 193–202. [Google Scholar] [CrossRef]
  43. Callister, W.D., Jr.; Rethwisch, D.G. Materials Science and Engineering: An Introduction; John Wiley & Sons Inc.: Hoboken, NJ, USA, 2014; pp. 725–777. [Google Scholar]
  44. Shackelford, J.F. Introduction to Materials Science for Engineers; Pearson Prentice Hall: Upper Saddle River, NJ, USA, 2009; pp. 451–452. [Google Scholar]
  45. Mangonon, P.L. The Principles of Materials Selection for Engineering Design; Pearson Prentice Hall: Upper Saddle River, NJ, USA, 1999; pp. 109–117. [Google Scholar]
  46. Askeland, D.R.; Wright, W.J. Essentials of Materials Science and Engineering; Cengage Learning: Stamford, CT, USA, 2014; pp. 47–48. [Google Scholar]
  47. Zeng, W.R.; Li, S.F.; Chow, W.K. Preliminary studies on burning behavior of polymerthylmethacrylate (PMMA). J. Fire Sci. 2002, 20, 297–317. [Google Scholar] [CrossRef]
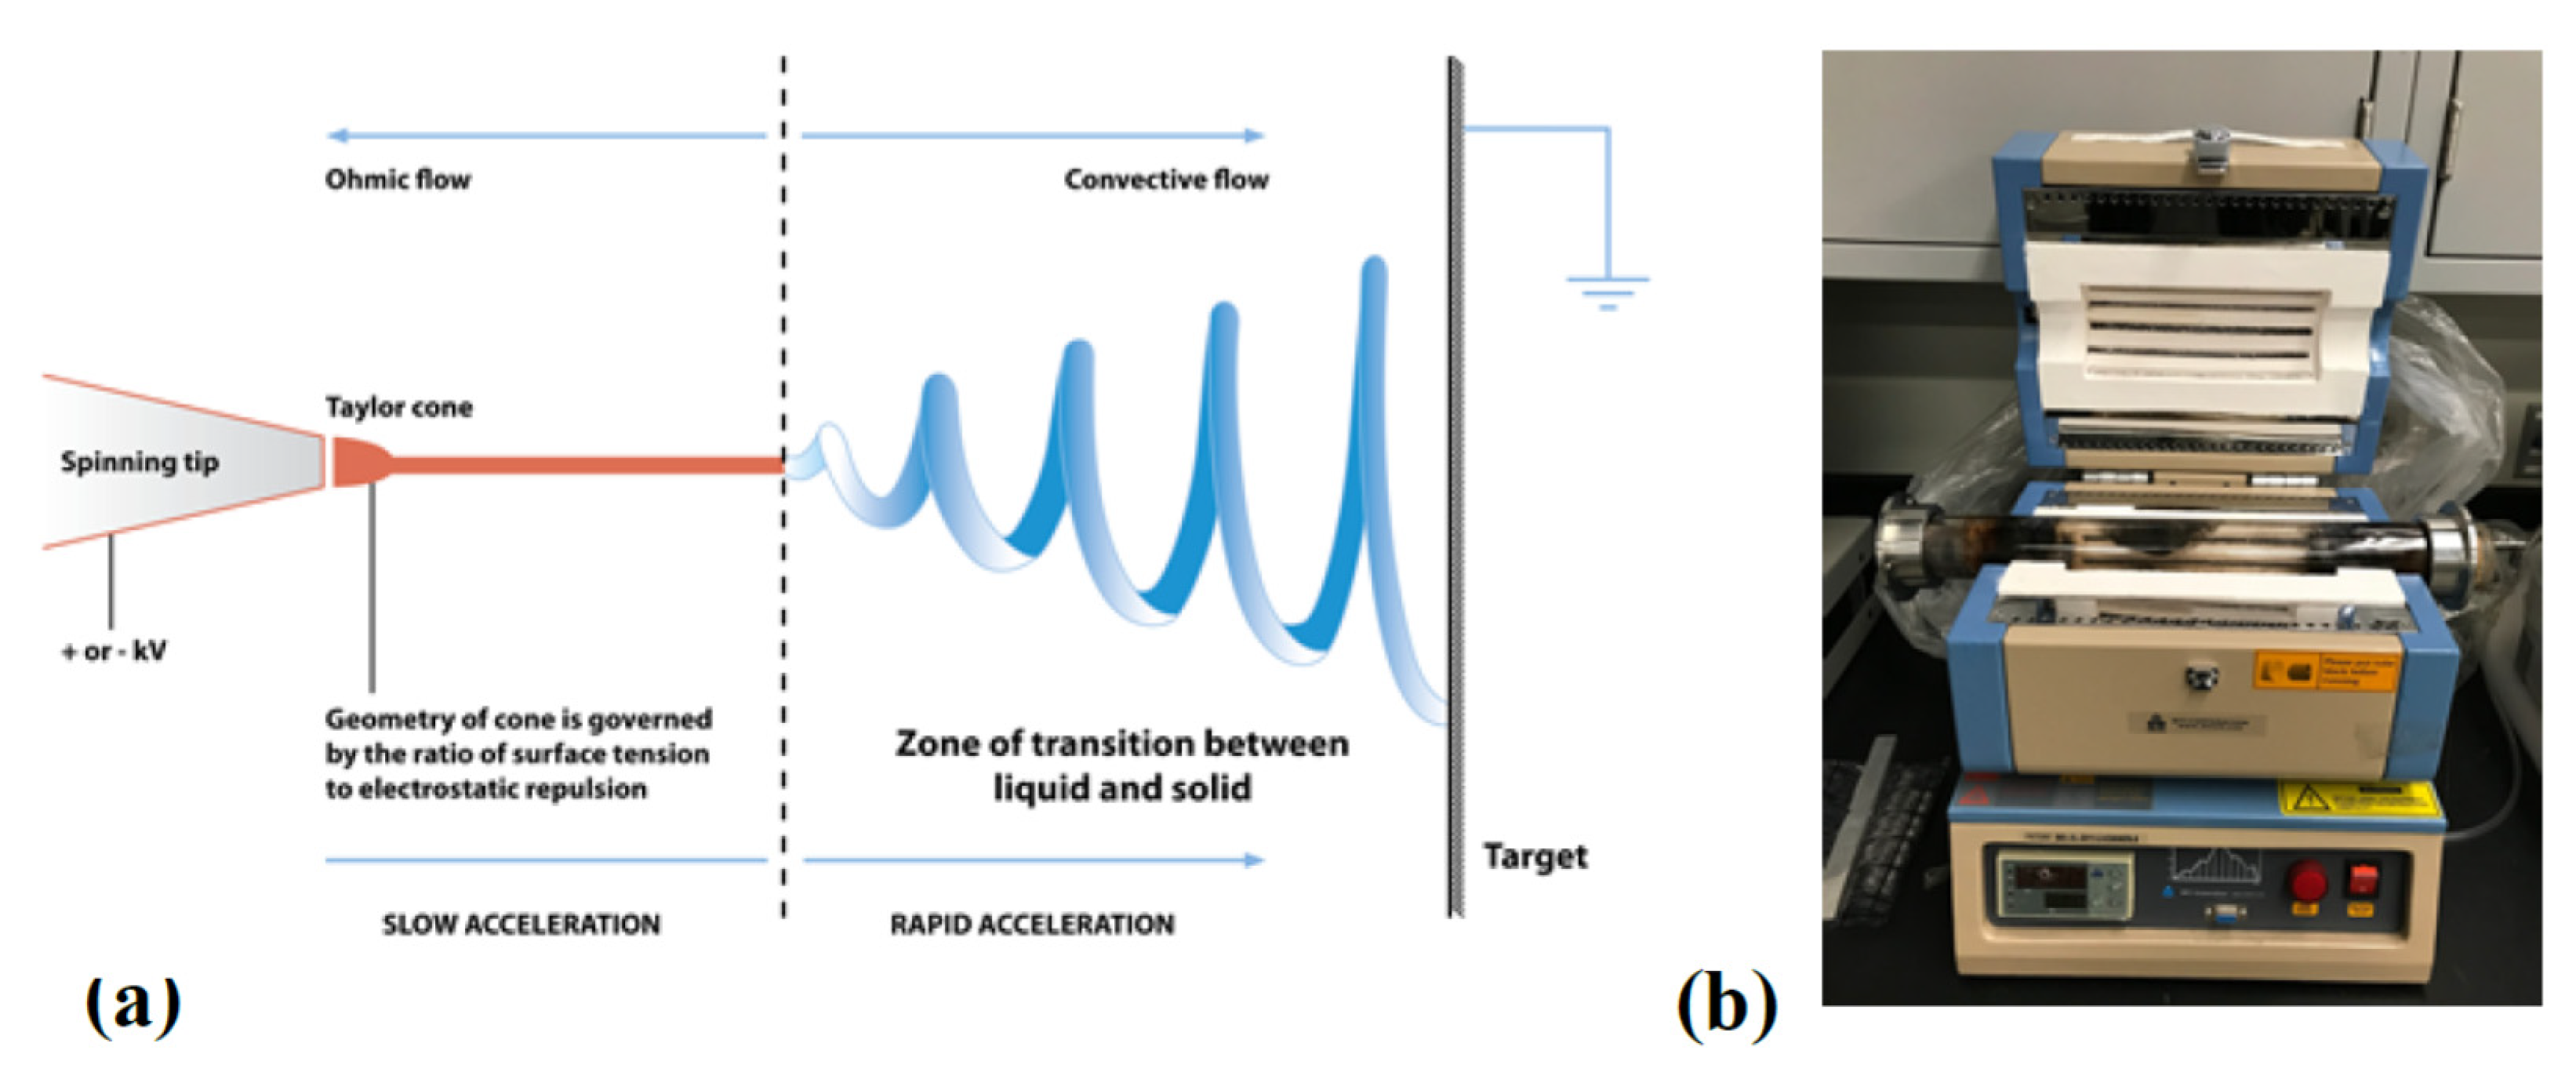
Figure 1. Fiber processing and pyrolysis instrumentation set-up: (a) electrospinning illustration; (b) heat treatment furnace.
Chemengineering 03 00086 g001
Figure 2. SEM images showing: (a) the oxidized fiber heat treated at 250 °C; (b) the carbonized fiber heat treated at 450 °C; (c) the carbonized fiber heat treated at 600 °C; (d) the carbonized fiber heat treated at 650 °C.
Chemengineering 03 00086 g002
Figure 3. I–V plots for the as-spun polymer fiber (at 20 °C) and the oxidized fiber (at 250 °C).
Chemengineering 03 00086 g003
Figure 4. I–V relationship for specimens heat treated at 450 °C, 500 °C, 550 °C, and 600 °C revealing the conductance closes to that of an intrinsic semiconducting material such as Ge or Si.
Chemengineering 03 00086 g004
Figure 5. Electrical conductive measurement results of the carbon fiber heat treated at 650 °C, 700 °C, 750 °C, and 800 °C showing the transition of the fiber from semiconductor to a conductor.
Chemengineering 03 00086 g005
Figure 6. Logarithmic resistance vs. temperature showing two different stages of pyrolysis kinetics.
Chemengineering 03 00086 g006
Figure 7. Resistance map showing different stages of pyrolysis kinetics.
Chemengineering 03 00086 g007
Figure 8. Open circuit potential vs. time showing the photosensitivity of the carbon fiber being treated at (a) 600 °C, (b) 650 °C, and (c) 800 °C.
Chemengineering 03 00086 g008
Figure 9. High magnification SEM images of: (a) the PAN-PMMA polymer blend fiber oxidized and stabilized at 250 °C; (b) the PAN fiber oxidized and stabilized at 250 °C.
Chemengineering 03 00086 g009