Article

An Engineering Toolbox for the Evaluation of Metallic Flow Field Plates

1
Forschungszentrum Jülich GmbH, IEK-3: Electrochemical Process Engineering, 52425 Jülich, Germany
2
Borit NV, 2440 Geel, Belgium
3
HyET Hydrogen B.V., 6827 AV Arnhem, The Netherlands
4
Mechanical and Materials Engineering, Queen’s University, Kingston, ON K7L 3N6, Canada
5
Modelling in Electrochemical Process Engineering, RWTH Aachen University, 52056 Aachen, Germany
*
Author to whom correspondence should be addressed.
ChemEngineering 2019, 3(4), 85; https://doi.org/10.3390/chemengineering3040085
Submission received: 30 July 2019 / Revised: 27 September 2019 / Accepted: 1 October 2019 / Published: 11 October 2019
(This article belongs to the Special Issue 2019 HYPOTHESIS XIV)

Abstract

:
Metallic flow field plates, also called bipolar plates, are an important component of fuel cell stacks, electrolyzers, hydrogen purification and compression stacks. The manufacturing of these plates by means of stamping or hydroforming is highly suitable for mass production. In this work, a toolbox is created that is suitable for a screening process of different flow field design variants. For this purpose, the geometry and computational mesh are generated in an automated manner. Basic building blocks are combined using the open source software SALOME, and these allow for the construction of a large variant of serpentine-like flow field structures. These geometric variants are evaluated through computational fluid dynamics (CFD) simulations with the open source software OpenFOAM. The overall procedure allows for the screening of more than 100 variants within one week using a standard desktop computer. The performance of the flow fields is evaluated on the basis of two parameters: the overall pressure difference across the plate and the relative difference of the hydrogen concentration at the outlet of the channels. The results of such a screening first provide information about optimum channel geometry and the best choice of the general flow field layout. Such results are important at the beginning of the design process, as the channel geometry has an influence on the selection of the metal for deep drawing or hydroforming processes.

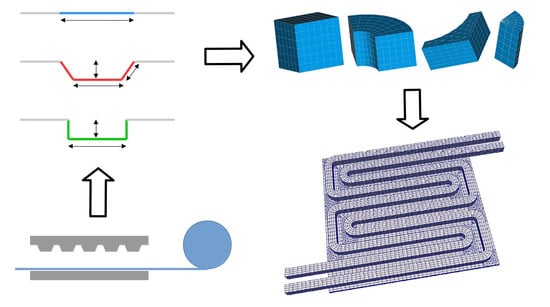
Graphical Abstract

1. Introduction

The supply chain for a hydrogen-based economy requires several compression steps. Electrolyzers usually only operate at up to 50 bar, compared to 200 bar for conventional storage tanks and 350–700 bar in hydrogen fuel cell cars [1,2]. The task of energy-efficient hydrogen purification and compression is the goal of the MEMPHYS project [3,4]. The main goal of the project is to provide a silent and efficient means of extracting pure hydrogen from industrial waste gas streams. Hydrogen is purified and compressed for storage or distribution up to a pressure of 200 bar by means of a simple one-step process. Possible sources of hydrogen are industrial waste gas streams and biogas production [5,6] or the recycling of hydrogen waste gas from the semiconductor industry [7]. The operating principle is a combination of a fuel cell anode and an electrolyzer cathode [8,9,10,11]. To meet a competitive cost target, the stack is assembled from stamped metallic flow field plates, as recently discussed with respect to fuel cell applications [12,13,14,15]. These plates are manufactured by hydroforming, which is highly suitable for cost-effective mass production. The goal of this work is to present a computational toolbox that is suitable to aid in the design of flow field plates. The advantages and challenges of metallic plates with respect to the application and production process have been summarized by several research groups [16,17,18,19]. This work focuses on the key question of the channel geometry. During the stamping process, the metallic plates experience local thinning and stretching. To a certain extent, the material fails and fissures occur [13]. The formability depends on the material and the thickness of the plate [20,21,22,23,24], with the resulting channel shape being characterized by a shape factor that may be incorporated into a flow network model, as reported by Xu et al. [25]. It is also possible to combine the geometric shape of the channel cross section with an analytical performance model, as shown by Peng et al. [13]. The evaluation of the overall performance depends on specific model parameters that must be obtained from well-characterized experiments. This is especially true for optimization tasks for fuel cell plates, e.g., as reported by Imbrioscia and Fasoli [26], Hu et al. [27] and Iranzo et al. [28].
The present work focuses on a more general approach. The performance of the flow field plate is evaluated on the basis of the overall flow distribution. This approach is useful at an early stage in the flow plate design and can be used despite the lack of detailed experimental parameters, but it will yield, in turn, a coarse characterization. The model in this work incorporates the equivalent hydraulic diameter of the real channel and can be adapted to any material and plate thickness. The exact flow field of the stack manufacturer must remain undisclosed. Therefore, the overall process is demonstrated for a flow field with a typical serpentine arrangement, where geometric parameters such as channel width, the number of parallel channels and the number of U-turns are flexible. The model automatically creates the geometry and computational mesh for a single plate. Based on the manufacturing process, there is an upper limit in material elongation that leads to a maximum height for the channels. The goal of the simulation is to determine the minimum height for the channels based on the combination of a sevenfold parallel serpentine flow field with 100 cm 2 active area in combination with a specific porous transport layer. Based on the simulation results, suitable materials and plate thicknesses can be selected for the target application. The performance is evaluated by computation fluid dynamics (CFD) simulations using the open source toolbox, OpenFOAM [29,30].

2. Materials and Methods

2.1. The Principle of Electrochemical Hydrogen Purification and Compression

An electrochemical hydrogen purification and compression cell (EHC cell) extracts hydrogen from a gas mixture. The principle is a combination of a fuel cell anode and an electrolyzer cathode. Figure 1 shows a sketch of the overall process. The cell consists of a pair of flow field plates, porous transport layers and electrode layers on the anode and cathode sides. The two electrode layers are separated by a proton-conducting membrane. At the anode electrode, hydrogen is split into two protons and two electrons. The electrons are conducted through the outer electrical circuit to the cathode electrode. The protons are then transported through the polymer membrane to the cathode, where they are reconverted to form hydrogen. The gauge pressure of the cathode side determines the outlet pressure of the device. Thus, an EHC cell performs hydrogen separation and compression in a single electrochemical step [10,11].
Carbon-supported platinum with very low platinum loading can be used as a catalyst on both the anode and cathode sides. The sketch in Figure 1 shows a simplified version of the overall process. The same principle is used in PEM fuel cells as a standard method to measure the amount of hydrogen cross-over through polymer membranes [31]. Since only hydrogen is converted, the effects of hydrogen separation [32,33] and hydrogen recirculation at the anode side of a PEM fuel cell system [34] were recognized soon. The application to hydrogen compression may have occurred somewhat earlier [35,36,37].
The protonic conductivity within polymer membranes typically requires the presence of liquid water within the membrane. Additionally, each proton usually carries 1–3 water molecules as part of its hydration shell [38,39,40,41]. This effect is referred to as electroosmotic drag. The concentration difference of the water leads to back diffusion towards the anode side. Furthermore, the pressure gradient between the anode and cathode sides affects the water transport across the membrane, leading to complex water management in the cell. The EHC cell reacts delicately to changes in humidification because, in contrast to fuel cells, no water is produced internally. The concentration and pressure difference between the anode and cathode sides also leads to a back diffusion of hydrogen to the anode side. The extent of this effect depends on the chosen membrane type and thickness.
For the feed gas composition, essentially the same restrictions apply as for fuel cells. Gases that contaminate or poison the platinum catalyst, such as carbon monoxide or hydrogen sulfide, must be removed before the feed gas stream enters the cell. Alternatively, different catalyst-membrane-systems can be chosen (e.g., the PBI–phosphoric-acid system, which is more robust against carbon monoxide contamination [42,43]). The purified hydrogen from the cathode side will contain a certain level of humidity and may need to be dried for storage.

2.2. Computational Model for the Anode Flow Field Plate

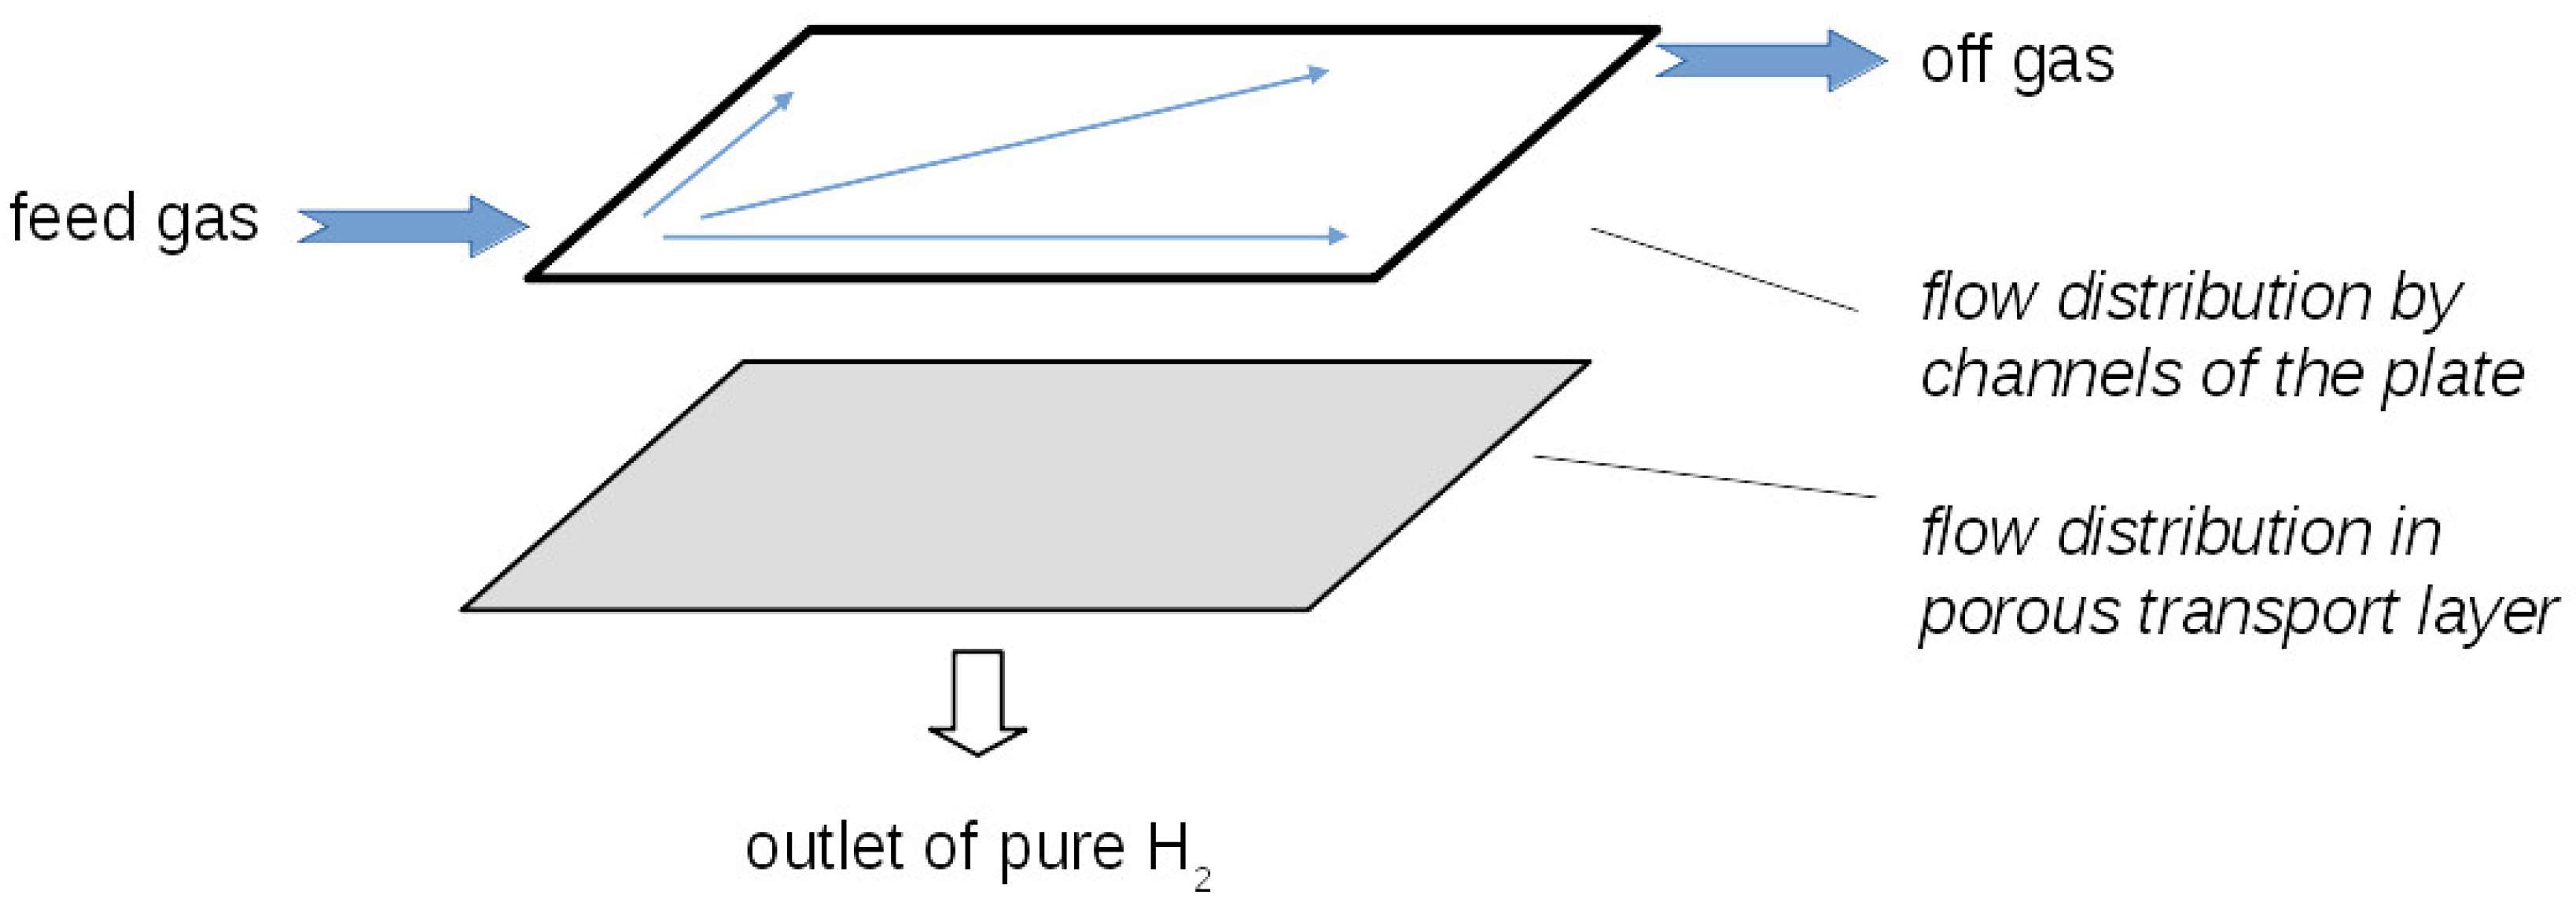
A computational model that includes the full complexity of electro-chemistry and water management would be highly demanding. Such models require a large set of model parameters that must be derived from suitable experiments. The present work focuses on a general characterization of the system on an engineering scale with predictive capabilities. Therefore, the water management is excluded from the model and it is assumed that the cell remains sufficiently humidified without any liquid droplets blocking the gas transport. The major effect for the present computational model is to characterize the extraction of hydrogen from the feed gas stream, in that hydrogen diffusion from the anode gas channels through the porous transport layer to the catalyst layer is modeled, as summarized in Figure 2.
The computational domain represents an electrochemical half-cell. The outlet at the interface to the electrode (termed “outlet of pure H 2 ” in Figure 2) is defined by the current density. For fuel cells, it is known that there exists a significant gradient in the local current density because of the decreasing oxygen concentration from the inlet to the outlet. The following discussion evaluates the gradient, which is to be expected from the hydrogen concentration on the feed gas side. The cell voltage of an EHC cell is given in Equation (1) [9].
E cell = E Nernst + η + R ohm · j
The main contributions for the cell voltage arise from the gas concentrations and pressure ( E Nernst ) and ohmic resistance, R ohm . The electrode overpotential η can be assumed to be negligible within this context for hydrogen electrodes [9], i.e., the assumption of η = 0 is used. The Nernst equation is defined by the partial pressure p of hydrogen on the anode and cathode sides, as shown in Equation (2) [9].
E Nernst = R T 2 F ln p cat p an
The local current density can be obtained by assuming that the electrodes are at the same potential throughout the cell, i.e., they are regarded as iso-potential planes, which is a common approach as the electronic conductivity is high. The expected current at the inlet and outlet of the cell can be calculated from the expected local partial pressure of hydrogen in accordance with Equation (3).
j = E cell E Nernst R ohm
The reference scenario of the MEMPHYS project [3,4] is a hydrogen partial pressure at the inlet of p an / p 0 = 0.5 and at the outlet of p an / p 0 = 0.025 , which corresponds to a recovery of 95% H 2 . Table 1 summarizes the operating parameters of the reference scenario. The value of the ohmic resistance in Table 1 was obtained from single cell experiments, whereas the specific data were not disclosed by the company. The data of similiar test cells by the same company have published recently and are now available as reference [6,44].
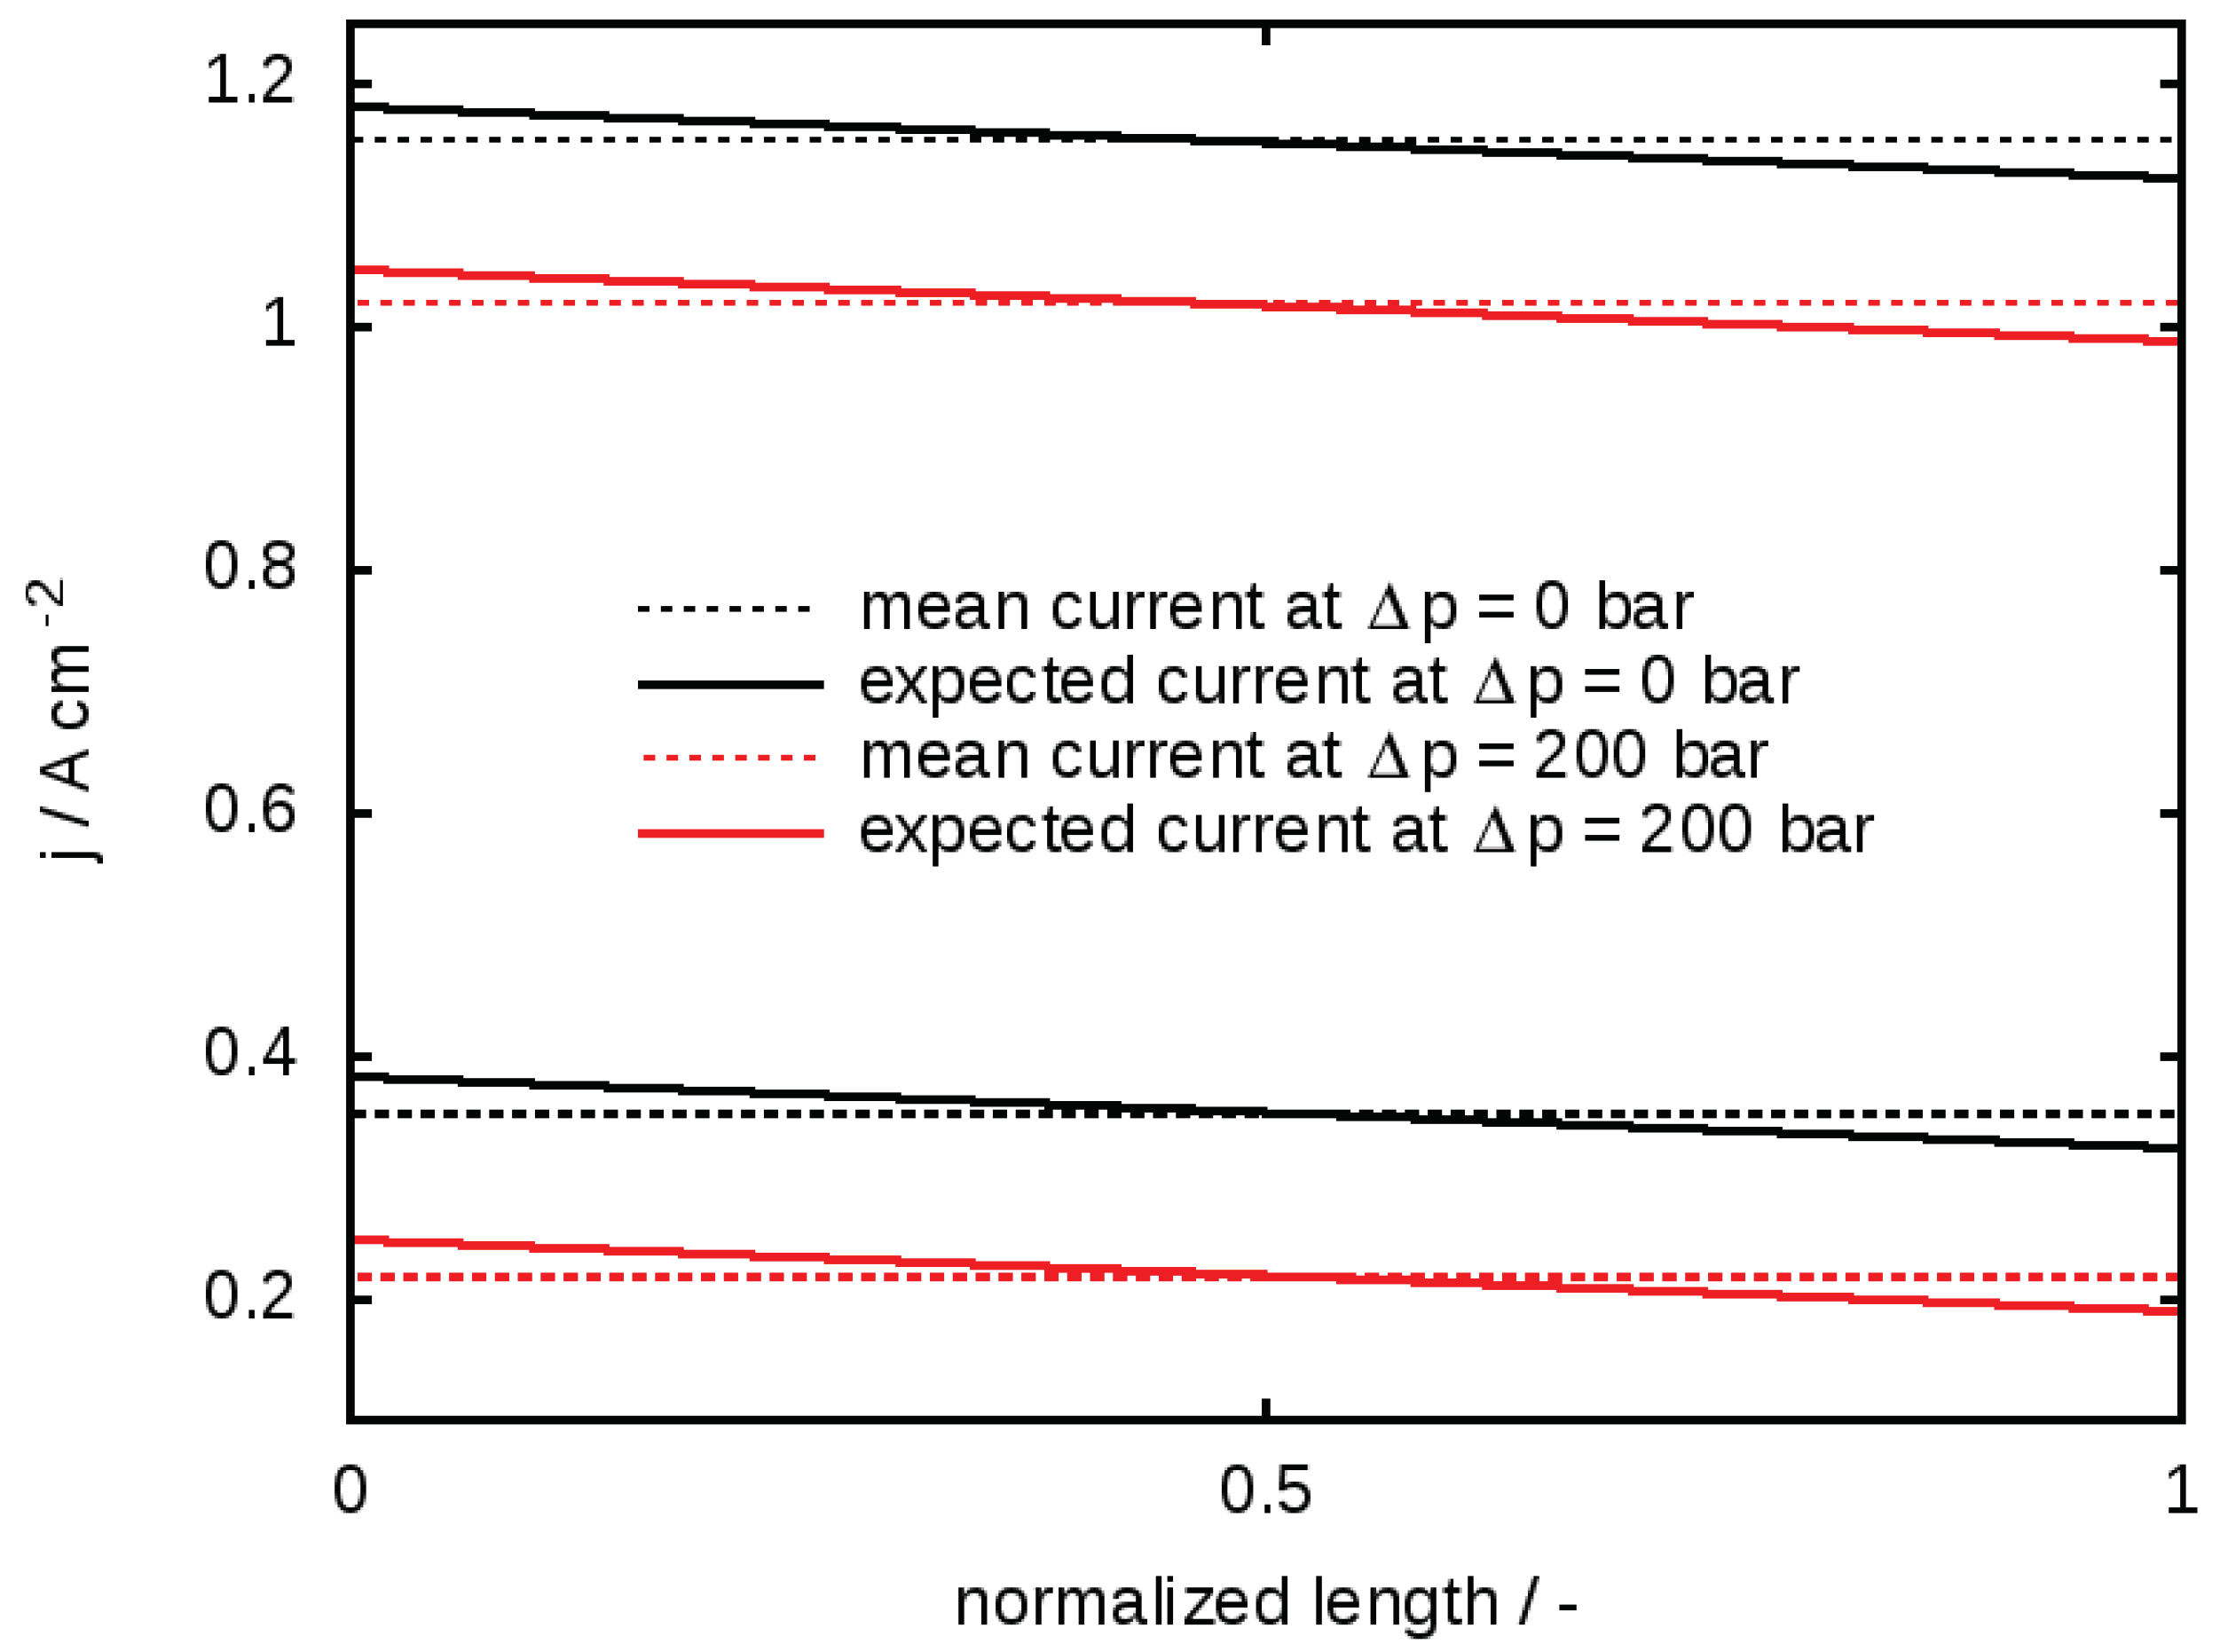
Depending on the targeted applications, an EHC cell can be used for three different tasks: (a) hydrogen separation without compression, i.e., Δ p = 0 bar between anode and cathode side; (b) compression of pure hydrogen; and (c) hydrogen separation and compression. Furthermore, the cell can be operated in either high energy efficiency mode (at 0.2 V and 0.35 A cm 2 for Δ p = 0 bar/0.2 V and 0.22 A cm 2 for Δ p = 200 bar) or in high yield mode (at 0.6 V and 1.15 A cm 2 for Δ p = 0 bar/0.6 V and 1.02 A cm 2 for Δ p = 200 bar). These numbers refer to a hydrogen recovery of 95% H 2 from an inlet gas stream containing 50% hydrogen. Figure 3 shows the current density between the inlet and outlet of the cell as calculated by Equation (3). The local current is interpolated between the values that result for the inlet and outlet gas concentrations. The local variation of current density is small in all cases. Therefore, the assumption for a constant current density as the outlet boundary for the numerical simulation is justified. It should be noted that difference in the moisture content of the membrane by the electroosmotic drag influences the ohmic resistance of the cell. For the present simulations, it is assumed that the membrane is kept well hydrated. A dry membrane would exhibit a higher ohmic resistance. This would lead to lower current densities at the respective voltages described for the two scenarios, which in turn leads to lower flow rates. Overall, this fault condition is not critical for the performance of the flow field plates.

2.3. Simplified Mixture Model

The computational model should be able to extract hydrogen from a gas mixture. The sketch in Figure 2 indicates that the following effects must be described: gas flow through the flow field, mass transport of hydrogen through the electrode–membrane interface and the diffusion of hydrogen within the gas channels and porous transport layer. For the CFD simulations, the open source software OpenFOAM [29,30] was used. In principle, several solvers are available that incorporate inter-species diffusion in porous media. For the design screening task of this work, a simple solution was needed, which would add as few parameters as possible to the overall computational system. Therefore, the solver porousSimpleFoam was used and a simplified mixture model added. Specific details can be found in the tutorial An implicit model for gas mixtures in the Supplementary Materials. The model assumes a mixture of two species with identical physical properties, as shown in Table 2. This assumption is a major simplification, but for the present problem of hydrogen diffusion it proved to be a useful approximation that gives a good qualitative description of the related phenomena. A more specific model would require knowledge of the real composition of the feed gas mixture, which was not available at the early stage of the project. For the permeability of the porous transport layer, typical values for fuel cell gas diffusion layers were used, as shown in Table 3. The overall results of the CFD simulation are: the total pressure loss of the flow field, the distribution of the hydrogen mole fraction and the overall flow distribution based on the gas velocity.

2.4. Equivalent Channel Geometry

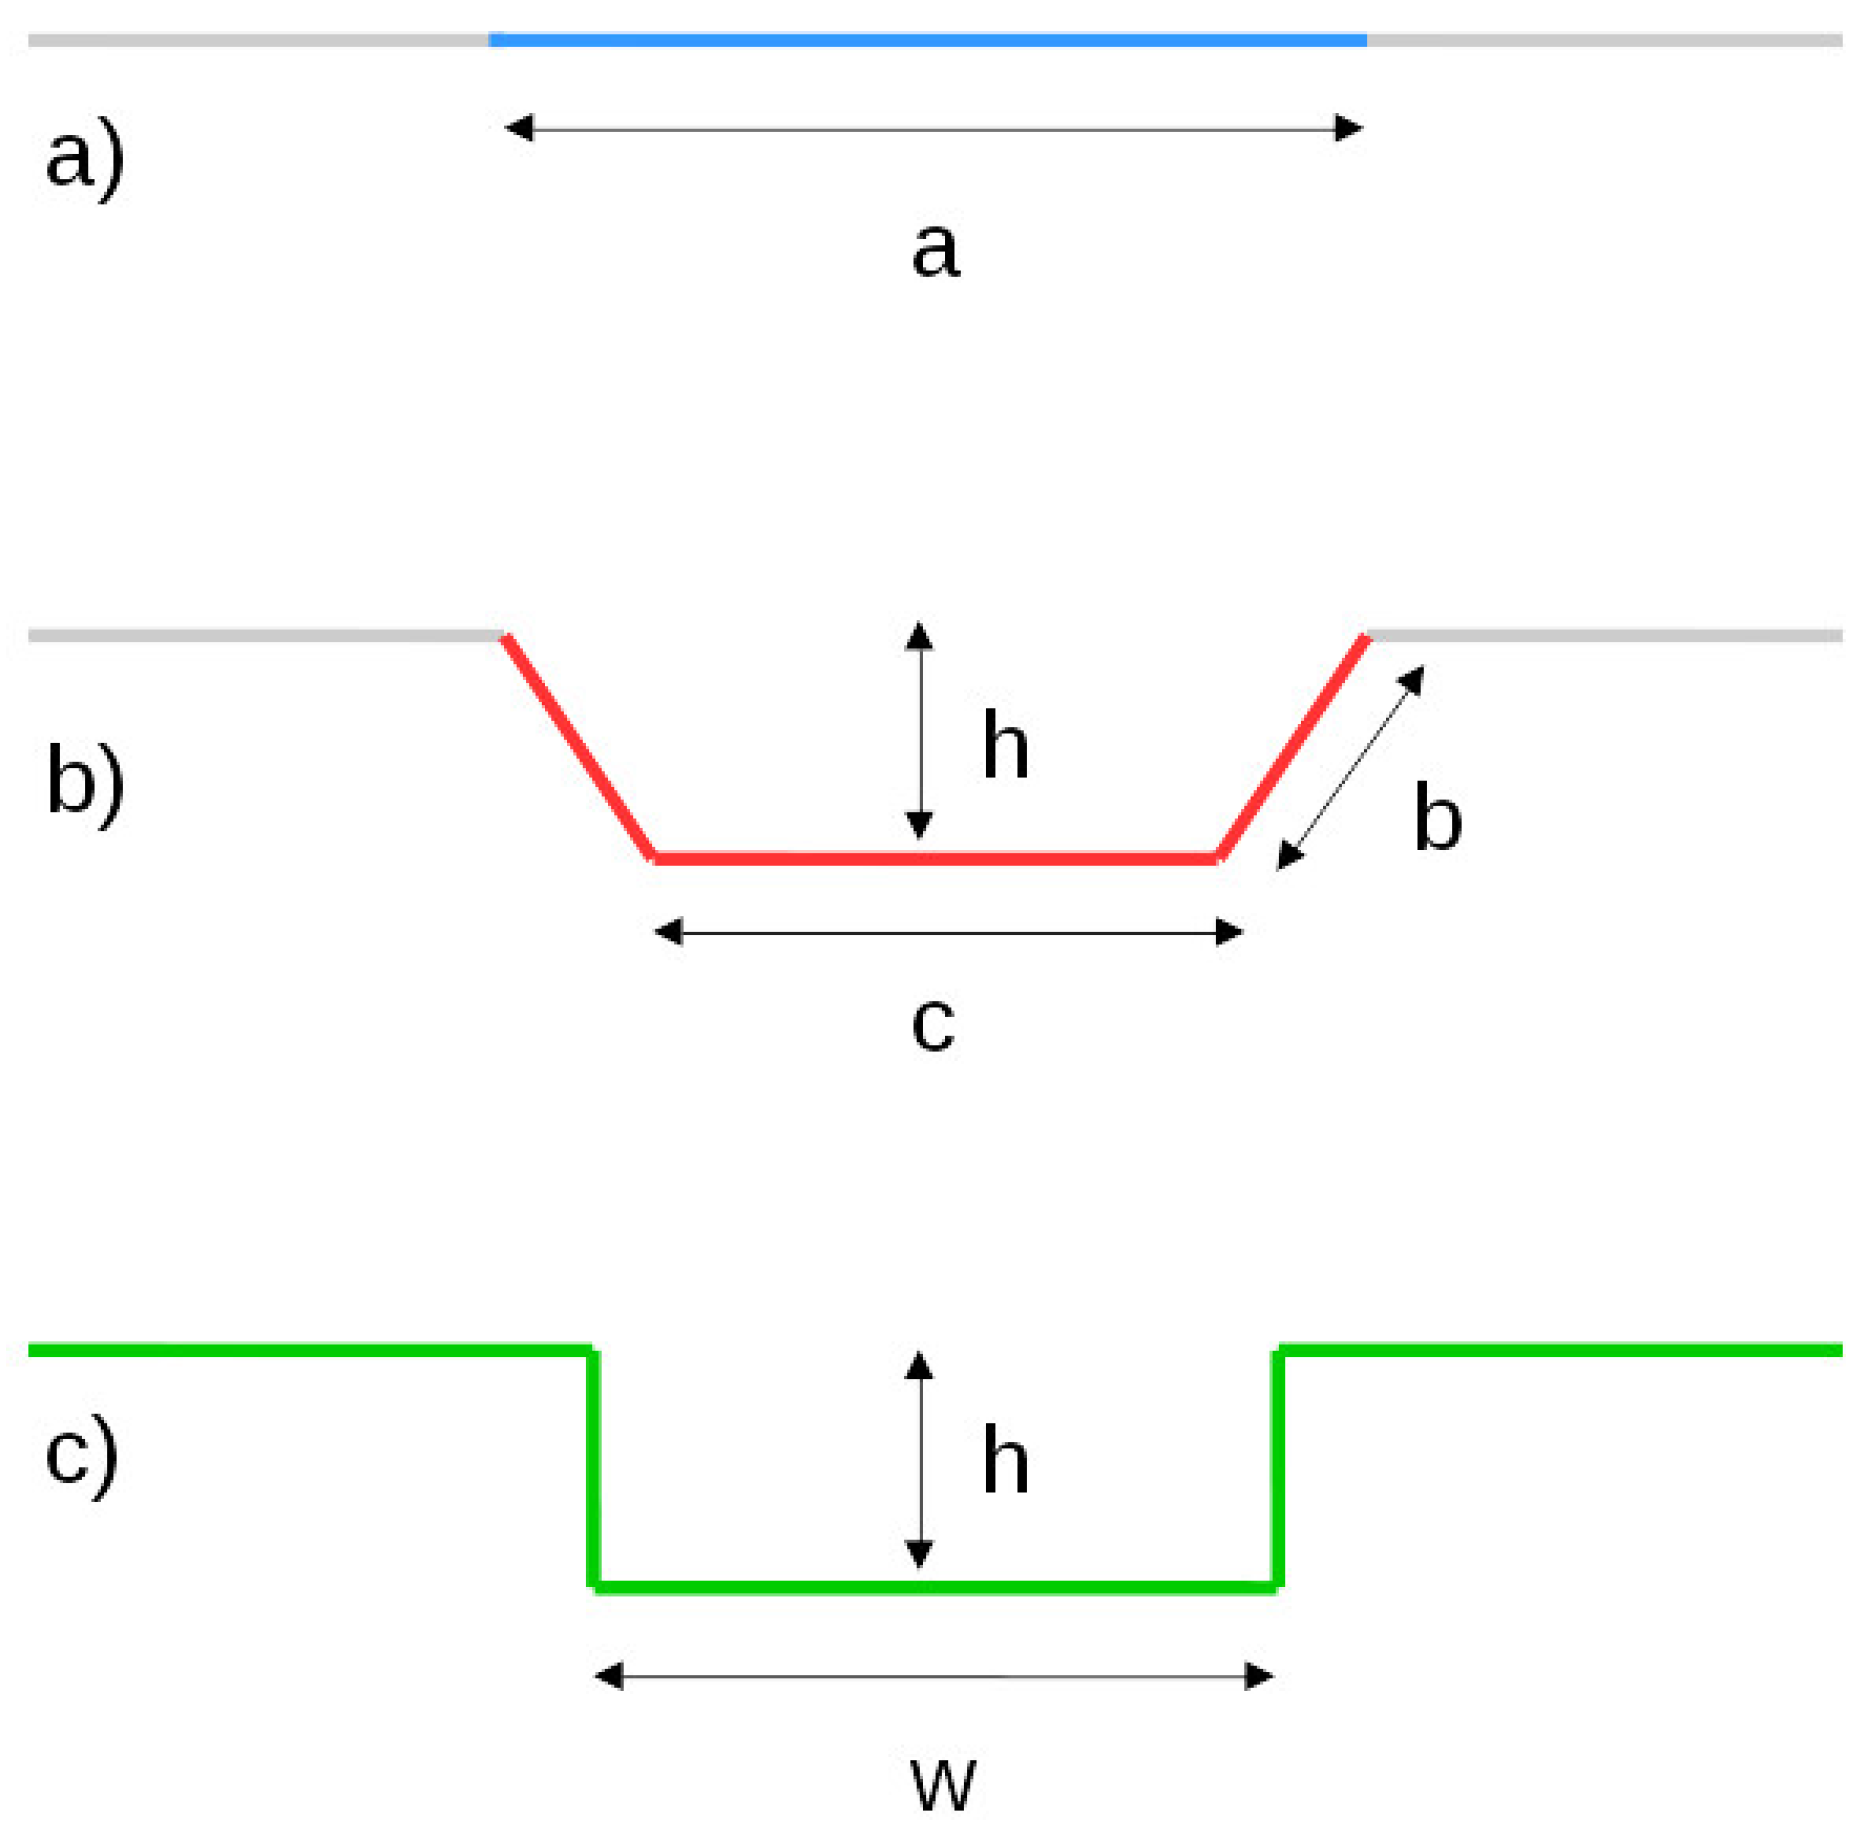
Figure 4a shows a sketch of the pristine metal sheet. The length a is the part that will become the channel. The resulting channel shape after the manufacturing step is shown in Figure 4b. The trapezoidal shape is a simplification of the model. In reality, rounded corners are observed.
The amount of elongation can be calculated as the ratio r 1 between the length of the red and blue line from Figure 4 (see Equation (4)).
r 1 = 2 b + c a
The maximum value of r 1 depends on the material. Another important feature is the steepness of the flanks, which can be expressed as the ratio of a and c (see Equation (5)).
r 2 = c a
The cross-sectional area A c and the hydraulic diameter d h are given by Equations (6) and (7).
A c = a + c 2 h
d h = a + c 2 b + a + c 2 h
The height of the channel depends on the ratio of r 2 , as well as on the total elongation r 1 , as described by Equation (4). After some geometrical considerations, Equation (8) is obtained, which gives the maximum height of the channel for a given material elongation.
h max = ( r 1 r 2 ) 2 ( 1 r 2 ) 2 2 a
A typical value for the maximum elongation of most materials seems to be 40 % ( r 1 1.4 ). The ratio of outer and inner width was fixed at r 2 = 5 / 8 . With this information, the maximum channel height can be calculated as a function of the channel width. Two main criteria should be fulfilled for good performance of the flow field. Firstly, the flow field plate should be able to withstand a differential pressure of 200 bar. Therefore, the channel width should be as small as possible. Secondly, gas transport should not be hindered. Therefore, the channels should have a certain minimum cross-sectional area. Table 4 presents the combinations that have been considered. The height resulting from Equation (8) is the maximum value h max . Therefore, the final value of h was chosen to be a little smaller in order to be on the safe side, because the material elongation should remain below 40%.
For the simulations, a rectangular channel shape was chosen, as shown in Figure 4c. The model channels have an equivalent hydraulic diameter. This simplification allows the model geometry to also be used for different ratios r 2 (see Equation (5)). It can be derived from information in Table 4 that the value of d h changes very little for channels with d h 0.36 mm ( a 1.00 mm). To observe a significant influence of the channel geometry on the overall fluid flow distribution, the two values of a = 1.40 mm and a = 1.80 mm were chosen. These serve as the basis for the CFD simulation. The resulting channel height is h 0 = 0.40 mm and h 0 = 0.50 mm, respectively. From the cell assembly process, it is known that the channels may undergo some deformation because of the applied compression forces [49]. Additionally, there may be an intrusion of the porous transport layer into the channels [49,50,51]. The overall effect is a decrease in the effective cross section. This effect is estimated by considering a variation of the channel geometry, namely a reduction in the overall height by 0.20 mm. The simulations therefore also include the reduced channel heights of h 1 = 0.20 mm and h 1 = 0.30 mm.

2.5. Automated Mesh Generation

The overall flow field should have an active area of 100 cm 2 . At the beginning of the design phase of the MEMPHYS project, the overall channel pattern was not fixed, because the overall layout should also consider restrictions that result from other factors, e.g., locations for the manifolds as given by the overall stack design, the size of the manifolds as a result of the pressure losses for each cell, producibility arising from the hydroforming process and restrictions due to the sealing concept. As a compromise, it was determined that the overall pattern should be parallel serpentine. Furthermore, a typical “Z” and “U” configuration should be tested in the simulations in order to provide results that can be understood in a more general context.
A common approach to generate a computational mesh for CFD simulations is to start from a geometric model (which will already include some simplifications). This geometry can be generated manually with the aid of a suitable software package. For a screening task, where a large number of geometric variations are processed, the geometric model should be generated automatically. The required shape of a serpentine flow field may be generated from the four basic shapes shown in Figure 5. For geometry and mesh generation, the software SALOME [52] was used. SALOME provides a programming interface using the PYTHON programming language. The four basic shapes in Figure 5 contain the geometric and mesh information. The overall flow field is realized in an object-oriented way, where the basic shapes are placed automatically and the corresponding mesh resolution is defined. In fact, the basic shapes represent small independent mesh objects, which are combined in the final step. The resulting computational mesh can be exported to a variety of formats. In this work, the export to the UNV format was chosen, which can be imported into OpenFOAM.
The software creates serpentine flow fields consisting of channels and an adjacent porous transport layer. The faces for the definition of the boundaries are named automatically. The following parameters can be freely chosen.
  • Total width of the flow field
  • Number of parallel channels
  • Channel width
  • Channel height
  • Channel/rib ratio (this defines the width of the ribs)
  • Total number of 180 bends (U-turns)
  • Mesh resolution of channel cross section
  • Mesh resolution in the main flow direction
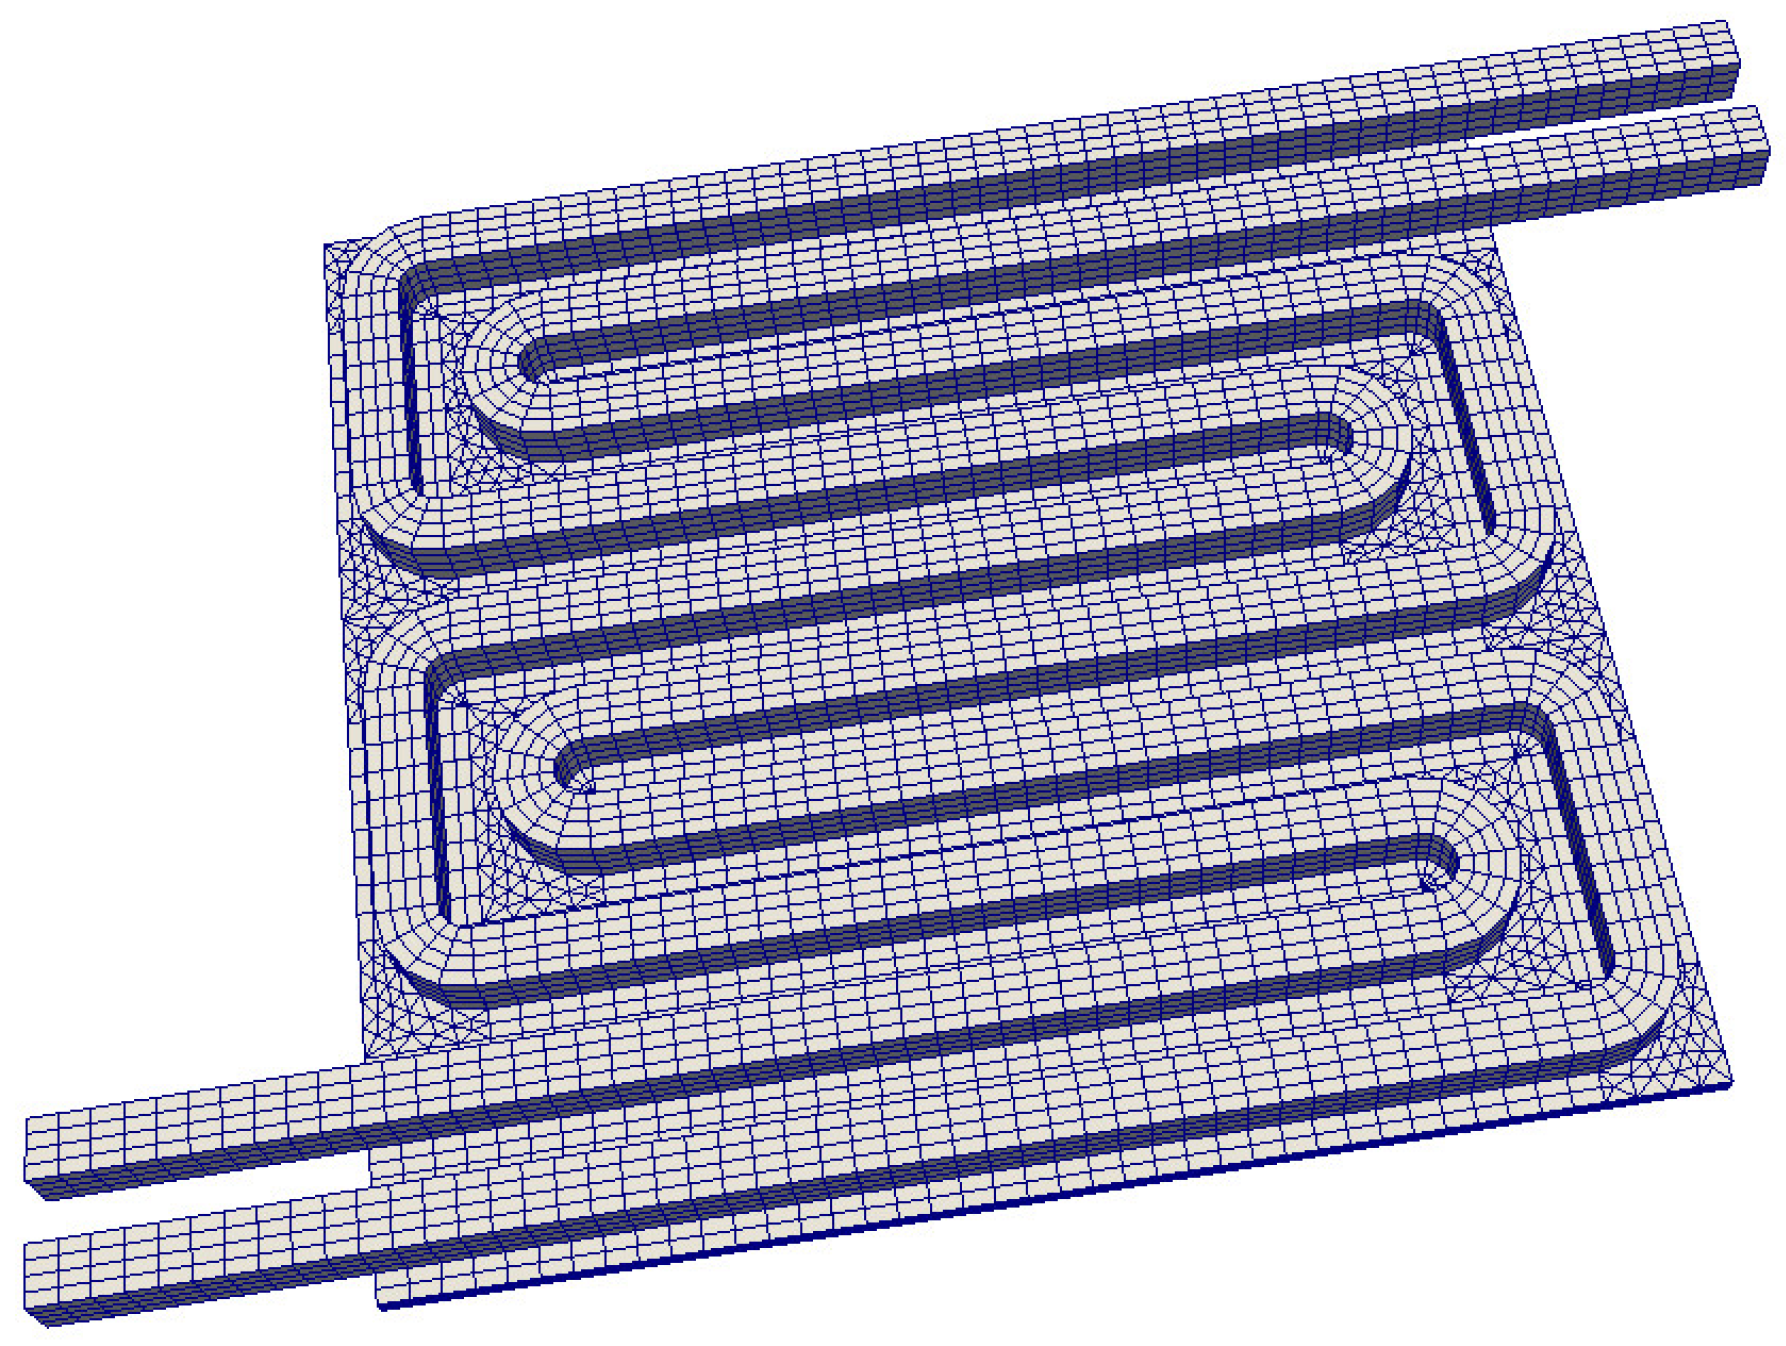
Figure 6 shows an example flow field with two parallel parallel channels and four U-turns. The resulting flow field shows a “Z” type configuration.
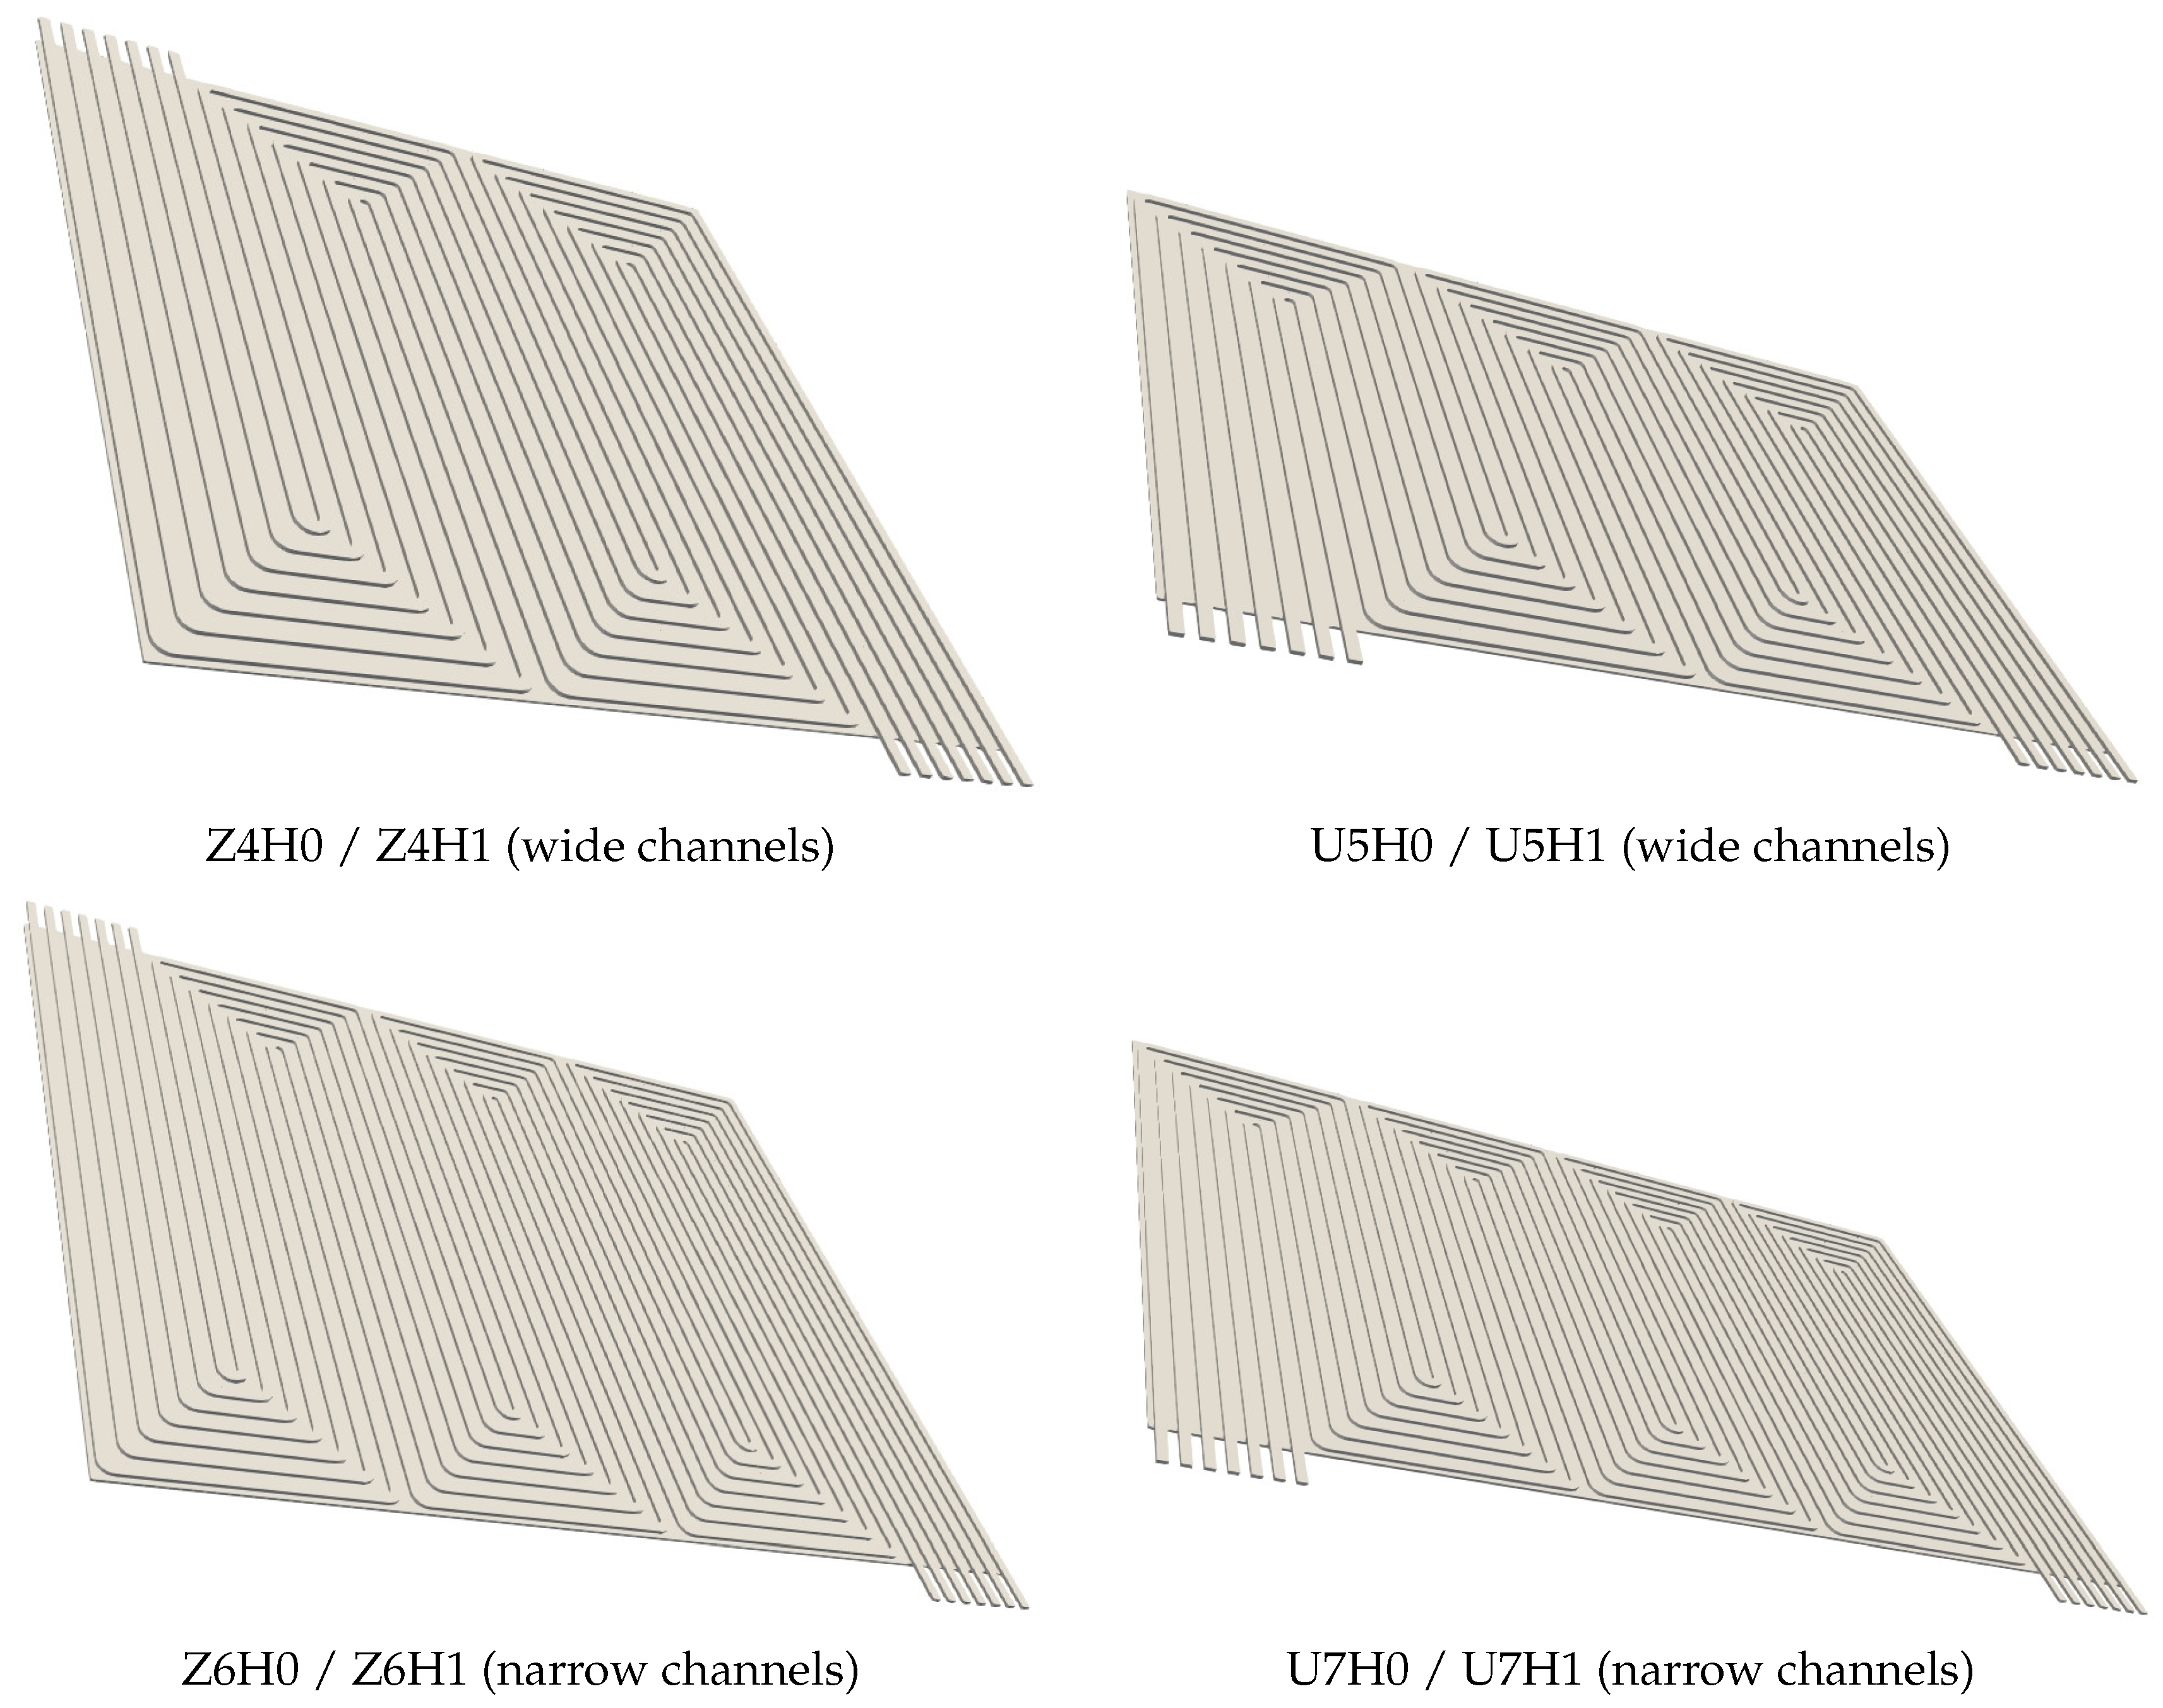
The resulting flow plate should have roughly a square shape. This must also include the manifolds. Therefore, the channel flow field is designed to leave some space for manifolds (by rough estimation) in order to reach an overall square configuration. The number of parallel channels is seven—an estimation based on the dimensions of an existing test cell, the channel cross-section, the expected flow rates and the resulting size of the manifolds. The design variations are summarized in Table 5. It should be noted that the channel width in Table 5 was computed on the basis of the cross-sectional areas. Therefore, the resulting hydraulic diameters of the rectangular channels are larger than the value of d h for the trapezoidal channels. The difference is less than 0.03 mm, and therefore they were considered to be identical in this work. A reference simulation with adjusted channel widths produced exactly the same results.
The geometric variants of the flow field are shown in Figure 7. As mentioned above, a rectangular shape for the overall flow field is assumed. The different channel widths of the seven parallel channels lead to different overall lengths. Therefore, the width was adjusted to yield the correct geometric cell area. The name of the resulting geometry is derived from the overall flow configuration and the number of U-turns. H0 denominates the original height ( h 0 in Table 5) and H1 the reduced channel height.
Overall, 96 simulations excluding mesh dependence and other numerical tests were performed. This number arises from the following considerations.
  • Two general designs (“Z” and “U”) with seven parallel channels and a cell area of 100 cm 2
  • Two different channel widths
  • Two different channel heights (intrusion of porous media)
  • Two different gas compositions
  • Two different current densities for hydrogen extraction
  • Three different levels of hydrogen extraction (80%, 95% and 99% for robustness tests)
The computational effort is about one hour for each simulation on a standard PC with Intel Core i7 processor. Therefore, it is possible to obtain the presented results of this paper within one week on a single desktop computer.

3. Results and Discussion

3.1. The Serpentine Effect

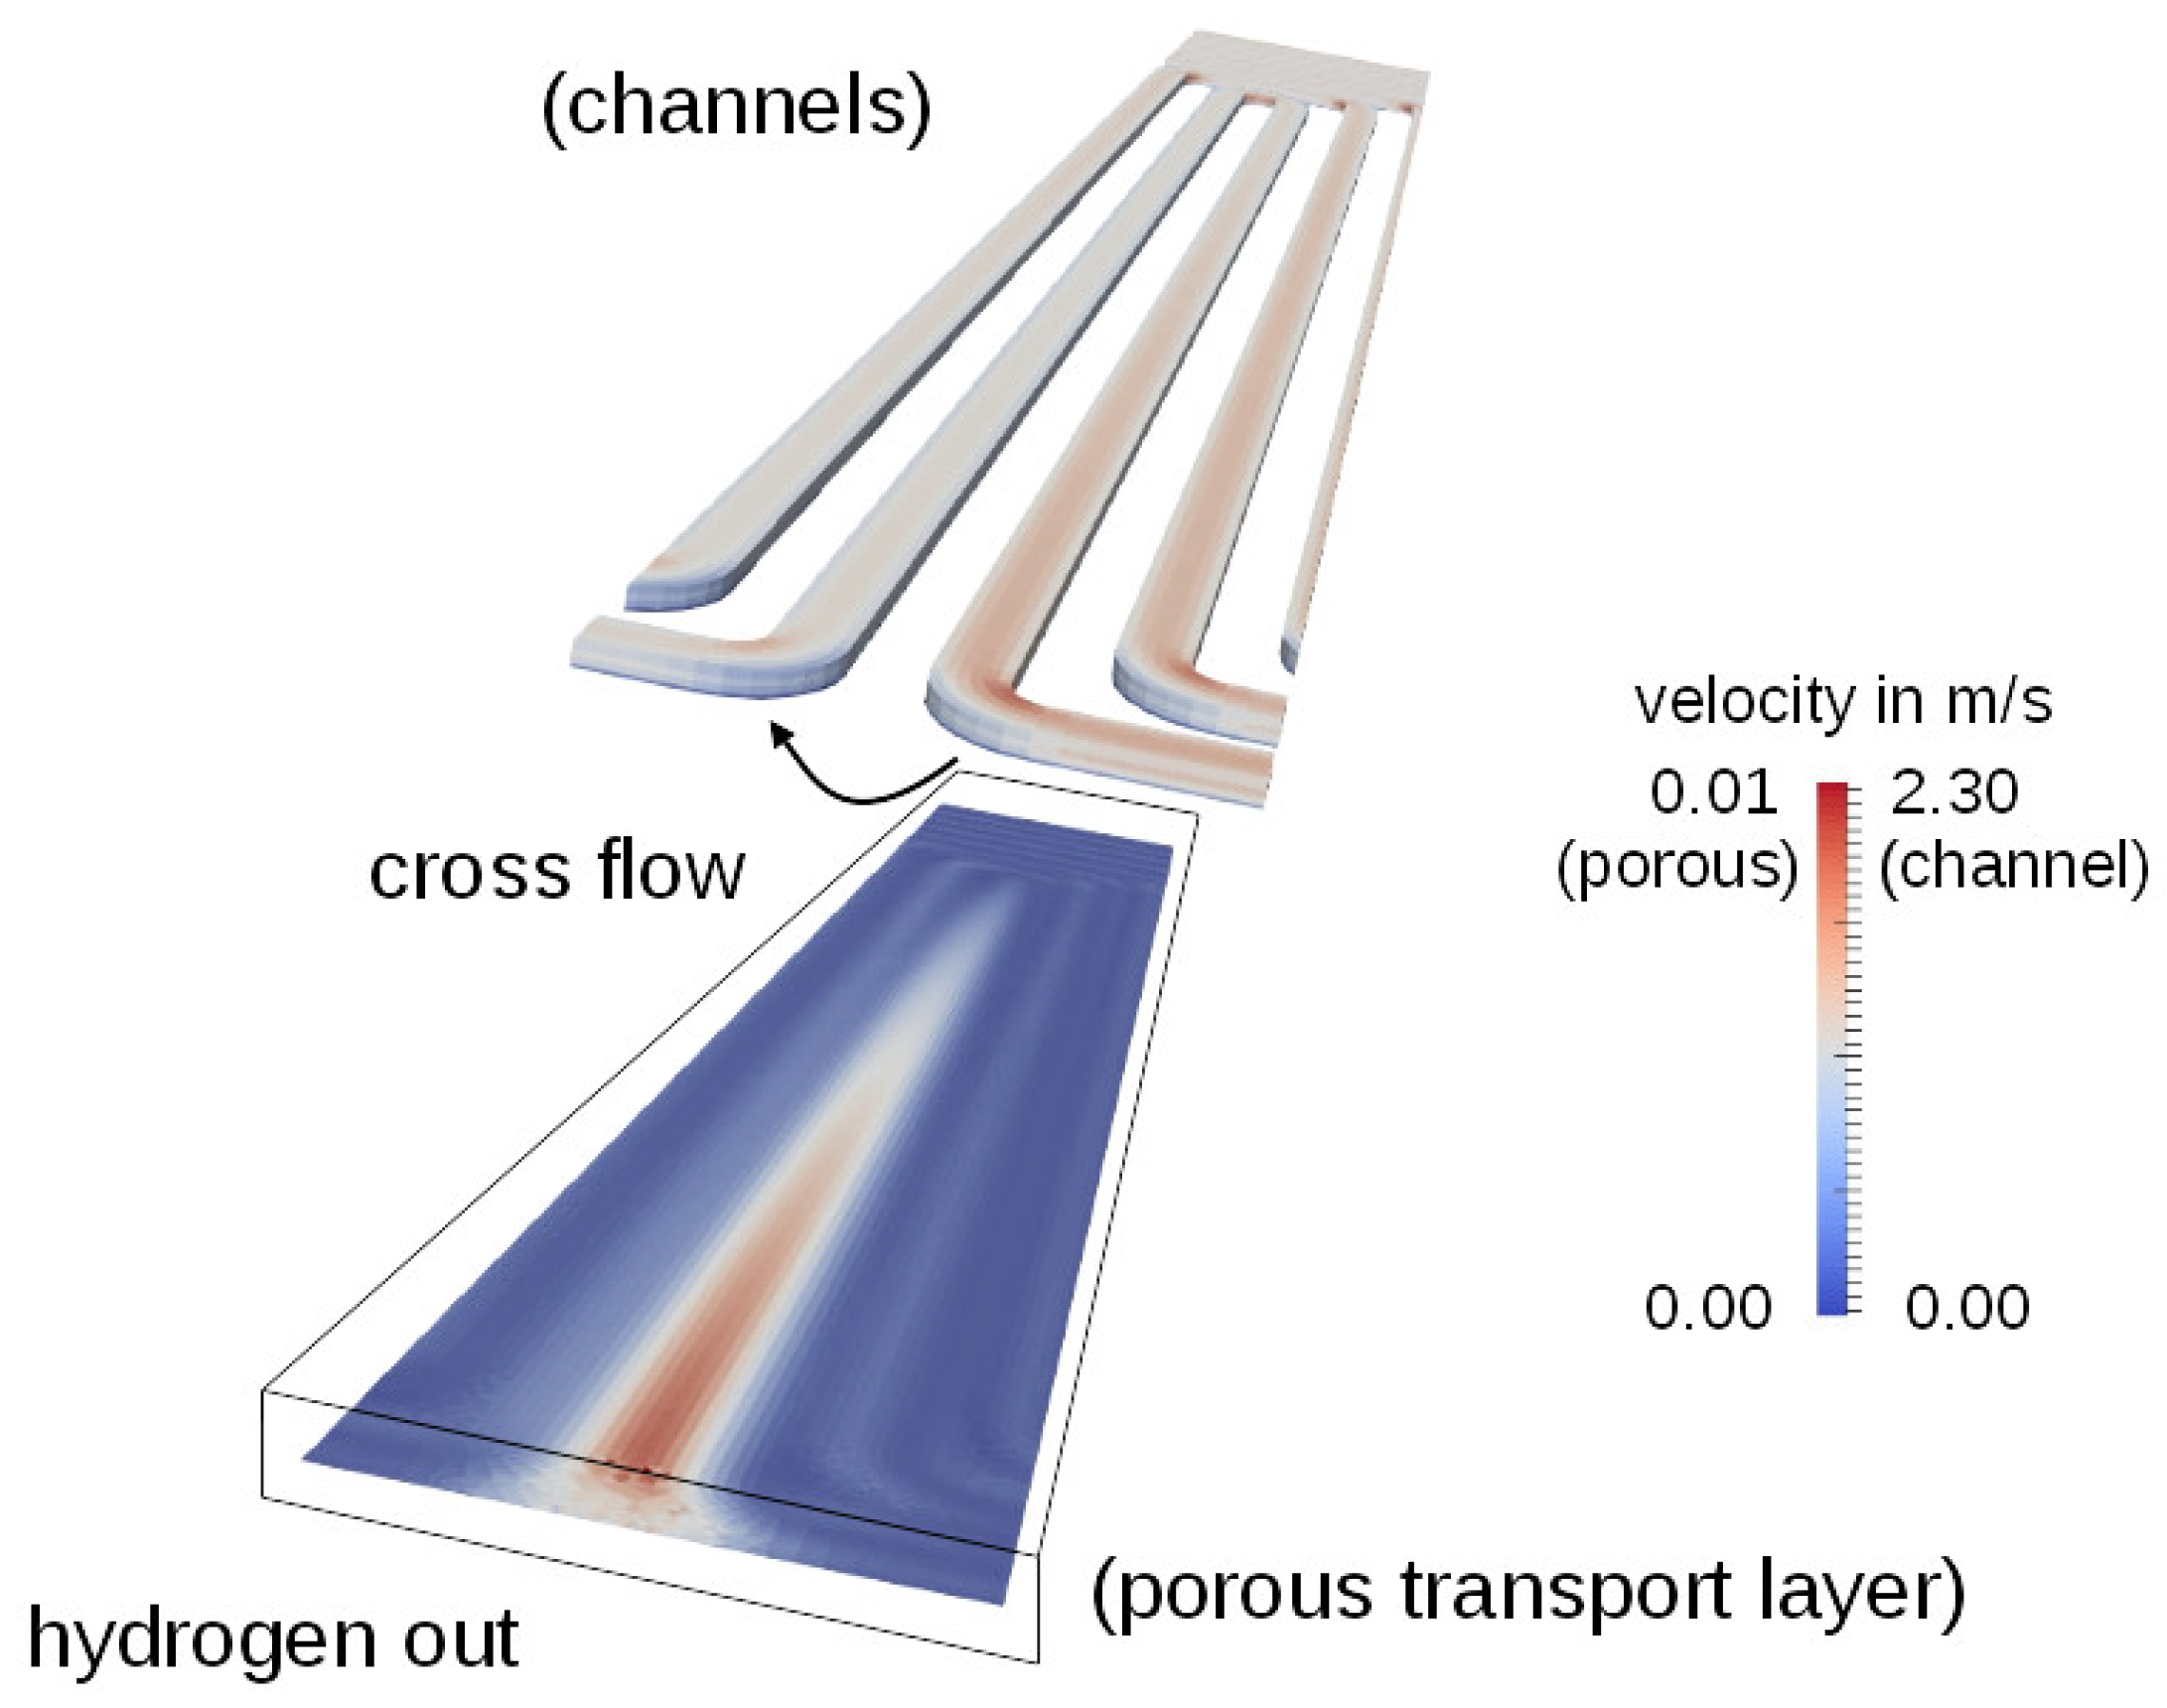
Serpentine flow fields commonly show a very even flow distribution over an area. This is achieved by leading the flow partly through the channels and partly through the porous transport layer. Figure 8 demonstrates a typical fluid velocity distribution. The main flow follows the long channels. At each bend, the flow is partly deflected to follow the new channel direction. At these locations, there is also the option to follow the old direction by passing through the porous transport layer under the land area of the flow field. The driving force for this effect is the pressure difference between different sections of the long channels. The amount of this cross over flow depends on the permeability of the porous layer [53] and the pressure difference of the channel segments between two bends [25,54,55,56,57,58].
The permeability of the porous transport layer is a material parameter. It can be varied in terms of different fabrics such as woven, non-woven and paper type that are available commercially. The effect of the channel dimensions can be understood by looking at two limiting conditions. For very large channels, the pressure difference is low and the resulting cross-flow under the land area, as depicted in Figure 8, is very small. This leads to under supply of these areas and in PEFC-like applications where liquid water accumulates under the land and flooding effects are observed. In the case of very small channels, there is a large pressure difference in the channel sections between two bends. Therefore, the flow is mainly forced through the porous transport layer. This will lead to maldistribution because the flow is no longer distributed by the channels. Additionally, the overall pressure difference for the respective cells increases dramatically.
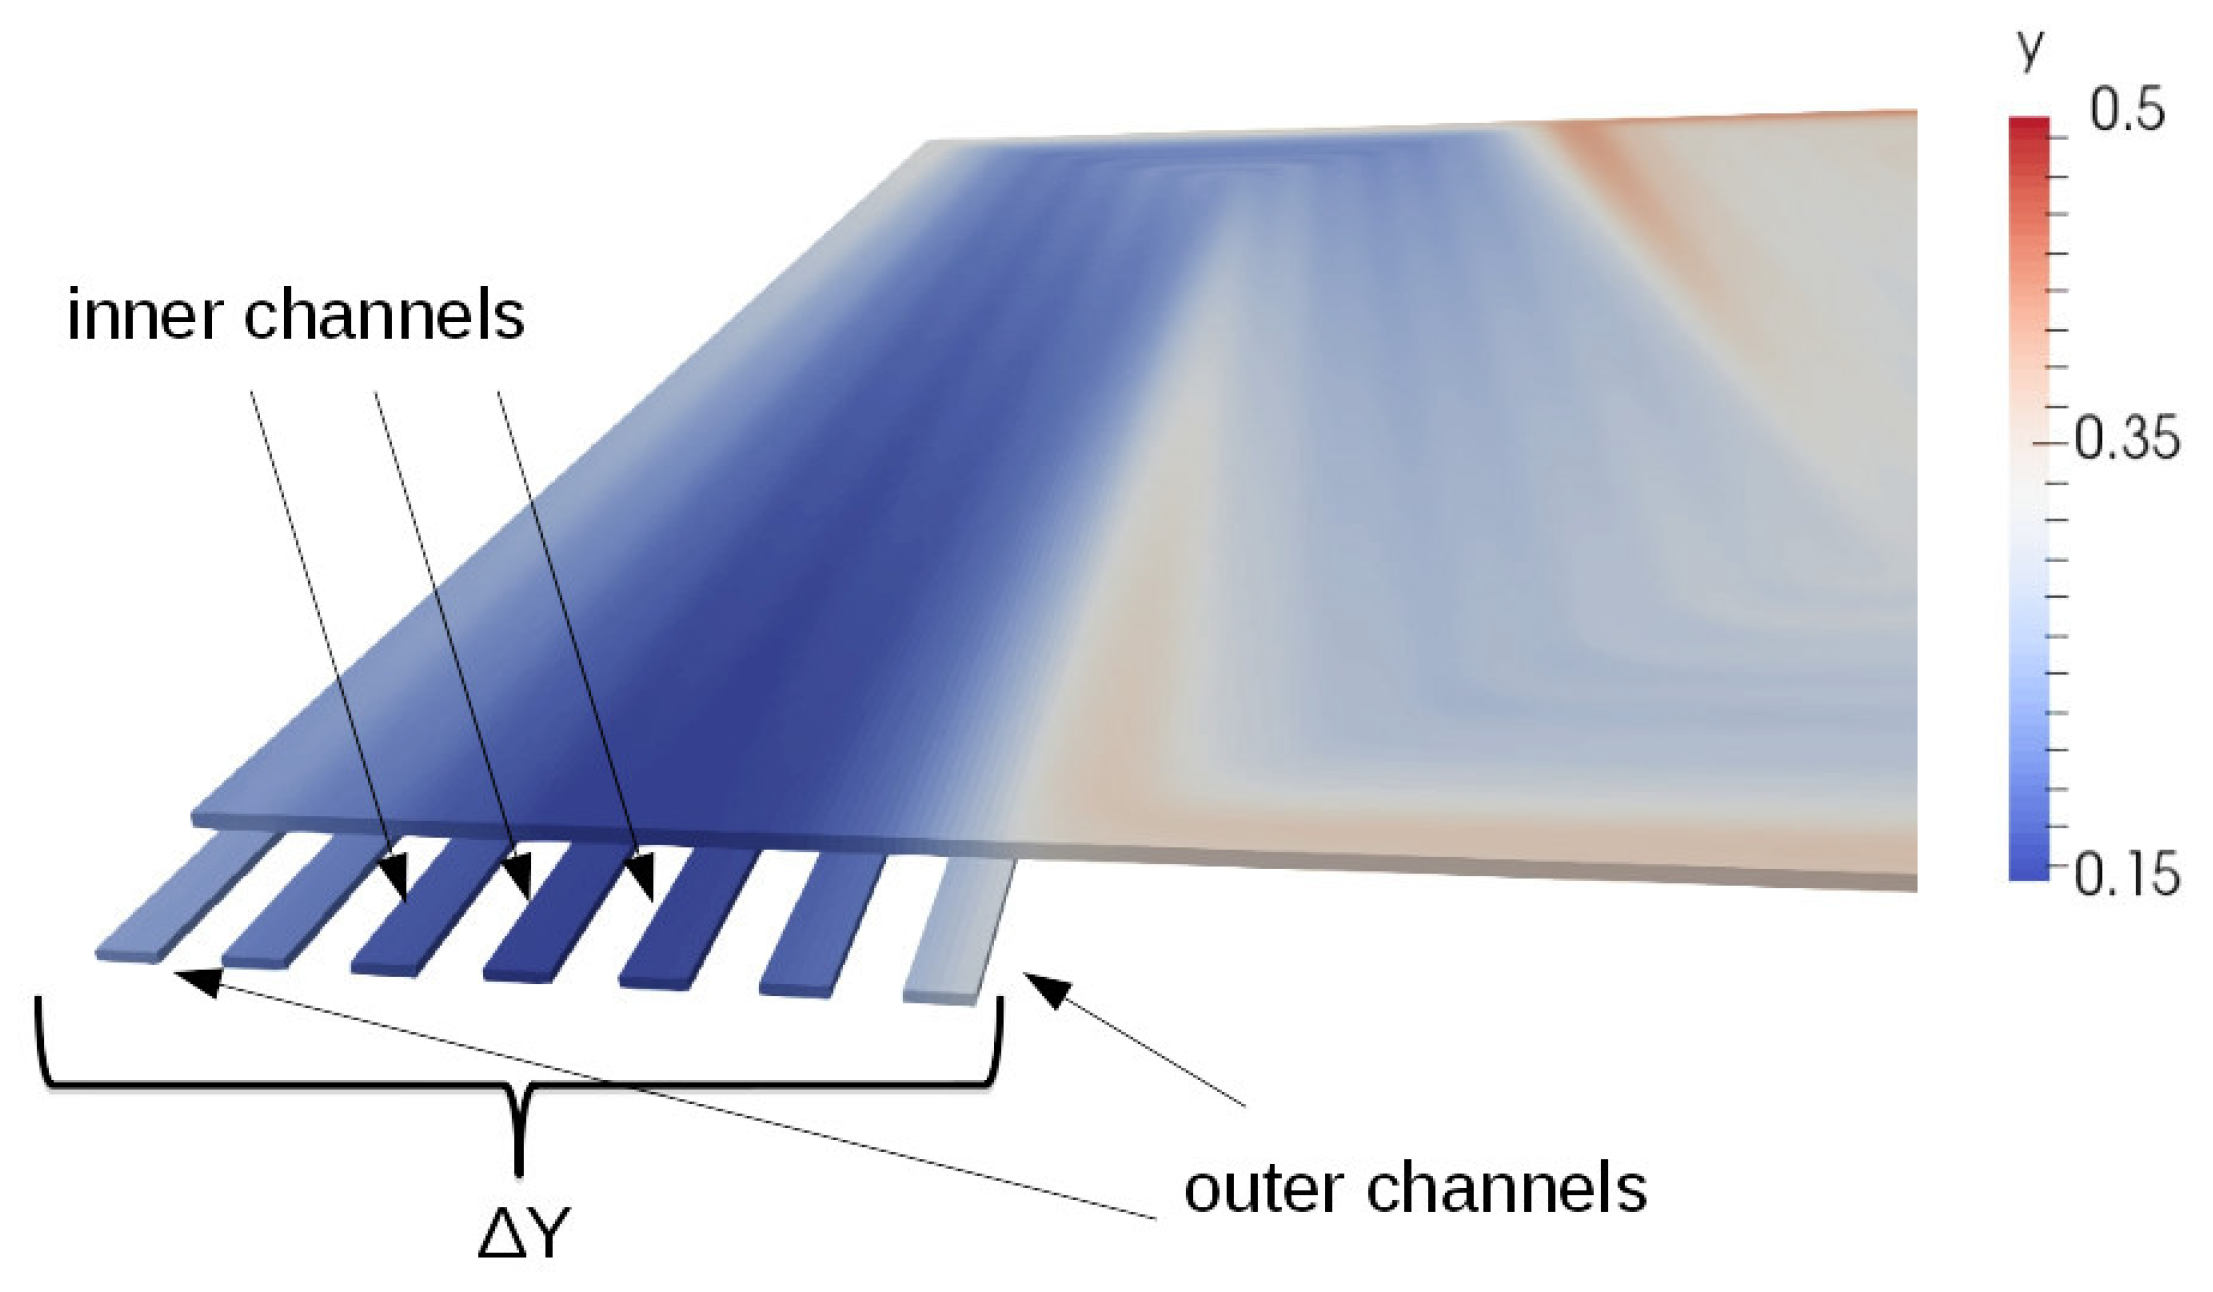
To assess the simulation results for different flow fields, the following two criteria are used. Firstly, the overall pressure difference of the flow field plate should be small. Secondly, the flow distribution should be as even as possible. This second criterion is not straightforward to calculate, because the cells will show a strong gradient in the hydrogen concentration from the inlet to the outlet. The fact that there are seven channels can be used as an advantage, because an even gas distribution over the active cell area also leads to an even hydrogen concentration at the outlet of the channels. It can be seen in Figure 9 that the cross-over flow of the last bend leads to an increase in the hydrogen concentration at the innermost channel because of the short cut effect. The same is true for the outermost channel, which benefits from the second last bend. The flow through the middle channels collects the fluid with the longest passage and therefore contains a gas mixture that is mostly depleted of hydrogen. Thus, the difference in the hydrogen concentration at the seven outlet channels can be used as an indication of the overall quality of the flow distribution. The uniformity parameter f y is calculated from the difference of the maximum and minimum hydrogen mole fraction at the outlet of the channels. It is scaled against the theoretical value Y theo in order to enable a comparison for different hydrogen inlet concentration and recovery rates (Equation (9)). The value of Y theo is calculated from the overall inlet and outlet concentrations based on the amount of H 2 that is extracted. An ideal distribution would yield the value of f y = 0 . The value of f y = 1 gives the information, that the differences in mole fractions are equal to the absolute amount of the species in the outlet gas stream. For all values f y > 1 , the local differences at the outlet of the plates are huge. It should be noted that the parameter f y is scaled against Y theo in Equation (9). Therefore, care must be taken in the interpretation of the theoretical value as it approaches zero.
f y = ( Y max Y min ) Y theo

3.2. Sensitivity Analysis

3.2.1. Mesh Dependence

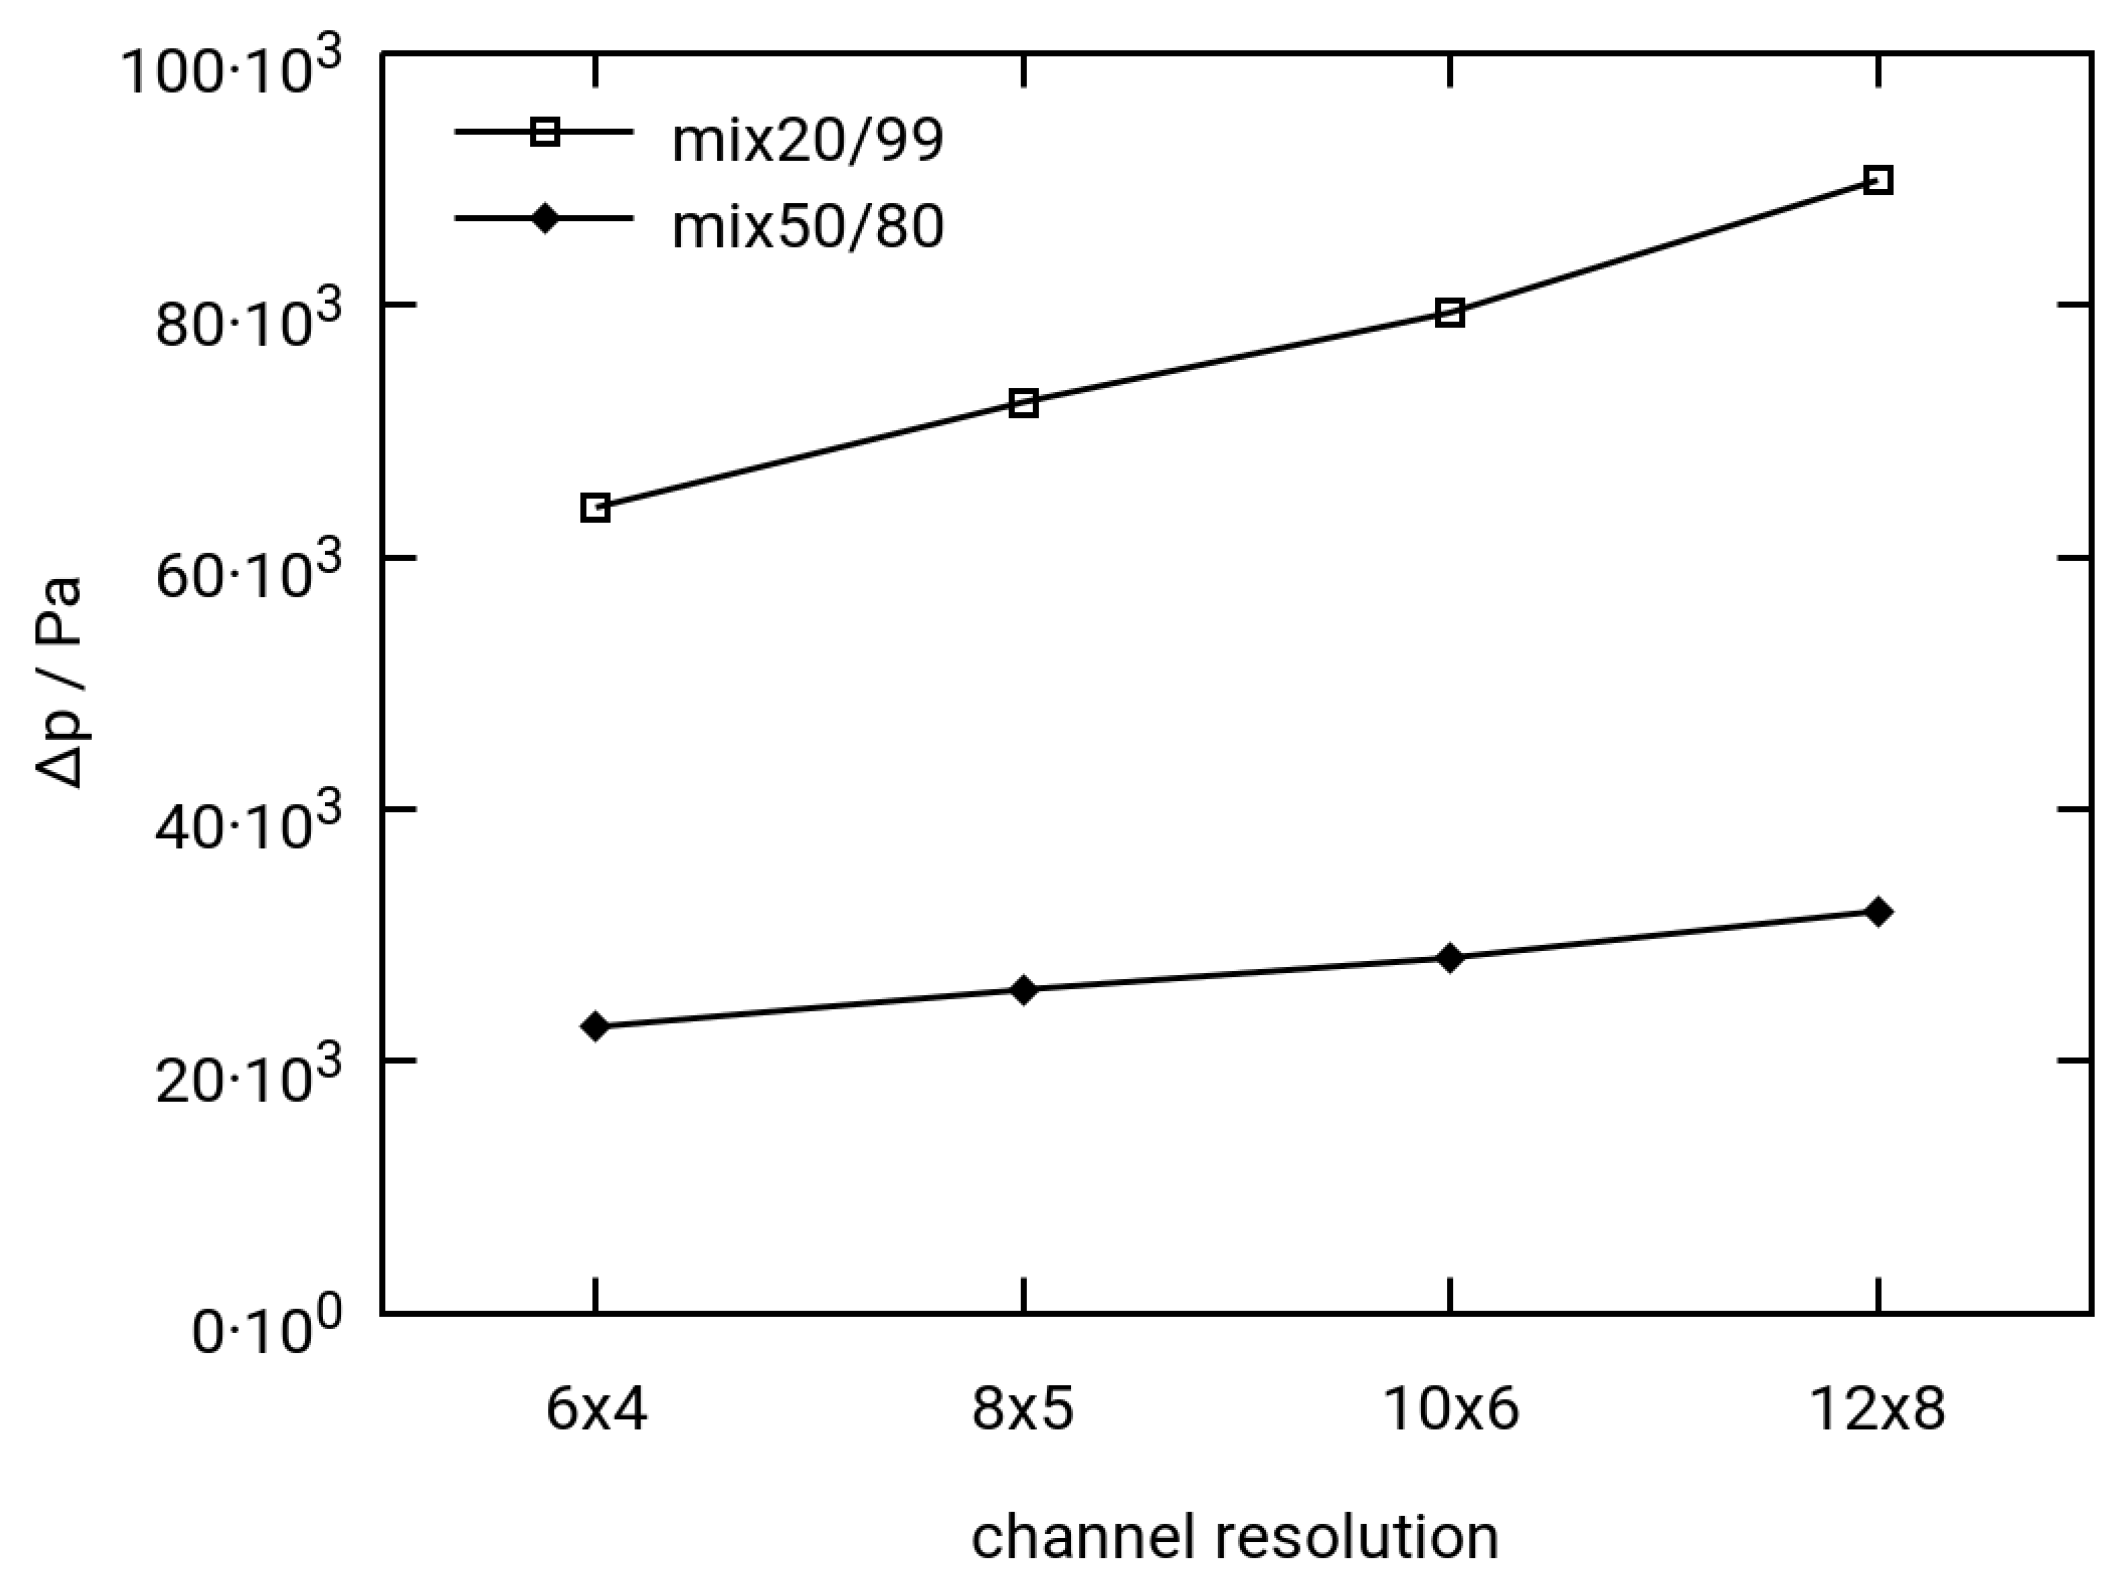
The results of numerical simulations depend on the resolution of the computational mesh. Two example cases were considered in order to determine a reasonable choice between high resolution and the required computational resources. The first case is the gas mixture “50/80”, which contains 50% H 2 of which 80% is extracted. This scenario is close to the real application. The limit of 80% for the extraction level also avoids numerical instabilities that could be caused by local starvation effects. The second case uses the gas mixture “20/99”, which contains 20% H 2 , 99% of which is extracted. This case incorporates a higher overall flow rate caused by the lower hydrogen content at the inlet. Furthermore, the level of 99% H 2 extraction is a good test of the stability because local hydrogen depletion must be expected. The test geometry for these cases is “U7H0’ ’ (see Table 5). Table 6 lists the different mesh resolutions. Any further increase in resolution led to instability of the solver. The reason for this seems to be the demanding boundary condition of the constant current density. The same effect was observed by adding a fine mesh to the channel walls. This also leads to very small computational cells at the outlet of the constant current density and to similar instabilities of the solver.
The resulting pressure difference of the plate is shown in Figure 10. The results for both mixtures of 50/80 and 20/99 depend moderately on the mesh resolution. The selected resolutions in Table 6 are fairly coarse for obtaining the correct velocity profiles in the channels. On the other hand, however, the overall flow is determined by the combination of the channels with the porous transport layer. In particular, the interface between the channel and porous layer is modeled with a strong simplification, i.e., the surface roughness is not considered and possible deformations of the plate or porous layer are neglected. It is concluded that the lowest mesh resolution of 6 × 4 is suitable for the design screening task, as it shows the best relationship of computation time and accuracy. A higher mesh resolution does not significantly increase the quality with respect to the original simulation task. The computed results for Δ p may contain an error of 50% compared to the absolute values of the experiment. This agrees well with the overall uncertainty coming from the other model assumptions, such as the constant current density and idealized channel geometry. It is acceptable, as the simulation results are compared among each other. From the results in Figure 10 it can be concluded that the coarse mesh resolution will systematically underestimate the values of Δ p . For the extreme conditions of mixture 20/99, the error from the mesh dependence is also roughly 50%. It can be concluded that the results with the lowest mesh resolution will also be meaningful under severe conditions.

3.2.2. Variation of Permeability

The permeability of the porous transport layer as given in Table 3 was taken from references of “typical” materials. Nevertheless, there exists a broad range of values owing to the fact that different materials—such as woven, non-woven and paper type—can be used and each of these is available with different treatments to tune hydrophobicity [59,60]. Additionally, the porous transport layer may undergo local deformations and structural changes caused by the compression forces during the cell’s assembly and operation. Therefore, the initial values for the permeability were varied to assess the validity of the simulation results. The variations are summarized in Table 7. The original values (see Table 3) are named “pp”. Starting from these, the values were decreased by half and by one order of magnitude. The same procedure was also used to increase the values. The variations in Table 7 start with the lowest value of “p1” and end with the highest value “p4”.
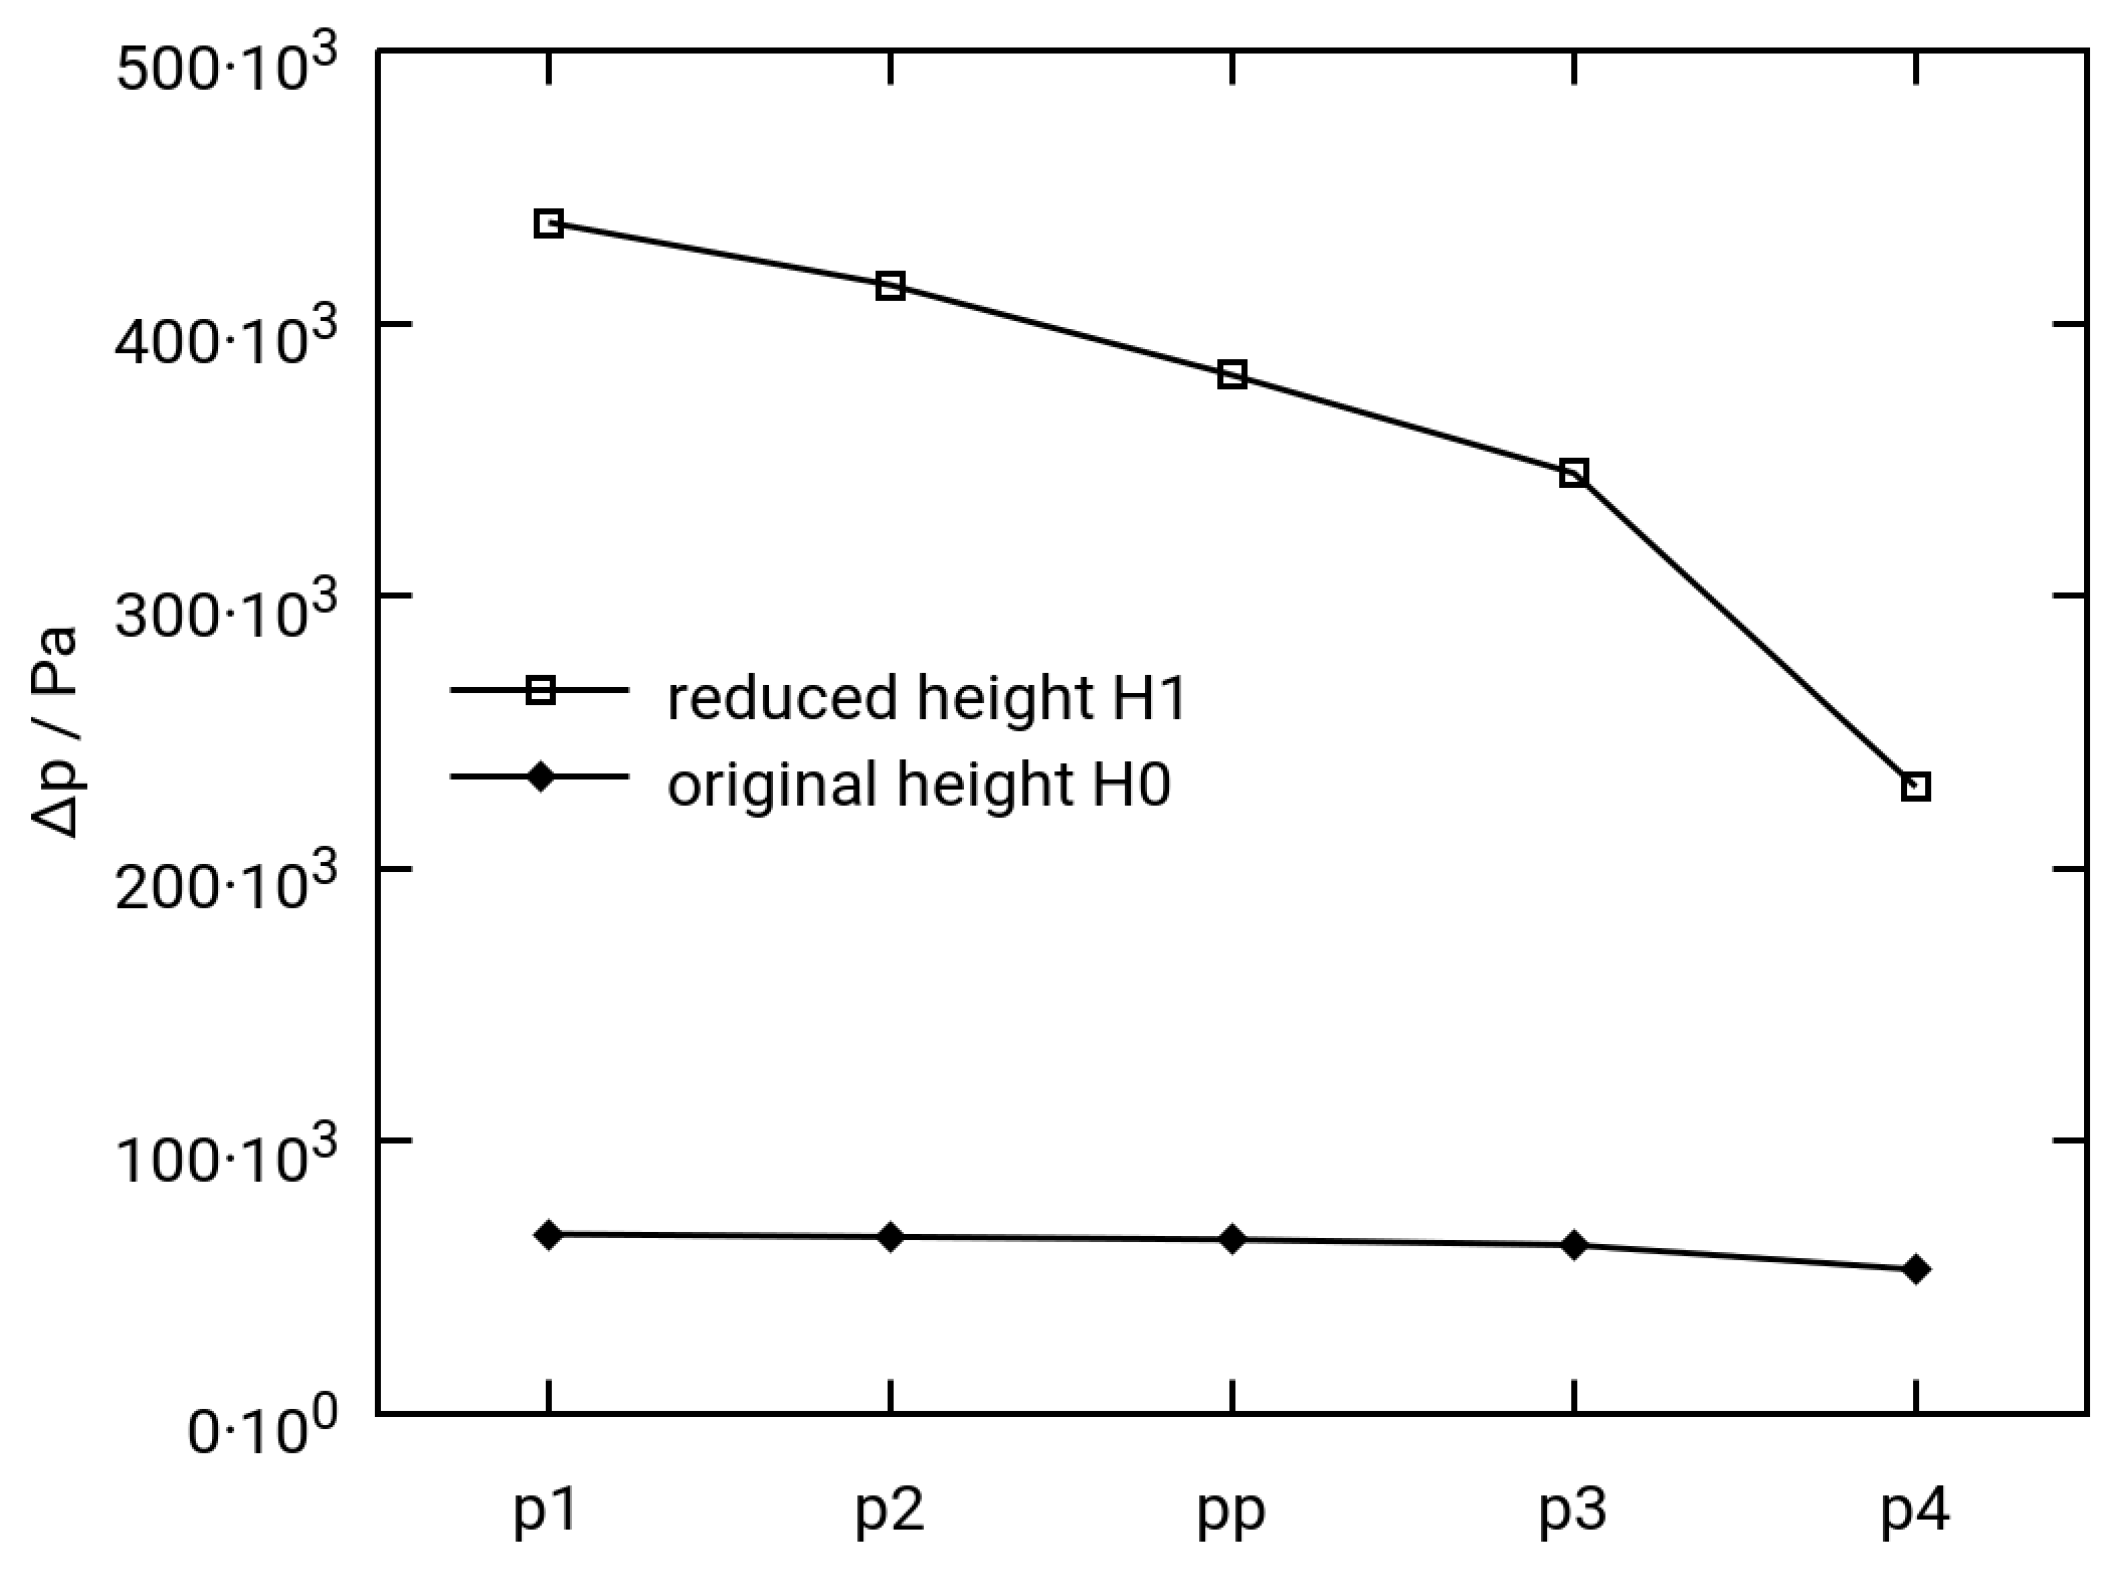
Figure 11 shows the resulting values of Δ p for the example flow fields U7H0 and U7H1. Here, the scenario of the gas mixture “20/99” is used, where the inlet gas stream contains 20% H 2 from which 99% is extracted. This fairly harsh scenario is selected to obtain a strong deviation if the overall flow pattern changes. It can be seen that, for the channel height of 0.4 mm (U7H0), the overall pressure difference of the plate is independent of the permeability of the porous layer within the given range. For the flow field U7H1 with a channel height of only 0.2 mm, there is an almost linear dependence to be observed. This is understandable, as the thickness of the porous transport layer is larger than the channel height. The high values of Δ p indicate that the in-plane flow distribution (parallel to the active cell area) takes place to a greater extent through the porous media. In this case, the functionality of the channels for distributing the flow starts to fail. Overall, it can be said that the absolute value of the permeability of the porous layer has very little influence on the resulting flow configuration, as long as the flow field works properly. A closer inspection of Figure 11 reveals that there is a jump in Δ p between “p3” and “p4” for both U7H0 and U7H1. At this point, the in-plane permeability of the porous layer exceeds the value of 10 13 m 2 . There seems to be a transition, where suddenly it becomes easier for the fluid to flow under the land area. This effect was formerly described by Pharoah [53] who obtained the same threshold value for the in-plane permeability. It can be concluded that the permeability of the porous transport layer has very little influence unless the absolute value exceeds a critical limit. In the experiment this is unlikely to happen, as the permeability will decrease due to the compression effects and possibly flooding.

3.3. Selected Simulation Results

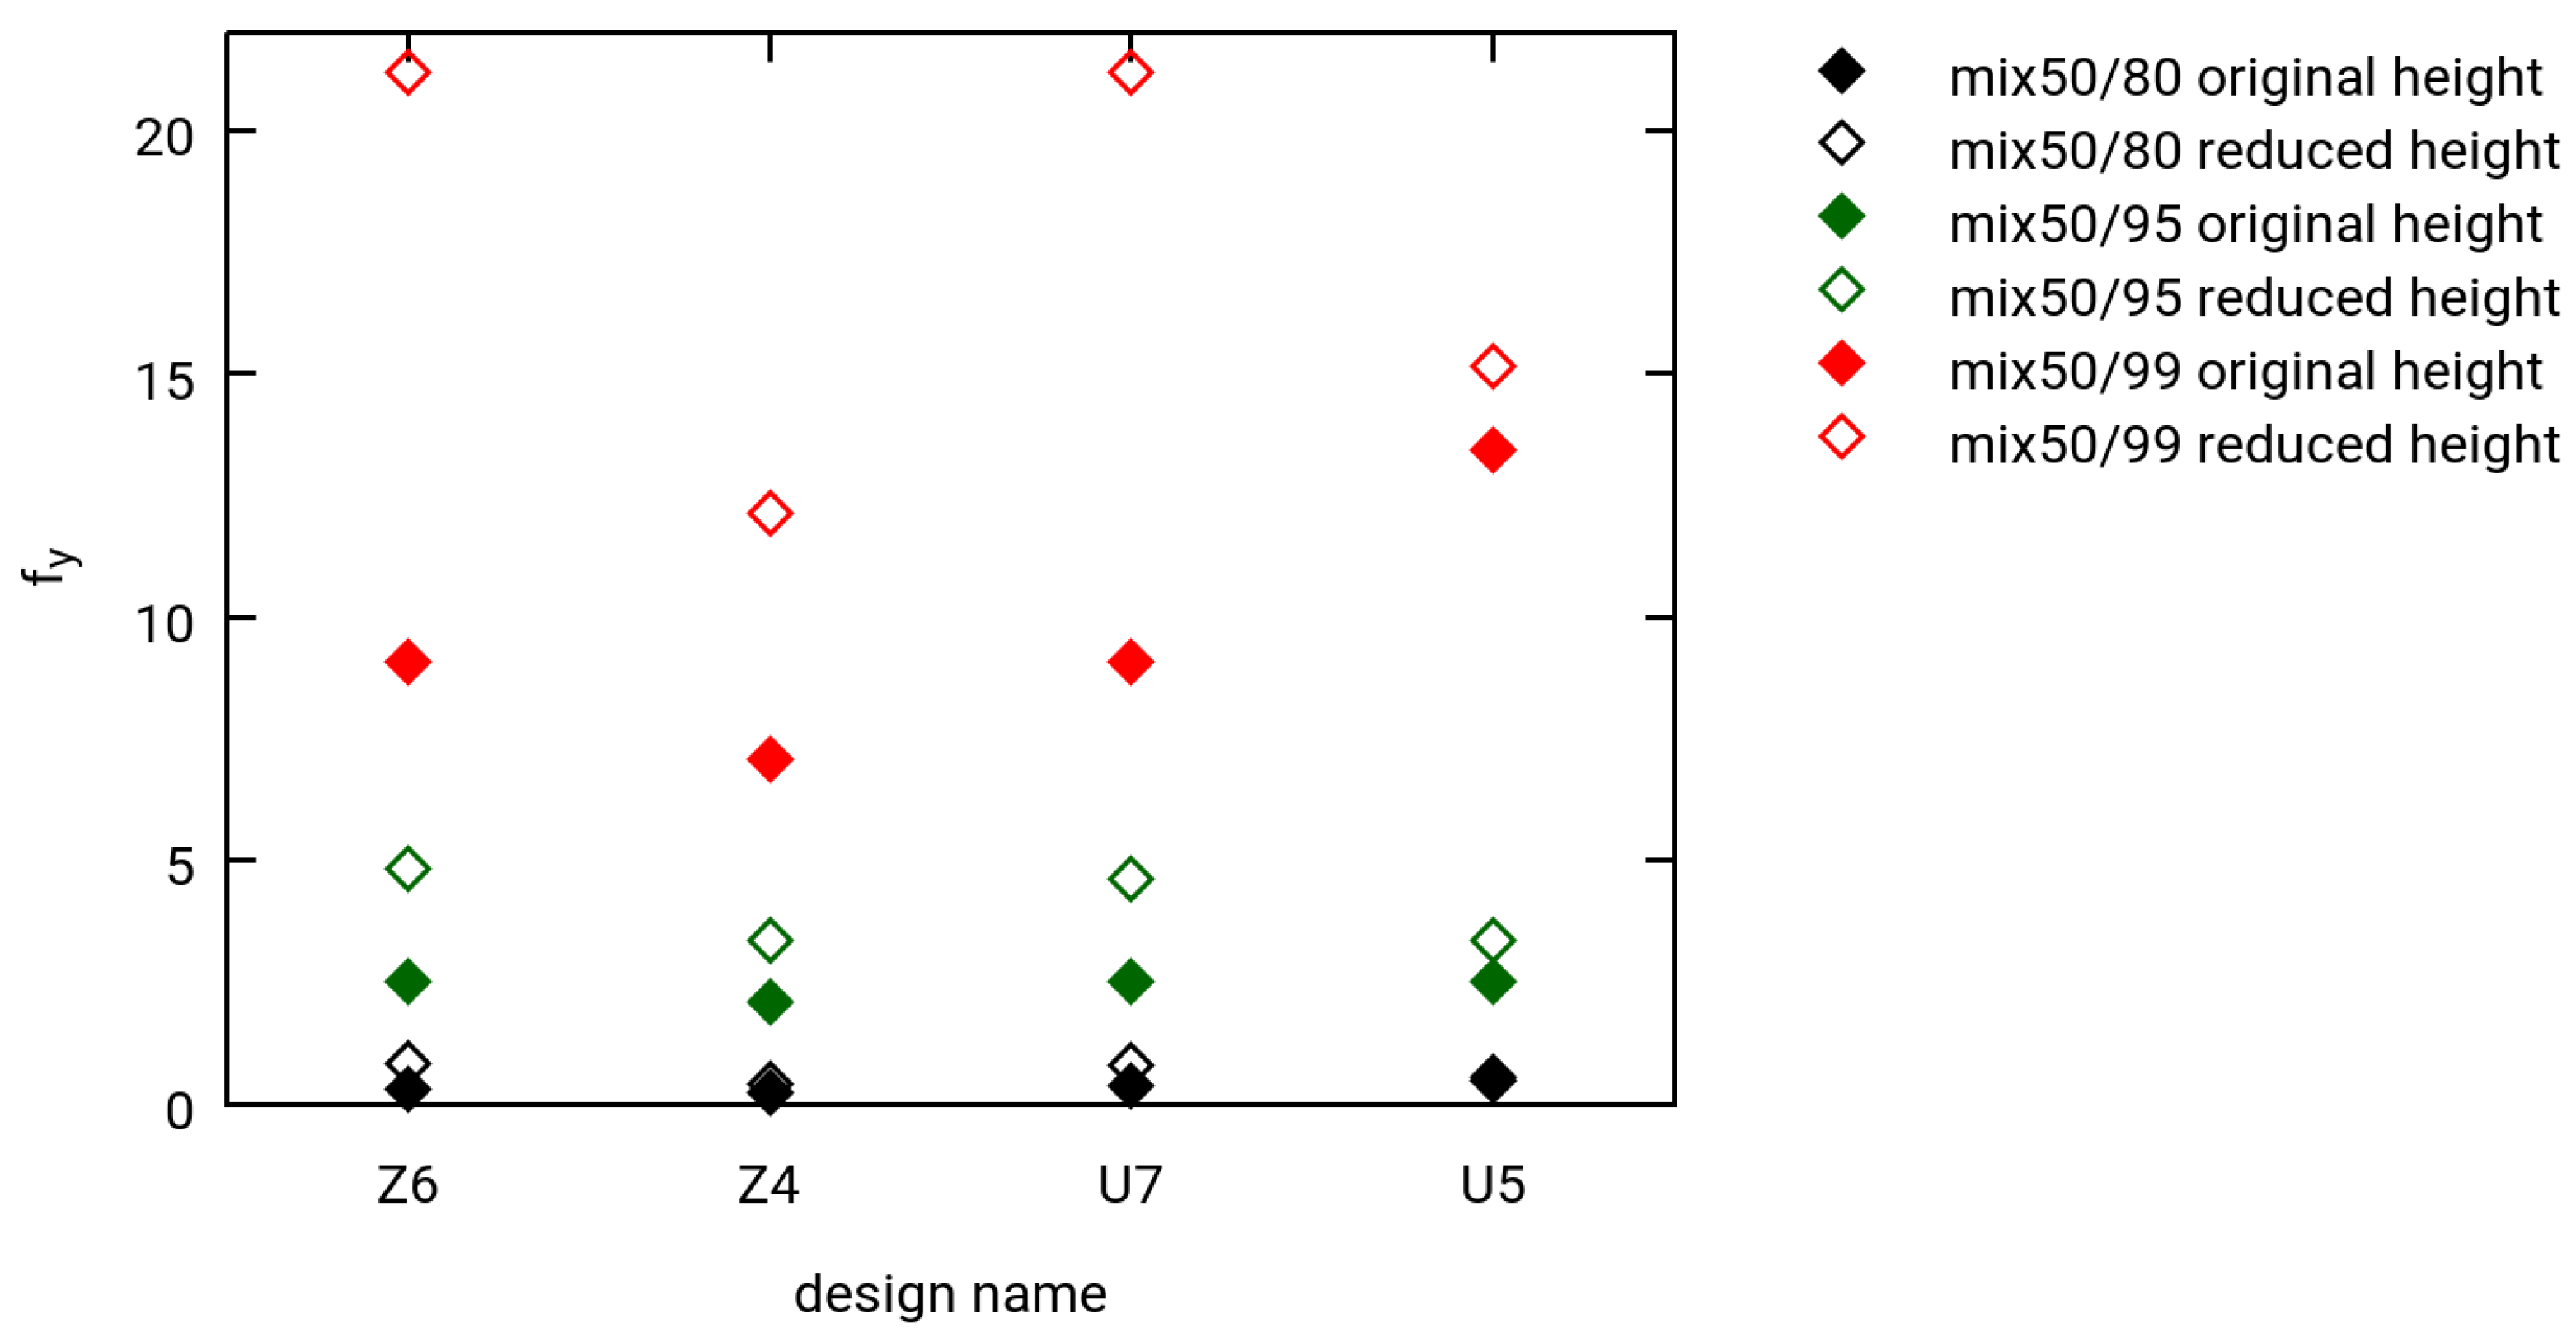
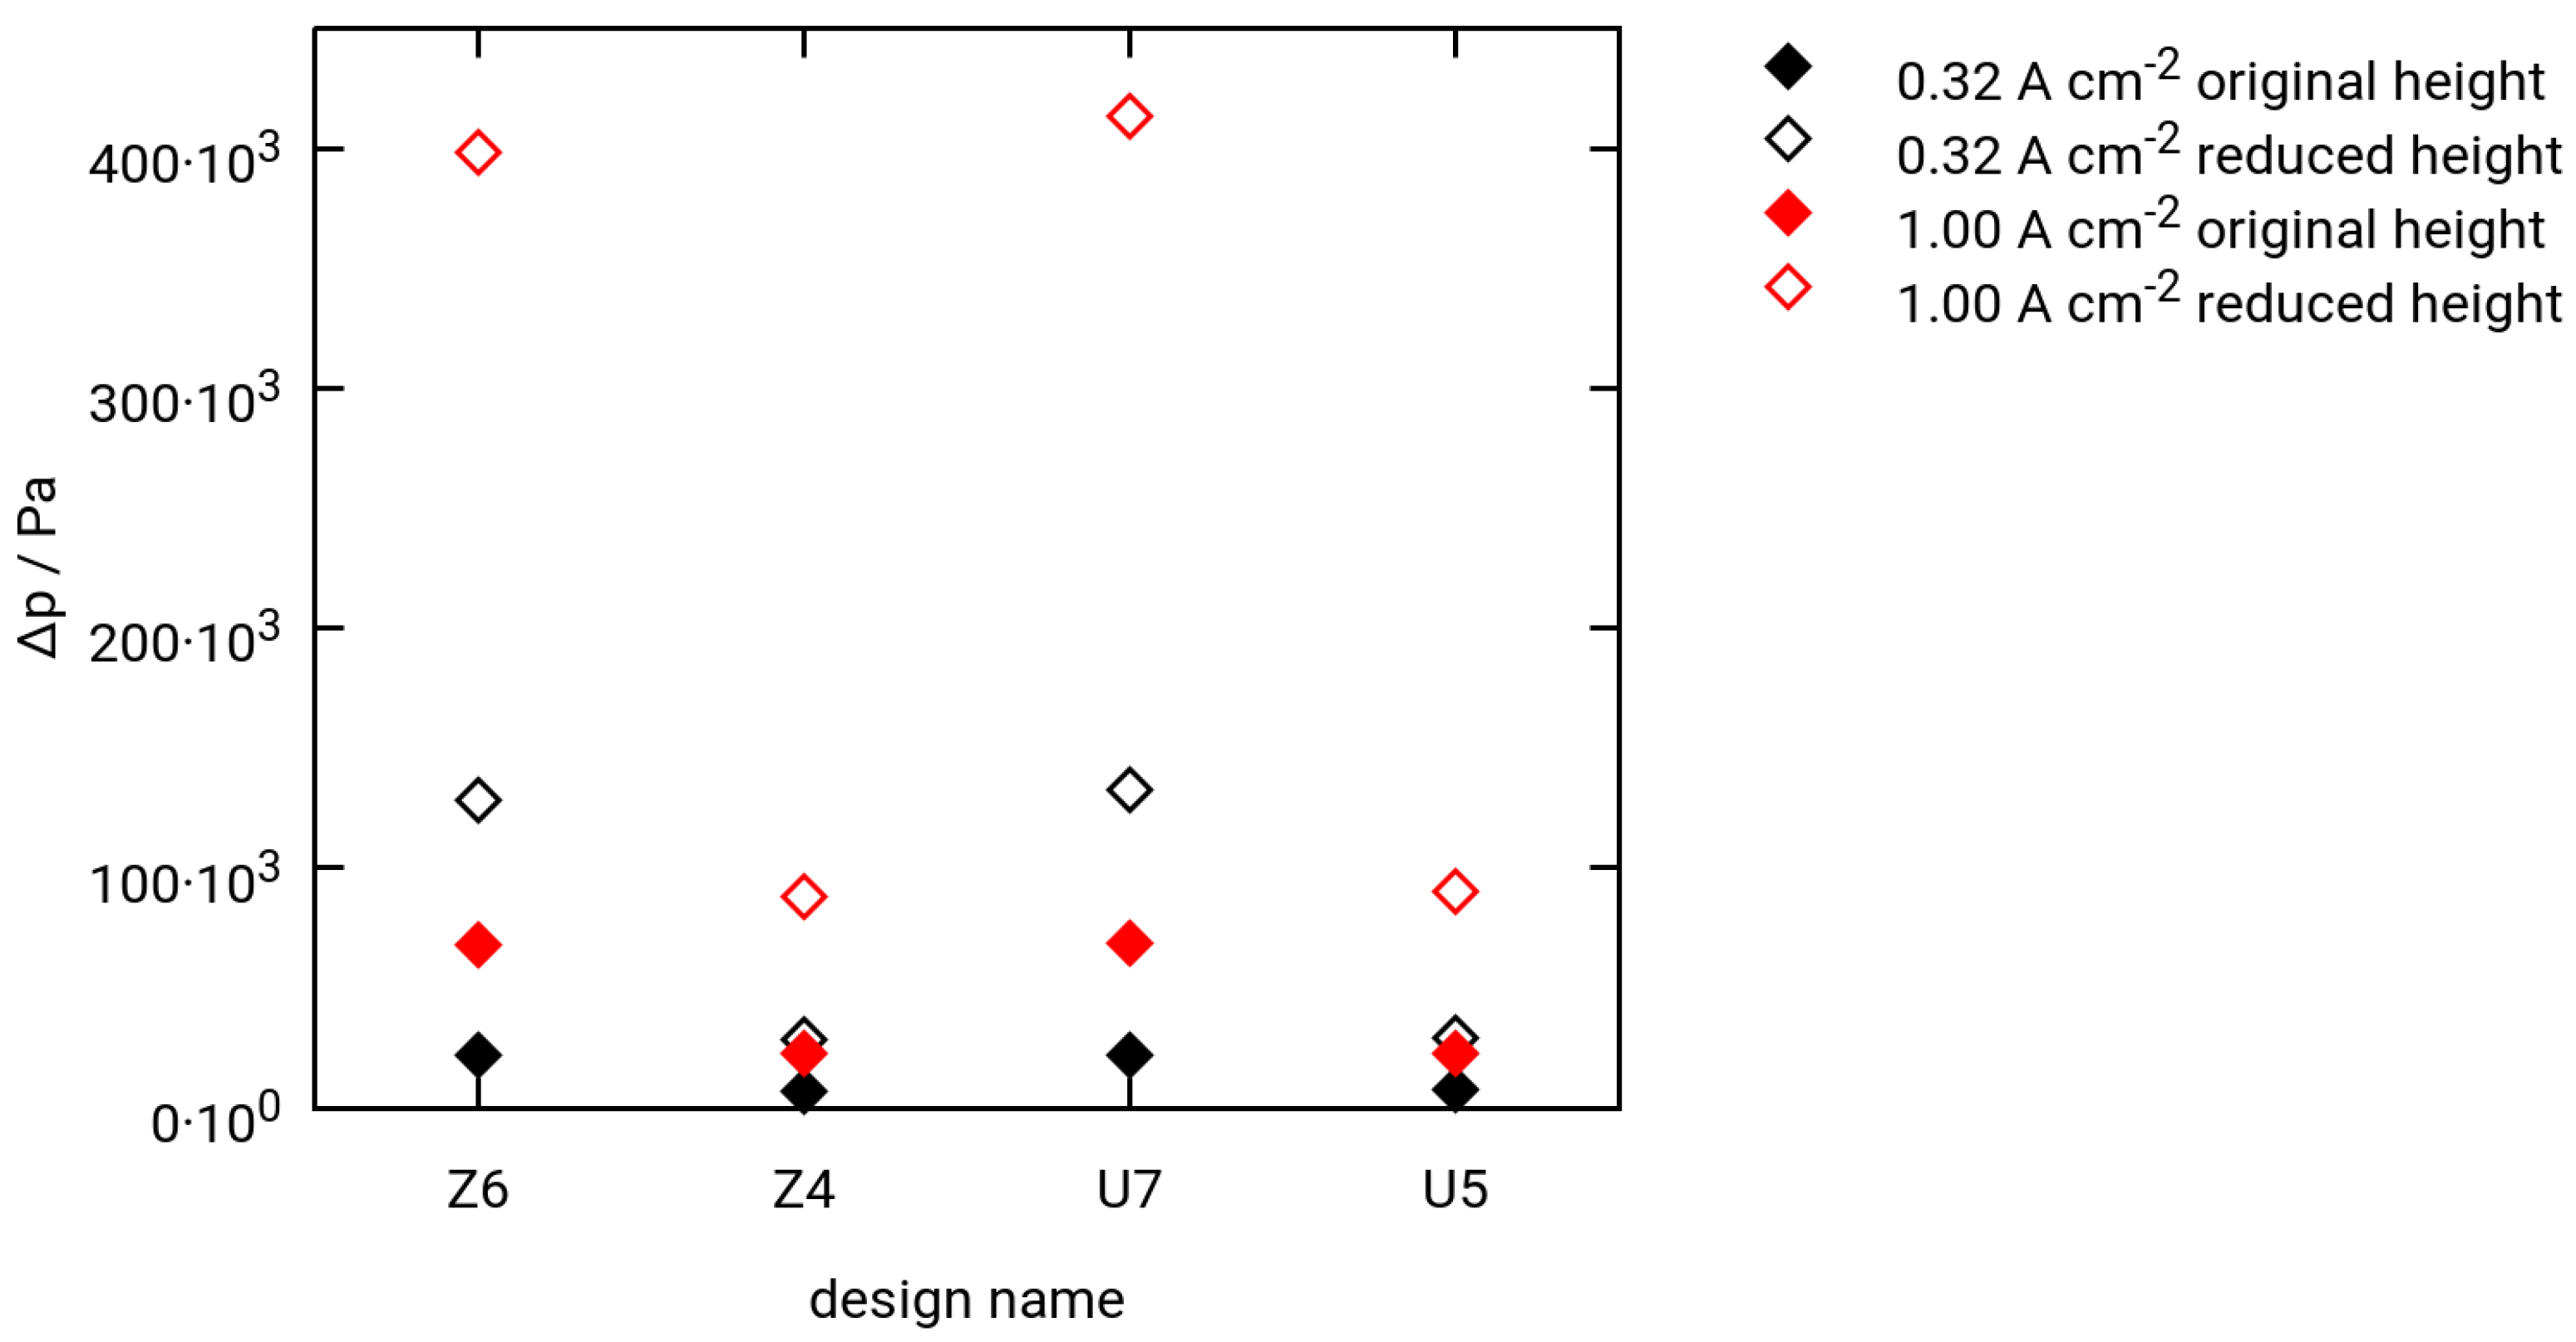
The simulation results are presented for a gas mixture that contains 50% H 2 at the feed gas inlet as defined by the goals of the MEMPHYS project (Table 1). The key question is to derive a minimum channel height for the flow field plates. For this purpose, eight different plates (see Table 5 and Figure 7) were used for the simulation of hydrogen extraction in a high energy efficiency mode, i.e., at an average current density of 0.32 A cm 2 . These conditions lead to an overall laminar flow regime with typical Reynolds numbers of Re = 10 to Re = 20 calculated at the channel inlet. Figure 12 shows the resulting uniformity parameter f y for the hydrogen mole fraction at the outlet of the plate as defined by Equation (9). The hydrogen extraction level is increased from 80% to 99%. Especially in the case of 99% hydrogen extraction, the serpentine effect (as discussed in Section 3.1) leads to a strong non-uniformity in the outlet concentrations. In that case, the outermost channels receive more gas because of the cross-over effect under the land area. The innermost channels are depleted of hydrogen and the strong concentration gradient leads to in-plane diffusion of hydrogen in order to fulfill the boundary condition of the constant current density. Under these severe conditions, the Z-type flow field with the larger channels shows the best performance (Z4H0). In the case of moderate hydrogen extraction levels of 80% and 95%, all design variants show an even flow distribution, i.e., small values for f y in Figure 12. In general, the Z-type flow fields lead to slightly more homogeneous distributions under the given flow conditions. The effect of a smaller channel height seems to have only a minor influence on the homogeneity under moderate operating conditions.
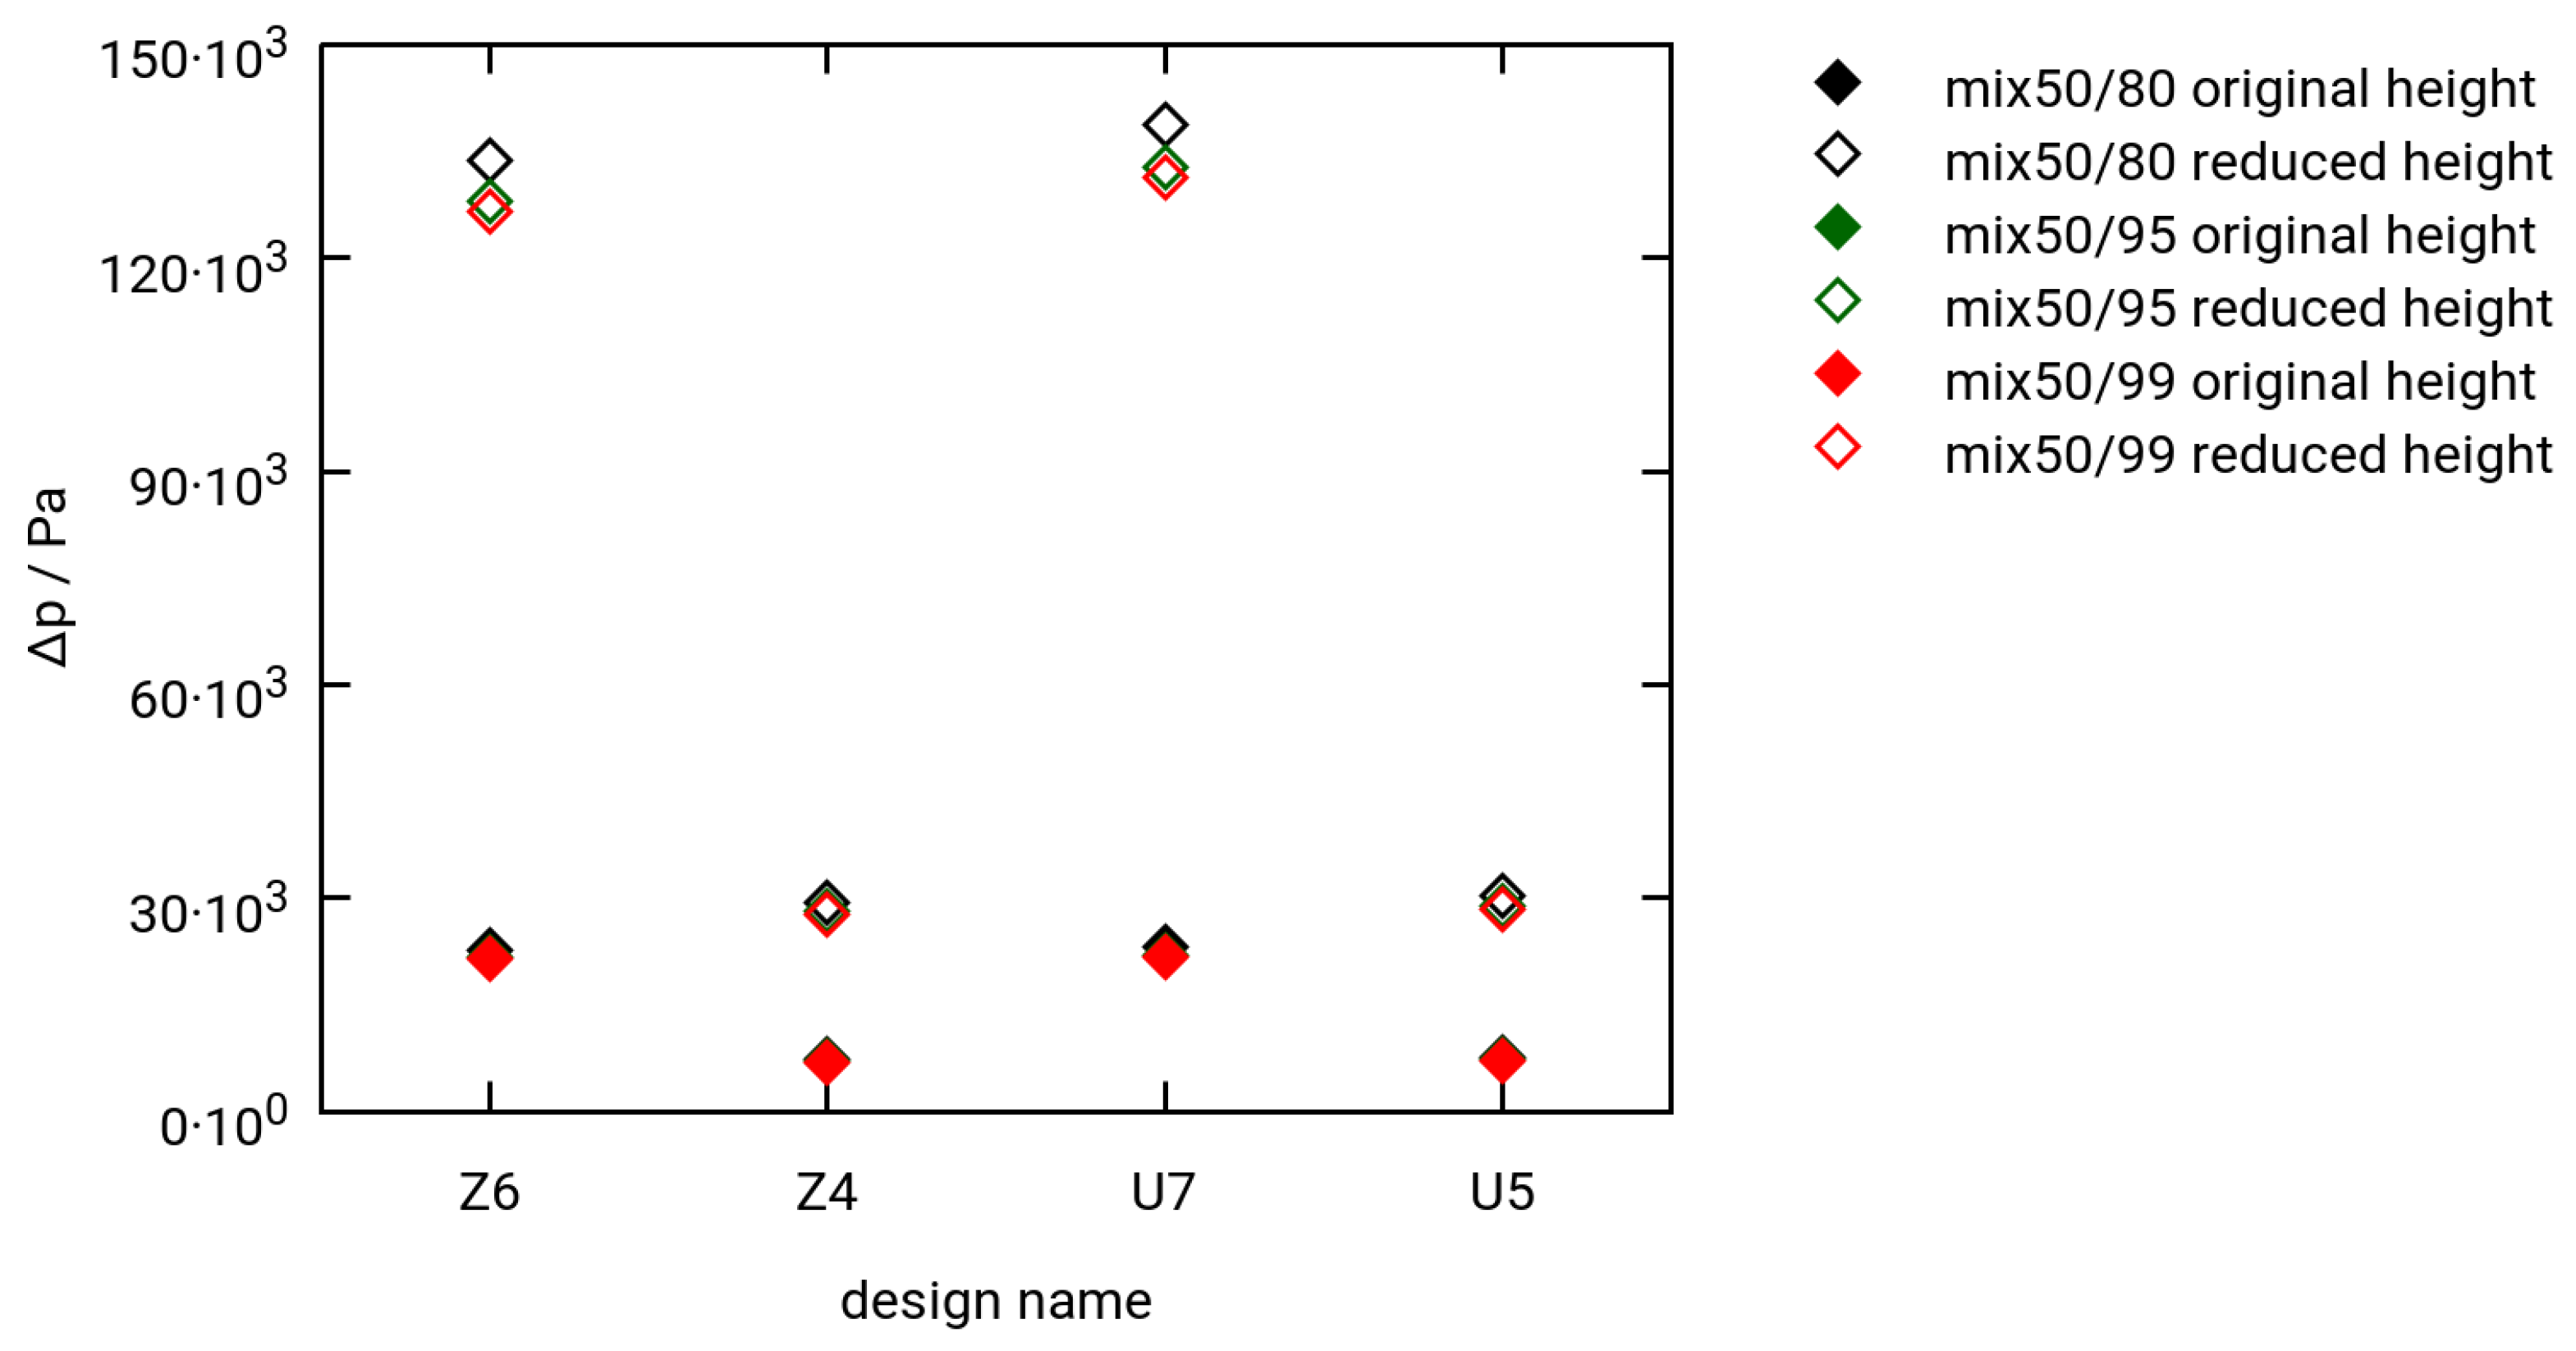
The corresponding pressure differences are shown in Figure 13. In the case of the original channel heights, all four design variants yield comparable values of Δ p . For plates with smaller channels (Z6H1 and U7H1) and decreased channel heights, the values of Δ p increases dramatically. It can be concluded that, in the case of small deformations due to compression effects, these plates will fail. At this point, it should be noted that the amount of height reduction was chosen arbitrarily to be 0.2 mm. This value derives from practical considerations from former fuel cell experiments. At the same time, the tolerances coming from the plate manufacturing process or the cell assembly may also fall in this range. Overall, the reduction by 0.2 mm in channel height is a worst case estimation.
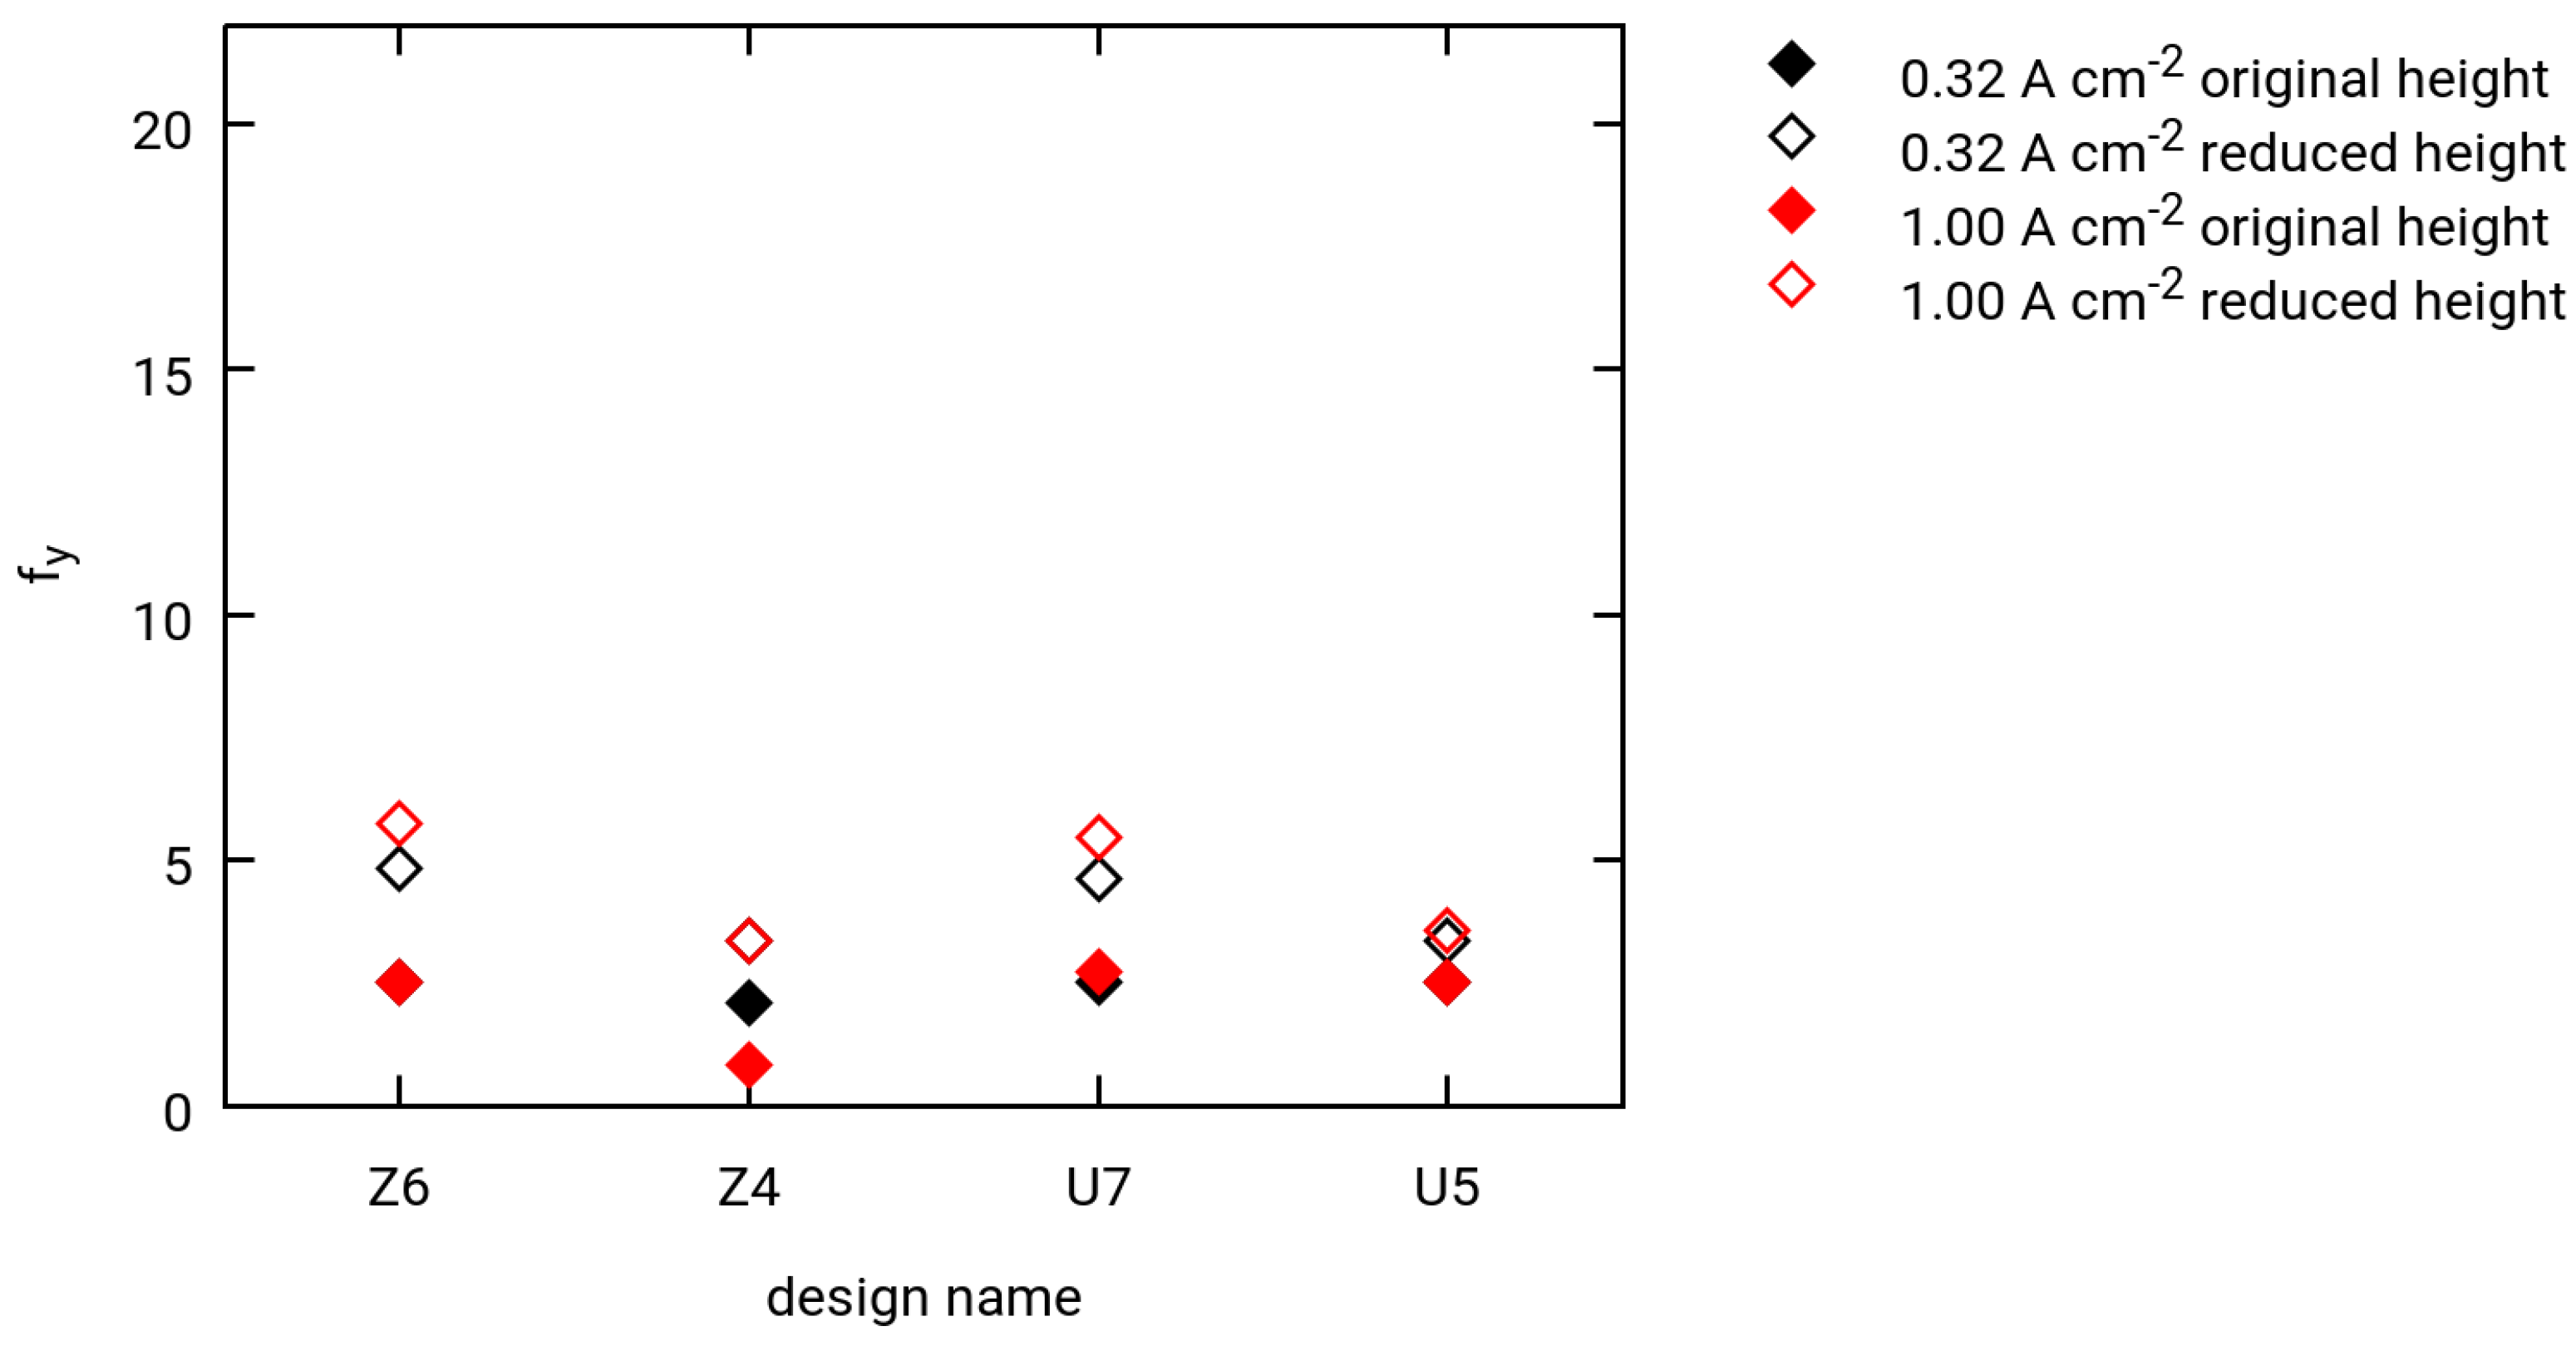
As mentioned above, it should also be possible to operate the EHC cell in high yield mode at an average current density of 1.0 A cm 2 . In this case, the flowrate increases by a factor of three and, ideally, the plates should also work under these conditions. Figure 14 and Figure 15 show the results for an inlet gas composition of 50% H 2 whereof 95% is extracted. The uniformity of the flow distribution seems not to be affected by the increased flow rate, as shown in Figure 14. The results above already showed an increased pressure difference for the combination of small channels with reduced height. The same effect can be observed in Figure 15, where the values of the design Z6H1 and U7H1 increase dramatically.

4. Conclusions

The design of a flow field plate goes through several stages. In the case of metallic bipolar plates, the material and its thickness must be chosen, which in turn affect the feasibility of channel cross sections. The present work combines automated mesh generation with an equivalent channel cross section model in order to explore the best choice for a given application. The example target application is a metallic flow field plate for a hydrogen compression and purification device. The major question to be answered is: What is the minimum channel height for serpentine-like flow fields? A sevenfold parallel serpentine configuration was used to evaluate the influence of the overall flow distribution and pressure difference of the plates. The cross-over flow under the land area is a major effect for serpentine flow fields. In this specific application, the height of the channels approach the height of the porous transport layer. There is a critical limit for the channel height in combination with the permeability of the porous transport layer. Above the limit, the in-plane flow distribution mainly occurs through the channels and the flow field exhibits a small pressure difference. Below this limit, the flow significantly enters the porous transport layer. Under these circumstances, the pressure difference of the plate increases dramatically and the quality of the overall flow distribution decreases. For the given application, the minimum channel height is 0.3 mm. The flow field plate and porous transport layer commonly undergo a certain deformation during assembly and cell operation. Additionally, the influence of the production tolerances of the plates should be considered. To take these effects into account, an additional safety margin is derived and the channel height of 0.5 mm is proposed for robust operation.

Supplementary Materials

The following are available online at https://www.mdpi.com/2305-7084/3/4/85/s1.

Author Contributions

Conceptualization, G.N. and L.F.J.M.R.; methodology, D.F. and S.B.B.; software, U.R., S.Z. and S.B.B.; formal analysis, G.N. and L.F.J.M.R.; resources, W.L.; writing–original draft preparation, U.R.; writing–review and editing, U.R.; supervision, W.L.; funding acquisition, D.F. and U.R.

Funding

The authors acknowledge financial support through the project MEMPHYS (grant agreement number 735533) within the framework of the Fuel Cells and Hydrogen 2 Joint Undertaking under the European Union’s Horizon 2020 research and innovation program, Hydrogen Europe and Hydrogen Europe research.

Acknowledgments

The authors thank Martijn Mulder and Albert Bos from HyET Hydrogen for the extensive discussion.

Conflicts of Interest

The authors declare no conflicts of interest.

References

  1. Sreedhar, I.; Kamani, K.M.; Kamani, B.M.; Reddy, B.M.; Venugopal, A. A Bird’s Eye view on process and engineering aspects of hydrogen storage. Renew. Sustain. Energy Rev. 2018, 91, 838–860. [Google Scholar] [CrossRef]
  2. Abdalla, A.M.; Hossain, S.; Nisfindy, O.B.; Azad, A.T.; Dawood, M.; Azad, A.K. Hydrogen production, storage, transportation and key challenges with applications: A review. Energy Convers. Manag. 2018, 165, 602–657. [Google Scholar] [CrossRef]
  3. MEMPHYS—Membrane Based Purification of Hydrogen System. 2017. Available online: http://www.memphys.eu/ (accessed on 30 July 2019).
  4. Fuel Cells and Hydrogen Joint Undertaking: Project MEMPHYS. 2017. Available online: https://www.fch.europa.eu/project/membrane-based-purification-hydrogen-system (accessed on 30 July 2019).
  5. Abdulla, A.; Laney, K.; Padilla, M.; Sundaresan, S.; Benziger, J. Efficiency of hydrogen recovery from reformate with a polymer electrolyte hydrogen pump. AIChE J. 2011, 57, 1767–1779. [Google Scholar] [CrossRef]
  6. Schorer, L.; Schmitz, S.; Weber, A. Membrane based purification of hydrogen system (MEMPHYS). Int. J. Hydrog. Energy 2019, 44, 12708–12714. [Google Scholar] [CrossRef]
  7. Rochlitz, L.; Steinberger, M.; Oechsner, R.; Weber, A.; Schmitz, S.; Schillinger, K.; Wolff, M.; Bayler, A. Second use or recycling of hydrogen waste gas from the semiconductor industry—Economic analysis and technical demonstration of possible pathways. Int. J. Hydrog. Energy 2019, 44, 17168. [Google Scholar] [CrossRef]
  8. Lee, H.K.; Choi, H.Y.; Choi, K.H.; Park, J.H.; Lee, T.H. Hydrogen separation using electrochemical method. J. Power Sources 2004, 132, 92–98. [Google Scholar] [CrossRef]
  9. Onda, K.; Ichihara, K.; Nagahama, M.; Minamoto, Y.; Araki, T. Separation and compression characteristics of hydrogen by use of proton exchange membrane. J. Power Sources 2007, 164, 91. [Google Scholar] [CrossRef]
  10. Bouwman, P. Fundamentals of Electrochemical Hydrogen Compression. In PEM Electrolysis for Hydrogen Production—Principles and Applications; Bessarabov, D., Wang, H., Li, H., Zhao, N., Eds.; CRC Press: Boca Raton, FL, USA, 2015; p. 269. [Google Scholar] [CrossRef]
  11. Bouwman, P.J. Advances In Electrochemical Hydrogen Compression And Purification. ECS Trans. 2016, 75, 503–510. [Google Scholar] [CrossRef]
  12. Matsuura, T.; Kato, M.; Hori, M. Study on metallic bipolar plate for proton exchange membrane fuel cell. J. Power Sources 2006, 161, 74–78. [Google Scholar] [CrossRef]
  13. Peng, L.; Lai, X.; Liu, D.; Hu, P.; Ni, J. Flow channel shape optimum design for hydroformed metal bipolar plate in PEM fuel cell. J. Power Sources 2008, 178, 223–230. [Google Scholar] [CrossRef]
  14. Jung, S.P.; Lee, C.; Chen, C.C.; Chang, W.S.; Yang, C.C. Development of novel proton exchange membrane fuel cells using stamped metallic bipolar plates. J. Power Sources 2015, 283, 429–442. [Google Scholar] [CrossRef]
  15. Janßen, H.; Edelmann, A.; Mildebrath, T.; Müller, P.; Lehnert, W.; Stolten, D. Design and experimental validation of an HT-PEFC stack with metallic BPP. Int. J. Hydrog. Energy 2018, 43, 18488–18497. [Google Scholar] [CrossRef]
  16. Tawfik, H.; Hung, Y.; Mahajan, D. Metal bipolar plates for PEM fuel cell—A review. J. Power Sources 2007, 163, 755–767. [Google Scholar] [CrossRef]
  17. Karimi, S.; Fraser, N.; Roberts, B.; Foulkes, F.R. A Review of Metallic Bipolar Plates for Proton Exchange Membrane Fuel Cells: Materials and Fabrication Methods. Adv. Mater. Sci. Eng. 2012, 2012, 828070. [Google Scholar] [CrossRef]
  18. Peng, L.; Yi, P.; Lai, X. Design and manufacturing of stainless steel bipolar plates for proton exhcange membrane fuel cells. Int. J. Hydrog. Energy 2014, 39, 21127–21153. [Google Scholar] [CrossRef]
  19. Taherian, R. A review of composite and metallic bipolar plates in proton exchange membrane fuel cell: Materials, fabrication, and material selection. J. Power Sources 2014, 265, 370–390. [Google Scholar] [CrossRef]
  20. Mahabunphachai, S.; Cora, Ö.S.; Koç, M. Effect of manufacturing processes on formability and surface topography of proton exchange membrane fuel cell metallic bipolar plates. J. Power Sources 2010, 195, 5269–5277. [Google Scholar] [CrossRef]
  21. Xu, Z.; Peng, L.; Yi, P.; Lai, X. An investigation on the formability of sheet metals in the micro/meso scale hydroforming process. Int. J. Mech. Sci. 2019, 150, 265–276. [Google Scholar] [CrossRef]
  22. Khatir, F.A.; Elyasi, M.; Ghadikolaee, T.H.; Hosseinzadeh, M. Evaluation of effective parameters on stamping of metallic bipolar plates. Proced. Eng. 2017, 183, 322–329. [Google Scholar] [CrossRef]
  23. Chen, T.C.; Lin, J.C.; Lee, R.M. Analysis of deep drawing process for stainless steel micro-channel array. Materials 2017, 10, 423. [Google Scholar] [CrossRef]
  24. Hu, Q.; Zhang, D.; Fu, H. Effect of flow-field dimensions on the formability of Fe-Ni-Cr alloys as bipolar plate for PEM (proton exchange membrane) fuel cell. Energy 2015, 83, 156–163. [Google Scholar] [CrossRef]
  25. Xu, Y.; Peng, L.; Yi, P.; Lai, X. Analysis of the flow distribution for thin stamped bipolar plates with tapered channel shape. Int. J. Hydrog. Energy 2016, 41, 5084–5095. [Google Scholar] [CrossRef]
  26. Imbrioscia, G.M.; Fasoli, H.J. Simulation and study of proposed modifications over straight-parallel flow field design. Int. J. Hydrog. Energy 2014, 39, 8861–8867. [Google Scholar] [CrossRef]
  27. Hu, P.; Peng, L.; Zhang, W.; Lai, X. Optimization design of slotted-interdigitated channel for stamped thin metal bipolar plate in proton exchange membrane fuel cell. J. Power Sources 2009, 187, 407–414. [Google Scholar] [CrossRef]
  28. Iranzo, A.; Rosa, F.; Pino, J. A simulation tool for geometrical analysis and Optimization of fuel cell bipolar plates: Development, validation and results. Energies 2009, 2, 582–594. [Google Scholar] [CrossRef]
  29. OpenFOAM—The open source CFD toolbox/ESI Group. 2019. Available online: https://www.openfoam.com/ (accessed on 30 July 2019).
  30. OpenFOAM—The OpenFOAM Foundation. 2019. Available online: https://openfoam.org/ (accessed on 30 July 2019).
  31. Kocha, S.S.; Yang, J.D.; Yi, J.S. Characterization of Gas Crossover and Its Implications in PEM Fuel Cells. AIChE J. 2006, 52, 1916–1925. [Google Scholar] [CrossRef]
  32. Ibeh, B.; Gardner, C.; Ternan, M. Separation of hydrogen from a hydrogen/methane mixture using a PEM fuel cell. Int. J. Hydrog. Energy 2007, 32, 908–914. [Google Scholar] [CrossRef]
  33. Gardner, C.L.; Ternan, M. Electrochemical separation of hydrogen from reformate using PEM fuel cell technology. J. Power Sources 2007, 171, 835–841. [Google Scholar] [CrossRef]
  34. Barbir, F.; Görgün, H. Electrochemical hydrogen pump for recirculation of hydrogen in a fuel cell stack. J. Appl. Electrochem. 2007, 37, 359–365. [Google Scholar] [CrossRef]
  35. Rohland, B.; Eberle, K.; Ströbel, R.; Scolta, J.; Garche, J. Electrochemical hydrogen compressor. Electrochim. Acta 1998, 43, 3841–3846. [Google Scholar] [CrossRef]
  36. Ströbel, R.; Oszcipok, M.; Fasil, M.; Rohland, B.; Jörissen, L.; Garche, J. The compression of hydrogen in an electrochemical cell based on a PE fuel cell design. J. Power Sources 2002, 105, 208–215. [Google Scholar] [CrossRef]
  37. Grigoriev, S.A.; Shtatniy, I.G.; Millet, P.; Porembsky, V.I.; Fateev, V.N. Description and characterization of an electrochemical hydrogen compressor/concentrator based on solid polymer electrolyte technology. Int. J. Hydrog. Energy 2011, 36, 4148–4155. [Google Scholar] [CrossRef]
  38. Janssen, G.J.M.; Overvelde, M.L.J. Water transport in the proton-exchange-membrane fuel cell: Measurements of the effective drag coeffcient. J. Power Sources 2001, 101, 117–125. [Google Scholar] [CrossRef]
  39. Yan, Q.; Toghiani, H.; Wu, J. Investigation of water transport through membrane in a PEM fuel cell by water balance experiments. J. Power Sources 2006, 158, 316–325. [Google Scholar] [CrossRef]
  40. Weber, A.; Borup, R.L.; Darling, R.M.; Das, P.K.; Dursch, T.J.; Gu, W.; Harvey, D.; Kusoglu, A.; Litster, S.; Mench, M.M.; et al. A Critical Review of Modeling Transport Phenomena in Polymer-Electrolyte Fuel Cells. J. Electrochem. Soc. 2014, 161, F1254–F1299. [Google Scholar] [CrossRef] [Green Version]
  41. Reimer, U.; Ehlert, J.; Janßen, H.; Lehnert, W. Water distribution in high temperature polymer electrolyte fuel cells. Int. J. Hydrog. Energy 2016, 41, 1837–1845. [Google Scholar] [CrossRef]
  42. Thomassen, M.; Sheridan, E.; Kvello, J. Electrochemical hydrogen separation and compression using polybenzimidazole (PBI) fuel cell technology. J. Nat. Gas Sci. Eng. 2010, 2, 229–234. [Google Scholar] [CrossRef]
  43. Li, Q.; Aili, D.; Hjuler, H.A.; Jensen, J.O. (Eds.) High Temperature Polymer Electrolyte Membrane Fuel Cells; Springer: Cham, Switzerland; Heidelberg, Germany; New York, NY, USA; Dordrecht, The Netherlands; London, UK, 2016. [Google Scholar] [CrossRef]
  44. Nordio, M.; Rizzi, F.; Manzolini, G.; Mulder, M.; Raymakers, L.; Van Sint Annalanda, M.; Gallucci, F. Experimental and modelling study of an electrochemical hydrogen compressor. Chem. Eng. J. 2019, 369, 432–442. [Google Scholar] [CrossRef]
  45. NIST Chemistry WebBook. 2019. Available online: https://webbook.nist.gov/chemistry/fluid/ (accessed on 30 July 2019).
  46. Casati, C.; Longhi, P.; Zanderighi, L.; Bianchi, F. Some fundamental aspects in electrochemical hydrogen purification/compression. J. Power Sources 2008, 180, 103–113. [Google Scholar] [CrossRef]
  47. El-kharouf, A.; Mason, T.J.; Brett, D.J.L.; Pollet, B.G. Ex-situ characterisation of gas diffusion layers for proton exchange membrane fuel cells. J. Power Sources 2012, 218, 393–404. [Google Scholar] [CrossRef] [Green Version]
  48. Froning, D.; Brinkmann, J.; Reimer, U.; Schmidt, V.; Lehnert, W.; Stolten, D. 3D analysis, modeling and simulation of transport processes in compressed fibrous microstructures, using the Lattice Boltzmann method. Electrochim. Acta 2013, 110, 325–334. [Google Scholar] [CrossRef] [Green Version]
  49. Kim, A.R.; Jung, H.M.; Um, S. An engineering approach to optimal metallic bipolar plate designs reflecting gas diffusion layer compression effects. Energy 2014, 66, 50–55. [Google Scholar] [CrossRef]
  50. Zhang, X.M.; Zhang, X.X. Impact of Compression on Effective Thermal Conductivity and Diffusion Coefficient of Woven Gas Diffusion Layers in Polymer Electrolyte Fuel Cells. Fuel Cells 2014, 14, 303–311. [Google Scholar] [CrossRef]
  51. Froning, D.; Junliang, Y.; Gaiselmann, G.; Reimer, U.; Manke, I.; Schmidt, V.; Lehnert, W. Impact of compression on gas transport in non-woven gas diffusion layers of high temperature polymer electrolyte fuel cells. J. Power Sources 2016, 318, 26–34. [Google Scholar] [CrossRef]
  52. SALOME—The Open Source Integration Platform for Numerical Simulation. 2019. Available online: https://salome-platform.org/ (accessed on 30 July 2019).
  53. Pharoah, J.G. On the permeability of gas diffusion media used in PEM fuel cells. J. Power Sources 2005, 144, 77–82. [Google Scholar] [CrossRef]
  54. Shimpalee, S.; Van Zee, J.W. Numerical studies on rib & channel dimension of flow-field on PEMFC performance. Int. J. Hydrog. Energy 2007, 32, 842–856. [Google Scholar] [CrossRef]
  55. Baek, S.M.; Jeon, D.H.; Kim, C.J. Pressure drop and flow distribution characteristics of single and parallel serpentine flow fields for polymer electrolyte membrane fuel cells. J. Mech. Sci. Technol. 2012, 26, 2995–3006. [Google Scholar] [CrossRef]
  56. Suresh, P.V.; Jayanti, S. Peclet number analysis of cross-flow in porous gas diffusion layer of polymer electrolyte membrane fuel cell (PEMFC). Environ. Sci. Pollut. Res. 2016, 23, 20120–20130. [Google Scholar] [CrossRef]
  57. Wang, C.; Zhang, Q.; Shen, S.; Yan, X.; Zhu, F.; Cheng, X.; Zhang, J. The respective effect of under-rib convection and pressure drop of flow fields on the performance of PEM fuel cells. Sci. Rep. 2017, 7, 43447. [Google Scholar] [CrossRef]
  58. Zhang, S.; Reimer, U.; Beale, S.B.; Lehnert, W.; Stolten, D. Modeling polymer electrolyte fuel cells: A high precision analysis. Appl. Energy 2019, 233–234, 1094–1103. [Google Scholar] [CrossRef]
  59. Dicks, A.L. The role of carbon in fuel cells. J. Power Sources 2006, 156, 128–141. [Google Scholar] [CrossRef]
  60. Hartnig, C.; Jörissen, L.; Kerres, J.; Lehnert, W.; Scholta, J. Polymer electrolyte membrane fuel cells. In Materials for Fuel Cells; Gasik, M., Ed.; CRC Press: Boca Raton, FL, USA; Boston, MA, USA; London, UK; New York, NY, USA, 2008; pp. 101–184. [Google Scholar] [CrossRef]
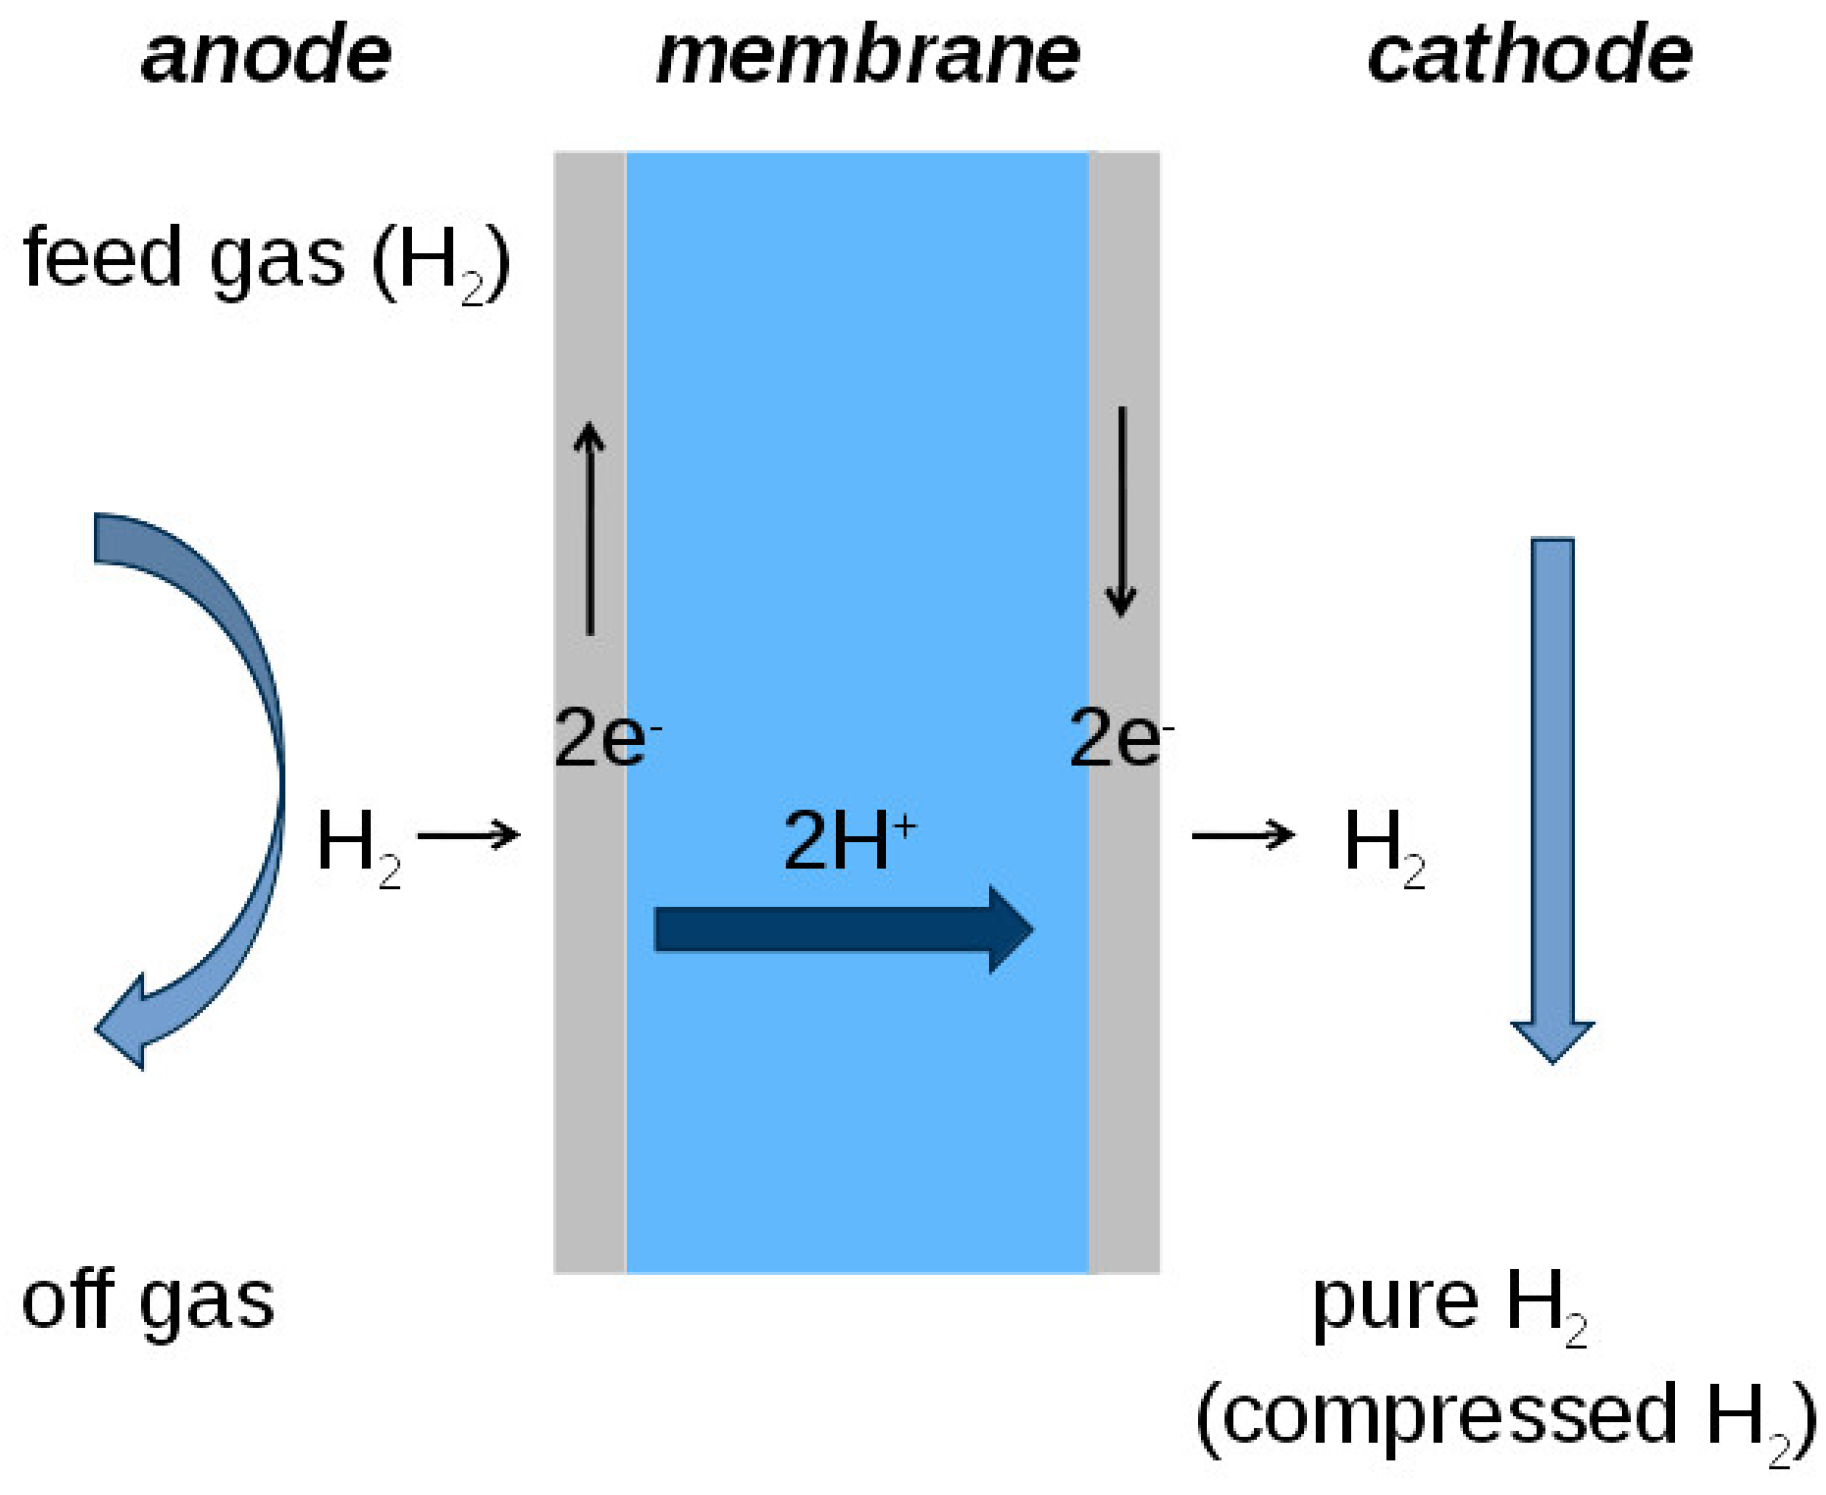
Figure 1. Sketch of the cross section of an electrochemical hydrogen purification and compression cell.
Chemengineering 03 00085 g001
Figure 2. Computational domain for the anode flow field plate.
Chemengineering 03 00085 g002
Figure 3. Expected deviation from the average current density based on the inlet and outlet gas concentrations.
Chemengineering 03 00085 g003
Figure 4. Cross section of: (a) the metal sheet; (b) the formed channel; and (c) the equivalent model geometry.
Chemengineering 03 00085 g004
Figure 5. Four basic shapes for a serpentine flow field.
Chemengineering 03 00085 g005
Figure 6. Example flow field with two channels and “Z” type configuration.
Chemengineering 03 00085 g006
Figure 7. Flow field variants from Table 5: “Z” type and “U” type flow configuration with two different channel widths. Different channel heights H0 and H1 are not shown.
Chemengineering 03 00085 g007
Figure 8. Sketch of the velocity distribution depicting the cross flow under the land area in serpentine flow fields. The velocity inside the porous layer is shown for a cross-section at half of the thickness.
Chemengineering 03 00085 g008
Figure 9. Distribution of the mole fraction of hydrogen at the outlet of case Z6H1 at 50% H 2 in the inlet gas stream and an average current density of 0.32 A cm 2 . The porous transport layer is shown on top of the channels, i.e., the interface for H 2 extraction is facing upwards.
Chemengineering 03 00085 g009
Figure 10. Pressure difference of the plate U7H0 as a function of the mesh resolution (mix50/80 = 50% H 2 from which 80% is extracted and mix20/99 = 20% H 2 from which 99% is extracted).
Chemengineering 03 00085 g010
Figure 11. Pressure difference between the inlet and outlet for U7H0 and U7H1 with increasing permeability from left to right. The inlet gas stream contains 20% H 2 from which 99% is extracted.
Chemengineering 03 00085 g011
Figure 12. Uniformity parameter f y for the hydrogen mole fraction at the outlet of the seven channels from the plate (see Equation (9)).
Chemengineering 03 00085 g012
Figure 13. Pressure difference between the inlet and outlet of the plate.
Chemengineering 03 00085 g013
Figure 14. Uniformity parameter f y for the hydrogen mole fraction at the outlet of the seven channels. The inlet gas mixture contains 50% H 2 from which 95% is extracted.
Chemengineering 03 00085 g014
Figure 15. Pressure difference between the inlet and outlet of the plate for a gas mixture of 50% H 2 from which 95% is extracted.
Chemengineering 03 00085 g015
Table 1. Reference operating scenario from the MEMPHYS project [3,4].
ParameterValueComment
Feed gas pressure1 bar 10 5  Pa, i.e., not pressurized
H 2 outlet pressure200 bar 200 · 10 5  Pa
Feed gas compositiongas mix containing 50% H 2
H 2 recovery95%or better
Operating temperature295 Kfrom test cell
Ohmic resistance0.5  Ω  cm 2 fitted
Table 2. Physical parameters for the gas mixture model at T = 295  K and p = 101,325  Pa.
ParameterValueReference
Density82.622 g m 3 ideal gas law
Dynamic viscosity 8.800 · 10 6  Pa s[45]
Kinematic viscosity 1.065 · 10 4  m 2  s 1 calculated
Effective diffusion coefficient 41.000 · 10 6  m 2  s 1 [46]
Table 3. Properties of the porous transport layer [47,48].
ParameterValue
in-plane permeability (x) 10 12  m 2
in-plane permeability (y) 10 12  m 2
through-plane permeability (z) 10 13  m 2
overall thickness 3 · 10 4  m
Table 4. Channel geometry of the trapezoidal shape.
a/mm0.801.001.201.401.601.802.00
b/mm0.500.600.750.881.001.131.25
h max /mm0.270.350.410.470.540.610.68
A c (max)/mm 2 0.180.280.400.540.710.891.10
h/mm0.250.250.350.400.450.500.55
A c /mm 2 0.160.200.340.460.590.730.89
d h /mm0.350.360.490.560.640.710.78
Table 5. Model flow field variants with seven parallel serpentine channels and an active cell area of 100 cm 2 .
“Z” Configuration“U” Configuration
channel width/mm1.141.461.141.46
U turns6475
resulting overall length/mm111.72102.20127.70123.48
flow field width/mm89.5097.8078.3081.00
channel height h 0 /mm0.400.500.400.50
channel height h 1 /mm0.200.300.200.30
model name in resultsZ6H0/Z6H1Z4H0/Z4H1U7H0/U7H1U5H0/U5H1
Table 6. Summary of the mesh sizes used for flow field U7H0.
Channel Resolution/CellsTotal Mesh Size/CellsComp. Time/h
6 × 4876,7200.9
8 × 51,987,4404.2
10 × 63,656,6046.9
12 × 86,979,5049.2
Table 7. Variation of the permeability of the porous transport layer.
Variantin-plane/m 2 through-plane/m 2
p1 1.0 · 10 13 1.0 · 10 14
p2 0.5 · 10 12 0.5 · 10 12
pp 1.0 · 10 12 1.0 · 10 13
p3 2.0 · 10 13 2.0 · 10 13
p4 1.0 · 10 11 1.0 · 10 12