Abstract
Modeling is a powerful tool for the design and development of proton exchange membrane fuel cells (PEMFCs). This study presents a one-dimensional, two-phase mathematical model of PEMFC to investigate the two-phase transport process, gas species transport flow and water crossover fluxes. The model reduces the computational time for PEMFC design with guaranteed accuracy. Analysis results show that the concentration and activation overpotentials of the cell decrease with the increase of operation pressure, which result in enhanced cell performance. Proper oxygen stoichiometry ratio in the cathode decreases the cell activation overpotential and is favorable for performance improvement. The cell ohmic resistance correspondingly increases with the increase of catalyst layer thickness, which leads to a deteriorated cell performance. The improvement on cell performance could be facilitated by decreasing the membrane thickness. Predicted results show that the present model is a useful tool for the design optimization of practical PEMFCs.
1. Introduction
A fuel cell is an electrochemical energy converter that directly converts the chemical energy of fuel into direct current electricity [,]. Proton exchange membrane fuel cells (PEMFCs) are considered as ideal clean energy and power sources due to their high-power density and fast start-up at low temperatures [,]. Remarkable advancements have been achieved in the cost reduction, stack performance and operation life of PEMFCs in the past decades.
On the basis of the studies on heat and mass transfer mechanisms, which ultimately affect cell performance, modeling plays an important and vital part in fuel cell design and cell performance promotion. Weber and Newman [] established a 1D model to investigate thermal and water management. They obtained the optimal operating temperature and maximum power density in accordance with an external heat transfer coefficient. Caisheng Wang and M.H. Nehrir developed 1D dynamic models of solid oxide fuel cell [] and PEMFC [] in MATLAB/Simulink. Their simulation results demonstrated the accuracy of the models under steady-state and transient conditions. Fuller et al. [] and Jung and Nguyen [] investigated the thermal management and water hydrobalance by using a 2D model. Dannenberg et al. [] developed an along-the-channel mass and heat transfer model based on simplified Bulter–Volumer and Stefan–Maxwell equations. Wen et al. [] built 3D thermal models to investigate the irregular distributions of thermal sources and temperature in a single fuel cell. Berning et al. [,,] established 3D models by using CFX user-defined process and customized iteration routine to obtain the detailed thermal and water management. Liu et al. [] presented a simplified non-isothermal, single-phase model by using CFD-Micromesh, which contains 200,000 mesh elements. Askarzadeh and Coelho [] used a backtracking search algorithm combined with Burger’s chaotic map to determine the effect of each parameter on the polarization curve. Their method was effective in obtaining the nonlinearity influences caused by operational states in electrochemical processes. For the parameter selection problem of PEMFC modeling, Chakraborty et al. [] developed a differential-evolution-based solution for PEMFC stack modeling and their results were statistically significant regardless of the algorithmic parameter settings used.
Water is produced on the cathode side as the product of electrochemical reaction. Water flooding occurs, which results in low current densities and poor cell performance when water is inappropriately removed from the cell, especially from the cathode. Many researchers have investigated water management in PEMFCs. Nguyen and Knobbe [] developed a method of sequentially exhausting each individual cell. Excess water was effectively removed by providing adequate gas. Qin et al. [] reported their studies on the transport and removal of liquid water droplet at the membrane–electrode assembly (MEA) by using a volume of fluid model. Water removal could be effectively facilitated with the hydrophilic plate based on its in-between surface contact angle of the bottom channel and MEA surfaces. Liu et al. [] found that the local current density could be promoted due to the local transport enhancement of the reactant gas. The promotion was induced through the blockage effects caused by stack baffles. Jung et al. [] added hydrophilic SiO2 particles to the anode catalyst layer and found that the SiO2 facilitates the hydration and water removal on the anode and cathode, respectively.
The main design philosophy of the channels is by ensuring uniform gas distributions and gas diffusions and facilitating the efficiency of water removal. The common channel designs are straight, crisscross and serpentine. Diffusion coefficient is crucial in the pathway from the flow field channels to the catalyst layer. A series of serpentine channels was compared and evaluated in reference [] to obtain an appropriate pressure drop. Nguyen [] presented a new crisscross flow field that avoided water flooding. The reactant gases were forced to flow through the gas diffusion layer (GDL) and entered the electrodes due to the dead-ended inlet and outlet throughout where processed water could be removed. However, this condition increased the parasitic power and reduced the physical strength of the MEA.
Existing studies have focused on 2D and 3D modeling. However, these models are complicated and time consuming in most cases, which are unsuitable to the rapid design and high-efficiency optimization of PEMFCs. In this study, a 1D analytical model is built to obtain the diverse PEMFC performance influenced by structural parameters and operational limits. Thus, an integrated design program is developed, in which material selection, parameter adjustment, structure optimization and cell performance prediction are efficiently and accurately conducted.
2. Physical and Mathematical Models
2.1. Physical Problem Description
Figure 1 shows the schematic of a proton exchange membrane fuel cell. A single PEMFC is divided into an anode electrode and a cathode electrode by a proton-conducting membrane []. Hydrogen flows through porous electrodes to the anode catalyst layer to react and dissociate into protons and electrons at the anode side. The protons flow through the membrane to the cathode catalyst layer and the electrons released in the anode are transferred through an external circuit to the cathode. The chemical reaction expression at the anode is expressed as follows:
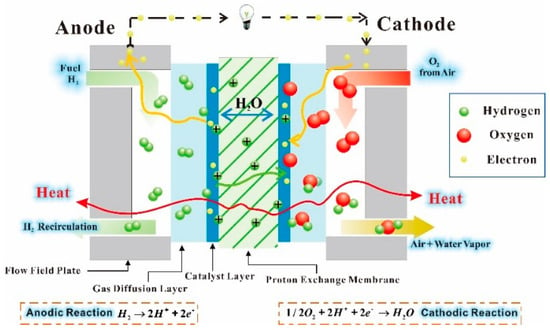
Figure 1.
Schematic of a proton exchange membrane fuel cell.
At the cathode side, the air flows through the similar porous electrodes to the cathode catalyst layer, in which oxygen reacts with the electrons from the external circuit and the protons passing through the membrane producing water and heat []. The cathodic reaction expression is expressed as follows:
The total reaction formula is given by:
A single hydrogen and air PEMFC is considered as the computational domain, which includes bipolar plate, straight flow channels, gas diffusion layers (GDLs), catalyst layers (CLs) and membrane. The major direction of mass transfer is normal to the membrane surface. The work includes major transport that affects the PEMFC behavior and ignores the minor transport, which has negligible effects on cell performance.
A fuel cell model includes macro-scale and micro-scale transport processes. Construction of a precise fuel cell model is a remarkable challenge due to the lack of experimental data. Hence, several assumptions are made in establishing a convenient model. The mass and heat transport in an isothermal model are considered to be 1D processes. It is assumed that the flow is steady state and laminar due to the small flow channel size and low flow velocities. All gases are considered to be ideal gas. The contact resistance between different layers is ignored. The porous media, such as GDLs, CLs and membranes, are considered to be isotropic and homogeneous.
2.2. Gas Transport
1D gas transport along the proton transfer direction is investigated. Similar to the assumptions in many literature [,], only diffusive transport occurs in the proton-transfer direction within the GDLs, CLs and membrane. Various gas reactants and water vapor concentrations at the CL could be obtained by considering 1D mass transport normal to the membrane surface. 1D mass transport includes major transport processes, which improves the calculation efficiency.
Humidified hydrogen is supplied to the anode and air is fed to the cathode. The gas species concentrations at the CL are obtained by considering mass transfer along the proton transfer direction. The species conservation equations are listed in Table 1.

Table 1.
Species conservation equations.
As shown in Table 1, denotes gas molar concentration at the interface and is the contact area between the flow channel and GDL. The species concentration equation is corrected by Sherwood number, Sh due to the negligible convection effect. Sh is the ratio of convective mass transfer to mass diffusion. It is equal to 2.3 in the laminar flow channel in much of the literature because the diffusion transport is dominant in the proton transfer direction [,,]. is the effective diffusivity of species i in electrode k (GDL, CL). On the basis of Bruggeman correlation, the expression of gas effective diffusivity can be expressed as []:
where is the intrinsic diffusivity []:
Assuming that the gas concentration between the GDL and CL is linear.
2.3. Liquid Water Transport
Water is produced at the cathode side due to electrochemical reaction. The water used for anode humidification is transported through the electrolyte to the cathode due to electroosmotic drag phenomenon. The model considers the transport of liquid water in the porous media. The liquid water conservation equations are presented in Table 2.

Table 2.
Liquid water conservation equations.
As shown in Table 2, is the molar mass of water molecule and is equal to 0.018 kg/mol. refers to the liquid water concentrations, in which i refers to the interface between adjacent domains and j is the anode or cathode. is the current density by producing liquid water. refers to the diffusivity of liquid water []:
where is the intrinsic permeability. is the permeability of liquid transport in the electrode considering the blockage of liquid water. Capillary pressure affects liquid water transport and is related to liquid water volume fraction (), which can be expressed as []:
denotes the electro-osmotic drag coefficient and is related with water content in the membrane []:
and represent the source terms, which are due to the evaporation or condensation between liquid water and vapor and they are calculated by:
2.4. Cell Performance
Effective work from the fuel cell could be obtained only when current is generated []. In fact, the actual output voltage is remarkably lower than that of the theoretical voltage due to irreversible losses. These irreversible losses (also called overpotentials) include activation, ohmic and concentration losses []. The output voltage of single cell due to irreversible losses is determined by:
With the reference pressure and temperature values, the Nernst equation can be modified by []:
where refers to the partial pressure of hydrogen. The gas partial pressures changes with current density [,] and could be evaluated by:
Considering that the model is assumed to be isobaric, and are equal to operating pressure . The formula of the partial pressure of oxygen could be calculated as:
Activation overpotential is due to the sluggish kinetics of electrochemical reaction []. This loss dominates at low current density. Among the two activation overpotentials, anodic activation loss could be ignored compared with cathodic activation loss because the oxygen reduction reaction requires a high overpotential []. The Butler-Volmer equation is used to describe the relationship between current density and activation overpotential. Considering that the solution of Butler-Volmer equation is difficult, it could be simplified to Tafel equation. Thus, the activation overpotential could be given by []:
Ohmic overpotential is caused by cell electrical resistance. Resistance losses are due to the ionic resistance in the electrolyte and electronic resistance flowing through the electrodes. On the basis of Ohm’s law, the voltage loss arising from the resistance of charge transport could be expressed as:
The contact resistance between different layers is ignored in which the total cell resistance is equivalent to the sum of the internal resistances of various regions. RMEM, RCL, RGDL, Rch and RBP are the potential drops. The potential drop is attributed to the ohmic resistance of different regions. The internal resistance of each region could be calculated by:
where refers to the conductivity of each region i (membrane, CL, GDL, flow channel and bipolar plate). The ion electrical conductivity of the membrane could be calculated by using an empirical correlation [].
where is the water content in the membrane and is evaluated according to []:
where water activity could be defined as []:
where is the saturation pressure of water at the operating temperature and is expressed as follows []:
Concentration overpotential is attributed to mass transport limitation. Limiting current density () is produced [] when the concentrations of reactants at the catalyst reaction sites are reduced to zero in the limiting case. The causes of reactant depletion increase the reaction rates and reduce the reactant transport rates. The concentration overpotential is expressed as the following equation []:
Table 3 lists the value for the parameters used in the present model. These parameters are related to the materials and the electrochemical properties of the PEMFC.

Table 3.
Model base parameters [,].
2.5. Boundary Conditions
A constant stoichiometry ratio mode is applied for the two reactants (hydrogen and oxygen). The concentration of gases i (H2, O2, vapor) at the inlet is calculated as:
where refers to the species molar concentration at the inlet. represents the inlet partial pressure of gas i. Considering that the reactants are consumed in the electrochemical reaction, the species molar concentration at the outlet can be calculated as follows []:
where is the interface area between the flow channel and GDL. is the porosity of GDL. is the inlet area of the flow channel. is the gas flow velocity:
where ST represents the stoichiometry ratio, which is defined as the ratio of the amount of reactant supplied to the amount of reaction to generate the current density. refers to the reaction area of CL. Species concentration distribution is assumed to be linear in the flow channel and the average value of species molar concentration can be expressed by:
The concentration of liquid water is considered to be constant in the flow channel because the straight flow channel of PEMFC is short.
3. Results and Discussion
The numerical calculation of the model is implemented in MATLAB. The comparison among the predicted polarization curve, model predictions in Ref. [] and published experimental results in Ref. [] is presented. In this section, the effects of various operating (operating pressure, oxygen stoichiometry ratio) and design parameters (CL thickness, membrane thickness) on the transport processes and cell performance are analyzed. The input physical parameters and operating conditions are shown in Table 4. The parameters in Table 4 are considered as the default values of a validation model to verify the accuracy of the proposed model. For parametric studies, one of the parameters is changed and the others are kept as their default values.

Table 4.
Cell geometric parameters and operating conditions [].
Several numerical parameters are introduced in the proposed model for calculation. These parameters, such as the effective diffusivity of gas species, capillary diffusivity of liquid water and ion electrical conductivity of the membrane, can be calculated by using empirical correlations (Equations (5)–(7), (8)–(10) and (22)), which are taken from references [,,]. The cell performance can be obtained by solving the modeling equations, including the species conservation, liquid water conservation and electrochemical kinetic equations. The polarization curves of the proposed model are plotted together with other experimental data [] and numerical model results [] at a cell temperature of 80 °C and gas pressure of 1.0 atm. The fuel cell experiments completed by Kim K.H. et al. in Ref. [] is a single cell with fabricated MEA of 0.4 mg/cm2 platinum loading for the anode and cathode layers and 25 cm2 active electrode area. The cathodic and anodic gas flow rates are controlled to obtain stoichiometric ratios of 1.5 and 2.0, respectively. The relative humidity of cathode gases and hydrogen are fixed at 100%. The single cell is operated at 80 °C under 1.0 atm pressure conditions. At the same conditions, the polarization characteristics of the model and experiment are compared. As shown in Figure 2, the present model predictions, other numerical results and experimental data are in good agreement with a maximum relative deviation of less than 5%. These results verify the accuracy of the 1D model.
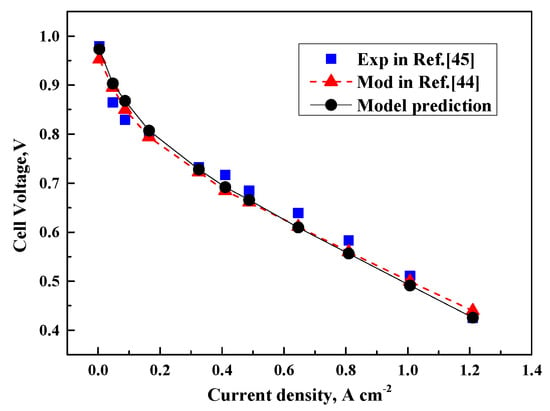
Figure 2.
Polarization curves of present prediction compared with model prediction [] and experimental data [].
3.1. Operating Pressure
The influence of operating pressure on the performance of PEMFC is evaluated. Figure 3 shows the cell performance with respect to various operating pressures. The gas inlet pressures at the anode and cathode are kept the same. As shown in Figure 3a, a high output voltage can be obtained at high pressure. This condition is because the partial pressure of the reactants increases with the increment of operating pressure, as indicated in the Nernst equation.
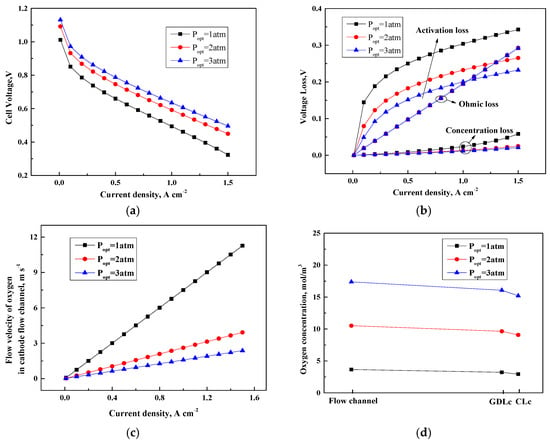
Figure 3.
Cell performance under various operating pressures. (a) Cell voltage (V); (b) Voltage loss (V); (c) Flow velocity of oxygen in the cathode flow channel (m s−1); (d) Oxygen concentration (mol/m3).
The enhancement of cell performance could be explained by investigating the response of voltage loss. Figure 3b presents three voltage losses changing with current density under three different operating pressures. The results suggest that the better performance at a high pressure is mainly due to the drop in activation overpotential. The reduction percent in activation overpotential approximately attains 25% when the pressure increases from 1 atm to 3 atm and current density is 1.0 . Although the formula of the activation overpotential does not show any pressure term, the variation of reactant concentration with pressure affects the change of activation overpotential.
As shown in Figure 3c,d, a high operating pressure indicates high reactant diffusion rates. Thus, the reactants could be rapidly replenished and the concentration of reactants is increased at the reactive site to facilitate the electrochemical processes. Furthermore, the concentration and activation overpotentials of the cell are decreased at a high pressure, which result in an enhanced cell performance. Compared with activation overpotential, the variation of concentration overpotential is negligible. Considering that the expression derived for the ohmic overpotential has no relation with operating pressure, no change is observed in the ohmic overpotential in terms of operating pressure.
In general, the cell performance could be improved by increasing the operating pressure. However, a high pressure costs additional energy from the air compressor, which ultimately offsets the voltage increments.
3.2. Oxygen Stoichiometry Ratio
Polarization curves and ohmic resistance at different current densities under various oxygen stoichiometries are shown in Figure 4. Slight oxygen stoichiometry ratio has a slight influence on cell performance, as shown in Figure 4a. This finding is due to the process simplification adopted in the present model. In general, the cell potential improves with the increase of oxygen stoichiometry due to the augmented oxygen concentration in the CL reaction sites.
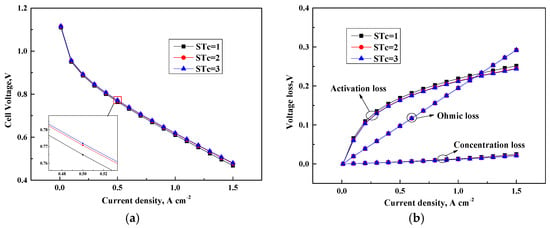
Figure 4.
Cell performance under various oxygen stoichiometry ratios. (a) Cell voltage (V); (b) Voltage loss (V).
A high oxygen stoichiometry ratio represents a high air flow rate, which rapidly replenishes the oxygen consumed by electrochemical reactions. Thus, the activation overpotential of the cell could be suppressed. Furthermore, the high flow rate of reactants leads to an effective water removal from the gas transfer channel, which prevents flooding by blocking the gas transfer channel. Then, a low water flooding in the GDL leads to a small gas transfer resistance to the CL. Therefore, the activation and concentration overpotentials could be reduced by increasing oxygen stoichiometry for a specific current density, as presented in Figure 4b. A large amount of energy should be consumed to compress the air to achieve a high oxygen stoichiometry.
3.3. Thickness of CL and Membrane
The influence of various CL thickness on the PEMFC polarization curve from the present model is investigated and displayed in Figure 5. Figure 5a shows that a thick CL causes the improvement on the cell performance at a low current density. The activation overpotential of the cell remarkably drops with the increase of the effective reaction area and CL thickness. The increment of ohmic overpotential is less than that of the decrease of activation overpotential in which the cell performance could be enhanced.
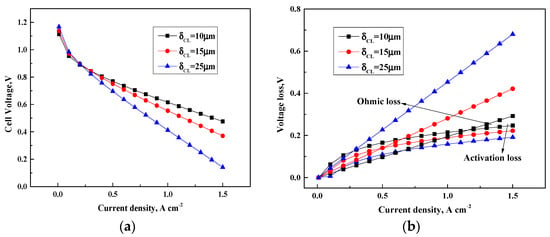
Figure 5.
Cell performance of various CL thickness. (a) Cell voltage(V); (b) Voltage loss(V).
As shown in Figure 5b, the cell output potential decreases with an increment in the CL thickness due to the limited mass diffusion rates in the CL. The results are consistent with those published in Ref. []. The variations of cell potential are mainly attributed to the variations of ohmic overpotential. The increment of CL thickness causes a long distance for the electrons and ions to arrive at the CL and the transport distance of reactants becomes long. The prolonged transport distance for reactants, electrons and ions leads to a large ohmic resistance and a low cell performance. Although the effective reaction area increases with the CL thickness, the PEMFC activation overpotential is actually not affected by the variation of CL thickness. The performance of the cell could be obviously improved with a thin CL when it operates at a high current density.
Figure 6 presents the variation of the cell output and voltage losses at three different membrane thickness. The improvement on cell performance is obtained by decreasing the membrane thickness, as shown in Figure 6a. Figure 6b indicates that the ohmic overpotential has a remarkable influence on cell potential. A thin membrane leads to a small membrane resistance for a specific current density and results in a low ohmic overpotential because the resistance for proton transport to the reaction sites is reduced. Furthermore, the increasing membrane thickness has less remarkable impact on the ohmic overpotential compared with the increasing CL thickness. This condition is because the CL thickness has dominant effects on oxygen transport from the flow channel to the cathode CL and the membrane thickness has no relation with oxygen transport. Hence, fuel cells with optimum CL and membrane thickness are designed to reduce the cost and improve the cell performance.
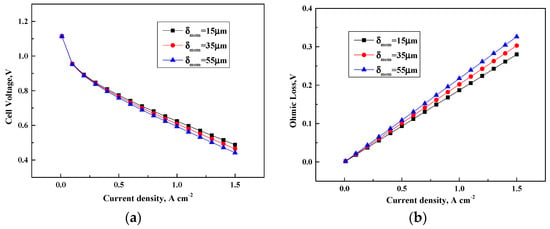
Figure 6.
Cell performance under various membrane thickness. (a) Cell voltage (V); (b) Ohmic loss (V).
4. Conclusions
A 1D two-phase mathematical model of PEMFC is presented in this study. The model reproduces the effects of the operation conditions on PEMFC performance. The results of the proposed model have a good agreement with model prediction and experimental data. The model could reduce computational time for the design of PEMFCs with guaranteed accuracy. The results indicate that a high operating pressure results in a high diffusion rates of oxygen through the GDL to the CL and the ohmic and activation losses are reduced to enhance the cell performance. The cell performance is continuously improved with the increase of oxygen stoichiometry ratio from 1 to 3 because considerable oxygen are diffused in the CL for electrochemical reaction, which result in a decreased activation loss. Decreasing the catalyst and membrane thickness generally improves the cell performance. The transport distance of ion, electron and reactants becomes long with the increase of catalyst and membrane thickness, which leads to a large ohmic resistance associated with deteriorated cell performance.
Author Contributions
Conceptualization, Y.Y. and Z.Q.; methodology, Y.Y. and G.R.; validation, Y.Y.; investigation, Y.Y., W.W., G.R. and B.H.; resources, Z.Q.; data curation, Y.Y.; writing—original draft preparation, Y.Y., W.W.; writing—review and editing, G.R. and B.H.; supervision, Z.Q.; project administration, Z.Q.; funding acquisition, Z.Q.
Funding
This research was funded by the National Key Research and Development Program of China (2017YFB0102703).
Acknowledgments
The authors gratefully acknowledge the financial support from the National Key Research and Development Program of China (2017YFB0102703).
Conflicts of Interest
The authors declare no conflict of interest.
Nomenclature
| a | water activity |
| A | geometric area of the fuel cell, |
| c | mole concentration, |
| d | diameter, m |
| D | diffusion coefficient, |
| Nernst voltage, V | |
| F | Faraday’s constant, 96487.0 |
| I | current density, or |
| limiting current density, | |
| K | permeability, |
| L | length of channel |
| M | relative mole mass, |
| n | electron number |
| electroosmosis coefficient | |
| p | pressure, Pa |
| Popt | operating pressure, Pa |
| Q | liquid water flux, |
| R | ideal gas constant, 8.314 |
| R | internal resistance, |
| r | pore diameter |
| RH | relative humidity |
| s | volume fraction |
| S | source terms of phase change |
| Sh | Sherwood number |
| ST | stoichiometric ratio |
| T | temperature, K |
| u | flow velocity, |
| V | voltage, V |
| W | width of channel |
| Greek symbols | |
| transfer coefficient | |
| thickness, m | |
| porosity | |
| voltage loss, V | |
| water content in membrane | |
| rate, | |
| density, | |
| dynamic viscosity, | |
| conductivity, | |
| Subscript and superscripts | |
| 0 | standard condition |
| act | activation loss parameter |
| ano | anode |
| BP | bipolar plate |
| c | capillary |
| cat | cathode |
| ch | flow channel |
| ch-GDL | interface between the flow channel and gas diffusion layer |
| CL | catalyst layer |
| CL-MEM | interface between the CL and membrane |
| conc | concentration |
| cond | condensation |
| eff | effective parameter |
| GDL | gas diffusion layer |
| GDL-CL | interface between the GDL and CL |
| h | hydraulic |
| i | composition of the gas mixture |
| in | inlet |
| k | electrode |
| lq | liquid water |
| MEM | membrane |
| ohm | ohmic |
| out | outlet |
| rea | reaction |
| ref | reference |
| sat | saturation |
| vap | water vapor |
| vap-lq | vapor water transformation into liquid water |
References
- Barbir, F. PEM Fuel Cells: Theory and Practice, 2nd ed.; Elsevier: Laguna Hills, CA, USA, 2013; pp. 1–4. [Google Scholar]
- Bernardi, D.M.; Verbrugge, M.W. Mathematical model of a gas diffusion electrode bonded to a polymer electrolyte. AICHE J. 1991, 37, 1151–1163. [Google Scholar] [CrossRef]
- Gao, F.; Blunier, B.; Miraoui, A.; Moudni, A.E. A Multiphysic Dynamic 1-D Model of a Proton-Exchange-Membrane Fuel-Cell Stack for Real-Time Simulation. IEEE Trans. Ind. Electron. 2010, 57, 1853–1864. [Google Scholar] [CrossRef]
- Fontes, G.; Turpin, C.; Astier, S. A Large-Signal and Dynamic Circuit Model of a H2/O2 PEM Fuel Cell: Description, Parameter Identification, and Exploitation. IEEE Trans. Ind. Electron. 2010, 57, 1874–1881. [Google Scholar] [CrossRef]
- Weber, A.Z.; Newman, J. Coupled Thermal and Water Management in Polymer-Electrolyte FuelCells. J. Electrochem. Soc. 2006, 153, A2205–A2214. [Google Scholar] [CrossRef]
- Wang, C.; Nehrir, M.H. A Physically Based Dynamic Model for Solid Oxide Fuel Cells. IEEE Trans. Energy Convers. 2007, 22, 887–897. [Google Scholar] [CrossRef]
- Wang, C.; Nehrir, M.H.; Shaw, S.R. Dynamic models and model validation for PEM fuel cells using electrical circuits. IEEE Trans. Energy Convers. 2005, 20, 442–451. [Google Scholar] [CrossRef]
- Fuller, T.F.; Newman, J. Water and Thermal Management in Solid-Polymer-Electrolyte Fuel-Cells. J. Electrochem. Soc. 1993, 140, 1218–1225. [Google Scholar] [CrossRef]
- Jung, S.Y.; Nguyen, T.V. An Along-the-Channel Model for Proton Exchange Membrane Fuel Cells. J. Electrochem. Soc. 1998, 145, 1149–1159. [Google Scholar]
- Dannenberg, K.; Ekdunge, P.; Lindbergh, G. Mathematical model of the PEMFC. J. Appl. Electrochem. 2000, 30, 1377–1387. [Google Scholar] [CrossRef]
- Wen, X.F.; Xiao, J.S.; Zhan, Z.G. Thermal modeling of proton exchange membrane fuel cell. Chin. J. Power Sources 2006, 30, 461–465. [Google Scholar]
- Berning, T.; Lu, D.M.; Djilali, N. Three-dimensional computational analysis of transport phenomena in a PEM fuel cell. J. Power Sources 2002, 106, 284–294. [Google Scholar] [CrossRef]
- Berning, T.; Djilali, N. Three-dimensional computational analysis of transport phenomena in a PEM fuel cell—A parametric study. J. Power Sources 2003, 124, 440–452. [Google Scholar] [CrossRef]
- Berning, T.; Djilali, N. A 3D, multiphase, multicomponent model of the cathode and anode of a PEM fuel cell. J. Electrochem. Soc. 2003, 150, A1589–A1598. [Google Scholar] [CrossRef]
- Liu, Z.; Mao, Z.; Wang, C.; Zhuge, W.; Zhang, Y. Numerical simulation of a mini PEMFC stack. J. Power Sources 2006, 160, 1111–1121. [Google Scholar] [CrossRef]
- Askarzadeh, A.; Coelho, L.D.S. A backtracking search algorithm combined with Burger’s chaotic map for parameter estimation of PEMFC electrochemical model. Int. J. Hydrog. Energy 2014, 39, 11165–11174. [Google Scholar] [CrossRef]
- Chakraborty, U.K.; Abbott, T.E.; Das, S.K. PEM fuel cell modeling using differential evolution. Energy 2012, 40, 387–399. [Google Scholar] [CrossRef]
- Nguyen, T.V.; Knobbe, M.W. A liquid water management strategy for PEM fuel cell stacks. J. Power Sources 2003, 114, 70–79. [Google Scholar] [CrossRef]
- Qin, Y.; Li, X.; Jiao, K.; Du, Q.; Yan, Y. Effective removal and transport of water in a PEM fuel cell flow channel having a hydrophilic plate. Appl. Energy 2014, 113, 116–126. [Google Scholar] [CrossRef]
- Liu, H.C.; Yan, W.M.; Soong, C.Y.; Chen, F. Effects of baffle-blocked flow channel on reactant transport and cell performance of a proton exchange membrane fuel cell. J. Power Sources 2005, 142, 125–133. [Google Scholar] [CrossRef]
- Jung, U.H.; Jeong, S.U.; Park, K.T.; Lee, H.M.; Chun, K.; Dong, W.C.; Kim, S.H. Improvement of water management in air-breathing and air-blowing PEMFC at low temperature using hydrophilic silica nano-particles. Int. J. Hydrogen Energy 2007, 32, 4459–4465. [Google Scholar] [CrossRef]
- Li, X.; Sabir, I.; Park, J. A flow channel design procedure for PEM fuel cells with effective water removal. J. Power Sources 2007, 163, 933–942. [Google Scholar] [CrossRef]
- Nguyen, T.V. A gas distributor design for proton-exchange-membrane fuel cells. J. Electrochem. Soc. 1996, 143, L103–L105. [Google Scholar] [CrossRef]
- Al-Baghdadi, M.A.R.S. A simple mathematical model of performance for proton exchange membrane fuel cells. Int. J. Sol. Energy 2007, 26, 79–90. [Google Scholar] [CrossRef]
- Falcão, D.S.; Oliveira, V.B.; Rangel, C.M.; Pinho, C.; Pinto, A.M.F.R. Water transport through a PEM fuel cell: A one-dimensional model with heat transfer effects. Chem. Eng. Sci. 2009, 64, 2216–2225. [Google Scholar] [CrossRef]
- Casalegno, A.; Marchesi, R.; Parenti, D. Two-Phase 1D+1D Model of a DMFC: Development and Validation on Extensive Operating Conditions Range. Fuel Cells 2010, 8, 37–44. [Google Scholar] [CrossRef]
- Salva, J.A.; Iranzo, A.; Rosa, F.; Tapia, E. Validation of cell voltage and water content in a PEM (polymer electrolyte membrane) fuel cell model using neutron imaging for different operating conditions. Energy 2016, 101, 100–112. [Google Scholar] [CrossRef]
- Das, P.K.; Li, X.; Liu, Z.S. Analytical approach to polymer electrolyte membrane fuel cell performance and optimization. J. Electroanal. Chem. 2007, 604, 72–90. [Google Scholar] [CrossRef]
- Jiao, K.; Huo, S.; Zu, M.; Jiao, D.; Chen, J.; Du, Q. An analytical model for hydrogen alkaline anion exchange membrane fuel cell. Int. J. Hydrogen Energy 2015, 40, 3300–3312. [Google Scholar] [CrossRef]
- Huo, S.; Park, J.W.; He, P.; Wang, D.; Jiao, K. Analytical modeling of liquid saturation jump effect for hydrogen alkaline anion exchange membrane fuel cell. Int. J. Heat Mass Transf. 2017, 112, 891–902. [Google Scholar] [CrossRef]
- Luo, Y.; Guo, Q.; Du, Q.; Yin, Y.; Jiao, K. Analysis of cold start processes in proton exchange membrane fuel cell stacks. J. Power Sources 2013, 224, 99–114. [Google Scholar] [CrossRef]
- Natarajan, D.; Nguyen, T.V. Three-dimensional effects of liquid water flooding in the cathode of a PEM fuel cell. J. Power Sources 2003, 115, 66–80. [Google Scholar] [CrossRef]
- Ye, Q.; Van Nguyen, T. Three-dimensional simulation of liquid water distribution in a PEMFC with experimentally measured capillary functions. J. Electrochem. Soc. 2007, 154, B1242–B1251. [Google Scholar] [CrossRef]
- Springer, T.E.; Zawodzinski, T.A.; Gottesfeld, S. Polymer Electrolyte Fuel Cell Model. J. Electrochem. Soc. 1991, 138, 2334–2342. [Google Scholar] [CrossRef]
- Miansari, M.; Sedighi, K.; Amidpour, M.; Alizadeh, E.; Miansari, M. Experimental and thermodynamic approach on proton exchange membrane fuel cell performance. J. Power Sources 2009, 190, 356–361. [Google Scholar] [CrossRef]
- Haji, S. Analytical modeling of PEM fuel cell i–V curve. Renew. Energy 2011, 36, 451–458. [Google Scholar] [CrossRef]
- Spiegel, C. PEM Fuel Cell Modeling and Simulation Using Matlab; Elsevier: Laguna Hills, CA, USA, 2008; pp. 49–76. [Google Scholar]
- Chakraborty, U.K. Reversible and irrecersible potential and an inaccuracy in popular models in the fuel cell literature. Energies 2018, 11, 1851. [Google Scholar] [CrossRef]
- Mohiuddin, A.K.M.; Basran, N.; Khan, A.A. Modeling and validation of Proton exchange membrane fuel cell (PEMFC). IOP Conf. Ser. Mater. Sci. Eng. 2018, 290, 012026. [Google Scholar] [CrossRef]
- Zhou, Y.; Luo, Y.; Yu, S.; Jiao, K. Modeling of cold start processes and performance optimization forproton exchange membrane fuel cell stacks. J. Power Sources 2014, 247, 738–748. [Google Scholar] [CrossRef]
- Akbari, M.H.; Rismanchi, B. Numerical investigation of flow field configuration and contact resistance for PEM fuel cell performance. Renew. Energy 2008, 33, 1775–1783. [Google Scholar] [CrossRef]
- Gurau, V.; Liu, H.; Kakac, S. Two-dimensional model for proton exchange membrane fuel cells. AICHE J. 1998, 44, 2410–2422. [Google Scholar] [CrossRef]
- Fan, L.; Guobing, Z.; Kui, J. The performance study of PEMFC under high current and low humidification condition. In Proceedings of the Chinese Society of Engineering Thermophysics, Suzhou, China, 28 Octorber 2017. [Google Scholar]
- Kim, K.H.; Lee, K.Y.; Lee, S.Y.; Cho, E.A.; Lim, T.H.; Kim, H.J.; Yoon, S.P.; Kim, S.H.; Lim, T.W.; Jang, J.H. The effects of relative humidity on the performances of PEMFC MEAs with various Nafion ionomer contents. Int. J. Hydrogen Energy 2010, 35, 13104–13110. [Google Scholar] [CrossRef]
© 2019 by the authors. Licensee MDPI, Basel, Switzerland. This article is an open access article distributed under the terms and conditions of the Creative Commons Attribution (CC BY) license (http://creativecommons.org/licenses/by/4.0/).