Abstract
The worldwide production of hydrogen in 2010 was estimated to be approximately 50 Mt/a, mostly based on fossil fuels. By using lignocellulosic feedstock, an environmentally friendly hydrogen production route can be established. A flow sheet simulation for a biomass based hydrogen production plant was published in a previous work. The plant layout consisted of a dual fluidized bed gasifier including a gas cooler and a dust filter. Subsequently, a water gas shift plant was installed to enhance the hydrogen yield and a biodiesel scrubber was used to remove tars and water from the syngas. CO2 was removed and the gas was compressed to separate hydrogen in a pressure swing adsorption. A steam reformer was used to reform the hydrocarbon-rich tail gas of the pressure swing adsorption and increase the hydrogen yield. Based on this work, a research facility was erected and the results were validated. These results were used to upscale the research plant to a 10 MW fuel feed scale. A validation of the system showed a chemical efficiency of the system of 60% and an overall efficiency of 55%, which indicates the high potential of this technology.
1. Introduction
Hydrogen production has risen constantly over the last years. Following this trend, the worldwide production of hydrogen in 2025 will be approximately 58 Mt/year. Figure 1 shows the hydrogen source and production capacity in 2010 and 2025, in Western Europe and worldwide [1].
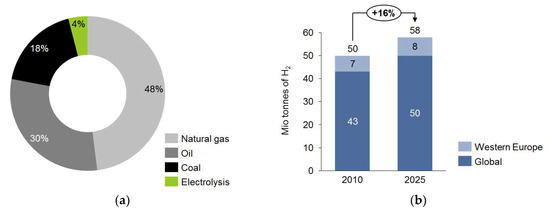
Figure 1.
Hydrogen sources (a) and overall hydrogen production in Western Europe and worldwide (b) [1].
In order to reduce CO2 emissions and counter-steer increasing costs of fossil fuels, the European commission passed a declaration in 2007, aiming to establish an environmental friendly energy supply. In this concept, hydrogen acts as energy storage and it is planned to set up an EU-wide hydrogen infrastructure by the year 2025 [2].
Hydrogen is also seen as a promising fuel for transportation in the future. Therefore, the demand of hydrogen is likely to increase within the next years. To accomplish the goal of a green hydrogen-economy, environmental friendly and CO2 neutral production methods will be needed. In the following pages, methane steam reforming as the bench mark process as well as renewable hydrogen production processes will be discussed.
Approximately 96% of today’s hydrogen is produced via thermochemical conversion of fossil fuels, where natural gas is the most-used fuel [1].
The main process of converting natural gas to hydrogen is steam reforming. Beside hydrogen, the product gas contains water, carbon monoxide and carbon dioxide as by-products. To increase the amount of hydrogen and to get rid of the impurities, the steam reforming is typically followed by the water-gas shift reaction and the pressure-swing adsorption (PSA).
To avoid catalyst poisoning, a desulfurization stage is used as first process step. As a next step, steam reforming is applied. Typically, Ni-based catalysts are used because of their low investment costs. Temperatures up to 900 °C and pressures above 40 bar are applied. For heat supply, PSA tail gas is used. Then, the reformed gas passes a high temperature water gas shift (HT WGS) reactor, as well as a low temperature water gas shift (LT WGS) reactor, where approximately 90% of the CO is converted. Typical HT WGS reactors operate at temperatures between 350 °C and 550 °C using a iron/chromium based catalyst. LT WGS reactors operate at temperatures below 250 °C using a copper/zinc or cobalt/molybdenum based catalyst. As the WGS reaction is exothermic, the tail gas has to be cooled. After the WGS reactors, a PSA is used to purify the gas and produce high quality hydrogen. Chemical efficiencies of 79% can be reached [1,3,4].
Biogas steam reforming is a similar process to natural gas reforming. Differences can be found in the gas production and in gas composition. Biogas mainly consists of methane and carbon dioxide and is created by anaerobic digestion of biomass. Today, biogas is commercially produced by energy crops or landfill gas recovery plants, where bio-wastes like manure, sewage and organic matters are treated. Biogas is produced by anaerobic digestion of biomass. Microorganism under absence of oxygen partially convert biogenic components to biogas, consisting mainly of methane and carbon dioxide. This process can be split in four major phases: hydrolysis, acidogenesis, acetogenesis and parthenogenesis [5].
Depending on the type of digestion applied, the reactor needs to be warmed to temperatures between 30 to 55 °C and the digestion takes 12 to 30 days. Like natural gas, biogas contains sulphur in form of H2S (up to 5000 ppm), which acts as a catalyst poison for nickel catalysts, typically used in steam reforming reactors [4].
Therefore, a desulfurization is needed, which, amongst other processes, can be done either via fixed bed activated carbon and ZnO beds or by biological oxidation of H2S [6,7,8,9].
Subsequently, in the steam reformer, the purified biogas is converted to hydrogen, carbon monoxide and carbon dioxide. The steam reforming process of natural gas also works for biogas when the correct steam to carbon ratio is adjusted. Chemical efficiencies of 77% can be reached taking the fermenter not into account [4,6,9,10].
Overall efficiencies of 55–65% could be reached for processing waste-water from milk industry [11].
Electrolysis of water is an electrochemical process converting water into hydrogen and oxygen via electrical energy. If electricity is produced by renewable sources, electrolysis is CO2-neutral. Electrolysers consist of a cathode, an anode, a separator and an electrolyte. By applying voltage to the electrodes, electrolysis converts water to hydrogen and oxygen. There are various methods of electrolysis, differing by the employed electrolyte, pressure and temperature, where alkaline electrolysis is the most common of these processes [12]. An alkaline electrolyser can either be unipolar or bipolar. Today, most alkaline electrolysers are bipolar modules [13].
Applying electrical voltage reduces water to hydrogen at the electrode and hydroxide at the cathode. The alkaline electrolyser uses an aqueous solution of water with 25 to 30 wt.% of potassium hydroxide (KOH). However, sodium hydroxide (NaOH), sodium chloride (NaCl) and other solutions have been used as electrolyte. Efficiencies of up to 61% were reported by Zeng et al. [13,14].
This work will focus on the calculation of mass and energy balances of a hydrogen production plant using lignocellulosic feedstock as a hydrogen source. A flow sheet simulation was done in 2015 as starting point for the erection of a research hydrogen production plant. This plant was built on the site of an industrial biomass gasifier, using forest wood chips as feedstock. Extensive investigations were done by operation of the single steps, as well as the whole plant for over 1000 h with industrial product gas. A steam reformer was established to reform hydrocarbon-rich tail gas and increase the hydrogen yield by recycling. Based on the gathered data, a simulation and validation of the measured data was done and a 10 MW fuel power hydrogen production plant (BioH2) was calculated. Mass- and energy balances of this plant were used to calculate efficiencies of the plant and investigate the possibility of using biomass as hydrogen source.
The investigated process has the advantage of producing hydrogen continuously from renewable energy sources while not competing against the agriculture industry.
Comparable work has been done by Kraussler et al. and Yao et al. using simulation tools to calculate a hydrogen production plant using biomass as feed for polygeneration applications and by Kraussler et al. and Fail et al. operating a water gas shift and hydrogen separation plant in a polygeneration setup [9,15,16,17].
This work will focus on maximizing the hydrogen production by using tail gas reforming and recycling as key technology.
2. Materials and Methods
A hydrogen production plant (BioH2) that was operated in Güssing at the side of a commercial dual fluidized bed (DFB) gasifier was analyzed to determine mass and energy balance by a combination of experimental work and process simulation with COCO (cape open to cape open simulation environment). Based on these data, a study was done to analyze the potential for improvement of the process units. Figure 2 shows a flow scheme of the BioH2 process chain.
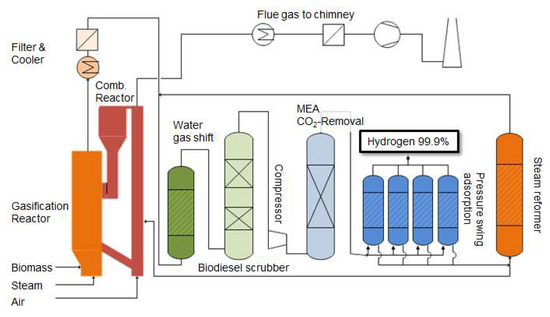
Figure 2.
Flow scheme of a hydrogen production plant based on dual fluidized steam gasification of biomass.
The plant consists of a DFB gasifier, were gas is drained after the dust filter and a WGS stage to convert carbon monoxide and water to carbon dioxide and hydrogen, a biodiesel scrubber to remove water and tars, a CO2 absorber to remove carbon dioxide and a pressure swing adsorption (PSA) to produce high purity hydrogen. Additionally, a steam reformer situated at the tail gas of the PSA was installed to reform the tail gas and recycle it to the WGS for further enhancement of the hydrogen yield. The hydrogen yield was maximized by optimizing the gas recycling. Figure 3 shows an illustration of the gas upgrading and hydrogen purification part of the plant.
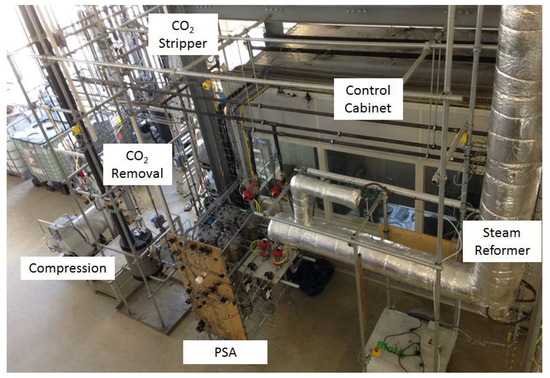
Figure 3.
Photo of the gas upgrading and hydrogen purification part of the BioH2 plant.
2.1. Dual Fluidized Bed Steam Gasification
Dual fluidized bed steam gasification is an allothermal gasification technology, using steam as a gasification agent. Figure 4 shows the principle scheme of the DFB process. Two reaction zones coupled by a chute and a cyclone were applied for this process.
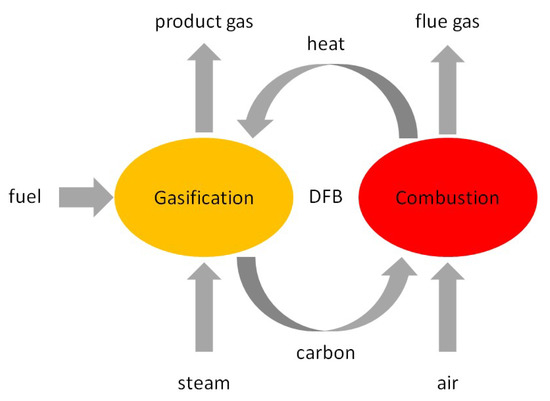
Figure 4.
Principle functionality of the dual fluidized steam gasification process.
The typical gas composition of a DFB gasification plant as well as a comparison between the product gas of natural gas steam reforming and dual fluidized bed steam gasification (DFB) product gas are given in Table 1.

Table 1.
Typical values for product gas composition after DFB gasification in comparison to gas composition after natural gas steam reforming [3,22].
A steam fluidized reactor is used to gasify biomass in a bubbling bed. The fuel reacts with the steam in presence of catalytic active bed material [18,19,20] under consumption of heat energy to the main gas components hydrogen, carbon monoxide, carbon dioxide and methane. The non-gasified biomass and the bed material are transported over a chute to the combustion zone. The combustion is carried out as a fast fluidized bed, using air as fluidization agent. The non-gasified carbon is burned and the bed material is heated up again. Through a cyclone separator bed material is divided from the flue gas stream and transported back into the gasification reactor. The resulting gasification product is an almost nitrogen-free gas that is well suitable for syngas applications and hydrogen production (see Table 1) [21]. After the gasification, the produced gas is still rich in impurities (see Table 1) and dust. This gas first passes the product gas cooler, and is then filtered in a bag house filter to obtain a dust free gas.
For the calculation of mass and energy balance, a cold gas efficiency of 74% was used according to [16], including the energy for biomass preparation (e.g., drying). As a standard tar loading, a total amount of 25 g/m3 (STP) (including benzene and toluene) was defined as was measured in several previous experiments [22,23].
2.2. Water Gas Shift Stage
As the second process unit for hydrogen production, a WGS, operated with an industrial Iron/Chromium catalyst, was used. Directly after the product gas filter of the DFB gasifier, a slipstream of gas was taken. The WGS unit was designed for atmospheric pressure and temperatures between 250 °C and 450 °C. Two reactors were used to give the possibility of testing different space velocities in one run. As the exothermal water gas shift reaction is the dominant reaction (see Equation (1)) in this unit, the reactors were designed as adiabatic reactors [15].
The outlet temperature of each reactor was used for process control [23,24].
CO + H2O ↔ CO2 + H2
ΔH0 = −41.1 kJ/mol
ΔH0 = −41.1 kJ/mol
A temperature of 425 °C and a space velocity (SV) of 1000 h−1 were used as standard values for the calculation of mass and energy balances. A CO conversion of 75.1% could be determined experimentally [22].
The space velocity was calculated according to Equation (2):
Steam to carbon ratio (StC) for WGS was calculated following Equation (3), only taking CO into account due to the high selectivity of the WGS reaction:
Additionally, a steam to gas ratio (StG) was calculated (see Equation (4)):
2.3. Biodiesel Scrubber
For the removal of water and organic impurities, a two-staged biodiesel scrubber operating at temperatures of 25 °C in the first and 8 °C in the second stage was installed at the research side. There, tar- and water-rich gas, supplied from the WGS stage, was cooled from 150 °C to 8 °C with biodiesel. During this process, lighter organic components (e.g., benzene, toluene, xylene) were dissolved and heavier components (e.g., anthracene, pyrene) were condensed in the solution. This effect was reported by Bardolf [25]. In [22], a benzene removal by biodiesel scrubbing of 70% could be reached if 0.5 m3 gas per 1 L biodiesel was used at biodiesel temperatures of 8 °C. Bardolf described a higher benzene removal of 85% at similar temperatures and gas to biodiesel ratios. For a complete removal of the impurities, a gas to biodiesel ratio of 0.1 m3 gas per 1 L biodiesel is recommended. Additionally, an operation of the first scrubber stage above temperatures of 24 °C is recommended [25].
For the calculation of mass balances, a gas to biodiesel ratio of 0.1 m3 gas per 1 L biodiesel was used. During the operation of the research plant, a BTXN (Benzene, toluene, xylene, naphthalene) deposition was identified as a major problem, which could be solved by applying the findings from Bardolf [25].
2.4. CO2 Removal
To remove carbon dioxide from the gas stream, scrubbing by Monoethanolamine (MEA) in water solution (30/70 wt.%) was done. As MEA is an organic solvent that can absorb acid gases, it is well suitable for the removal of CO2 and H2S from a syngas stream. Carbon dioxide can be dissolved in the liquid phase as carbamate, carbonate and bicarbonate as a consequence of the reaction between a weak acid and a weak base. As the MEA-CO2 absorption-desorption reaction is driven by temperature swing, high amounts of heat energy are necessary [26].
As MEA is used in several mature industrial processes, it was used in this setup to allow a quick scale up of the plant.
The investigated unit was designed to remove carbon dioxide at relatively low desorption temperatures to allow the usage of district heat. Therefore, a higher MEA to CO2 ratio was necessary. An optimal MEA to carbon dioxide ratio for the desired application was calculated and experimental proven to be 9.1 mol MEA per mol CO2.
2.5. Pressure Swing Adsorption
As the separation technology for hydrogen, pressure swing adsorption was chosen. In a multibed reactor filled with mole sieve and activated carbon, hydrogen was separated from the other gas components. Based on the LeChatellier principle, adsorption is enhanced by increasing the partial pressure of the adsorbents. In similar works, 23 bar adsorption pressure and 1 bar desorption pressure [24], 10 bar adsorption and 1 bar desorption pressure [16], 6.5 bar adsorption pressure with 0.2 bar desorption pressure [27] and 2–4 bar adsorption pressure and 0.2 bar desorption pressure [17] were used in real gas experiments. As indicated in [24], a purity of 99.9% hydrogen can be reached using an adsorption pressure of 23 bar. For the calculation of mass and energy balance, a four reactor PSA with an adsorption pressure of 10 bar and a desorption pressure of 1 bar were used [16].
According to Kraussler, a hydrogen recovery of 90% is possible using a 10 bar adsorption pressure and a 1 bar desorption pressure, when CO2 is removed before the gas is processed in a PSA [16].
2.6. Tail Gas Reforming And Recycling
A steam reformer using a split stream of the PSA tail gas as feed gas was used to enhance the hydrogen yield. Figure 2 shows the steam reformer used to reform the high valuable hydrocarbons, which are concentrated in the tail gas of the PSA. Experimental data were used from the findings in [23], where a methane conversion of 90% could be reached, using a platinum-based catalyst with a space velocity of 950 h−1 and temperatures of 900 °C. By lowering the reforming temperature to 850 °C, a methane conversion of 99 % could be reached. A steam to carbon ratio of 3:1 was adjusted (see Equation (5)). Steam to dry gas ratio was calculated according to Equation (4). The PSA tail gas recycling ratio was adjusted aiming to increase the hydrogen yield.
2.7. Calculation of Mass and Energy Balance
Mass and energy balances of the BioH2 process chain were calculated by using the process simulation tool COCO. The DFB plant itself was not simulated with COCO. Instead, literature data concerning cold gas efficiency and product gas composition were used.
COCO is a simulation package of various operations. It includes a chemical flowsheet steady state simulation as well as several libraries concerning thermodynamic and chemical properties [28].
Based on the experimental data, a validation and upscaling was done using COCO. A plant using 10 MW biomass as feed was simulated as reference. Minor components (e.g., BTXN, sulphur) were not considered in the simulation, although gas cleaning units were sized appropriately to allow for their removal. The Peng-Robinson approach was used for the equation of the state model [29].
Equilibrium calculations were done using the Wilson-ideal-solution-model. An isentropic efficiency for compression steps of 75% and a boiler efficiency of 90% were defined. For the cooling process, a cooling efficiency of 4 was chosen.
The overall efficiency was calculated according to Equation (6). The efficiency of hydrogen production was calculated by Equation (7) and the chemical efficiency was calculated by using Equation (8):
2.8. Optimization of Heat Management by Pinch Point Analyse
Pinch point analysis is an energy optimization approach, trying to improve not one aperture, but the whole process. In most cases, heat integration over a whole process chain is more beneficiary then focusing on one process unit. As it focuses on a minimization of the overall thermal energy, pinch point analysis gives the possibility to reduce energy demand between 10 and 30%. A minimum temperature difference of 10 K was defined, as is common for heat exchanger networks where liquid and vapour phases are present [30].
In this work, pinch point analysis was used to identify and maximize the hydrogen production potential.
3. Results
In the following section, data validation and upscaling of an existing research hydrogen production plant (BioH2) will be discussed. Experimental data were used to set up a model for upscaling of the process. Each process step was modeled using the experimental data described in Section 2. The Peng-Robinson approach was used as the equation of state.
Single process steps could be operated for more than 1000 h, while the whole process chain, including tail gas recycling, was operated for 100 h. Nitrogen accumulation in the process was also observed and could be minimized by using CO2 as inert gas. Table 2 shows a comparison between measured raw data and validated data.

Table 2.
Measured raw data in comparison to the validated data at the different measurement points in vol-% (validated data/raw data).
3.1. Set of Simulation Parameters
Based on the data, a reference plant of 10 MW fuel input power was simulated. Figure 2 shows a simplified process setup of the plant. Wood chips with a lower heating value (LHV) of 14.4 MJ/kg were used as fuel feed.
A dryer was used to adjust the water content of the wood chips, and enhance the gasification efficiency. After the dryer, biomass was fed into the gasification reactor where product gas is produced. This gas was mixed with recycle gas from the tail gas steam reformer and fed into a WGS unit to enhance the hydrogen yield using a CO conversion of 75%. After the WGS unit, the gas was cooled and impurities (e.g., BTXN, tars) were removed by biodiesel scrubbing. In the next step, a mixture of 30% MEA and 70% water was used to remove CO2, which is the most energy consuming step in this process. A separation efficiency of 98% could be achieved by operating at temperature levels below 100 °C. The CO2 lean gas stream was then compressed to 10 bar (ηis = 0.75) and processed in a PSA generating hydrogen and utility gas with a hydrogen recovery of 90% and a purity of 99.9%. A split stream was used in a steam reformer to enhance the hydrogen yield by steam reforming. This reformer was operated at 850 °C and an SV of 950 h−1. A platinum-based catalyst was used to catalyze the steam reforming reaction. Then, the tail gas of the steam reformer was fed back to the WGS unit. Surplus utility gas was used to fire a boiler, producing the heat energy for the process.
3.2. Mass and Energy Balance
Figure 5 shows a simplified mass balance of the process chain. Only the main components biomass, steam, hydrogen, carbon monoxide and carbon dioxide are illustrated. Hydrocarbons were summarized as CxHy, including methane, ethane, ethylene, acetylene, propane and propylene. By using 2500 kg/h of biomass (wet) and steam for the gasification, a total of 3369 kg/h product gas can be produced. Over the described process steps, the gas can be further processed to 2239 kg/h of BioCO2, which can be used as an inert gas substitute and for fertilization processes in greenhouses. A further 179 kg/h of BioH2 could be produced, which resulted in a hydrogen output of 71 g H2 per kg biomass. As hydrogen is the high valuable product, process optimization was done by varying the tail gas utilization to produce a maximum of H2 without the need of external thermal energy. 68% of the PSA tail gas can be reformed and recycled to the WGS unit. 32% were still necessary to cover the heat demand of the plant. Condensed water could be used as feed for the steam reformer and for fluidization of the DFB gasifier. In this plant, surplus water will be disposed.
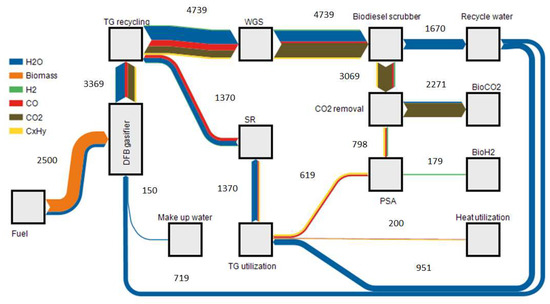
Figure 5.
Sankey diagram of the mass balance for a 10 MW BioH2 plant (flows in kg/h).
Using tail gas recycling, a steam to carbon ratio of 3.5 was reached, only taking the carbon monoxide into account as it is the only affected component. For steam reforming, an StC ratio of 3 was adjusted.
An analysis regarding the necessary electrical and thermal power was done. The main electric energy consumers were the cooling energy needed for the biodiesel scrubber, consuming 0.36 MW electric (MWel) if a compression based chiller was used, and the gas compression to 10 bar consuming 0.32 MWel. A lump sum for electrical energy of 0.3 MWel was calculated for minor electrical consumers. A total of 0.98 MWel were necessary to operate a 10 MW BioH2 plant.
As the main heat consumer, the CO2 removal by MEA scrubbing could be determined. This energy can be supplied internally by a trade-off of coupling out less district heat. As there is no additional heat required, 0.12 MW thermal (MWth) can be used as district heat after the utilization of the PSA tail gas. 6 MWchem (LHV based energy) of hydrogen could be produced by using 10 MWchem of biomass, which means the chemical efficiency of the process can be optimized to 60%. Adding the necessary electrical energy (Pel = 0.98 MW), a total efficiency for hydrogen production could be calculated to 54%. A total efficiency of 55% could be reached by the utilization of process heat for district heat applications. Figure 6 shows the energy balance illustrating the LHV of the used gas over the process.
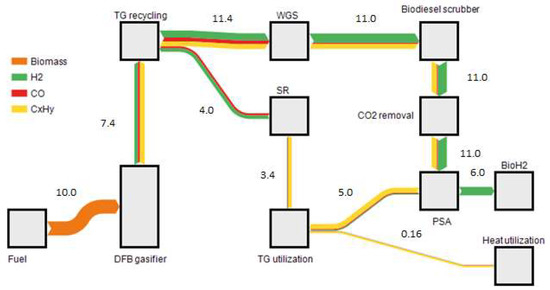
Figure 6.
Sankey diagram of the energy balance for a 10 MW BioH2 plant only illustrating the LHV based energy streams in MW.
3.3. Coke Formation
Figure 7 shows the C-H-O ternary diagrams illustrating the coke formation potential for WGS (a) and steam reforming (b).
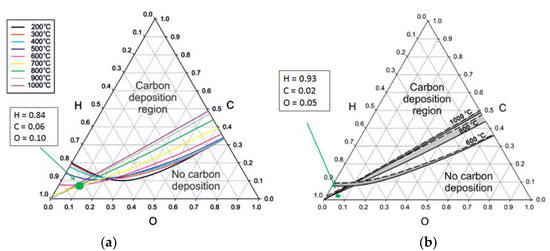
Figure 7.
C-H-O ternary diagram for all carbon allotropes illustrating the thermodynamically coke formation potential for WGS (a) and steam reforming (b) based on [31].
An StC ratio for the WGS process of 3.5:1, only taking CO into account, and a StG ratio of 0.44:1 could be calculated. For steam reforming, an StC ratio of 3:1 and a StG ratio of 0.7:1 could be calculated. A coke formation analysis was done, using a C-H-O ternary diagram applicable for all carbon allotropes. In the used configuration, no thermodynamic coke formation was favored.
4. Discussion
The chemical and overall efficiency of the BioH2 process was calculated by using experimentally gained data and process simulation. Mass and energy balances were experimentally validated for a research plant and upscaled to a 10 MW fuel power DFB plant. These findings were compared with the industrial benchmark process of methane steam reforming and other renewable processes, as well as with former flow sheet simulations by Müller et al. [32].
The upscaled process was compared with a flow sheet simulation [32]. A correlation between simulated, experimental and upscaled data could be demonstrated. A chemical efficiency of 60% was confirmed for the 10 MW BioH2 plant, where Müller et al. calculated a chemical efficiency of 61%. A total efficiency of 55% could be observed for the BioH2 plant, where Müller et al. calculated 58%. Chemical as well as total efficiency were in good correlation, which validates the upscaled data. An analysis of the needed steam supply was done to validate the gathered data. As steam production is a cost intensive process, it was analyzed if the WGS stage can be operated without adding additional steam. Based on data evaluation in a C-H-O ternary diagram, it could be shown that no thermodynamic coke formation is favored (Figure 7), which means no additional steam is required for operation of the WGS stage.
A comparison to other hydrogen production processes was done. As a classically mature, fossil based, hydrogen production process, methane steam reforming was used. Chemical efficiencies of 79% and overall efficiencies of 89% can be reached when surplus steam can be produced [3,33].
Another possibility is biogas steam reforming, were biogas is produced through fermentation. A total efficiency between 55% and 65% can be reached if the efficiency of the fermenter is taken into account. For electrolyses, Zeng et al. published total efficiencies of 61% for alkyne electrolysers, not taking the power generation into account [11,13].
Comparing these findings (Figure 8) with the BioH2 process, it can be seen that the renewable production routes are in a similar range. Non-renewable methane steam reforming has higher efficiencies, which can be explained by the usage of gaseous feedstock instead of solid feedstock in gasification processes. Hydrogen production by the DFB technology has the advantage of continuously producing renewable hydrogen from a woody biomass. In relation to a bigger scale, other renewable H2 production techniques have the drawback of producing discontinually and have poor scale-up factors (electrolyses) or are in competition with the agricultural industry (biogas steam reforming).
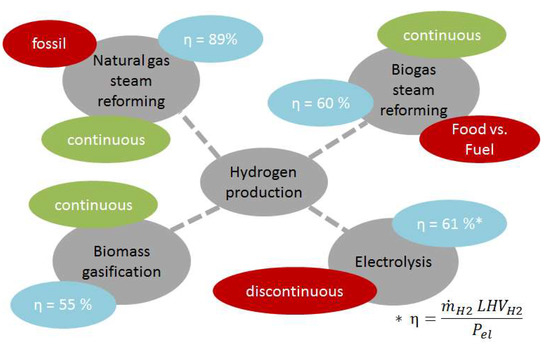
Figure 8.
Comparison of different hydrogen production routes in respect to efficiency, hydrogen production and renewability.
5. Conclusions
Summarizing these data, it was proven that a biomass based hydrogen production process can be competitive to other renewable hydrogen production methods with respect to process efficiency. Nevertheless, detailed economic analyses need to be done to clarify if a biomass-based hydrogen production process can be competitive in future applications under the current economic conditions.
The mass- and energy balance clearly showed the bottlenecks that have to be overcome by further research activities in the field of gas cleaning and gas upgrading. Energy- and material intensive gas cleaning can be improved by an adsorption approach applying a temperature swing adsorption. Additionally, the CO2 removal could be determined as an energy intensive process that consumes the major part of the energy, which could be used for district heat instead. A promising approach could be to use the findings of the European Comission project ROMEO where a catalytic active WGS-membrane reactor was developed to remove CO2 from a syngas stream.
Additionally, a strategic switch from wood to woody waste should be done to gain a cheaper fuel for the gasification plant. To demonstrate the feasibility of this approach, an intermediate step, building up a demonstration plant in the scale of several hundred kilowatts to 1 MW, should be done.
Author Contributions
Conceptualization, R.R.; Methodology, R.R. and J.L.; Validation, J.L. and S.M.; Formal Analysis, J.L.; Investigation, J.L.; Resources, R.R. and M.L.; Data Curation, J.L. and M.L.; Writing-Original Draft Preparation, J.L.; Writing-Review & Editing, R.R., H.H., S.M. and M.L.; Visualization, M.L. and J.L.; Supervision, H.H. and R.R.; Project Administration, R.R. and J.L.; Funding Acquisition, R.R.
Funding
This project has received funding from the European Union’s Horizon 2020 research and innovation programme 2014–2018 under grant agreement No 680395. The paper reflects only the authors’ view. The Commission is not responsible for any use that may be made of the information it contains. The research leading to these results has received funding from the COMET program managed by the Austrian Research Promotion Agency under grant number 844605. The program is co-financed by the Republic of Austria and the Federal Provinces of Burgenland, Lower Austria and Styria. Co-funding from the industry partners Repotec, Mondi and Linde shall be highly acknowledged.
Acknowledgments
The authors thank GREG for gas supply during the execution of the experiments.
Conflicts of Interest
The authors declare no conflict of interest. The funders had no role in the design of the study; in the collection, analyses, or interpretation of data; in the writing of the manuscript, or in the decision to publish the results.
References
- Zakkour, P.; Cook, G. Industrial hydrogen and syfuel production and use. In CCS Roadmap for Industry: High-Purity CO2 Sources—Sectoral Assessment; Global CCS Institute, Carbon Counts Company Ltd.: London, UK, 2010. [Google Scholar]
- Albrecht, U.; Altmann, M.; Barth, F.; Bünger, U.; Fraile, D.; Lanoix, J.-C.; Pschorr-Schoberer, E.; Vanhoudt, W.; Weindorf, W.; Zerta, M.; et al. Study on Hydrogen from Renewable Resources in the EU Final Report; Final Report; FCH: Brussels, Belgium, 2016. [Google Scholar]
- Spath, P.L.; Mann, M.K. Life Cycle Assessment of Hydrogen Production via Natural Gas Steam Reforming; National Renewable Energy Laboratory: Golden, CO, USA, 2001. [Google Scholar]
- Liu, K.; Song, C.; Subramani, V. Hydrogen and Syngas Production and Purification Technologies, 1st ed.; Wiley-AIChE: Hoboken, NJ, USA, 2009. [Google Scholar]
- Melville, L.; Weger, A.; Wiesgieckl, S.; Franke, M. Anaerobic Digestion. In Transformation of Biomass: Theory to Practice; Wiley: West Sussex, UK, 2014. [Google Scholar]
- Kolbitsch, P.; Pfeifer, C.; Hofbauer, H. Catalytic steam reforming of model biogas. Fuel 2008, 6, 701–706. [Google Scholar] [CrossRef]
- Braga, L.B.; Silveira, J.L.; da Silva, M.E.; Tuna, C.E.; Machin, E.B.; Pedroso, D.T. Hydrogen production by biogas steam reforming: A technical economic and ecological analysis. Renew. Sustain. Energy Rev. 2013, 28, 166–173. [Google Scholar] [CrossRef]
- Kothari, R.; Tyagi, V.V.; Pathak, A. Waste-to-energy: A way from renewable sources to sustainable development. Renew. Sustain. Energy Rev. 2010, 14, 3164–3170. [Google Scholar] [CrossRef]
- Yao, J.; Kraussler, M.; Benedikt, F.; Hofbauer, H. Techno-economic assessment of hydrogen production based on dual fluidized bed biomass steam gasification, biogas steam reforming, and alkaline water electrolysis processes. Energy Convers. Manag. 2017, 145, 278–292. [Google Scholar] [CrossRef]
- Effendi, A.; Hellgardt, K.; Zhang, Z.-G.; Yoshida, T. Optimising H2 production from model biogas via combined steam reforming and CO shift reactions. Fuel 2005, 84, 869–874. [Google Scholar] [CrossRef]
- Coskun, C.; Bayraktar, M.; Oktay, Z.; Dincer, I. Investigation of biogas and hydrogen production from waste water of milk-processing industry in Turkey. Int. J. Hydrog. Energy 2012, 37, 16498–16504. [Google Scholar] [CrossRef]
- Töpler, J.; Lehmann, J. Wasserstoff und Brennstoffzelle—Technologien und Marktperspektiven, 2nd ed.; Springer Vieweg: Berlin, Germany, 2017. [Google Scholar]
- Zeng, K.; Zhang, D. Recent progress in alkaline water electrolysis for hydrogen production and applications. Prog. Energy Combust. Sci. 2010, 36, 307–326. [Google Scholar] [CrossRef]
- Turner, J.; Sverdrup, G.; Mann, M.K.; Maness, P.-C.; Kroposki, B.; Ghiradi, M.; Evans, R.J.; Blake, D. Renewable hydrogen production. Int. J. Energy Res. 2007, 32, 379–407. [Google Scholar] [CrossRef]
- Fail, S.; Diaz, N.; Benedikt, F.; Kraussler, M.; Hinteregger, J.; Bosch, K.; Hackel, M.; Rauch, R.; Hofbauer, H. Wood gas processing to generate pure hydrogen suitable for PEM fuel cells. ACS Sustain. Chem. Eng. 2014, 2, 2690–2698. [Google Scholar] [CrossRef]
- Kraussler, M. Evaluation of Dual Fluidized Bed Biomass Gasification Plants Generating Electricity, Valuable Gases, and District Heat. Ph.D. Thesis, TU Wien, Wien, Austria, 2018. [Google Scholar]
- Kraussler, M.; Binder, M.; Schindler, P.; Hofbauer, H. Hydrogen production within a polygeneration concept based on dual fluidized bed biomass steam gasification. Biomass Bioenergy 2018, 111, 320–329. [Google Scholar] [CrossRef]
- Kirnbauer, F.; Hofbauer, H. The mechanism of bed material coating in dual fluidized bed biomass steam gasification plants and its impact on optimization. Powder Technol. 2013, 245, 94–104. [Google Scholar] [CrossRef]
- Kirnbauer, F.; Wilk, V.; Kitzler, H.; Kern, S.; Hofbauer, H. The positive effects of bed material coating on tar reduction in a dual fluidized bed gasifier. Fuel 2012, 95, 553–562. [Google Scholar] [CrossRef]
- Kuba, M.; Havlik, F.; Kirnbauer, F.; Hofbauer, H. Influence of bed material coating on the water-gas-shift reaction and steam reforming of toluene as tar model compound of biomass gasification. Biomass Bioenergy 2016, 89, 40–49. [Google Scholar] [CrossRef]
- Kaltschmitt, M.; Hartmann, H.; Hofbauer, H. Energie aus Biomasse, 3rd ed.; Springer Vieweg: Berlin/Heidelberg, Germany, 2016. [Google Scholar]
- Loipersböck, J.; Lenzi, M.; Rauch, R.; Hofbauer, H. Hydrogen production from biomass: The behavior of impurities over a CO shift unit and a biodiesel scrubber used as a gas treatment stage. Korean J. Chem. Eng. 2017, 34, 2198–2203. [Google Scholar] [CrossRef]
- Chianese, S.; Loipersböck, J.; Malits, M.; Rauch, R.; Hofbauer, H.; Molino, A.; Musmarra, D. Hydrogen from the high temperature water gas shift reaction with an industrial Fe/Cr catalyst using biomass gasification tar rich synthesis gas. Fuel Process. Technol. 2015, 132, 39–48. [Google Scholar] [CrossRef]
- Loipersböck, J.; Rehling, B.; Rauch, R.; Hofbauer, H.; Aichernig, C. Production of high purity hydrogen from biomass-derived synthesis gas using dual fluidized bed gasification technology. In Proceedings of the European Biomass Conference and Exhibition, Vienna, Austria, 1–4 June 2015. [Google Scholar]
- Bardolf, R. Optimierung eines Produktgaswäschers bei der Biomassedampfvergasung im Zweibettwirbelschichtverfahren. Ph.D. Thesis, TU Wien, Wien, Austria, 2017. [Google Scholar]
- Padurean, A.; Cormos, C.-C.; Agachi, P.-S. Pre-combustion carbon dioxide capture by gas-liquid absorption for Integrated Gasification Combined Cycle power plants. Int. J. Greenhouse Gas Control 2012, 7, 1–11. [Google Scholar] [CrossRef]
- Diaz, N. Hydrogen Separation from Producer Gas Generated by Biomass Steam Gasification. Ph.D. Thesis, TU Wien, Wien, Austria, 2013. [Google Scholar]
- Van Baten, J.; Baur, R.; Kooijman, H.; Taylor, R.; Eckert, F.; Barret, W. Cape Open to Cape Open Simulation Environment. Available online: https://www.cocosimulator.org/ (accessed on 27 September 2018).
- Peng, D.-Y.; Robinson, D.B. A New Two-Constant Equation of State. Ind. Eng. Chem. Fundam. 1976, 15, 59–64. [Google Scholar] [CrossRef]
- Brunner, F.; Krummenacher, P.; Wellig, B.; Liem, P.; Olsen, D.; Morand, R.; Hodel, D. Einführung in die Prozessintegration mit der Pinch-Methode; Bundesamt für Energie: Bern, Switzerland, 2015. [Google Scholar]
- Jaworski, Z.; Zakrzewska, B.; Pianko-Oprych, P. On thermodynamic equilibrium of carbon deposition from gaseous C-H-O mixtures. Rev. Chem. Eng. 2017, 33, 217–235. [Google Scholar] [CrossRef]
- Müller, S.; Stidl, M.; Pröll, T.; Rauch, R.; Hofbauer, H. Hydrogen from biomass: Large-scale hydrogen production based on a dual fluidized bed steam gasification system. Biomass Convers. Biorefin. 2011, 1, 55–61. [Google Scholar] [CrossRef]
- Simpson, A.P.; Lutz, A.E. Exergy analysis of hydrogen production via steam methane reforming. Int. J. Hydrog. Energy 2007, 32, 4811–4820. [Google Scholar] [CrossRef]
© 2018 by the authors. Licensee MDPI, Basel, Switzerland. This article is an open access article distributed under the terms and conditions of the Creative Commons Attribution (CC BY) license (http://creativecommons.org/licenses/by/4.0/).