Article

Multisensory Gas Chromatography for Field Analysis of Complex Gaseous Mixtures

by
Vladimir Dobrokhotov
1,2,* and
Alexander Larin
2
1
Applied Physics Institute, Western Kentucky University, Bowling Green, KY 42101, USA
2
VAON LLC, Bowling Green, KY 42101, USA
*
Author to whom correspondence should be addressed.
ChemEngineering 2019, 3(1), 13; https://doi.org/10.3390/chemengineering3010013
Submission received: 5 December 2018 / Revised: 25 January 2019 / Accepted: 28 January 2019 / Published: 2 February 2019
(This article belongs to the Special Issue TiO2 Nanoparticles: Synthesis and Applications)

Abstract

:
A novel approach to analysis of complex gaseous mixtures is presented. The approach is based on the utilization of a compact gas chromatograph in combination with an array of highly integrated and selective metal oxide (MOX) sensors. Thanks to the implementation of a multisensory detector, the device collects multiple chromatograms in a single run. The sensors in the integrated MEMS platform are very distinct in their catalytic properties. Hence, the time separation by chromatographic column is complemented by catalytic separation by a multisensory detector. Furthermore, the device can perform the analysis in a broad range of concentrations, from ppb to hundreds of ppm. Low ppb and even sub-ppb levels of detection for some analytes were achieved. As a part of this effort, nanocomposite gas sensors were synthesized for selective detection of hydrogen sulfide, mercaptans, alcohols, ketones, and heavy hydrocarbons.

1. Introduction

The detection and analysis of gases and vapors is an important part of the modern world, where gas sensing technology is becoming increasingly important for various aspects of our lives. Gas sensing technologies improve the self-sustainability of our society and the quality of everyday life. A variety of gas analysis techniques and gas detectors are regularly used to improve safety and establish more precise product quality control and process control [1,2]. Some industrial sectors such as the food/medicine, automotive, heavy industry, environmental, security, and home appliances sectors have utilized gas analysis for a wide range of applications [3,4,5,6]. The minimum requirements for analysis of gas samples, such as detection range and precision, are the most important parameters that determine the type of gas analysis technique utilized in a system. The ongoing process of developing new gas sensing methods in parallel with improving the conventional state-of-the-art gas sensors is primarily governed by modern technological processes and ecological standards that require better sensitivity, faster response and recovery time, better selectivity, and improved stability from gas sensors. Applications of gas sensors, detectors, and analyzers in the area of public safety, quality control, or system control show the importance of the detection of gaseous chemicals and volatile organic compounds (VOCs), such as alcohols (ethanol, propanol, and methanol), ketones (acetone), light hydrocarbons (methane, propane, and butane), heavy hydrocarbons (benzene, toluene, ethylbenzene, xylene), sulfur-based compounds (H2S, sulfur dioxide, and mercaptans), and others (CO, nitric oxide, ammonia) [7,8,9]. The detection of some specific gases in complex backgrounds as well as multi-component analysis of gas mixtures was found to be critically important for field applications.
The most challenging task for gas analysis remains as selectivity. Traditionally, in the industrial setting, compact personal monitors and leak detectors are used. These devices are based on arrays of electrochemical, thermocatalytic, and infrared sensors, are equipped with an air intake system, and are capable of detecting two to four gases in the ppm range. Leak detectors have multiple drawbacks, such as cross-sensitivity between the sensors and inability to work in complex chemical backgrounds. Leak detectors cannot provide a user with a comprehensive picture of the gaseous sample, such as partial concentrations of benzene, toluene, ethylbenzene, or xylene at ppb levels in the mix. As of today, the cross-sensitivity issue has not been resolved, and sensors responding to a single compound in a complex mix simply do not exist. One of a few presently existing solutions for a reliable analysis of multi-component mixes is analytical gas chromatography (GC).
Gas chromatography (GC), in combination with a variety of detectors, such as mass spectrometry (MS), flame ionization detectors (FID), photo ionization detectors (PID), pulse discharge detector s(PDD), and thermal conductivity detectors (TCD) or IR and UV spectroscopy, is the most commonly applied technique for the monitoring of complex gaseous mixtures [10,11,12,13,14,15,16,17,18]. The most popular GC detectors, such as MS, FID and PID, have several advantages such as high sensitivity over an ultra-low concentration range (<1 ppb) in combination with high accuracy and selectivity.
However, real-time field monitoring using a conventional GC with standard sensors (FID, PID, etc.) has a lot of fundamental barriers and limitations due to its bulky size, heavy weight, special carrier gases requirement, and high maintenance. The special carrier gases requirement (bulky gas tanks need to be attached to the instrument for operation) is, probably, the major drawback of conventional chromatography, limiting its portability. Furthermore, conventional gas chromatography utilizes an approach of analyzing a total signal coming from the FID or PID detector. These types of detectors are non-selective and respond to a wide variety of analytes. Typically, the PID and FID detectors response and recovery times are not fast enough to separate all the chemicals coming from the GC column. Additionally, some chemicals come out of the GC column at the same time and, because of physical limitations, cannot be evaluated separately by PID and FID detectors.
For analysis in the field conducted by a first responder or a technician, low weight and small size of the instrument, together with a short scan time, are essential. At the same time, real-life gaseous analytes are complex blends of unpredictable nature, which require the field analysis to be as comprehensive as the laboratory analysis. A detailed chemical analysis of a complex blend using a single compact GC column requires a more advanced analytical technique than conventional separation via retention time only. A productive approach to improving the evaluation of complex mixtures is based on the implementation of integrated GC detectors. Alinoori and Masoum used a sensor array detector in combination with multicapillary gas chromatography [19]. Cai and Zellers implemented dual-chemiresistor GC detectors based on monolayer-protected metal nanoclusters [20].
In this work, we utilized a highly integrated multisensory platform as a GC detector. Multisensory Gas Chromatography (MGC) is a hybrid approach combining gas chromatography and electronic nose principles. By having an electronic nose as a detector, the chemicals within a single peak can also be separated by catalytic reactivity, adding an extra dimension to conventional analytical gas chromatography. The key advantages of our technology are the utilization of scrubbed ambient air as a carrier gas and the utilization of a novel multisensory highly integrated platform as a GC detector. The detector’s short response and recovery time, together with ultra-high sensitivity, allowed us to obtain high-resolution chromatograms for analytes of interest from light (hydrogen sulfide, carbon monoxide) to heavy (O-Xylene) in a short time interval of 12.5 min on a single compact GC column.

2. Experiment

The use of metal oxide (MOX) sensors as GC detectors has the advantage of enabling the use of scrubbed ambient air as the carrier gas for the GC column. This is a great advantage for a portable GC, because the user is not burdened with the bulk of compressed ultra-zero grade gases, which is required by more traditional gas chromatographs using traditional detectors. A multi-sensor array system was developed to improve the performance of the conventional metal oxide detectors, based on a single sensing element. Multiple electronically independent sensing elements significantly improve the signal-to-noise ratio of the detector due to independence of their outputs without chemical exposure and their synchronized response under exposure. The detector consists of an integrated multisensory platform, with an array of four sensor elements and a modified transistor outline (TO) package (Figure 1). The integrated multi-sensor platform (2.5 mm × 2.5 mm × 0.3 mm) was designed to control the operation of four sensor elements at high temperatures, providing synchronized multisensory analysis of gas samples.
The integrated multisensory platform is owned by VAON LLC [21,22,23]. This design provides high detector stability over a long period of time at elevated temperatures in the range between 200 and 600 °C. The multisensory platform consists of four pairs of platinum electrodes for four identical sensing elements and a platinum cross-shaped heater located on the suspended membrane (1.5 mm × 1.5 mm × 0.05 mm) at the center of the platform (Figure 1a,b). The contacts and the heater were fabricated on the Si/SiO2 (300/0.5 µm) substrate simultaneously, by using photolithographic (Suss Mask Aligner MA6/MA8) and magnetron sputtering techniques (KJL PVD 75 Sputtering System), followed by a liftoff process. The total thickness of 300 ± 10 nm of the Pt contacts and the heater was verified by using a surface profilometer (KLA-Tencor Alpha-Step IQ). The membrane structure was fabricated by using reactive ion etching (RIE) and deep reactive ion etching (DRIE) techniques, by utilizing MARCH RIE CS-1701 and Oxford PlasmaLab System 100 ICP 300 Deep RIE instruments, respectively. The membrane is connected to the main platform’s base via small Si/SiO2 connectors. The temperature insulation of the multisensory platform from the TO package was accomplished by suspending the platform on thin metal legs at the corners of the platform. The electrical connection between the multisensory platform and the TO package was formed by using a wire-bonding technique (Figure 1b). The individual sensor response is defined as the ratio of the sensor’s resistance in ambient air to its resistance in the presence of analytes:
S e n s o r s   r e s p o n s e = R a i r R g a s
Four different types of tin oxide (SnO2)-based nanocomposite thin films (Figure 2, Table 1) were prepared, and a comprehensive analysis of their gas sensing performances was conducted. All the depositions were conducted under 5 mTorr of argon pressure. A thin layer of SnO2 (30 ± 2 nm) was first deposited over all four sensors (S1–S4). During the SnO2 sputtering, the deposition rate was kept constant at 0.6 A/s by applying 200 W RF power to a 4 inch tin oxide (SnO2 99.99%) target under 12 mTorr of Argon pressure. The sensor S1 was left unmodified. The surface of sensor S2 was functionalized with 10 ± 0.2 nm of titanium dioxide (TiO2 99.99%), deposited over the SnO2 layer at 150 W RF power. The surface of sensor S3 was modified with a thin bimetal Au(90%)/Pd(10%) alloy layer by simultaneous sputtering from both Au and Pd targets. The DC power for the Pd target was 15 W to keep the deposition rate of Pd at 0.1 A/s, and the power for the gold target was 50 W, keeping the deposition rate at 1 A/s. A 10 s deposition produced a layer of Au/Pd alloy 1.1 nm thick. The sensor S4 was modified with 1.5 ± 0.2nm of platinum (Pt 99.99%), deposited over the SnO2 layer by applying 50 W DC power to a 2 inch metal target. The thicknesses of all the layers were monitored during the deposition process by using a quartz crystal sensor (Inficon, Bad Ragaz, Switzerland, Gold, 6Mhz) and verified by a surface profilometer (Alpha Step 500, KLA Tencor, Milpitas, CA, USA). More information on the novel integrated detector is found in the works [21,22,23].
The table-top MGC setup and its schematic diagram are shown in the Figure 3 and Figure 4, respectively. The analyzer is equipped with a Megabore Gas Chromatography Column (MXT-Wax, polyethylene glycol, 30 m, 2 m film thickness, from Restek). The following operational conditions were implemented: Flow rate of 14 sccm (standard cubic centimeters per minute) of clean dry air and constant column temperature of 55 °C. The operational temperature of the detector was kept at 250 °C. The analyzer’s operating cycle includes: Sampling, gas mixture separation, and detection. During the first step, the gas sample is injected in the system. The detection of gas components was performed by the integrated detector inside a low dead volume detector cell of 1 mL3. After the analysis, the purging and cleaning cycle was applied to the systems to remove the leftover contaminants. This is an automatic function that was performed by the analyzer using its own generated clean air.
Three gas mixtures were utilized for the illustration of the MGC concept. Each mix (Table 2) is of interest for a particular industrial, environmental, or biomedical application [24,25,26,27,28,29,30,31,32,33,34,35,36,37,38]. The detection of low concentrations of H2S, ethyl-mercaptan, and BTEX (benzene, toluene, ethylbenzene, xylene) compounds was ascertained to be very important for indoor air quality monitoring. All the gas compounds from Mix. 1 were diluted in 1 L of zero grade air, and then a small sample volume of 50 mL was analyzed. The chromatograms of Mix. 1, collected simultaneously from all four sensor elements of the integrated detector, are shown in Figure 5. Seven major peaks were detected and each of the compounds was identified according to a specific retention time.
Furthermore, the ability of the system to analyze gas samples in complex backgrounds (different than air) was tested and verified in this series of experiments. The detection of ultra-low concentrations of gas impurities (H2S, ethyl-mercaptan, benzene, toluene, ethylbenzene, and o-xylene) in pure methane (99.99%) was accomplished, and all the gas components were identified (Figure 6a,b). The light compounds were separated within a very short time interval (<20 s) thanks to the specificity of the sensors S2 and S3 to H2S and hydrocarbons, respectively. The experiment with methane as a background gas confirms the advantage of multi-dimensional chromatography by using an array of sensors instead of a single non-selective PID or FID detector. This advantage can be utilized in the area of natural gas analysis by using a portable instrument with a single GC column under constant temperature.
The third gas mixture (Mix. 3) was analyzed in order to demonstrate the instrument’s ability to process very complex gas samples, similar to a human breath, with 10 or more compounds from different chemical groups (hydrocarbons, ketones, alcohols, sulfur compounds, and CO). It was found that some biomarkers in human breath like acetone, ammonia, CO, hydrogen sulfide, mercaptans, and BTEX can be used for diagnostics of diseases, as well as for monitoring the level of exposure to toxins. Mix. 3 was introduced into the GC and the output of the four sensors from the integrated array is shown in Figure 7. The same mix was introduced into a GC, utilizing a conventional MOX detector (TGS 2602, Figaro USA Inc., Arlington Heights, IL, USA). The detector output is shown in Figure 8. As it can be seen from comparison of Figure 7 and Figure 8, the chemicals from 1 to 3 (carbon monoxide, hydrogen sulfide, and ethyl mercaptan) and 5 and 6 (ethanol and benzene) are inseparable by a conventional detector and come out as single peaks on the chromatogram. Their partial concentrations cannot be measured using a conventional detector. In contrast, due to the quick response and recovery of the multisensory detector, these chemicals are separated in time as individual peaks.
In addition to qualitative evaluation of gas mixtures, a quantitative calibration of the integrated detector was also performed. The standard approach for GC signal evaluation is based on calculating the area under the curve for each peak detected. In this work, the integrated detector’s response was calculated by integrating the area under the curve over the time interval for each gas.
The detector’s performance was evaluated over a period of 10 days. During this time, the response of the detector was monitored upon exposure to different concentrations of detectable gases: H2S (10–500 ppb), ethyl-mercaptan (10–500 ppb), acetone (10–500 ppb), ethanol (10–500 ppb), and BTEX (10–500 ppb). Finally, the calibration curves for the concentrations of various gases for all four sensors were obtained and shown in Figure 9a–d. All four sensors exhibited a non-linear behavior upon exposure to various gases in the concentration range between 10 and 500 ppb. It was verified that pure SnO2 has very low sensitivity at ppb level and poor selectivity (Figure 9a). The TiO2–SnO2 sensor, which was specifically designed for the detection of H2S, also displayed a high response to ethyl mercaptan (Figure 9b). The SnO2 sensor modified with Au/Pd bimetal nanoparticles was capable of detecting heavy (BTEX) hydrocarbons at ultralow concentrations (Figure 9c). Finally, the highest sensitivity to ethanol and acetone was obtained by using SnO2 film modified with Pt nanoparticles (Figure 9d).
The carbon-based pre-concentrator material (10 mg of Carbopack B, 60/80 mesh from Supelco No. 20273) utilized in the portable GC was specifically targeting heavy hydrocarbons (BTEX). A sub-ppb level of detection was achieved thanks to the utilization of the pre-concentrator in combination with a highly sensitive detector (Figure 10a). In the process, the background signal from the GC was recorded upon analyzing zero grade air samples. It was determined that the integrated response of the Au/Pd@SnO2 sensor to 0.5 ppb of BTEX was higher than the background signal of the portable GC for all the BTEX components, with a confidence level of 99.74% (Figure 10b). It is worth noting that the fast response and recovery of the detector substantially improves the spectral resolution of the GC and makes the sample analysis more comprehensive, especially in cases of complex contaminated backgrounds or high humidity conditions.

3. Discussion

The ability of the instrument to analyze complex mixes containing light and heavy compounds on a single compact GC column at constant temperature is one of the key advantages that separates our technology from similar products. In particular, for a portable natural gas analyzer, the ability to analyze sulfur-based gaseous compounds and BTEX at the same time is of great importance. It was achieved thanks to the chemical compositions and morphologies of the materials utilized in the integrated detector. Materials for the integrated detector were selected based on considerations as follows.
The advanced sensitivity of the hybrid type SnO2–TiO2 sensor is mainly related to a specific charge transfer and heterojunction formation between the grains of two different oxides. The electronic structures of SnO2 and TiO2 oxides, including band gap, work function, and electron affinity, were found to be different (Figure 11a). The band gap of polycrystalline SnO2 for direct (4.17 eV) and indirect (3.35 eV) transitions was measured by using UV-Vis spectrometry (Tauc plot, Thermo Scientific, Waltham, MA, USA) and was found to be larger than the optical band gap of TiO2, with 3.84 eV and 3.15 eV for direct and indirect transitions, correspondingly. The result obtained from the optical band gap measurement agrees with values previously reported by other research groups for polycrystalline SnO2 with rutile crystal structure (3.5–4.0 eV) [39,40,41] and polycrystalline TiO2 with anatase crystal structure (3.2–3.6 eV) [42,43,44,45]. Also, the work function of polycrystalline rutile SnO2 [46] was reported to be larger than the work function and electron affinity of polycrystalline anatase TiO2 [47,48] by approximately 0.3–0.5 eV. As a result of different band energy structures, a type two heterojunction is formed between SnO2 and TiO2 nanocrystals, with valence and conduction band misalignment and bending at the crystals interface (Figure 11b) [49,50]. It was shown that that the heterojunction is growing, even in the case of anatase TiO2 and rutile SnO2 crystals with slightly different lattice parameters. The formation of the heterojunction leads to a discontinuity in the conduction band and formation of the energy barrier at the interface due to the electron transfer. The electron transfer from the conduction band of TiO2 to the conduction band of SnO2 is primarily determined by the position of the Fermi energy level of TiO2, which is higher with respect to SnO2 Fermi level.
The effect of charge transfer and heterojunction formation on the gas sensitization mechanism of nanocomposite SnO2/TiO2 is shown in Figure 12 and is determined by three components. First, the transfer of free carriers from TiO2 crystal leads to the increase of incomplete bonding in TiO2 crystals. Second, a relatively high electron affinity of TiO2 determines the adsorption of reducing gases in the form of negative ions at the TiO2 surface. Third, the formation of an electron-enriched zone at the SnO2 side of the interface amplifies oxygen adsorption in this region [51,52] under standard ambient air conditions. Trapping of free electrons at the surface of the electron-enriched region increases the depletion depth (z0) and reduces the conductance of the TiO2–SnO2 layer compared to the conductance of polycrystalline SnO2 (Figure 12a). In our experiments, TiO2–SnO2 hybrid sensors demonstrated higher resistance in the ultra-zero grade air and also a much higher Rair/Rgas upon exposure to H2S, compared to a single-oxide homogeneous system. This is because hybrid TiO2–SnO2 sensors have more surface oxygen species, resulting in the generation of higher numbers of free carries from catalytic oxidation of H2S to water and sulfur dioxide than the same reaction at the surface of polycrystalline SnO2 [53]:
H 2 S + 3 O SnO 2 ( T e m p ~ 150 200   ° C ) H 2 O + SO 2 + 3 e .
The direct oxidation of H2S to elemental sulfur with stoichiometric amounts of oxygen at the surface of the TiO2 crystal is mainly described by MODOP (mobile direct oxidation process) [54]:
H 2 S + 2 O TiO 2 ( T e m p ~ 150 200   ° C )   H 2 O + 2 n S n + 2 e .
The other oxidation reactions between H2S and ionized surface oxygen at the surface of TiO2 crystals are also possible and not restricted. The enhanced catalytic activity of both oxides, together with amplified resistance changes due to charge transfer effects (bulk–surface and oxide–oxide), make the hybrid TiO2–SnO2 sensor superior to single-oxide (SnO2 or TiO2) sensors (Figure 12b).
The effect of monometallic nanoparticles was found to have a significant impact on the sensor performance. At the same time, it was shown that different metal doping (Au vs. Pd) might have different effects on conductivity of the main oxide (SnO2) and sensing mechanisms [55,56]. In our work, we developed a novel SnO2 gas sensor based on Au/Pd bimetal nanoparticles by combining the best theories and observations reported by different research groups over the years. In our design, the main function of the ultrathin (30 nm) tin oxide layer is to be a catalyst support material for bimetal nanoparticles that can be easily depleted or enriched with free carriers from gas species or from the bimetal nanoparticles. The catalytic activity of pure SnO2 crystals (far from the metal–semiconductor junction) is its secondary function, based on much higher catalytic activity of noble metal nanoparticles under low activation temperatures (~200 °C). The performance of SnO2 layer functionalized with monometallic nanoparticles was found to have its natural limitations due to the specific properties of the metals (Au or Pd). Pure gold nanoparticles have extremely high catalytic and dissociative activity, but the formation of a metal–semiconductor junction between the gold nanoparticles and the SnO2 crystals has not been observed (Figure 13a). In contrast, the Pd nanoparticles create an excellent electronic junction with SnO2 nanocrystals, but they are less efficient in terms of mobile oxygen dissociation and gas spillover effect (Figure 13b). Sensor functionalization with bimetal nanoparticles combining the best characteristics of both metals, including small particle size, thermal and mechanical stability, catalytically active surface, and electronic exchange between the metal nanoparticles and the MOX layer, is the one of the original ideas in this work. In particular, Au/Pd bimetal nanoparticles were synthesized to improve the catalytic activity of metal nanoclusters, and provide stable electronic interactions between Au/Pd nanoparticles and the support layer (Figure 14) [57,58,59].
A series of experimental evaluations of the integrated GC detector were accomplished and several important characteristics were obtained, including: The optimal operational temperature, response value (Rair/Rgas), detection limit upon steady state exposure to low concentrations of analytes, and detector’s sensitivity to humidity. The optimum operational temperature of the sensors for detection of low concentrations of analytes was obtained by using a multi-channel gas mixing system. During the experiment, the baseline resistance was measured in ultra-zero grade air (Figure 15a) under different temperature conditions in a range from 25 to 400 °C, and the change of the sensors’ resistances were then recorded upon steady state exposure to 0.5 ppm of benzene (Figure 15b). The sensors’ responses (Rair/Rgas) was then calculated for each temperature condition and the optimum temperature with a corresponding maximum sensor performance was found for all four sensors (S1–S4) (Figure 15c). It was found that when the target gas was switched from benzene to toluene of the same concentration, the same result for the optimum operating temperature was obtained for all the sensors. Pure SnO2 sensor demonstrated very poor sensitivity and a high operational temperature of 325 °C. The highest baseline resistance as well as the highest response was observed for the SnO2 functionalized with bimetal Au/Pd alloy nanoparticles (S3). The lowest operational temperature of 250 °C was also observed for the same sensor S3.
After the optimum operational temperature was determined, sensors’ responses to different concentrations of analytes and the sensors’ baselines were monitored over a period of two weeks (Figure 16a,b). The sensors demonstrated linear behavior upon exposure to lower concentrations (1–100 ppb) and a nonlinear behavior for higher concentrations (>100 ppb). It was found that functionalization of sensors with metal nanoparticles increases the sensitivity of sensors. Sensor S3 demonstrated the highest sensitivity toward the low concentrations of benzene and toluene.
The minimum limit of detection (LOD) for analytes with a confidence level of 99.7% was determined by analyzing the drift in the sensor’s baseline and the sensor’s response over the period of two weeks. The concept of LOD is demonstrated in Figure 17. In this analysis, the normal distribution function was used to find the average value and the standard deviation of the baseline over time and the variations in sensors’ responses over time for multiple identical exposures. A low detection limit is defined as the minimum measurable signal exceeding the threshold. The threshold is equal to the mean value of noise plus three standard deviations of the noise. The distance of three standard deviations from the mean value corresponds to 99.7% of the area under the normal distribution curve. Hence, the choice of parameters will assure that the signal can be distinguished from noise with 99.7% probability. In Figure 16, the horizontal dashed line shows the level of the threshold. All of the points above the threshold can be detected with 99.7% probability or higher. Also, a comparative analysis of the sensors’ performances at different humidity levels, as well as the responses of sensors to 0.5 ppb of analytes under different humidity conditions, was investigated. The baseline resistances of sensors S1–S4 were recorded upon exposing them to ultra-zero grade air, and the corresponding humidity level inside the detector’s chamber was found to be less than 5%. The response of each sensor upon increasing the relative humidity to 25%, 60%, and 90% was then calculated (Figure 18a). The responses of sensors S1–S4 upon exposure to 0.5 ppb of benzene were collected under different humidity conditions (Figure 18b). It was demonstrated that the responses were affected by the humidity level. Based on our experiments, it was found that the sensors containing metal nanoparticles are less affected by humidity. However, the humidity level will not affect the device performance in any way, because with the current sampling system, the water will be completely separated in time from the other analytes.

4. Conclusions

In this work, we introduced a concept of multisensory gas chromatography by utilizing a multisensory integrated platform as a detector for a compact GC. A unique combination of elements and principles utilized in our device brings analytical gas instrumentation to a new level. Novel nanocomposite metal oxide MEMS sensors arrays demonstrated outstanding performance for detection of ultra-low concentrations of gases and vapors, down to the 1 ppb level. The detector’s short response and recovery time, together with ultra-high sensitivity, allowed us to obtain high-resolution chromatograms for analytes of interest in a short time interval of 12.5 min. By combining time separation, using a chromatography column with chemical separation (by catalytic reactivity), a substantially more comprehensive analysis of a gas mixtures can be then obtained. That is, by utilizing four very different sensory elements in one detector, four chromatograms are obtained in a single analysis cycle, adding another dimension to the separation and recognition of chemicals.

Author Contributions

V.D. contributed to conceptualization, methodology, project administration, data analysis and validation. He was also responsible for manuscript preparation, review and editing. A.L. contributed to device assembly, calibration and data collection.

Funding

Funding for this research was provided by VAON LLC.

Conflicts of Interest

The authors declare no conflict of interest.

References

  1. Mullen, P.W. Modern Gas Analysis. Interscience Manuals, Volume 6; Interscience Publishers: New York, NY, USA, 1955. [Google Scholar]
  2. Mandayo, G.G.; Gonzalez-Chavarri, J.; Hammes, E.; Newton, H.; Castro-Hurtado, I.; Ayerdi, I.; Knapp, H.; Sweetman, A.; Hewitt, C.N.; Castaño, E. System to control indoor air quality in energy efficient buildings. Urban Clim. 2015, 14, 475–485. [Google Scholar] [CrossRef] [Green Version]
  3. The National Institute for Occupational Safety and Health (NIOSH); United States Public Health Service, Division of Occupational. The Industrial Environment—Its Evaluation & Control, 3rd ed.; for sale by the Supt. of Docs.; U.S. Govt. Print. Off.: Washington, DC, USA, 1973.
  4. Bielecki, Z.; Janucki, J.; Kawalec, A.; Mikołajczyk, J.; Pałka, N.; Pasternak, M.; Pustelny, T.; Stacewicz, T.; Wojtas, J. Sensors and Systems for the Detection of Explosive Devices—An Overview. Metrol. Meas. Syst. 2012, 19, 3–28. [Google Scholar] [CrossRef]
  5. Miekisch, W.; Schubert, J.K.; Noeldge-Schomburg, G.F.E. Diagnostic potential of breath analysis—Focus on volatile organic compounds. Clin. Chim. Acta 2004, 347, 25–39. [Google Scholar] [CrossRef]
  6. Megson, D.; Reiner, E.J.; Jobst, K.J.; Dorman, F.L.; Robson, M.; Focant, J.F. A review of the determination of persistent organic pollutants for environmental forensics investigations. Anal. Chim. Acta 2016, 941, 10–25. [Google Scholar] [CrossRef] [PubMed]
  7. Brown, A.S.; Milton, M.J.T.; Cowper, C.J.; Squire, G.D.; Bremser, W.; Branch, R.W. Analysis of natural gas by gas chromatography: Reduction of correlated uncertainties by normalisation. J. Chromatogr. A 2004, 1040, 215–225. [Google Scholar] [CrossRef] [PubMed]
  8. Patnaik, P. Handbook of Environmental Analysis: Chemical Pollutants in Air, Water, Soil, and Solid Wastes, 1st ed.; CRC Press: Boca Raton, FL, USA, 1997; pp. 285–435. [Google Scholar]
  9. Brattoli, M.; Cisternino, E.; Dambruoso, P.; De Gennaro, G.; Giungato, P.; Mazzone, A.; Palmisani, J.; Tutino, M. Gas Chromatography Analysis with Olfactometric Detection (GC-O) as a Useful Methodology for Chemical Characterization of Odorous Compounds. Sensors 2013, 13, 16759–16800. [Google Scholar] [CrossRef] [Green Version]
  10. De Blas, M.; Navazo, M.; Alonso, L.; Durana, N.; Iza, J. Automatic on-line monitoring of atmospheric volatile organic compounds: Gas chromatography-mass spectrometry and gas chromatography-flame ionization detection as complementary systems. Sci. Total Environ. 2011, 409, 5459–5469. [Google Scholar] [CrossRef] [PubMed]
  11. Cui, D.F.; Chen, X.; Zhang, L.L.; Cai, H.Y.; Li, H. A micro gas chromatography column with a micro thermal conductivity detector for volatile organic compound analysis. Rev. Sci. Instrum. 2013, 84, 025001. [Google Scholar] [CrossRef]
  12. Skov, H.; Lindskog, A.; Palmgren, F.; Christensen, C.S. An overview of commonly used methods for measuring benzene in ambient air. Atmos. Environ. 2001, 35, 141–148. [Google Scholar] [CrossRef]
  13. Liaud, C.; Nguyen, N.T.; Nasreddine, R.; Le Calvé, S. Experimental performances study of a transportable GC-PID and two thermo-desorption based methods coupled to FID and MS detection to assess BTEX exposure at sub-ppb level in air. Talanta 2014, 127, 33–42. [Google Scholar] [CrossRef]
  14. Gallego, E.; Roca, F.J.; Perales, J.F.; Sánchez, G.; Esplugas, P. Characterization and determination of the odorous charge in the indoor air of a waste treatment facility through the evaluation of volatile organic compounds (VOCs) using TD–GC/MS. Waste Manag. 2012, 32, 2469–2481. [Google Scholar] [CrossRef]
  15. De Blas, M.; Navazo, M.; Alonso, L.; Durana, N.; Gomez, M.; Iza, J. Simultaneous indoor and outdoor on-line hourly monitoring of atmospheric volatile organic compounds in an urban building. The role of inside and outside sources. Sci. Total Environ. 2012, 426, 327–335. [Google Scholar] [CrossRef] [PubMed]
  16. Zimmermann, S.; Wischhusen, S.; Müller, J. Micro flame ionization detector and micro flame spectrometer. Sens. Actuators B Chem. 2000, 63, 159–166. [Google Scholar] [CrossRef]
  17. Nasreddine, R.; Person, V.; Serra, C.A.; Le Calve, S. Development of a novel portable miniaturized GC for near real-time low level detection of BTEX. Sens. Actuators B Chem. 2016, 224, 159–169. [Google Scholar] [CrossRef]
  18. Garg, A.; Akbar, M.; Vejerano, E.; Narayanan, S.; Nazhandali, L.; Marrb, L.C.; Agaha, M. Zebra GC: A mini gas chromatography system for trace-level determination of hazardous air pollutants. Sens. Actuators B Chem. 2015, 212, 145–154. [Google Scholar] [CrossRef]
  19. Alinoori, A.; Masoum, S. Multicapillary Gas Chromatography-Temperature Modulated Metal Oxide Semiconductor Sensors Array Detector for Monitoring of Volatile Organic Compounds in Closed Atmosphere Using Gaussian Apodization Factor Analysis. Anal. Chem. 2018, 90, 6635–6642. [Google Scholar] [CrossRef] [PubMed]
  20. Dual-Chemiresistor, G.C. Detector Employing Monolayer-Protected Metal Nanocluster Interfaces Cai, Qing-Yun; Zellers, Edward T. Anal. Chem. 2002, 74, 3533–3539. [Google Scholar]
  21. Dobrokhotov, V.; Larin, A. Doped, Metal Oxide-Based Chemical Sensors. U.S. Patent 10,132,769, 20 November 2018. [Google Scholar]
  22. Larin, A.; Womble, P.C.; Dobrokhotov, V. Novel highly-integrated MEMS based solid state detectors for analytical gas chromatography. Sens. Actuators B (Chem.) 2018, 256, 1057–1068. [Google Scholar] [CrossRef]
  23. Larin, A.; Womble, P.C.; Dobrokhotov, V. Hybrid SnO2/TiO2 Nanocomposites for Selective Detection of Ultra-Low Hydrogen Sulfide Concentrations in Complex Backgrounds. Sensors 2016, 16, 1373. [Google Scholar] [CrossRef]
  24. Stranger, M.; Potgieter-Vermaak, S.; van Grieken, R. Characterization of indoor air quality in primary schools in Antwerp, Belgium. Indoor Air 2008, 18, 454–463. [Google Scholar] [CrossRef]
  25. Hulin, M.; Caillaud, D.; Annesi-Maesano, I. Indoor air pollution and childhood asthma: Variations between urban and rural areas. Indoor Air 2010, 20, 502–514. [Google Scholar] [CrossRef] [PubMed]
  26. Darlington, A.B.; Dat, J.F.; Dixon, M.A. The biofiltration of indoor air: Air flux and temperature influences the removal of toluene, ethylbenzene, and xylene. Environ. Sci. Technol. 2001, 35, 240–246. [Google Scholar] [CrossRef] [PubMed]
  27. Guo, H.; Lee, S.C.; Li, W.M.; Cao, J.J. Source characterization of BTEX in indoor microenvironments in Hong Kong. Atmos. Environ. 2003, 37, 73–82. [Google Scholar] [CrossRef]
  28. Reynolds, S.J.; Donham, K.J.; Stookesberry, J.; Thorne, P.S.; Subramanian, P.; Thu, K.; Whitten, P. Air quality assessments in the vicinity of swine production facilities. J. Agromed. 1997, 4, 37–45. [Google Scholar] [CrossRef]
  29. Godish, T.; Davis, W.T.; Fu, J.S. Air Quality; CRC Press: Boca Raton, FL, USA, 2014. [Google Scholar]
  30. Kidnay, A.J.; Parrish, W.R.; McCartney, D.G. Fundamentals of Natural Gas Processing; CRC Press: Boca Raton, FL, USA, 2011; Volume 218. [Google Scholar]
  31. Al-Juaied, M.; Koros, W. Performance of natural gas membranes in the presence of heavy hydrocarbons. J. Membr. Sci. 2006, 274, 227–243. [Google Scholar] [CrossRef]
  32. Papadias, D.D.; Ahmed, S.; Kumar, R. Fuel quality issues with biogas energy–An economic analysis for a stationary fuel cell system. Energy 2012, 44, 257–277. [Google Scholar] [CrossRef]
  33. Hill, D.; Binions, R. Breath Analysis for Medical Diagnosis. Int. J. Smart Sens. Intell. Syst. 2012, 5. [Google Scholar] [CrossRef]
  34. Manolis, A. The diagnostic potential of breath analysis. Clin. Chem. 1983, 29, 5–15. [Google Scholar]
  35. Dweik, R.A.; Amann, A. Exhaled breath analysis: The new frontier in medical testing. J. Breath Res. 2008, 2, 030301. [Google Scholar] [CrossRef]
  36. Peng, G.; Tisch, U.; Adams, O.; Hakim, M.; Shehada, N.; Broza, Y.Y.; Billan, S.; Abdah-Bortnyak, R.; Kuten, A.; Haick, H. Diagnosing lung cancer in exhaled breath using gold nanoparticles. Nat. Nanotechnol. 2009, 4, 669–673. [Google Scholar] [CrossRef]
  37. Phillips, M.; Basa-Dalay, V.; Bothamley, G.; Cataneo, R.N.; Lam, P.K.; Natividad, M.P.R.; Schmitt, P.; Wai, J. Breath biomarkers of active pulmonary tuberculosis. Tuberculosis 2010, 90, 145–151. [Google Scholar] [CrossRef] [PubMed]
  38. Amorim, L.C.A.; Cardeal, Z.D.L. Breath air analysis and its use as a biomarker in biological monitoring of occupational and environmental exposure to chemical agents. J. Chromatogr. B 2007, 853, 1–9. [Google Scholar] [CrossRef] [PubMed]
  39. Siedl, N.; Baumann, S.O.; Elser, M.J.; Diwald, O. Particle networks from powder mixtures: Generation of TiO2–SnO2 heterojunctions via surface charge-induced heteroaggregation. J. Phys. Chem. C 2012, 116, 22967–22973. [Google Scholar] [CrossRef] [PubMed]
  40. Varela, J.A.; Perazolli, L.A.; Cerri, J.A.; Leite, E.R.; Longo, E. Sintering of tin oxide and its applications in electronics and processing of high purity optical glasses. Cerâmica 2001, 47, 117–123. [Google Scholar] [CrossRef]
  41. De Mendonça, V.R.; Dalmaschio, C.J.; Leite, E.R.; Niederberger, M.; Ribeiro, C. Heterostructure formation from hydrothermal annealing of preformed nanocrystals. J. Mater. Chem. A 2015, 3, 2216–2225. [Google Scholar] [CrossRef]
  42. Scanlon, D.O.; Dunnill, C.W.; Buckeridge, J.; Shevlin, S.A.; Logsdail, A.J.; Woodley, S.M.; Catlow, C.R.A.; Powell, M.J.; Palgrave, R.G.; Parkin, I.P.; et al. Band alignment of rutile and anatase TiO2. Nat. Mater. 2013, 12, 798–801. [Google Scholar] [CrossRef] [PubMed]
  43. Dang, V.S.; Parala, H.; Kim, J.H.; Xu, K.; Srinivasan, N.B.; Edengeiser, E.; Havenith, M.; Wieck, A.D.; de los Arcos, T.; Fischer, R.A.; et al. Electrical and optical properties of TiO2 thin films prepared by plasma-enhanced atomic layer deposition. Phys. Status Solidi (a) 2014, 211, 416–424. [Google Scholar] [CrossRef]
  44. Bedja, I.; Kamat, P.V. Capped semiconductor colloids. Synthesis and photoelectrochemical behavior of TiO2 capped SnO2 nanocrystallites. J. Phys. Chem. 1995, 99, 9182–9188. [Google Scholar] [CrossRef]
  45. Liu, G.; Jaegermann, W.; He, J.; Sundström, V.; Sun, L. XPS and UPS characterization of the TiO2/ZnPcGly heterointerface: Alignment of energy levels. J. Phys. Chem. B 2002, 106, 5814–5819. [Google Scholar] [CrossRef]
  46. Kwoka, M.; Ottaviano, L.; Szuber, J. Photoemission studies of the surface electronic properties of L-CVD SnO2 ultra thin films. Appl. Surf. Sci. 2012, 258, 8425–8429. [Google Scholar] [CrossRef]
  47. Imanishi, A.; Tsuji, E.; Nakato, Y. Dependence of the work function of TiO2 (Rutile) on crystal faces, studied by a scanning auger microprobe. J. Phys. Chem. C 2007, 111, 2128–2132. [Google Scholar] [CrossRef]
  48. Xiong, G.; Shao, R.; Droubay, T.C.; Joly, A.G.; Beck, K.M.; Chambers, S.A.; Hess, W.P. Photoemission electron microscopy of TiO2 anatase films embedded with rutile nanocrystals. Adv. Funct. Mater. 2007, 17, 2133–2138. [Google Scholar] [CrossRef]
  49. Li, H.; Xie, C.; Liao, Y.; Liu, Y.; Zou, Z.; Wu, J. Characterization of Incidental Photon-to-electron Conversion Efficiency (IPCE) of porous TiO2/SnO2 composite film. J. Alloy. Compd. 2013, 569, 88–94. [Google Scholar] [CrossRef]
  50. Cahen, D.; Hodes, G.; Graetzel, M.; Guillemoles, J.F.; Riess, I. Nature of photovoltaic action in dye-sensitized solar cells. J. Phys. Chem. B 2000, 104, 2053–2059. [Google Scholar] [CrossRef]
  51. Trakhtenberg, L.; Gerasimov, G.N.; Gromov, V.F.; Belysheva, T.V.; Ilegbusi, O.J. Gas semiconducting sensors based on metal oxide nanocomposites. J. Mater. Sci. Res. 2012, 1, 56. [Google Scholar] [CrossRef]
  52. Suchorska-Woźniak, P.; Rac, O.; Fiedot, M.; Teterycz, H. Analysis of SnO2 | WO3 heterocontact properties during the detection of hydrogen sulphide. Sensors 2014, 14, 20480–20499. [Google Scholar] [CrossRef] [PubMed]
  53. Mei, L.; Chen, Y.; Ma, J. Gas sensing of SnO2 nanocrystals revisited: Developing ultra-sensitive sensors for detecting the H2S leakage of biogas. Sci. Rep. 2014, 4, 6028. [Google Scholar] [CrossRef] [PubMed]
  54. Chun, S.W.; Jang, J.Y.; Park, D.W.; Woo, H.C.; Chung, J.S. Selective oxidation of H2S to elemental sulfur over TiO2/SiO2 catalysts. Appl. Catal. B Environ. 1998, 16, 235–243. [Google Scholar] [CrossRef]
  55. Korotcenkov, G.; Brinzari, V.; Gulina, L.B.; Cho, B.K. The influence of gold nanoparticles on the conductivity response of SnO2-based thin film gas sensors. Appl. Surf. Sci. 2015, 353, 793–803. [Google Scholar] [CrossRef]
  56. Chlala, D.; Labaki, M.; Giraudon, J.M.; Gardoll, O.; Denicourt-Nowicki, A.; Roucoux, A.; Lamonier, J.F. Toluene total oxidation over Pd and Au nanoparticles supported on hydroxyapatite. C. R. Chim. 2016, 19, 525–537. [Google Scholar] [CrossRef]
  57. Tabakova, T.; Ilieva, L.; Petrova, P.; Venezia, A.M.; Avdeev, G.; Zanella, R.; Karakirova, Y. Complete benzene oxidation over mono and bimetallic Au–Pd catalysts supported on Fe-modified ceria. Chem. Eng. J. 2015, 260, 133–141. [Google Scholar] [CrossRef]
  58. Silva, T.A.; Teixeira-Neto, E.; López, N.; Rossi, L.M. Volcano-like behavior of Au-Pd core-shell nanoparticles in the selective oxidation of alcohols. Sci. Rep. 2014, 4, 5766. [Google Scholar] [CrossRef] [PubMed]
  59. Wang, D.; Villa, A.; Porta, F.; Prati, L.; Su, D. Bimetallic gold/palladium catalysts: Correlation between nanostructure and synergistic effects. J. Phys. Chem. C 2008, 112, 8617–8622. [Google Scholar] [CrossRef]
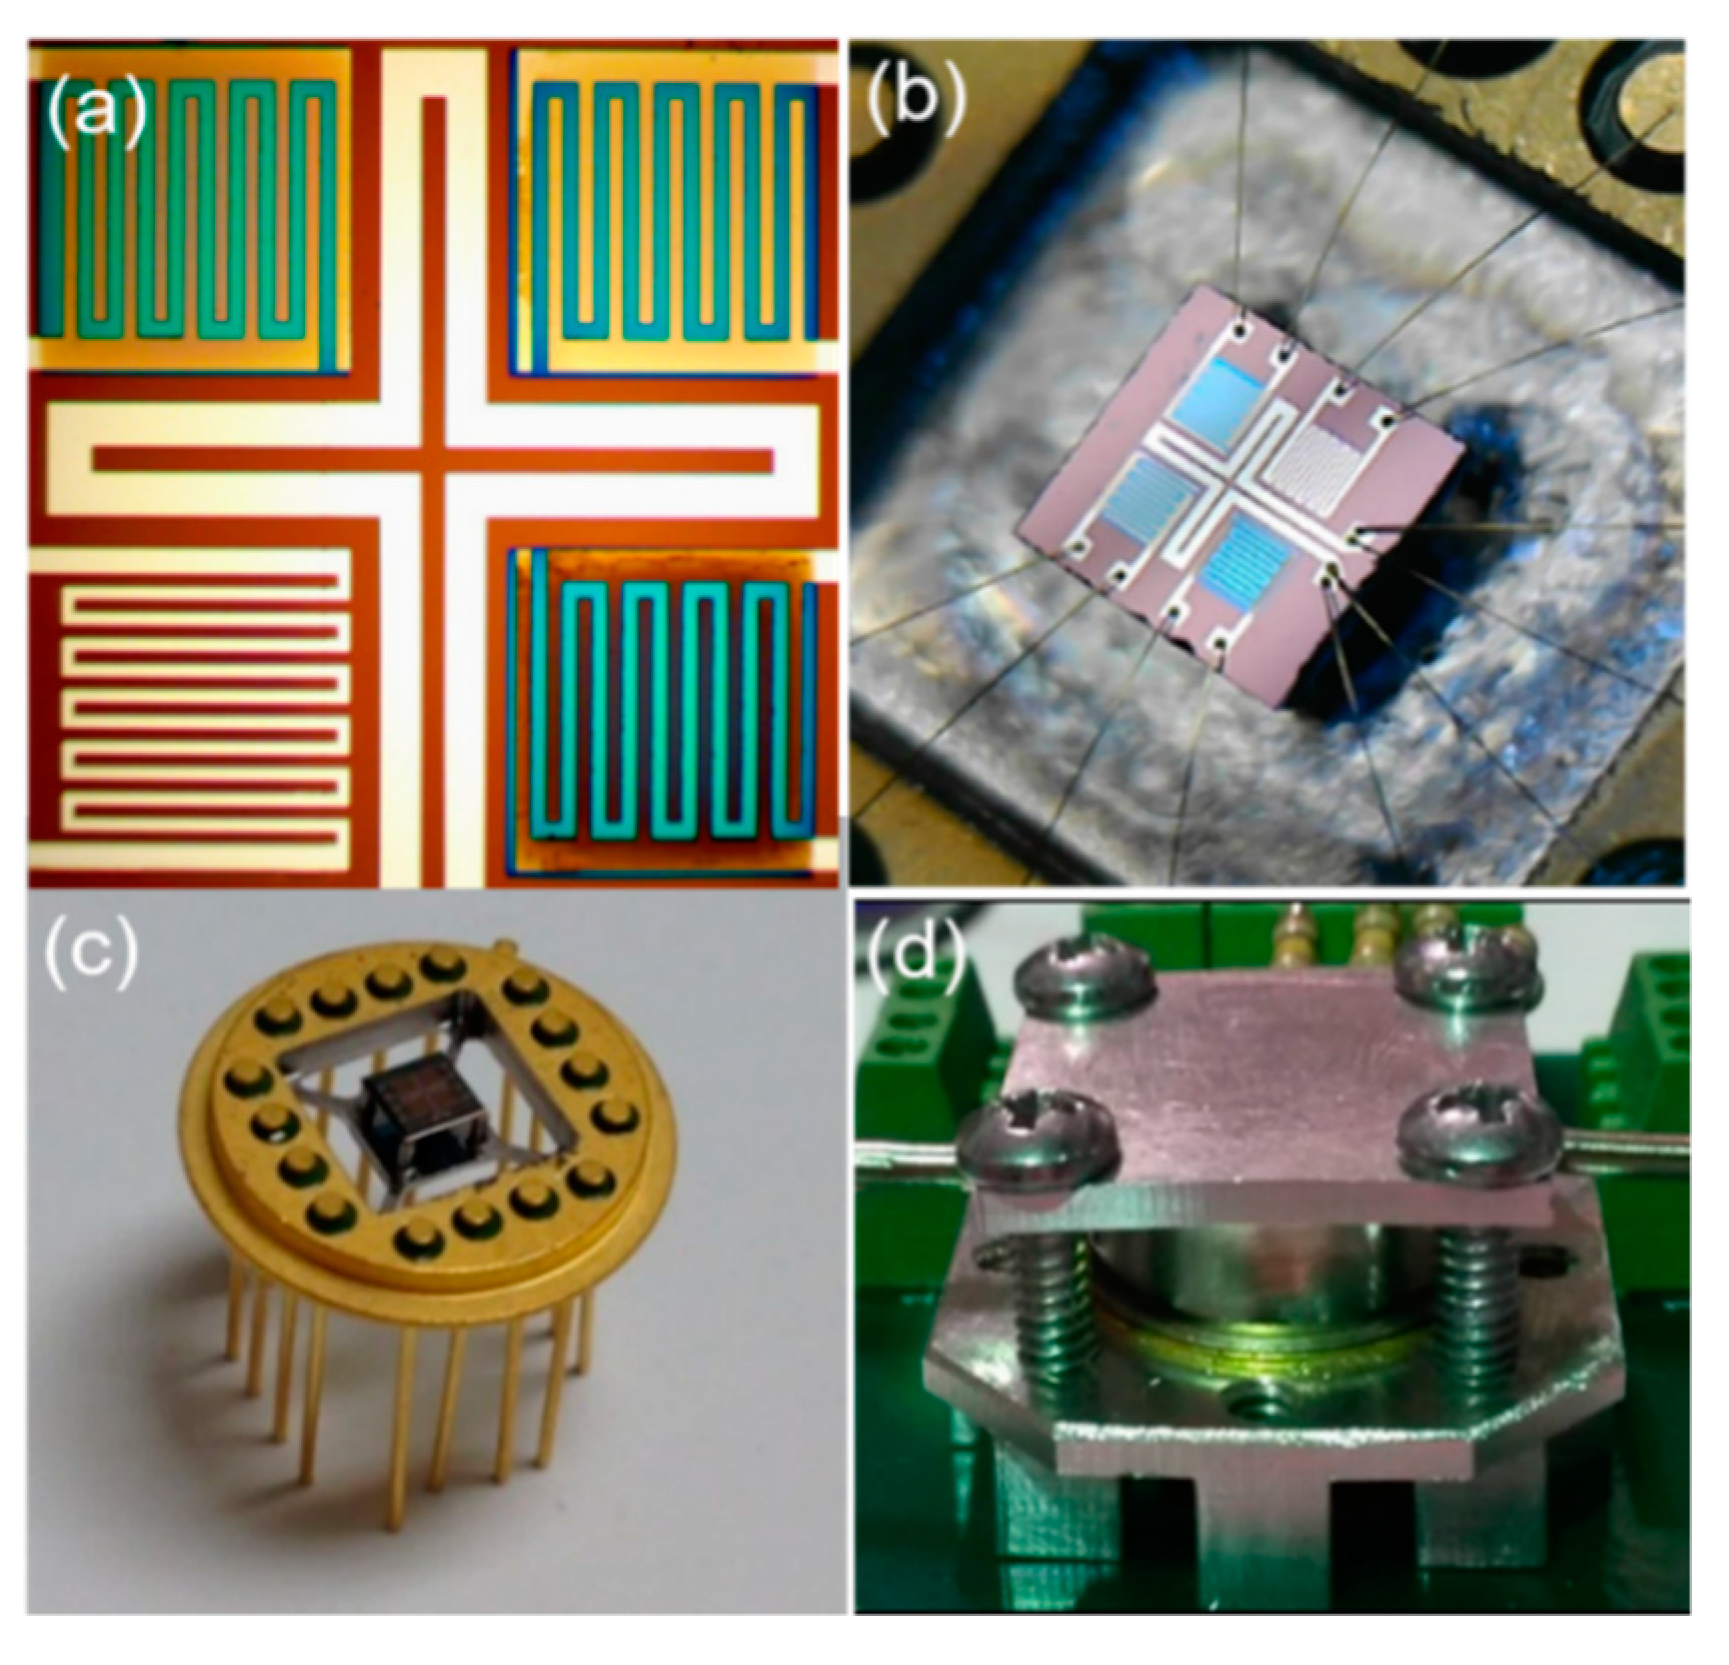
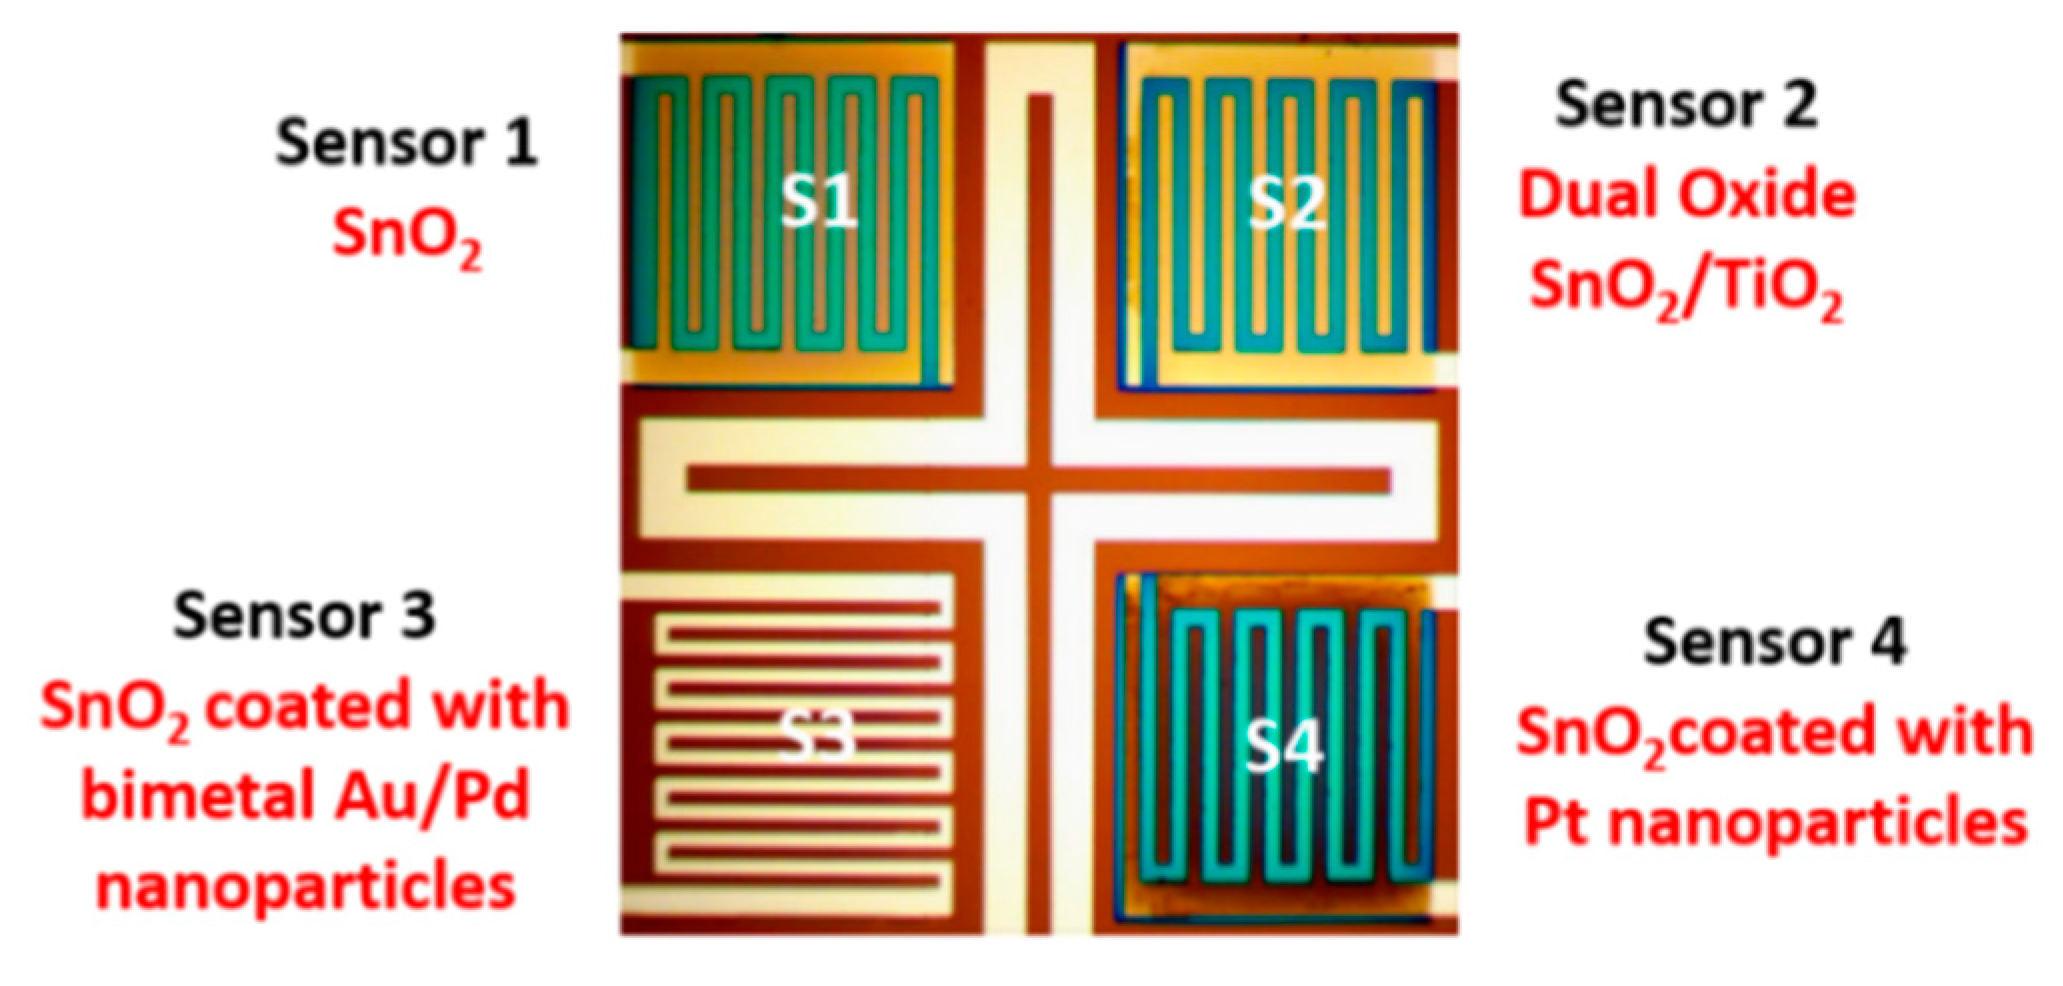
Figure 1. Optical images of the (a) multi-sensor platform, the (b,c) multi-sensor platform mechanically and electrically attached to a transistor outline (TO) electronic package, and the (d) gas chromatography (GC) multisensory detector in the flow-chamber.
Chemengineering 03 00013 g001
Figure 2. Materials used in the integrated detector.
Chemengineering 03 00013 g002
Figure 3. Table-top multisensory gas chromatography (MGC) experimental setup.
Chemengineering 03 00013 g003
Figure 4. Schematic diagram of the experimental setup.
Chemengineering 03 00013 g004
Figure 5. Gas chromatogram of Mix. 1: (a) Zoomed image of light compounds and (b) the full gas chromatogram. (1. H2S 100 ppb, 2. Ethyl-Mercaptan 50 ppb, 3. Benzene 10 ppb, 4. Toluene 10 ppb, 5. Water, 6. Ethylbenzene 10 ppb, 7. O-Xylene 10 ppb).
Chemengineering 03 00013 g005
Figure 6. Gas chromatogram of Mix. 2: (a) Zoomed image of light compounds and (b) the full gas chromatogram. (1. Methane 99.99%, 2. H2S 100 ppb, 3. Ethyl-Mercaptan 50 ppb, 4. Benzene 10 ppb, 5. Toluene 10 ppb, 6. Water, 7. Ethylbenzene 10 ppb, 8. O-Xylene 10 ppb).
Chemengineering 03 00013 g006
Figure 7. Gas chromatogram of Mix. 3: (a) Zoomed image of light compounds and (b) the full gas chromatogram. (1. CO 10 ppm, 2. H2S 100 ppb, 3. Ethyl-Mercaptan 50 ppb, 4. Acetone 50 ppb, 5. Ethanol 50 ppb, 6. Benzene 10 ppb, 7. Unknown, 8. Toluene 10 ppb, 9. Water, 10. Ethylbenzene 10 ppb, 11. O-Xylene 10 ppb).
Chemengineering 03 00013 g007
Figure 8. Gas chromatogram of Mix. 3 by using conventional non-selective metal oxide (MOX) detector: (a) Zoomed image of light compounds and (b) the full gas chromatogram. (1. CO 10 ppm, 2. H2S 100 ppb, 3. Ethyl-Mercaptan 50 ppb, 4. Acetone 50 ppb, 5. Ethanol 50 ppb, 6. Benzene 10 ppb, 7. Unknown, 8. Toluene 10 ppb, 9. Water, 10. Ethylbenzene 10 ppb, 11. O-Xylene 10 ppb).
Chemengineering 03 00013 g008
Figure 9. Calibration curves for (a) SnO2, (b) TiO2–SnO2, (c) Au/Pd@SnO2, and (d) Pt@SnO2, obtained by integrating the total area under the sensors’ response curves over specific time interval.
Chemengineering 03 00013 g009
Figure 10. (a) Gas chromatogram of 0.3 ppb of the BTEX mixture; (b) integrated detector’s response to 0.3 ppb of BTEX mixture and integrated GC background signal.
Chemengineering 03 00013 g010
Figure 11. Schematic diagrams of flat energy band approximations of (a) SnO2 and TiO2 and (b) the TiO2–SnO2 heterojunction in vacuum.
Chemengineering 03 00013 g011
Figure 12. (a) Electronic grain structure of a hybrid SnO2/TiO2 layer in ambient atmosphere and (b) upon exposure to H2S.
Chemengineering 03 00013 g012
Figure 13. A schematic diagram of the gas sensing mechanism of polycrystalline SnO2 functionalized with (a) gold nanoparticles with the primarily chemical (spill-over) type of sensitization, and (b) palladium nanoparticles with the primarily electric (Fermi level) sensitization type.
Chemengineering 03 00013 g013
Figure 14. A schematic diagram of the gas sensing mechanism of polycrystalline SnO2 functionalized with bimetal nanoparticles with a hybrid sensitization type, when spill-over and electric mechanisms complement and amplify each other.
Chemengineering 03 00013 g014
Figure 15. (a) Baseline resistances of the sensors S1–S4 in ultra-zero grade air, (b) the corresponding resistances of sensors S1–S4 in the presence of 0.5 ppm of benzene, and (c) the calculated responses of sensors S1–S4 to 0.5 ppm of benzene over the temperature range from 25 to 400 °C.
Chemengineering 03 00013 g015
Figure 16. Sensor responses to different concentrations of (a) benzene and (b) toluene in a range between 12.5 and 500 ppb. The horizontal dashed line shows the detection threshold.
Chemengineering 03 00013 g016
Figure 17. Illustration of the limit of detection (LOD) concept. The concentration corresponding to the lowest detector’s response (red curve) that can be distinguished from the detector’s noise (blue curve) is the LOD.
Chemengineering 03 00013 g017
Figure 18. (a) Responses of sensors S1–S4 to different relative humidity levels and (b) the responses of the sensors S1–S4 to 0.5 ppb of benzene under different humidity conditions.
Chemengineering 03 00013 g018
Table 1. Sensor structure and composition as deposited.
Sensor #Sensor’s Bulk MaterialSensor’s Surface Modification
S1SnO2 (30 ± 2 nm)-
S2SnO2 (30 ± 2 nm)TiO2 (20 ± 2 nm)
S3SnO2 (30 ± 2 nm)Au/Pd (1.1 ± 0.2 nm)
S4SnO2 (30 ± 2 nm)Pt (1.5 ± 0.2 nm)
Table 2. Gas mixtures and concentrations.
Mix. #Gases and ConcentrationsPossible applicationsRef.
1
  • H2S (100 ppb)
  • Mercaptans (50ppb),
  • Benzene (10 ppb)
  • Toluene (10 ppb)
  • Ethylbenzene (10 ppb)
  • O-Xylene (10 ppb)
Indoor air quality control[4,5,6,7,8,9]
2
  • Methane (99.99%),
  • H2S (100 ppb)
  • Mercaptans (50ppb),
  • Benzene (10 ppb)
  • Toluene (10 ppb)
  • Ethylbenzene (10 ppb)
  • O-Xylene (10 ppb)
Natural gas analysis[10,11,12]
3
  • CO (10 ppm)
  • H2S (100 ppb)
  • Ethyl-Mercaptan (50ppb)
  • Acetone (50 ppb)
  • Ethanol (50 ppb)
  • Benzene (10 ppb)
  • Toluene (10 ppb)
  • Ethylbenzene (10 ppb)
  • O-Xylene (10 ppb)
Human breath analysis[13,14,15,16,17,18]

