Article

Modeling of Copper Adsorption on Mesoporous Carbon CMK-3: Response Surface Design

by
Zeinab Ezzeddine
1,2,*,
Isabelle Batonneau-Gener
1 and
Yannick Pouilloux
1
1
Institut de Chimie des Milieux et Matériaux de Poitiers (IC2MP)—UMR 7285, Poitiers University, 86073 Poitiers, France
2
Platform for Research and Analysis in Environmental Sciences, Lebanese University, P.O. Box 6573/14 Beirut, Lebanon
*
Author to whom correspondence should be addressed.
ChemEngineering 2018, 2(4), 49; https://doi.org/10.3390/chemengineering2040049
Submission received: 15 August 2018 / Revised: 2 October 2018 / Accepted: 11 October 2018 / Published: 14 October 2018
(This article belongs to the Special Issue Carbon-Based Materials and Their Electrochemical Applications)

Abstract

:
CMK-3 mesoporous carbon was nanocast from SBA-15 silica. The obtained carbon was characterized by nitrogen sorption isotherms, X-ray diffraction and transmission electron microscopy (TEM). The batch adsorption tests were done at constant pH taking into account the initial metal ion concentration, adsorbent mass and temperature. A statistical study using a response surface design method was done to develop a mathematical model to predict copper adsorption on CMK-3 as a function of the mentioned experimental factors. It was found that all these parameters are significant, and copper concentration has the greatest effect on adsorption among them. Moreover, the obtained model proved to be adequate in predicting copper adsorption on CMK-3 and its performance under different experimental conditions.

1. Introduction

The direct discharge of industrial and domestic wastewater into the environment is responsible for the severe pollution of water sources today. Among various pollutants ejected, heavy metals are among the most dangerous inorganic contaminants since they persist in nature, leading to their accumulation in living organisms [1]. Copper is commonly found in discharged effluents. Copper pipes are used in plumbing, leading to elevated copper levels in water. This affects human health leading to vomiting, diarrhea, nausea and stomach cramps. Moreover, copper may damage the liver and lead to kidney diseases [2]. Different techniques are used to eliminate heavy metal ions from water, such as chemical precipitation, membrane filtration, adsorption and ion exchange. Adsorption is considered a promising method because it is simple, effective, and many adsorbents are available. Many studies have been done on different types of materials [3,4] such as ion-exchange resins, zeolites, activated carbon and modified mesoporous silica. Since the discovery of ordered mesoporous carbons (OMCs), they have been attracting interest in various application fields including adsorption [5]. OMCs are synthesized by carbon source polymerization in mesoporous silica templates. They are highly stable both mechanically and hydrothermally [6,7]. In addition, nanocast carbons exhibit large surface areas and pore volumes, as well as uniform pore sizes [8,9,10]. Several researchers proved the effectivity of OMC in removal of heavy metals from water [11,12]. Based on what was previously mentioned, this study intends to investigate the efficiency of CMK-3 in removing copper from water. Several factors affect the performance of any adsorbent, including CMK-3. Metal ion concentration, adsorbent mass and temperature greatly influence copper removal. In the present work, a statistical study using the response surface method was performed for developing a mathematical model to predict copper adsorption on CMK-3 as a function of metal ion concentration, adsorbent mass and temperature. This method is a multivariate technique based on a set of mathematical and statistical approaches in order to fit empirical models to the obtained experimental data.

2. Materials and Methods

2.1. Chemicals

Pluronic P123 (EO20PO70EO20) was used as templates and tetraethylorthosilicate (TEOS 98%) as the silica source for SBA-15. Hydrochloric acid (HCl, 37%), sulfuric acid (H2SO4, 95%), sodium hydroxide (NaOH), sucrose (C12H22O11) and copper nitrate (Cu(NO3)2·3H2O) were all obtained from Sigma Aldrich (St. Louis, MO, USA), and utilized without any further modification.

2.2. SBA-15 and Mesoporous Carbon CMK-3 Synthesis

Mesoporous carbon was made by applying SBA-15 silica as a cast based on the procedure described by Zhao et al. [13]. For SBA-15 synthesis, 4 g of P123 was dissolved in 30 g water and 120 g of 2 M HCl at 35 °C. After dissolution, 8.5 g of TEOS was added. The resulting mixture was stirred for 20 h at 35 °C, and then aged at 80 °C overnight. The solid obtained was filtered, washed and dried. Calcination was performed at 500 °C for 6 h (heating ramp 1 °C/min). For CMK-3 synthesis, 1 g of SBA-15 powder was added to 1.5 g of sucrose dissolved in 5 mL of water and 0.09 mL of 18 M H2SO4. The obtained mix was heated up for 6 h at 100 °C then the oven temperature was increased to 160 °C for another 6 h. Another 1 g of sucrose dissolved in 5 mL of water and 0.05 mL of 18 M H2SO4 were added to the previously obtained sample and it was thermally treated as described before. The silica–polymer composite was pyrolyzed for 6 h under nitrogen flow at 800 °C. Finally, the silica template was removed using 2M NaOH [14].

2.3. SBA-15 and CMK-3 Characterization

Micromeritics TRISTAR sorptiometer was used to determine the textural properties through nitrogen sorption at −196 °C. Before measurement, the materials were kept under vacuum at 350 °C for 5 h. Empyrean X-ray diffractometer (Malvern Panalytical Ltd., Royston, UK) with Cu Kα (λ = 1.54 Å) radiation was used to determine the (XRD) patterns from 0.65° to 5° 2θ. The SBA-15 and CMK-3 form was acquired by TEM (JEOL 2100 UHR at 200 kV, Tokyo, Japan).

2.4. Adsorption in Batch Mode

Copper nitrate salt was solvated in ultrapure water to obtain metal ion solutions. A mass (5, 10, 20 and 30 mg) in g of CMK-3 was added to a volume (V) in L of metal ion solutions of a desired concentration between 10 and 300 ppm (0.15 and 4.7 mmol·L−1). The flask was continuously stirred for 120 min at 25 °C, 35 °C and 45 °C at 300 rpm. Atomic Adsorption Spectrophotometer (AAS, Perkin Elmer AA200) determined the metal ion concentration at the end of each experiment. The removal efficiency was evaluated by Equation (1):
R = C 0 C t C 0 × 100 ,
where C0 and Ct are the heavy metal initial concentration and at time t concentration. The pH effect was examined by adjusting the solution pH between 2 and 7 using either HCl or NaOH in order to determine the optimal pH range for performing the adsorption experiments. The adsorption tests at all temperatures were done in closed reactors in order to eliminate the effect of CO2 on the solution pH. This was further proved by preparing blank copper solutions of different concentration (2, 8, 10 and 20 ppm), the concentration was measured for three successive days and no change was recorded, which eliminates the possibility of precipitation.

2.5. Response Surface Modeling

Response surface design is widely used as a robust method to optimize a response (y) that is influenced by independent variables xi [15]. Solution concentration (x1), temperature (x2) and mass of CMK-3 (x3) are the chosen independent variables, while the adsorption percentage (y) of metal ions on carbon is considered the response (Table 1).
The percentage of adsorption is related to the independent variables by using the following second-order polynomial model:
y = β 0 + i = 1 3 β i x i + i = 1 3 j = 1 3 β i j x i x j + i = 1 3 β i i x i 2 ,
where y is the predicted response, and xi and xj are the independent variables. β0, βi, βij and βii are the regression coefficients for intercept, linear effect, double interaction and quadratic effect, respectively.
The equation in terms of coded factors can be used to make predictions about the response for given levels of each factor. By default, the high levels of the factors are coded as +1 and the low levels of the factors are coded as −1. The coded equation is useful for identifying the relative impact of the factors by comparing the factor coefficients.
The final Equation (3) obtained using Design-Expert software (version 10.0.1) in terms of coded values is:
% Adsorption = +79.64 − 23.75A + 2.31B + 8.12C + 1.82AB + 0.35AC −
0.59BC − 6.01A2 + 0.59B2 − 6.20C2.
The actual factors in Equation (4) can predict the response for given levels of each factor. The levels here must be specified in the original units for each factor:
% Adsorption = +75.75 − 0.11C − 0.33T + 4.04M + 1.45 × 10⁻³CT +
3.76 × 10⁻⁴CM − 7.89 × 10⁻³TM − 3.84 × 10⁻⁴C2 + 5.86 × 10⁻³T2 − 0.11M2.

3. Results and Discussion

3.1. Physicochemical Characterizations

Figure 1a presents the XRD diffractogram of SBA-15 and CMK-3 mesoporous carbon. It shows three diffraction peaks that are assigned to (100), (110) and (200) planes which indicate the 2D hexagonal symmetry (P6mm) of its template SBA-15 [16]. The interlayer distances for SBA-15 are 4.5, 2.6 and 2.3 nm, while those of CMK-3 are 4.2, 2.5 and 2.2 nm, which proves the agreement in lattice constant between SBA-15 and its carbon replica. The nitrogen sorption isotherms of SBA-15 and mesoporous CMK-3 replica are given in Figure 1b. The isotherm of CMK-3 exhibited an IV type with H2 hysteresis loop which is similar to that of SBA-15. The isotherm exhibited a sharp step pressure increase at P/P0 > 0.35 due to the narrower mesopores of CMK-3. The textural properties obtained from N2 sorption are listed in Table 2. The TEM image of SBA-15 and CMK-3 (Figure 1c) reveals that CMK-3 has also a hexagonal structure since it is an exact negative replica of the SBA-15 silica.

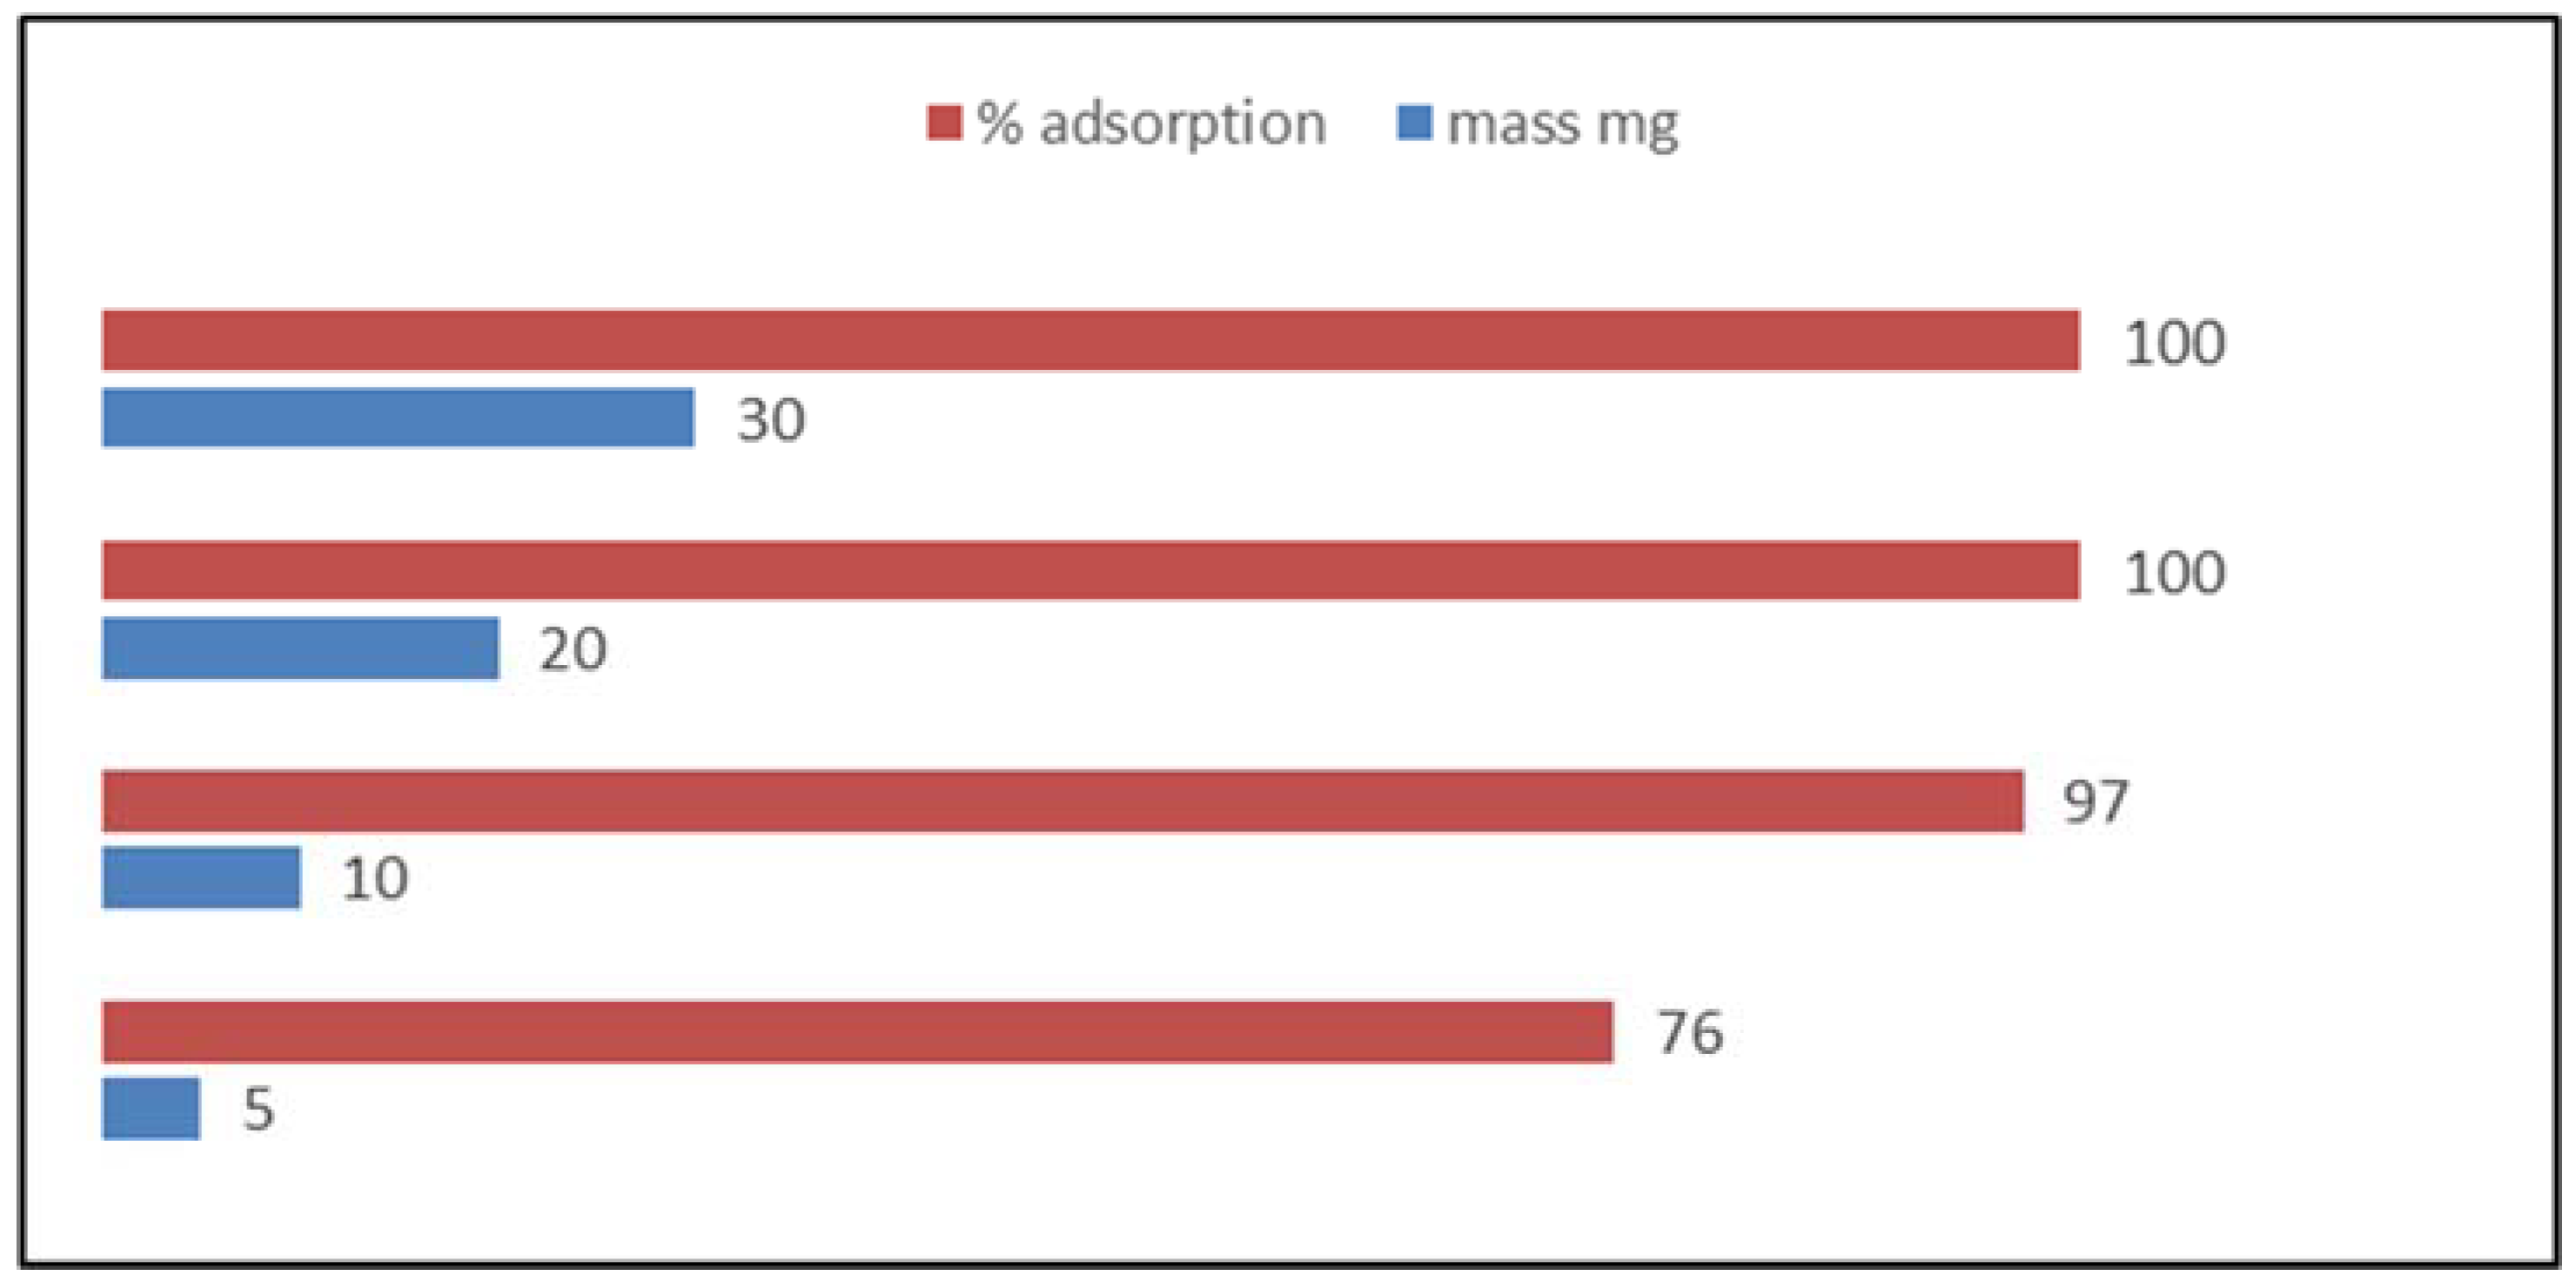
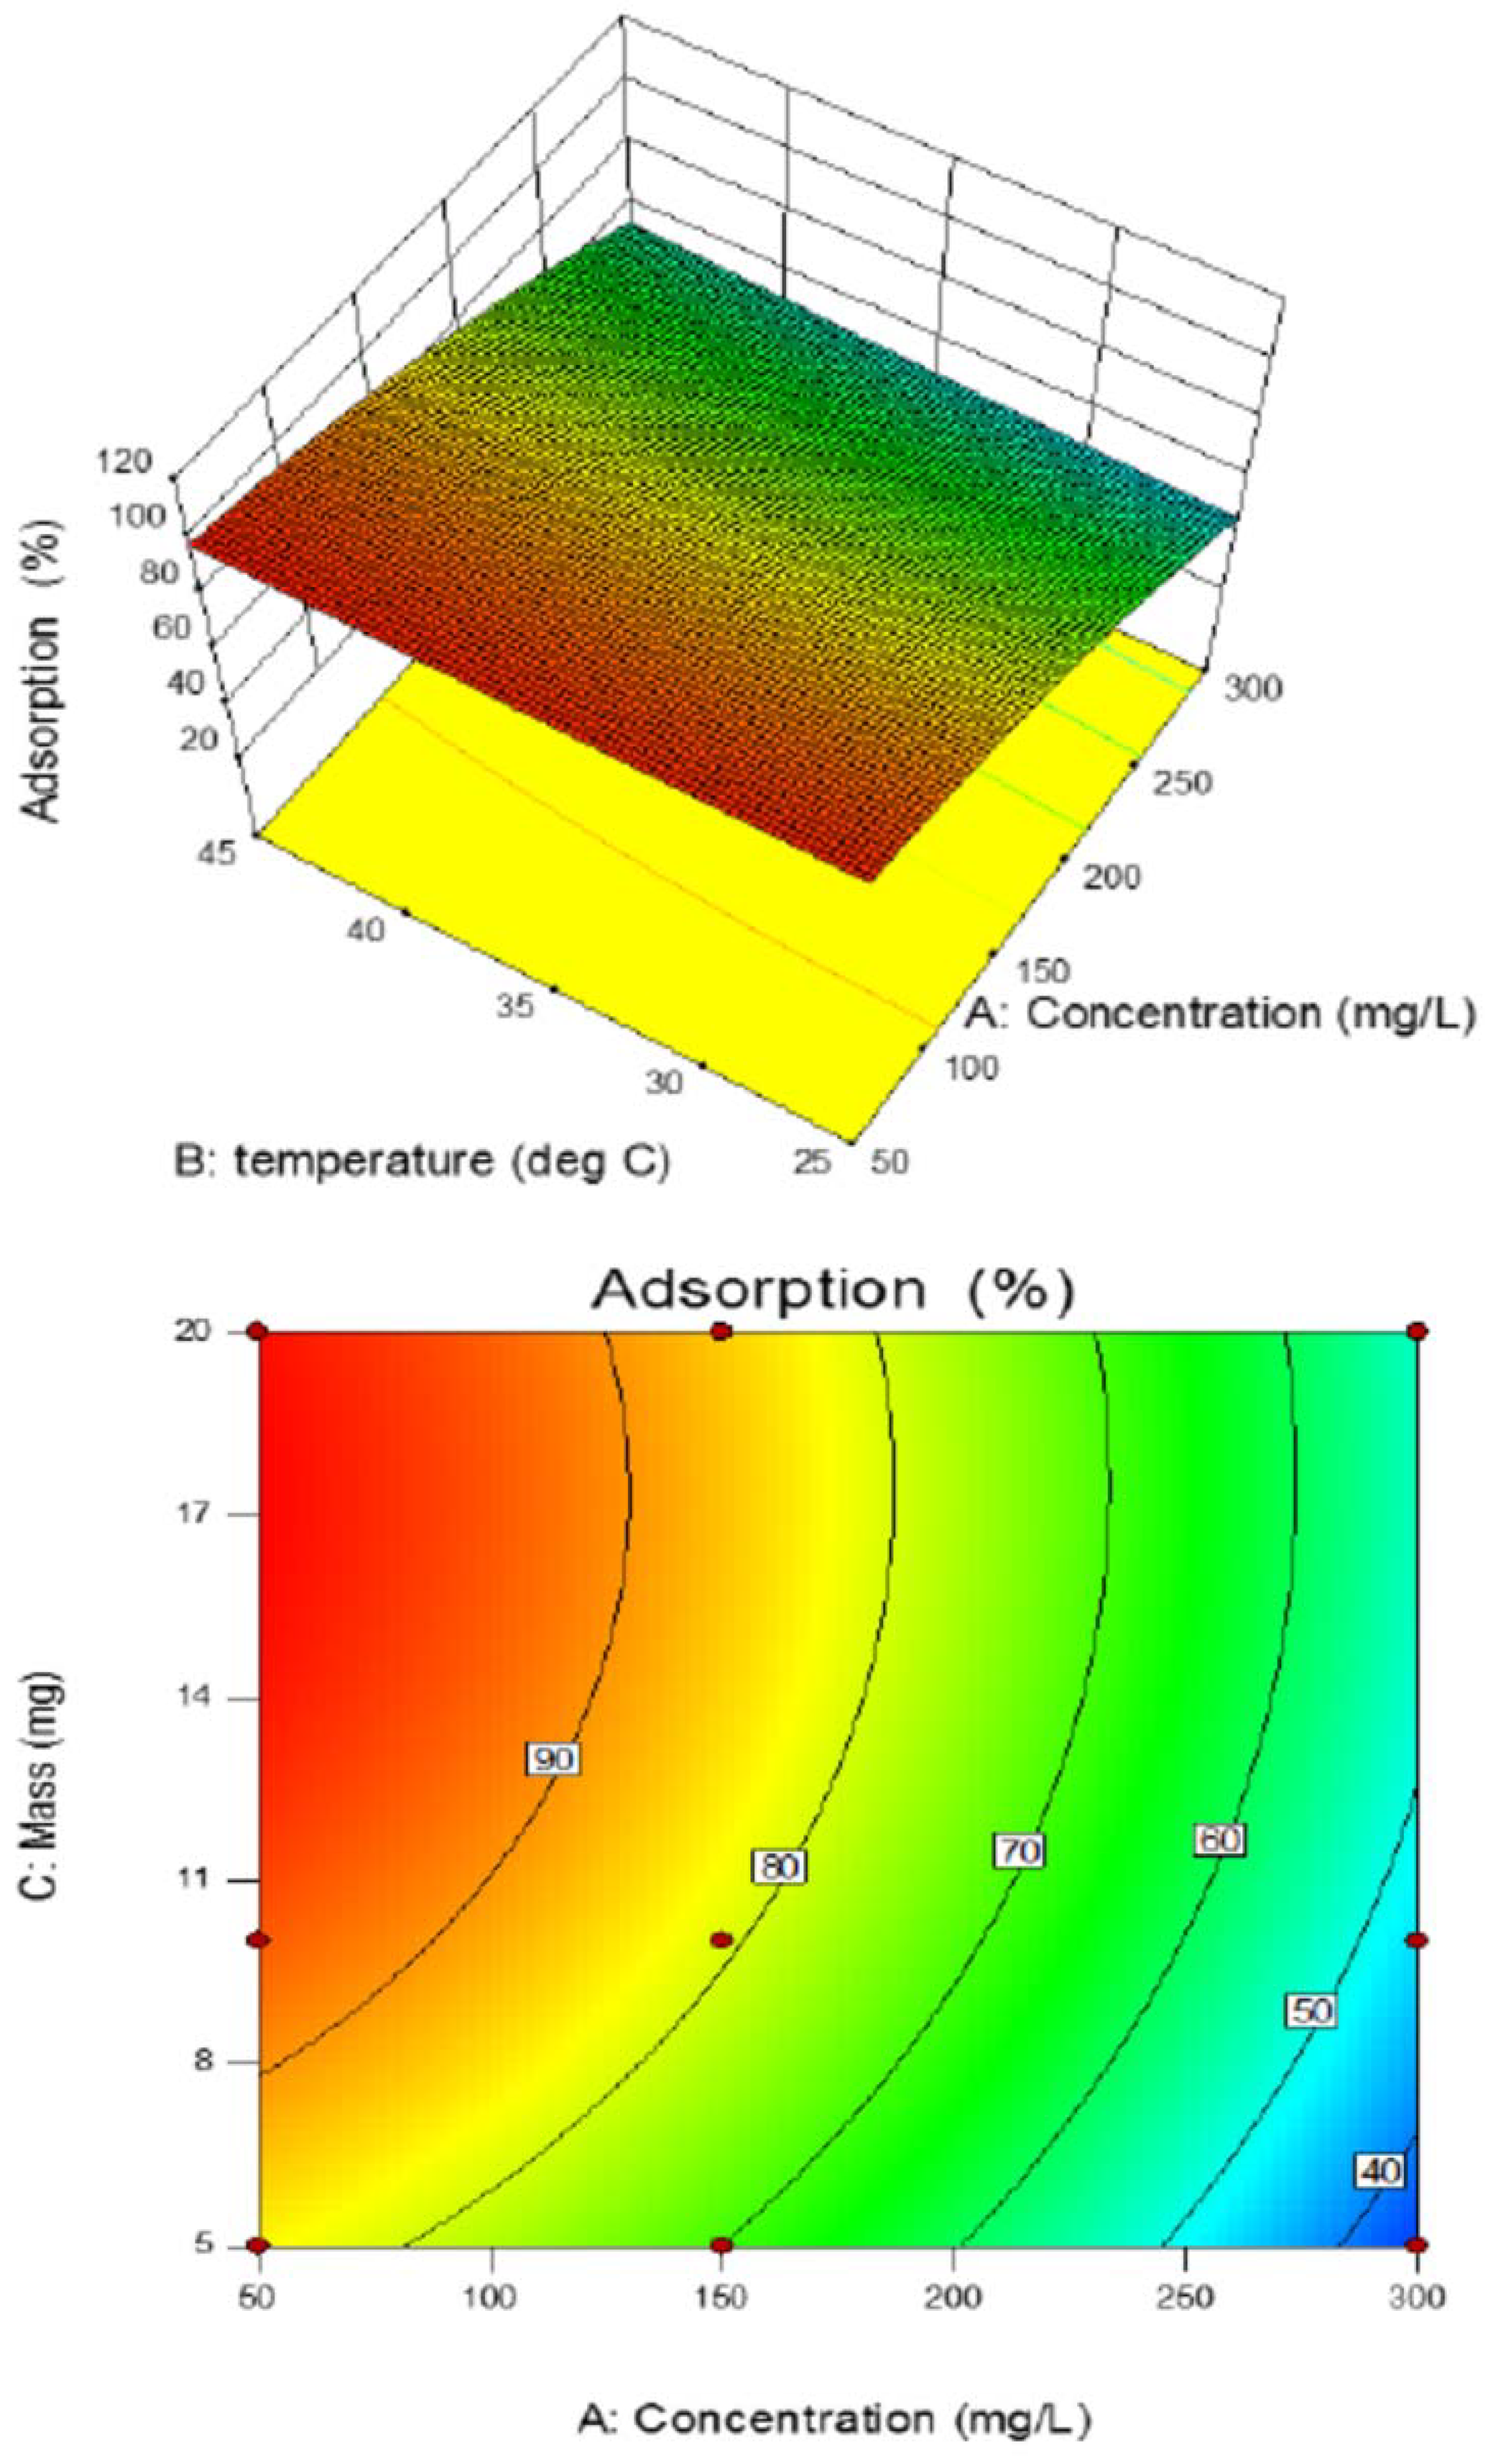
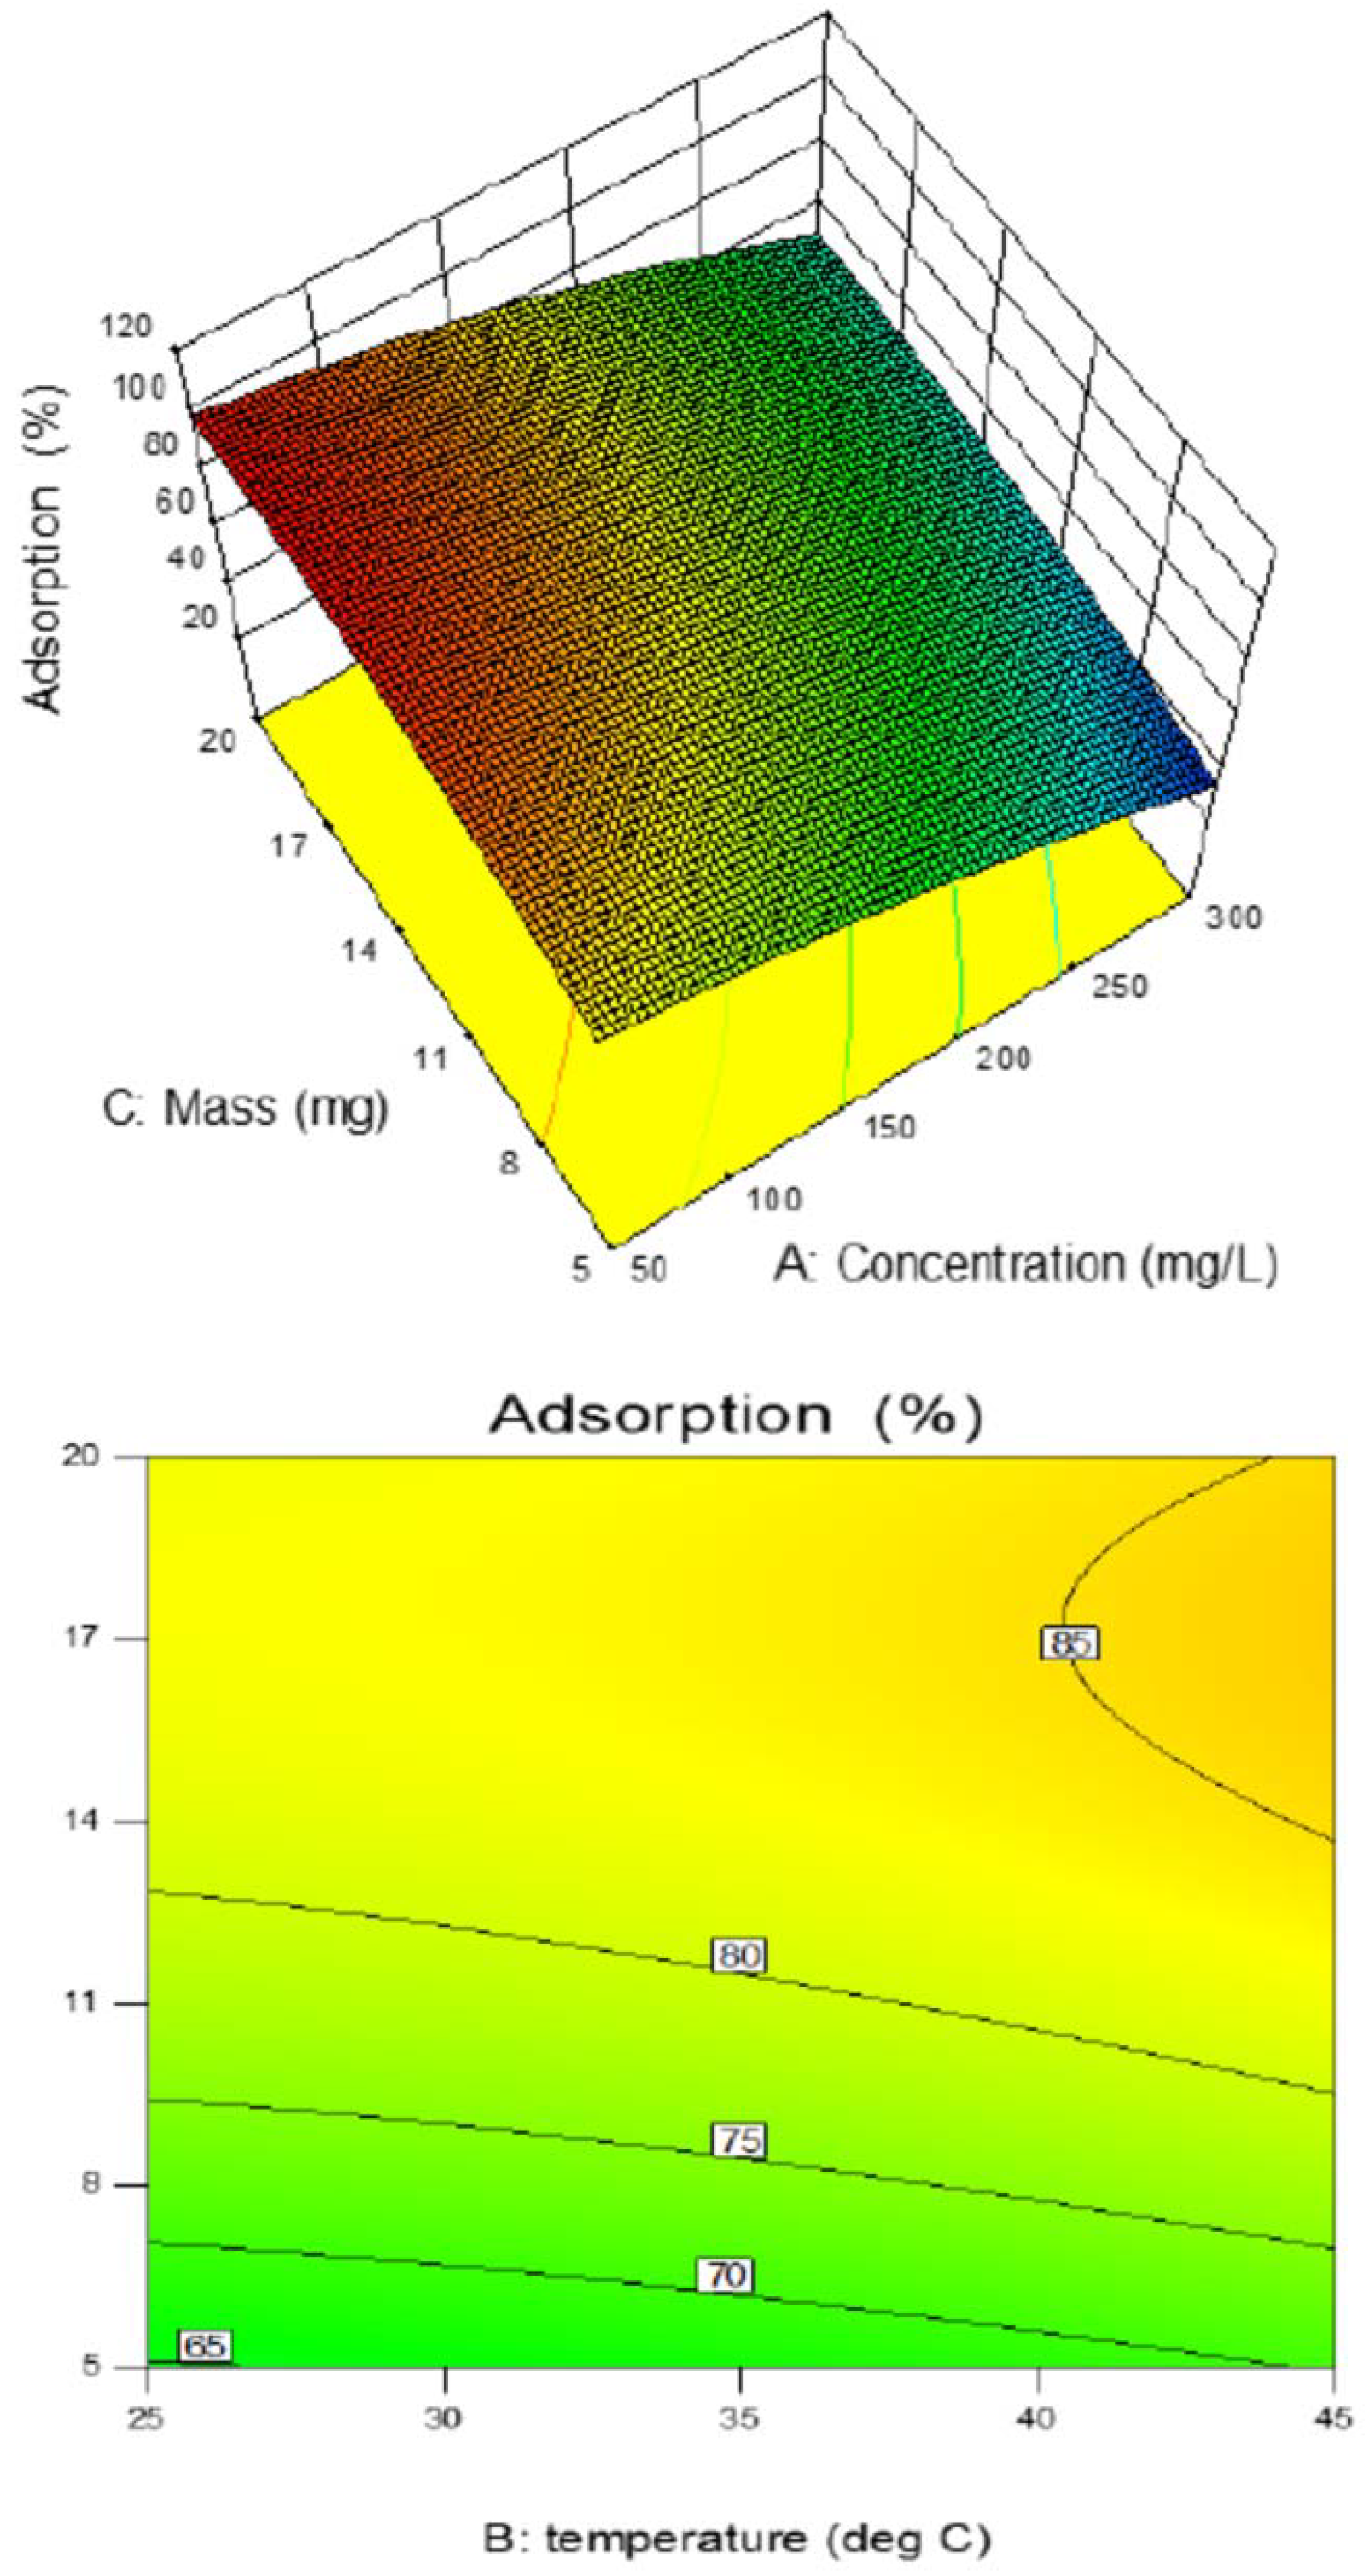
3.2. Effect of Sorbent Mass
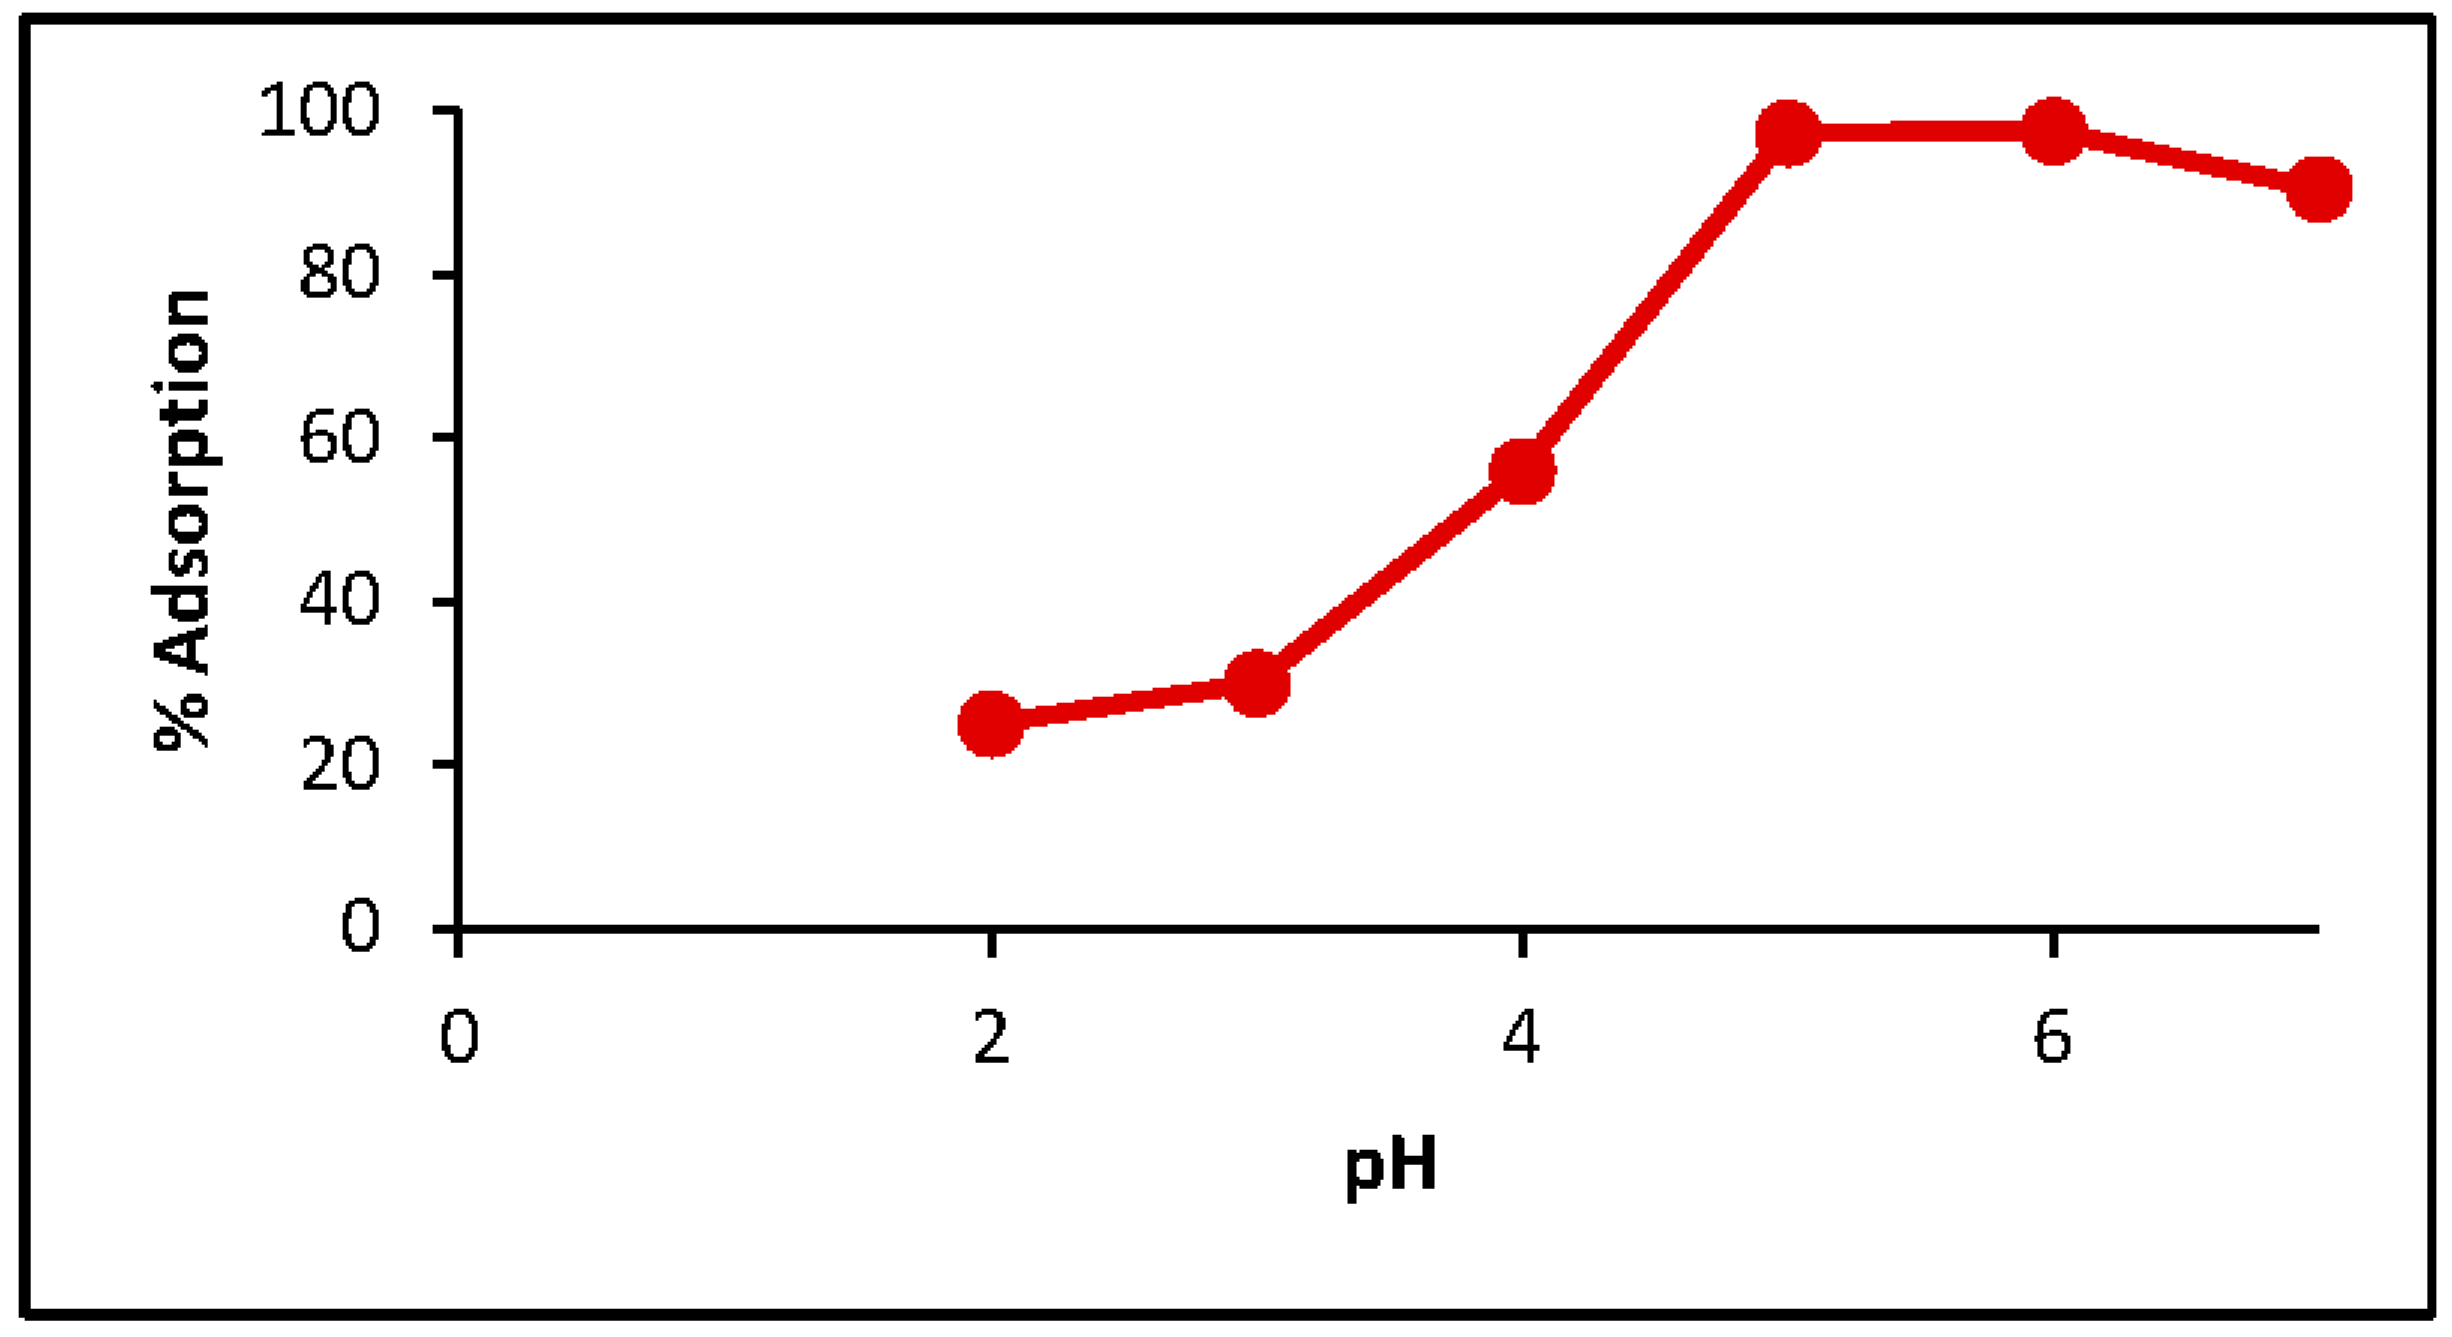
The adsorbent mass optimization was performed by increasing carbon masses from 5 mg to 30 mg in 20 mL of 30 ppm Cu2+ solution for 120 min (Figure 2). The adsorption percentage increased as the CMK-3 mass increased from 5 mg to 20 mg to reach its maximum at 20 mg, so the levels of the independent variable M were set between 5 and 20 mg.

3.3. pH Effect

The pH of the solution is critical for the adsorption process because it directly affects heavy metal ion speciation and CMK-3 surface charge. For this reason, the effect of pH was investigated by performing adsorption experiments at different values that ranged between 2 and 7. The obtained results are presented in Figure 3.
As the above figure reveals, adsorption at low pH decreased due to two reasons. The first one is the competition between copper ions and hydronium ions, H3O+. The second reason for this decrease is the positive surface charge of CMK-3 at low pH. The surface charge was determined by the pH shift method, which is described in detail in our previous work [7]. Herein, the CMK-3 zero-point charge was found to be 4.6, so above this pH its surface will be charged negatively, so it attracts the positively charged copper ions. The maximum adsorption was attained between pH 5 and 6, so the rest of the adsorption experiments were done at pH 6, since at this value the surface of CMK-3 will be negatively charged and the copper ion species present will be Cu2+ and CuOH+ [17], which both will be attracted by the adsorbent.

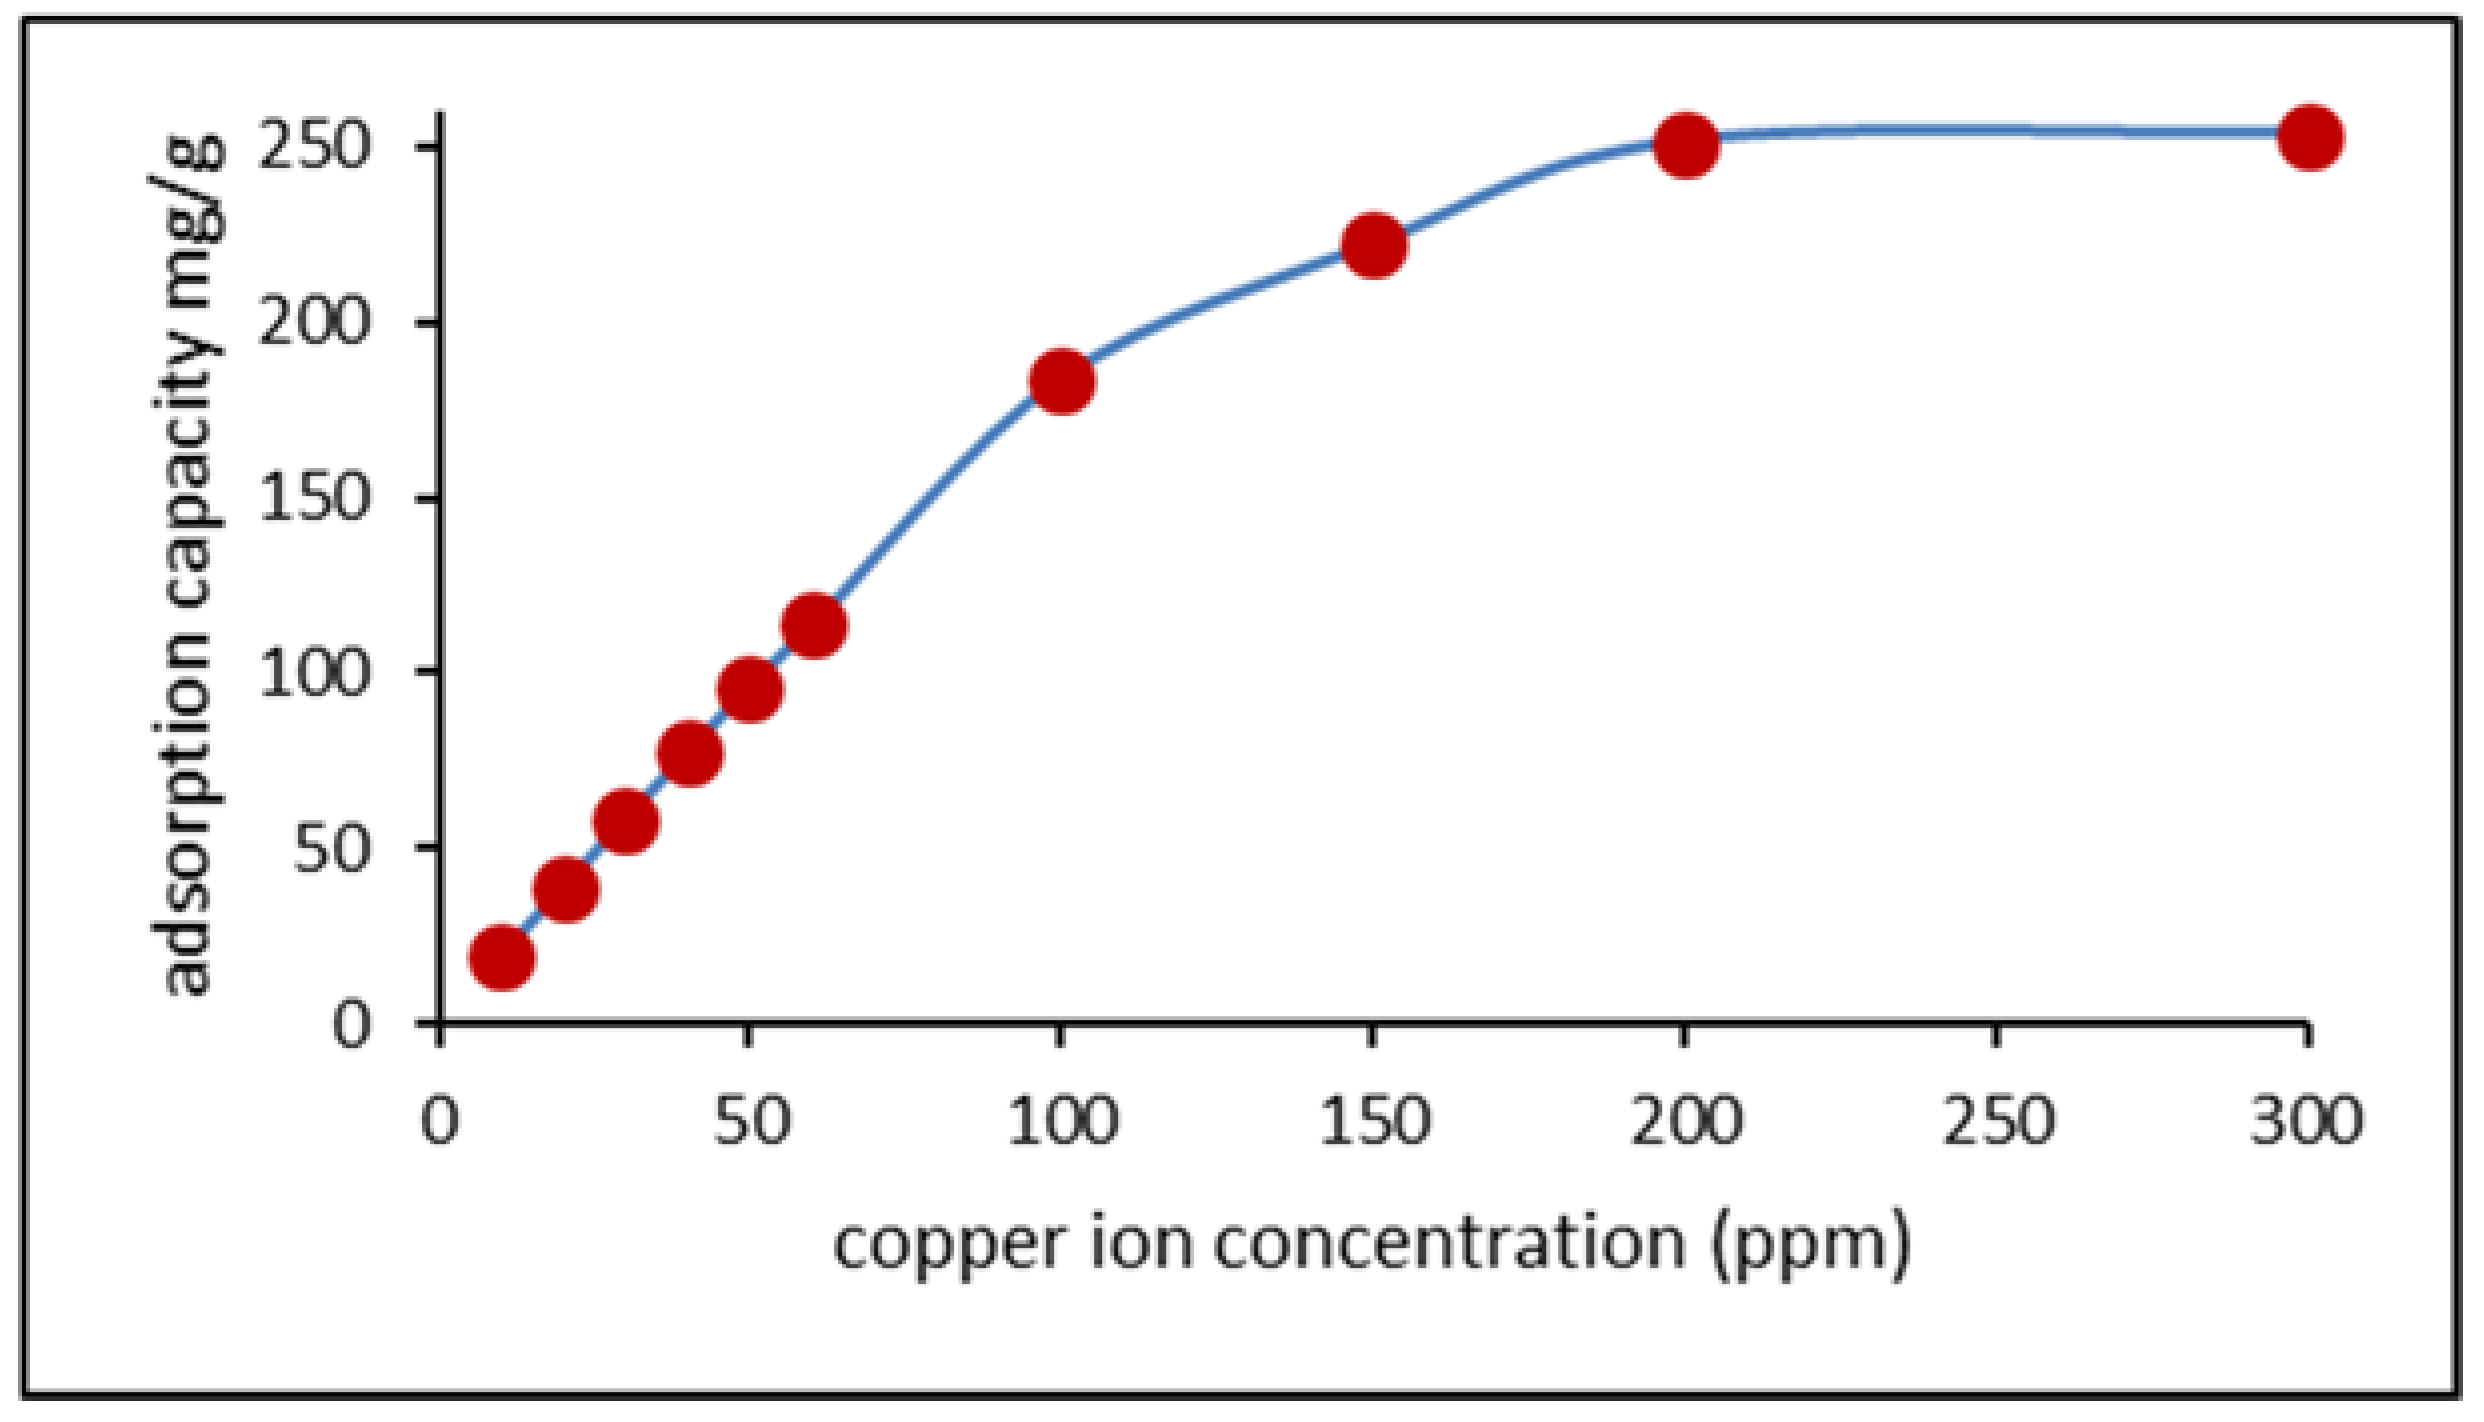
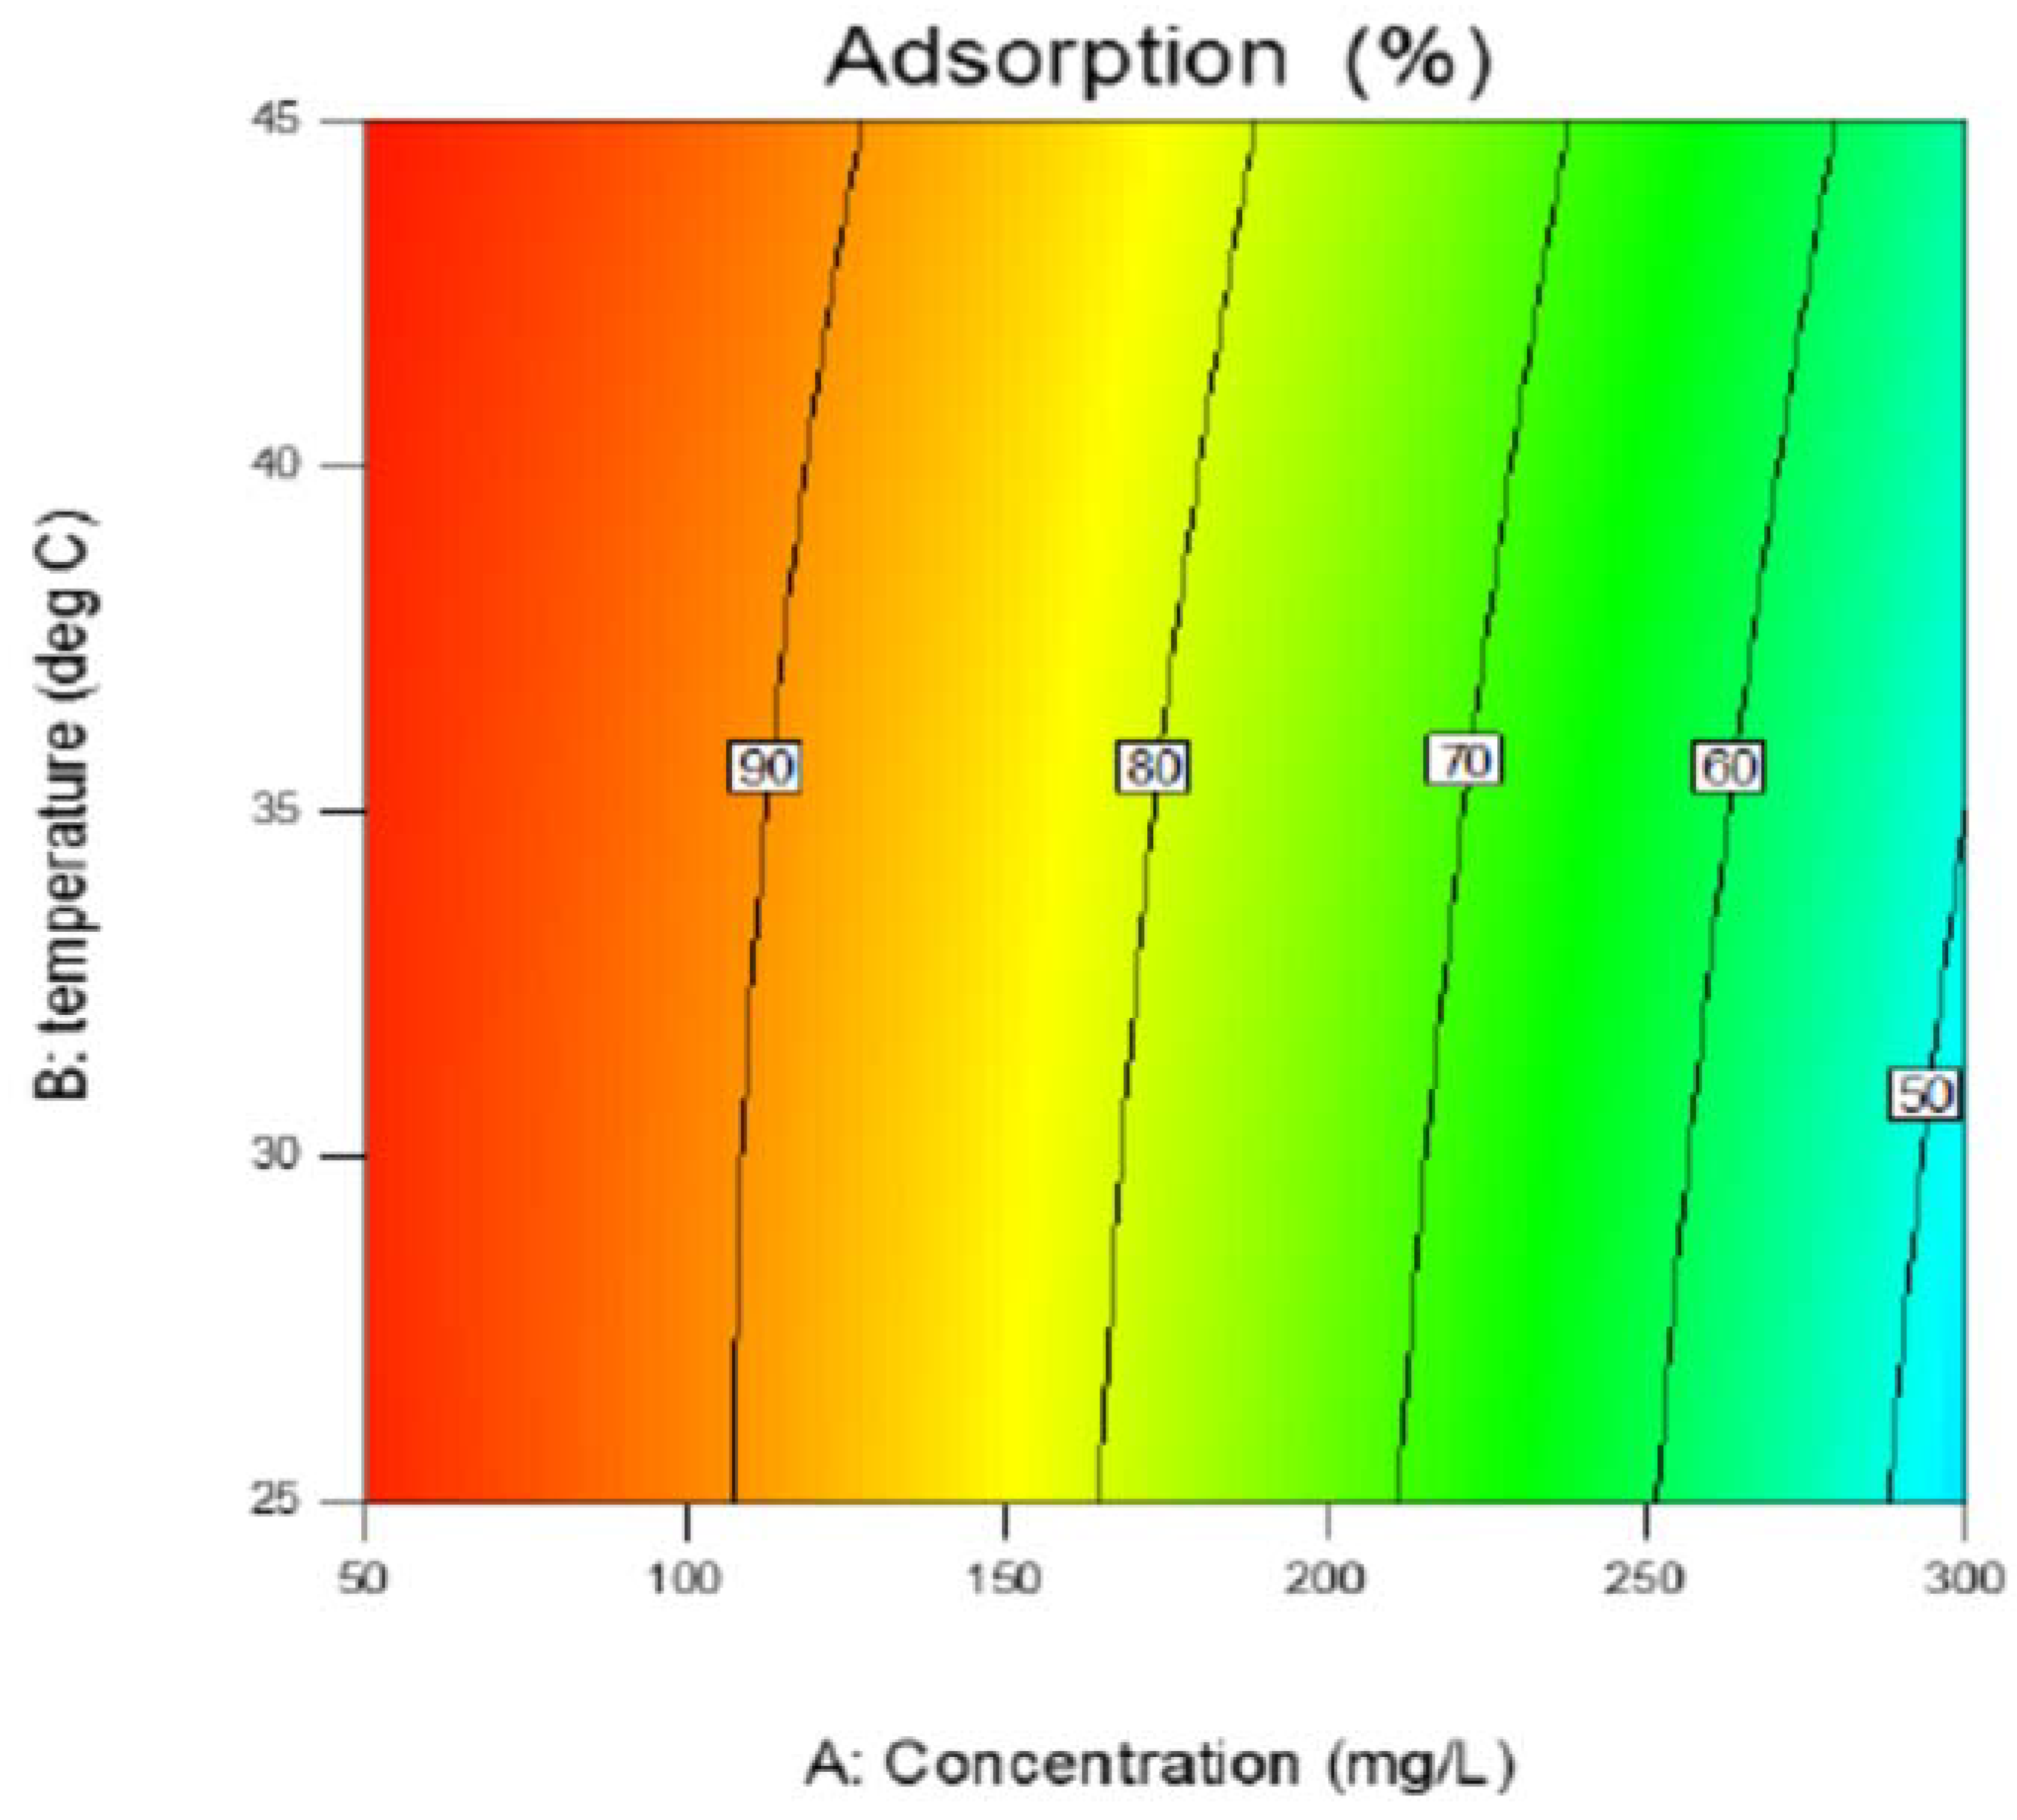
3.4. Effect of Copper Concentration

It is well known that metal ion concentration greatly affects the adsorption process on any type of adsorbent. In this study, copper ion concentration was varied between 10 ppm and 300 ppm to investigate the effect of metal ion concentration on copper uptake on CMK-3. The obtained results are shown in Figure 4. As ion concentration increased, the adsorption capacity increased as well to reach its maximum (250 mg/g). Three copper concentration levels (50, 150 and 300 ppm) were chosen for the independent variable C.

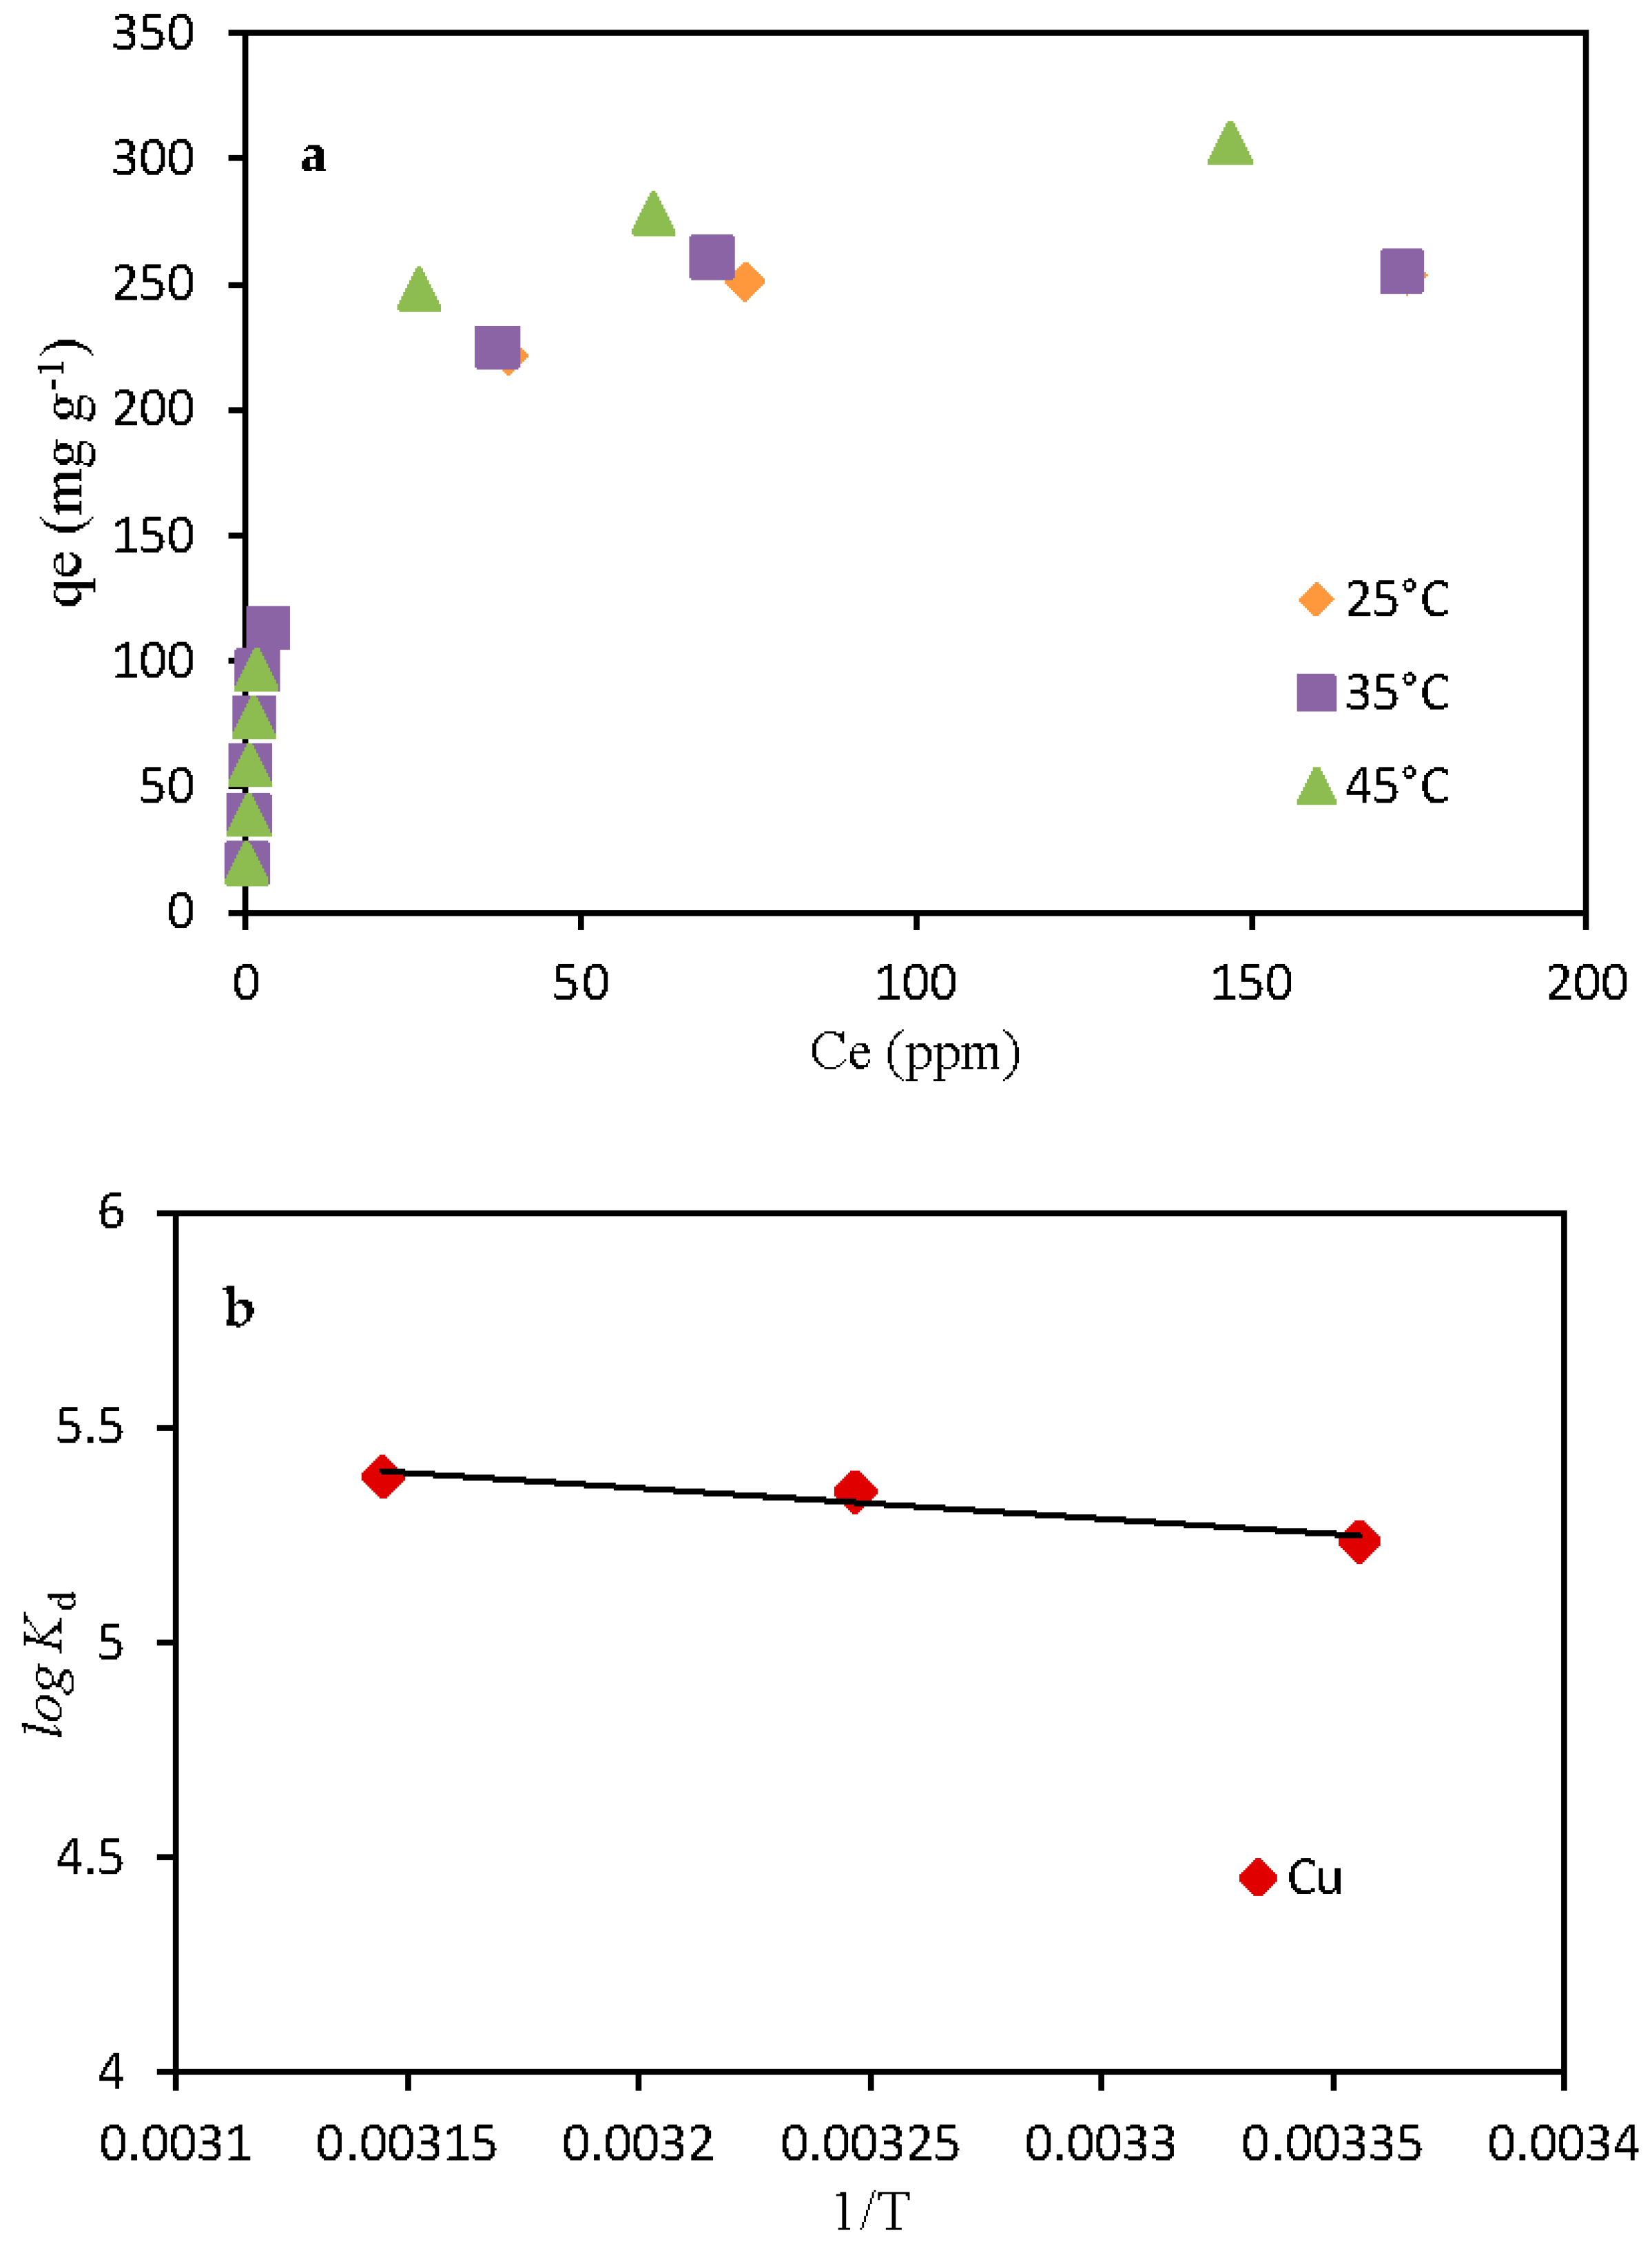
3.5. Temperature Effect

The effect of temperature on Cu2+ adsorption was investigated. The results are shown in Figure 5a, where Ce is the copper concentration at equilibrium in ppm and qe is the adsorption capacity of CMK-3 in mg/g. The parameters for the thermodynamic study (free energy change (ΔG°), enthalpy change (ΔH°) and entropy change (ΔS°)) were calculated. The obtained results showed a slight increase in copper adsorption as the temperature increased from 25 °C to 45 °C. The Gibbs free energy change of the process is related to the distribution coefficient (Kd) and was calculated as follows [18]:
Δ G ° = R T   ln K d ,
Δ G ° = Δ H ° T Δ S ° ,
log K d = Δ S ° 2.303 R Δ H ° 2.303 R T .
Δ G ° (kJ·mol−1) is at temperature T (in Kelvin), R is the universal gas constant (8.314 J·mol−1·K−1). The values of ΔH° and ΔS° (Table 3) are calculated from the slope and intercept of van’t Hoff plot of log Kd versus 1/T, respectively (Figure 5b).
The ΔH° positive value reveals that the adsorption process is endothermic. The adsorbent is highly porous, so the diffusion of ions inside the pores becomes more favorable as temperature increases. The negative values of ΔG° indicate the spontaneous adsorption process; the values increased with temperature, so Cu2+ adsorption on CMK-3 increased with temperature. The positive ΔS° value confirms that the adsorption is favorable. Cu2+ ions are hydrated, so when they are adsorbed, water molecules will be released and dispersed in the solution, which leads to entropy increase along with system randomness.

3.6. Composite Surface Design Methods

The experimental data are presented in Table 4. The adsorption efficiency ranged from 31% to 100%, which indicates a significant effect of the experimental conditions on CMK-3 performance.

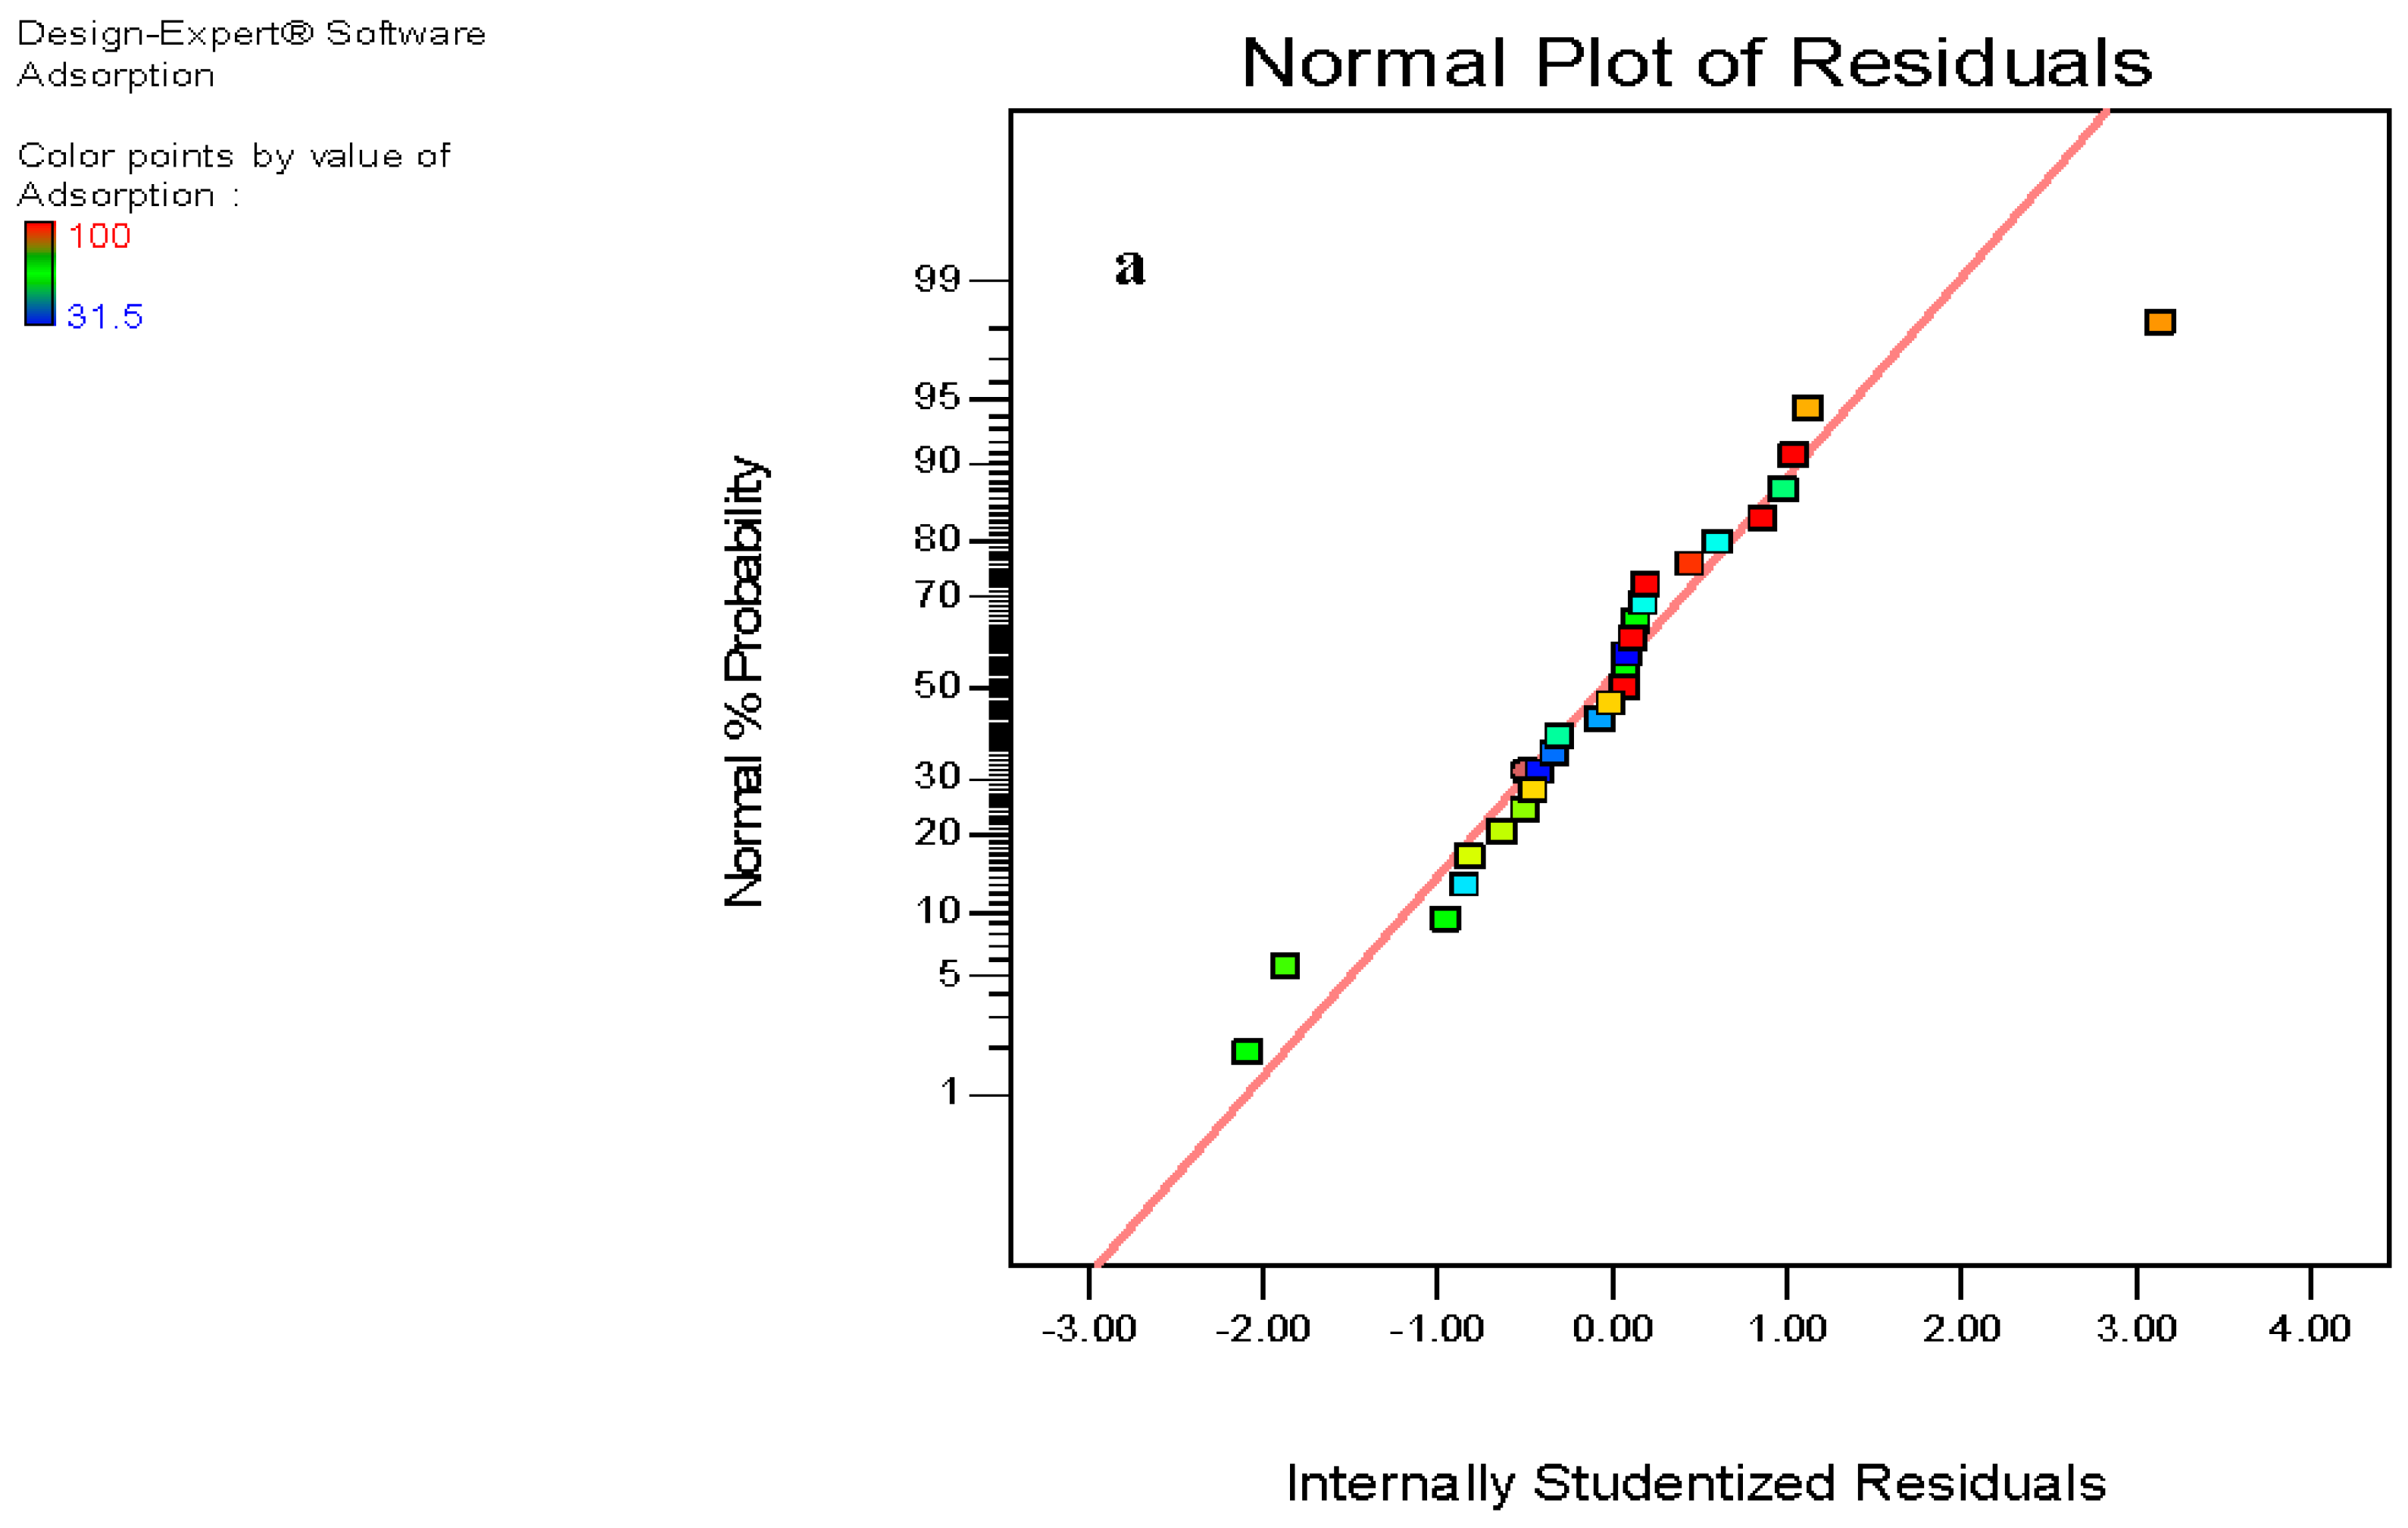
3.7. Analysis of Variance (ANOVA)

ANOVA or variance analysis is a statistical test to figure out if the experimental results are significant or not, and if there is a difference between the studied groups. More specifically, the ANOVA test helps one to know if the null hypothesis should be rejected or accepted. In addition, the p-value is used to determine the significance of the results. It is a number between 0 and 1. If the p-value ≤ 0.05, the null hypothesis (that the studied variable has no effect on adsorption process) is rejected. On the other hand, the F-test involves the ratio of two variances that are a measure of dispersion, and larger values represent greater dispersion. The obtained ANOVA results are given in Table 5. The model F-value is 31.53, which implies its significance. A, C and A2 are significant model terms, since their p-values are smaller than 0.05. Values greater than 0.1 indicate the model terms are not significant. It was found that the solution concentration has the greatest effect on adsorption with the highest F-value of 231.66, which confirms further the previously obtained experimental data. Copper ion concentration and adsorbent mass affected the adsorption process greatly, while temperature had a lesser effect. This could be attributed to the high efficiency of CMK-3 for Cu2+ adsorption, so increasing the temperature did not extensively affect the adsorption capacity.
The Studentized residual in statistics is used for the quotient that results from the division of a residual by an estimate of its standard deviation. The statistical plots were applied to understand whether the model gives a good approximation of the real system or not [19]. The normal probability plots of the Studentized residuals are shown in Figure 6a. The obtained data points follow a straight line, which indicates that the residuals follow a normal distribution. Figure 6b proves that the predicted values for copper adsorption estimated by the model and the actual experimental data are in agreement, proving the reliability of the regression model.

3.8. Effect of the Studied Parameters on Copper Adsorption

The 2D and 3D surface response plots were used to analyze the relationships between the studied factors and copper removal efficiency by CMK-3 by keeping one factor constant at level 0 and varying the other two (Figure 7). The plots confirm that as mass and temperature increase, copper adsorption increases. On the other hand, as concentration increases, copper adsorption percentage decreases and the adsorption capacity increases, as explained earlier. The decreased efficiency at higher concentration is due to the saturation of the available sites on the CMK-3 surface. Finally, as temperature increases along with mass, copper adsorption increases as well, so copper adsorption on CMK-3 becomes increased with temperature.
It is worth mentioning that the maximum adsorption capacities reported in the literature using microporous activated carbon are lower than those obtained in this study (Table 6). This makes CMK-3 a very promising adsorbent for heavy metal removal from wastewater.

4. Conclusions

SBA-15 was used as a mold to synthesize CMK-3 mesoporous carbon. Then, its performance for Cu2+ adsorption was studied under several experimental conditions including metal ion concentration, adsorbent mass and temperature. The analysis of the response surface design model confirmed that the studied factors have a significant effect on copper adsorption capacity on CMK-3, with the concentration being the most important one. The obtained model was significant and can be used to predict copper adsorption efficiency on CMK-3.

Author Contributions

Z.E. conceived the work and performed the experiments; Z.E., I.B.-G. and Y.P. analyzed the data; Z.E. wrote the manuscript, Y.P. managed the study and the unit research in Poitiers.

Funding

This research was funded by Poitiers university grant number, 1.

Acknowledgments

The authors are thankful to the (IC2MP) ‘Institut de Chimie des Milieux et Matériaux de Poitiers—UMR 7285’, Poitiers University, PRES for the financial support of this work.

Conflicts of Interest

The authors declare no conflict of interest.

References

  1. Ezzeddine, Z.; Batonneau-Gener, I.; Pouilloux, Y.; Hamad, H.; Saad, Z. Synthetic Nax Zeolite as a Very Efficient Heavy Metals Sorbent in Batch and Dynamic Conditions. Colloids Interfaces 2018, 2, 22. [Google Scholar] [CrossRef]
  2. Cheng, H.P.; Su, L.C.; Chen, C.Y. Thermodynamics and kinetics of adsorption of Cu (II) onto waste iron oxide. J. Hazard. Mater. 2007, 144, 406–411. [Google Scholar] [CrossRef]
  3. Hamad, H.; Ezzeddine, Z.; Kanaan, S.; Lakis, F.; Hijazi, A.; Moussawi, M.A. A Novel Modification and Selective Route for the Adsorption of Pb2+ by oak charcoal functionalized with Glutaraldehyde. Adv. Powder Technol. 2016, 27, 631–637. [Google Scholar] [CrossRef]
  4. Bailey, S.E.; Olin, T.J.; Bricka, R.M.; Adrian, D.D. A review of potentially low-cost sorbents for heavy metals. Water Res. 1999, 33, 2469–2479. [Google Scholar] [CrossRef]
  5. Hamad, H.; Ezzeddine, Z.; Lakis, F.; Rammal, H.; Srour, M.; Hijazi, A. An Insight into the Removal of Cu (II) and Pb (II) by Aminopropyl Modified Mesoporous Carbon CMK-3: Adsorption capacity and mechanism. Mater. Chem. Phys. 2016, 178, 57–64. [Google Scholar] [CrossRef]
  6. Liang, C.D.; Li, Z.J.; Dai, S. Mesoporous Carbon Materials: Synthesis and Modification. Angew. Chem. Int. Ed. 2008, 47, 3696–3717. [Google Scholar] [CrossRef] [PubMed]
  7. Ezzeddine, Z.; Batonneau-Gener, I.; Pouilloux, Y.; Hamad, H. Removal of Methylene Blue by Mesoporous CMK-3: Kinetics, Isotherms and Thermodynamics. J. Mol. Liq. 2016, 223, 763–770. [Google Scholar] [CrossRef]
  8. Qiang, Z.; Gurkan, B.; Ma, J.; Liu, X.; Guo, Y.; Cakmak, M.; Cavicchi, K.A.; Vogt, B.D. Roll-to-roll fabrication of high surface area mesoporous carbon with process-tunable pore texture for optimization of adsorption capacity of bulky organic dyes. Micropor. Mesopor. Mater. 2016, 227, 57–64. [Google Scholar] [CrossRef] [Green Version]
  9. Qiang, Z.; Guo, Y.; Liu, H.; Cheng, S.Z.D.; Cakmak, M.; Cavicchi, K.A.; Vogt, B.D. Large-Scale Roll-to-Roll Fabrication of Ordered Mesoporous Materials using Resol-Assisted Cooperative Assembly. ACS Appl. Mater. Interfaces. 2015, 7, 4306–4310. [Google Scholar] [CrossRef] [PubMed]
  10. Zhang, Y.; Qiang, Z.; Vogt, B.D. Relationship between crosslinking and ordering kinetics for the fabrication of soft templated (FDU-16) mesoporous carbon thin films. RSC Adv. 2014, 4, 44858–44867. [Google Scholar] [CrossRef]
  11. Moreno-Tovara, R.; Terrésb, E.; Rene Rangel-Mendez, J. Oxidation and EDX elemental mapping characterization of an ordered mesoporous carbon: Pb(II) and Cd(II) removal. Appl. Surf. Sci. 2014, 303, 373–380. [Google Scholar] [CrossRef]
  12. Moradi, S.E.; Baniamerian, M.J. Applications of chemically modified ordered mesoporous carbon as solid phase extraction sorbent for preconcentration of trace lead ion in water samples. Chem. Ind. Chem. Eng. Q. 2011, 17, 397–408. [Google Scholar] [CrossRef] [Green Version]
  13. Zhao, D.; Huo, Q.; Feng, J.; Chmelka, B.; Stucky, G. Nonionic Triblock and Star Diblock Copolymer and Oligomeric Surfactant Syntheses of Highly Ordered, Hydrothermally Stable, Mesoporous Silica Structures. J. Am. Chem. Soc. 1998, 120, 6024–6036. [Google Scholar] [CrossRef]
  14. Vinu, A.; Srinivasu, P.; TakahashI, M.; Mori, T.; Balasubramanian, V.V.; Ariga, K. Controlling the textural parameters of mesoporous carbon materials. Micropor. Mesopor. Mater. 2007, 100, 20–26. [Google Scholar] [CrossRef]
  15. Zhao, D.; Feng, J.; Huo, Q.; Melosh, N.; Fredrickson, G.H.; Chmelka, B.F.; Stucky, G.D. Triblock Copolymer Syntheses of Mesoporous Silica with Periodic 50 to 300 Angstrom Pores. Science 1998, 279, 548–552. [Google Scholar] [CrossRef] [PubMed]
  16. Thuan, T.V.; Phuong Quynh, B.T.; Nguyen, T.D.; Thanh Ho, V.T.; Bach, L.G. Response surface methodology approach for optimization of Cu2+, Ni2+ and Pb2+ adsorption using KOH-activated carbon from banana peel. Surfaces Interfaces 2017, 6, 209–217. [Google Scholar] [CrossRef]
  17. Cuppett, J.D.; Duncan, S.E.; Dietrich, A.M. Evaluation of Copper Speciation and Water Quality Factors That Affect Aqueous Copper Tasting Response. Chem. Senses 2006, 31, 689–697. [Google Scholar] [CrossRef] [PubMed] [Green Version]
  18. Jing, X.; Liua, F.Q.; Yanga, X.; Linga, P.; Li, L.J.; Long, C.; Li, A.M. Adsorption performances and mechanisms of the newly synthesized N,N-di(carboxymethyl) dithiocarbamate chelating resin toward divalent heavy metal ions from aqueous media. J. Hazard. Mater. 2009, 167, 589–596. [Google Scholar] [CrossRef] [PubMed]
  19. Da’na, E.; Sayari, A. Effect of regeneration conditions on the cyclic performance of amine-modified SBA-15 for removal of copper from aqueous solutions: Composite surface design methodology. Desalination 2011, 277, 54–60. [Google Scholar] [CrossRef]
  20. Imamoglu, M.; Tekir, O. Removal of copper (II) and lead (II) ions from aqueous solutions by adsorption on activated carbon from a new precursor hazelnut husks. Desalination 2008, 228, 108–113. [Google Scholar] [CrossRef]
  21. Madhava Rao, M.; Ramesh, A.; Purna Chandra Rao, G.; Seshaiah, K. Removal of copper and cadmium from the aqueous solutions by activated carbon derived from Ceiba pentandra hulls. J. Hazard. Mater. 2006, 129, 123–129. [Google Scholar] [CrossRef] [PubMed]
  22. Monser, L.; Adhoum, N. Modified activated carbon for the removal of copper, zinc, chromium and cyanide from wastewater. Sep. Purif. Technol. 2002, 26, 137–146. [Google Scholar] [CrossRef]
  23. Demiral, H.; Güngör, C. Adsorption of copper(II) from aqueous solutions on activated carbon prepared from grape bagasse. J. Clean. Prod. 2016, 124, 103–113. [Google Scholar] [CrossRef]
Figure 1. XRD diffractogram of SBA-15 and CMK-3 (a), nitrogen sorption isotherms (b) and TEM images (c).
Chemengineering 02 00049 g001
Figure 2. Mass effect on Cu2+ adsorption onto CMK-3 (at 25 °C, pH 6 and [Cu2+] = 30 ppm).
Chemengineering 02 00049 g002
Figure 3. Effect of pH on Cu2+ adsorption onto CMK-3 (at 25 °C, m = 20 mg and [Cu2+] = 30 ppm).
Chemengineering 02 00049 g003
Figure 4. Concentration effect on Cu2+ adsorption (at 25 °C, pH 6 and m = 20 mg).
Chemengineering 02 00049 g004
Figure 5. Temperature effect on copper adsorption (a) and plot of ln Kd versus 1/T (b) (at pH 6 and m = 20 mg).
Chemengineering 02 00049 g005
Figure 6. Normal percent probability versus internally Studentized residuals (a) and comparison of model predictions of adsorption with the experimental data (b) (R2 = 0.899).
Chemengineering 02 00049 g006aChemengineering 02 00049 g006b
Figure 7. 2D and 3D surface response plots of the quadratic model for copper adsorption on CMK-3 (hold values: M = 10 mg, T = 35°C, C = 150 ppm).
Chemengineering 02 00049 g007aChemengineering 02 00049 g007bChemengineering 02 00049 g007cChemengineering 02 00049 g007d
Table 1. The levels of independent variables.
VariablesCodeSymbolLevels
−10+1
Cu2+ concentration (ppm)AC50150300
Temperature (°C)BT253545
CMK-3 mass (mg)CM51020
Table 2. Textural properties of SBA-15 and its CMK-3 replica.
SampleSBET a (m2·g−1)Pore Size b (nm)Mesopore Volume c (cm3·g−1)Micropore Volume (cm3·g−1)
SBA-158965.60.7060.115
CMK-362140.40.033
Table 3. Thermodynamic parameters for Cu2+ adsorption on CMK-3.
MetalΔH° (kJ·mol−1)ΔS° (J·K−1·mol−1)T (K)ΔG° (kJ·mol−1)R2
Cu2+5.963.5298−12.90.923
308−13.7
318−14.2
Table 4. Response: actual and predicted values.
Variable 1Variable 2Variable 3Response
RunConcentrationTemperatureMassAdsorption %
mg/Ldeg. CmgActualPredicted
101185.687.95
2−1−1096.494
31−115049.21
4−10110098.95
51−1042.2642.62
61−1−131.531.07
70−1073.979.22
811046.951.29
910−13335.21
100−118185.24
110−1−168.467.95
12−1−1110099.64
13−10−172.183.41
14−11−17685.08
1500−170.769.90
160108083.51
170007880.78
18−11010095.37
19−1−1−188.482.92
2001−19073.03
2110049.846.37
22−11110099.44
231115556.30
2411−13940.53
2510157.352.17
26−10010094.10
270018686.01
Table 5. Estimated regression coefficients for response surface model.
SourceF-Valuep-ValueStandard Error
Model31.53<0.00013.65
A—concentration231.66<0.00011.56
B—temperature2.180.15771.57
C—mass27.42<0.00011.55
AB0.940.34581.88
AC0.0370.85061.85
BC0.100.75421.86
A24.580.04712.81
B20.0480.82932.68
C24.070.05963.07
Table 6. Heavy metal adsorption on activated carbon (AC).
CarbonModification RouteMetalIonsAdsorption Capacity (mg·g−1)Ref.
AC from hazelnut husksZinc chloride activationCu2+
Pb2+
6.64
13.05
[20]
AC from Ceiba pentandra hullsSteam activation (SA)Cu2+
Cd2+
20.8
19.5
[21]
Commercial ACSodium diethyl dithiocarbamate (SDDC)Cu2+38.9[22]
AC from grape bagassePhosphoric acidCu2+43.47[23]
CMK-3-Cu2+250This study

