Residential Green and Blue Spaces and Type 2 Diabetes Mellitus: A Population-Based Health Study in China


 ,
,  ,
, 

Abstract
1. Introduction
2. Materials and Methods
2.1. Study Population
2.2. Residential Green and Blue Space Assessments
2.3. Outcome Assessments
2.4. Covariates
2.5. Statistical Analyses
3. Results
4. Discussion
5. Conclusions
Supplementary Materials
Author Contributions
Funding
Institutional Review Board Statement
Informed Consent Statement
Data Availability Statement
Acknowledgments
Conflicts of Interest
References
- Hartig, T.; Mitchell, R.; De Vries, S.; Frumkin, H. Nature and Health. Annu. Rev. Public Health 2014, 35, 207–228. [Google Scholar] [CrossRef] [PubMed]
- Haddad, N.; Andrianou, X.D.; Makris, K.C. A Scoping Review on the Characteristics of Human Exposome Studies. Curr. Pollut. Rep. 2019, 5, 378–393. [Google Scholar] [CrossRef]
- Gourdji, S. Review of plants to mitigate particulate matter, ozone as well as nitrogen dioxide air pollutants and applicable recommendations for green roofs in Montreal, Quebec. Environ. Pollut. 2018, 241, 378–387. [Google Scholar] [CrossRef] [PubMed]
- Bhatnagar, A. Environmental Determinants of Cardiovascular Disease. Circ. Res. 2017, 121, 162–180. [Google Scholar] [CrossRef]
- WHO. Urban Green Spaces and Health: A Review of Evidence; WHO: Geneva, Switzerland, 2016. [Google Scholar]
- Luo, Y.N.; Huang, W.Z.; Liu, X.X.; Markevych, I.; Bloom, M.S.; Zhao, T.; Heinrich, J.; Yang, B.Y.; Dong, G.H. Greenspace with overweight and obesity: A systematic review and meta-analysis of epidemiological studies up to 2020. Obes. Rev. Off. J. Int. Assoc. Study Obes. 2020, 21, e13078. [Google Scholar] [CrossRef]
- Roth, G.A.; Abate, D.; Abate, K.H.; Abay, S.M.; Abbafati, C.; Abbasi, N.; Abbastabar, H.; Abd-Allah, F.; Abdela, J.; Abdelalim, A.; et al. Global, regional, and national age-sex-specific mortality for 282 causes of death in 195 countries and territories, 1980–2017: A systematic analysis for the Global Burden of Disease Study 2017. Lancet 2018, 392, 1736–1788. [Google Scholar] [CrossRef]
- Landrigan, P.J.; Fuller, R.; Acosta, N.J.R.; Adeyi, O.; Arnold, R.; Basu, N.; Baldé, A.B.; Bertollini, R.; Bose-O’Reilly, S.; Boufford, J.I.; et al. The Lancet Commission on pollution and health. Lancet 2018, 391, 462–512. [Google Scholar] [CrossRef]
- Astell-Burt, T.; Feng, X.; Kolt, G.S. Is Neighborhood Green Space Associated with a Lower Risk of Type 2 Diabetes? Evidence From 267,072 Australians. Diabetes Care 2014, 37, 197–201. [Google Scholar] [CrossRef]
- Feng, X.; Astell-Burt, T. Does area of residence influence weight loss following a diagnosis of type 2 diabetes? Fixed effects longitudinal analysis of 54,707 middle-to-older aged Australians. Diabetes Res. Clin. Pr. 2016, 116, 123–126. [Google Scholar] [CrossRef]
- Sørensen, M.; Andersen, Z.J.; Nordsborg, R.B.; Becker, T.; Tjønneland, A.; Overvad, K.; Raaschou-Nielsen, O. Long-Term Exposure to Road Traffic Noise and Incident Diabetes: A Cohort Study. Environ. Health Perspect. 2013, 121, 217–222. [Google Scholar] [CrossRef]
- Dadvand, P.; Poursafa, P.; Heshmat, R.; Motlagh, M.E.; Qorbani, M.; Basagaña, X.; Kelishadi, R. Use of green spaces and blood glucose in children; a population-based CASPIAN-V study. Environ. Pollut. 2018, 243, 1134–1140. [Google Scholar] [CrossRef] [PubMed]
- Fan, S.; Xue, Z.; Yuan, J.; Zhou, Z.; Wang, Y.; Yang, Z.; Yang, B.; Dong, G.; Zhang, Z. Associations of Residential Greenness with Diabetes Mellitus in Chinese Uyghur Adults. Int. J. Environ. Res. Public Health 2019, 16, 5131. [Google Scholar] [CrossRef]
- Yang, B.-Y.; Markevych, I.; Heinrich, J.; Bowatte, G.; Bloom, M.S.; Guo, Y.; Dharmage, S.C.; Jalaludin, B.; Knibbs, L.D.; Morawska, L.; et al. Associations of greenness with diabetes mellitus and glucose-homeostasis markers: The 33 Communities Chinese Health Study. Int. J. Hyg. Environ. Health 2019, 222, 283–290. [Google Scholar] [CrossRef] [PubMed]
- Tian, Z.; Li, Y.; Li, L.; Liu, X.; Zhang, H.; Zhang, X.; Qian, X.; Zhou, W.; Jiang, J.; Zhao, J.; et al. Gender-specific associations of body mass index and waist circumference with type 2 diabetes mellitus in Chinese rural adults: The Henan Rural Cohort Study. J. Diabetes Its Complicat. 2018, 32, 824–829. [Google Scholar] [CrossRef] [PubMed]
- Brown, S.C.; Lombard, J.; Wang, K.; Byrne, M.M.; Toro, M.; Plater-Zyberk, E.; Feaster, D.J.; Kardys, J.; Nardi, M.I.; Perez-Gomez, G.; et al. Neighborhood Greenness and Chronic Health Conditions in Medicare Beneficiaries. Am. J. Prev. Med. 2016, 51, 78–89. [Google Scholar] [CrossRef]
- Müller, G.; Harhoff, R.; Rahe, C.; Berger, K. Inner-city green space and its association with body mass index and prevalent type 2 diabetes: A cross-sectional study in an urban German city. BMJ Open 2018, 8, e019062. [Google Scholar] [CrossRef]
- Ngom, R.; Gosselin, P.; Blais, C.; Rochette, L. Type and Proximity of Green Spaces Are Important for Preventing Cardiovascular Morbidity and Diabetes—A Cross-Sectional Study for Quebec, Canada. Int. J. Environ. Res. Public Health 2016, 13, 423. [Google Scholar] [CrossRef]
- Clark, C.; Sbihi, H.; Tamburic, L.; Brauer, M.; Frank, L.D.; Davies, H.W. Association of Long-Term Exposure to Transportation Noise and Traffic-Related Air Pollution with the Incidence of Diabetes: A Prospective Cohort Study. Environ. Health Perspect. 2017, 125, 087025. [Google Scholar] [CrossRef]
- Lee, J.J.; Hwang, S.J.; Mutalik, K.; Corey, D.; Joyce, R.; Block, J.P.; Fox, C.S.; Powell-Wiley, T.M. Association of built environment characteristics with adiposity and glycaemic measures. Obes. Sci. Pract. 2017, 3, 333–341. [Google Scholar] [CrossRef]
- Ihlebaek, C.; Aamodt, G.; Aradi, R.; Claussen, B.; Thoren, K.H. Association between urban green space and self-reported lifestyle-related disorders in Oslo, Norway. Scand. J. Public Health 2018, 46, 589–596. [Google Scholar] [CrossRef]
- Labib, S.; Lindley, S.; Huck, J.J. Spatial dimensions of the influence of urban green-blue spaces on human health: A systematic review. Environ. Res. 2020, 180, 108869. [Google Scholar] [CrossRef] [PubMed]
- Crouse, D.L.; Balram, A.; Hystad, P.; Pinault, L.; Bosch, M.V.D.; Chen, H.; Rainham, D.; Thomson, E.M.; Close, C.H.; Van Donkelaar, A.; et al. Associations between Living Near Water and Risk of Mortality among Urban Canadians. Environ. Health Perspect. 2018, 126, 077008. [Google Scholar] [CrossRef] [PubMed]
- Völker, S.; Kistemann, T. The impact of blue space on human health and well-being—Salutogenetic health effects of inland surface waters: A review. Int. J. Hyg. Environ. Health 2011, 214, 449–460. [Google Scholar] [CrossRef] [PubMed]
- Gascon, M.; Triguero-Mas, M.; Martínez, D.; Dadvand, P.; Forns, J.; Plasència, A.; Nieuwenhuijsen, M.J. Mental Health Benefits of Long-Term Exposure to Residential Green and Blue Spaces: A Systematic Review. Int. J. Environ. Res. Public Health 2015, 12, 4354–4379. [Google Scholar] [CrossRef] [PubMed]
- Liu, X.; Mao, Z.; Li, Y.; Wu, W.; Zhang, X.; Huo, W.; Yu, S.; Shen, L.; Li, L.; Tu, R.; et al. Cohort Profile: The Henan Rural Cohort: A prospective study of chronic non-communicable diseases. Int. J. Epidemiol. 2019, 48, 1756. [Google Scholar] [CrossRef] [PubMed]
- Li, N.; Chen, G.; Liu, F.; Mao, S.; Liu, Y.; Hou, Y.; Lu, Y.; Liu, S.; Wang, C.; Xiang, H.; et al. Associations of long-term exposure to ambient PM1 with hypertension and blood pressure in rural Chinese population: The Henan rural cohort study. Environ. Int. 2019, 128, 95–102. [Google Scholar] [CrossRef] [PubMed]
- Wild, C.P. Complementing the genome with an “exposome”: The outstanding challenge of environmental exposure measurement in molecular epidemiology. Cancer Epidemiol. Biomark. Prev. 2005, 14, 1847–1850. [Google Scholar] [CrossRef]
- Meroni, M.; Fasbender, D.; Rembold, F.; Atzberger, C.; Klisch, A. Near real-time vegetation anomaly detection with MODIS NDVI: Timeliness vs. accuracy and effect of anomaly computation options. Remote Sens. Environ. 2019, 221, 508–521. [Google Scholar] [CrossRef]
- Jarchow, C.J.; Didan, K.; Barreto-Muñoz, A.; Nagler, P.L.; Glenn, E.P. Application and Comparison of the MODIS-Derived Enhanced Vegetation Index to VIIRS, Landsat 5 TM and Landsat 8 OLI Platforms: A Case Study in the Arid Colorado River Delta, Mexico. Sensors 2018, 18, 1546. [Google Scholar] [CrossRef]
- Simundic, A.-M.; Bolenius, K.; Cadamuro, J.; Church, S.; Cornes, M.P.; Van Dongen-Lases, E.C.; Eker, P.; Erdeljanovic, T.; Grankvist, K.; Guimaraes, J.T.; et al. Joint EFLM-COLABIOCLI Recommendation for venous blood sampling. Clin. Chem. Lab. Med. 2018, 56, 2015–2038. [Google Scholar] [CrossRef]
- Association, A.D. Classification and Diagnosis of Diabetes: Standards of Medical Care in Diabetes. Diabetes Care 2020, 43 (Suppl. S1), S14–S31. [Google Scholar] [CrossRef] [PubMed]
- Hunter, R.F.; Cleland, C.; Cleary, A.; Droomers, M.; Wheeler, B.W.; Sinnett, D.; Nieuwenhuijsen, M.; Braubach, M. Environmental, health, wellbeing, social and equity effects of urban green space interventions: A meta-narrative evidence synthesis. Environ. Int. 2019, 130, 104923. [Google Scholar] [CrossRef] [PubMed]
- Lee, P.H.; Macfarlane, D.J.; Lam, T.H.; Stewart, S.M. Validity of the international physical activity questionnaire short form (IPAQ-SF): A systematic review. Int. J. Behav. Nutr. Phys. Act. 2011, 8, 115. [Google Scholar] [CrossRef] [PubMed]
- Klompmaker, J.O.; Janssen, N.A.H.; Bloemsma, L.D.; Gehring, U.; Wijga, A.H.; Brink, C.V.D.; Lebret, E.; Brunekreef, B.; Hoek, G. Associations of Combined Exposures to Surrounding Green, Air Pollution, and Road Traffic Noise with Cardiometabolic Diseases. Environ. Health Perspect. 2019, 127, 087003. [Google Scholar] [CrossRef] [PubMed]
- Dalton, A.M.; Jones, A.P.; Sharp, S.J.; Cooper, A.J.; Griffin, S.J.; Wareham, N.J. Residential neighbourhood greenspace is associated with reduced risk of incident diabetes in older people: A prospective cohort study. BMC Public Health 2016, 16, 1171. [Google Scholar] [CrossRef] [PubMed]
- Thiering, E.; Markevych, I.; Bruske, I.; Fuertes, E.; Kratzsch, J.; Sugiri, D.; Hoffmann, B.; von Berg, A.; Bauer, C.P.; Koletzko, S.; et al. Associations of Residential Long-Term Air Pollution Exposures and Satellite-Derived Greenness with Insulin Resistance in German Adolescents. Environ. Health Perspect. 2016, 124, 1291–1298. [Google Scholar] [CrossRef] [PubMed]
- Liao, J.; Chen, X.; Xu, S.; Li, Y.; Zhang, B.; Cao, Z.; Zhang, Y.; Liang, S.; Hu, K.; Xia, W. Effect of residential exposure to green space on maternal blood glucose levels, impaired glucose tolerance, and gestational diabetes mellitus. Environ. Res. 2019, 176, 108526. [Google Scholar] [CrossRef] [PubMed]
- Bodicoat, D.H.; O’Donovan, G.; Dalton, A.M.; Gray, L.J.; Yates, T.; Edwardson, C.; Hill, S.; Webb, D.R.; Khunti, K.; Davies, M.J.; et al. The association between neighbourhood greenspace and type 2 diabetes in a large cross-sectional study. BMJ Open 2014, 4, e006076. [Google Scholar] [CrossRef]
- Cohen, D.A.; McKenzie, T.L.; Sehgal, A.; Williamson, S.; Golinelli, D.; Lurie, N. Contribution of Public Parks to Physical Activity. Am. J. Public Health 2007, 97, 509–514. [Google Scholar] [CrossRef]
- Yang, B.-Y.; Hu, L.-W.; Jalaludin, B.; Knibbs, L.D.; Markevych, I.; Heinrich, J.; Bloom, M.S.; Morawska, L.; Lin, S.; Jalava, P.; et al. Association Between Residential Greenness, Cardiometabolic Disorders, and Cardiovascular Disease Among Adults in China. JAMA Netw. Open 2020, 3, e2017507. [Google Scholar] [CrossRef]
- Browning, M.H.; Lee, K. Within What Distance Does “Greenness” Best Predict Physical Health? A Systematic Review of Articles with GIS Buffer Analyses across the Lifespan. Int. J. Environ. Res. Public Health 2017, 14, 675. [Google Scholar] [CrossRef] [PubMed]
- den Braver, N.R.; Lakerveld, J.; Rutters, F.; Schoonmade, L.J.; Brug, J.; Beulens, J.W.J. Built environmental characteristics and diabetes: A systematic review and meta-analysis. BMC Med. 2018, 16, 12. [Google Scholar] [CrossRef] [PubMed]
- Akpinar, A.; Cankurt, M. How are characteristics of urban green space related to levels of physical activity: Examining the links. Indoor Built Environ. 2017, 26, 1091–1101. [Google Scholar] [CrossRef]
- Glazer, K.B.; Eliot, M.N.; Danilack, V.A.; Carlson, L.; Phipps, M.G.; Dadvand, P.; Savitz, D.A.; Wellenius, G.A. Residential green space and birth outcomes in a coastal setting. Environ. Res. 2018, 163, 97–107. [Google Scholar] [CrossRef] [PubMed]
- Amoly, E.; Dadvand, P.; Forns, J.; López-Vicente, M.; Basagaña, X.; Julvez, J.; Alvarez-Pedrerol, M.; Nieuwenhuijsen, M.J.; Sunyer, J. Green and Blue Spaces and Behavioral Development in Barcelona Schoolchildren: The BREATHE Project. Environ. Health Perspect. 2014, 122, 1351–1358. [Google Scholar] [CrossRef] [PubMed]
- Pasanen, T.P.; White, M.P.; Wheeler, B.W.; Garrett, J.K.; Elliott, L.R. Neighbourhood blue space, health and wellbeing: The mediating role of different types of physical activity. Environ. Int. 2019, 131, 105016. [Google Scholar] [CrossRef]
- Triguero-Mas, M.; Dadvand, P.; Cirach, M.; Martínez, D.; Medina, A.; Mompart, A.; Basagaña, X.; Gražulevičienė, R.; Nieuwenhuijsen, M.J. Natural outdoor environments and mental and physical health: Relationships and mechanisms. Environ. Int. 2015, 77, 35–41. [Google Scholar] [CrossRef]
- Nutsford, D.; Pearson, A.L.; Kingham, S.; Reitsma, F. Residential exposure to visible blue space (but not green space) associated with lower psychological distress in a capital city. Health Place 2016, 39, 70–78. [Google Scholar] [CrossRef]
- Markevych, I.; Schoierer, J.; Hartig, T.; Chudnovsky, A.; Hystad, P.; Dzhambov, A.M.; De Vries, S.; Triguero-Mas, M.; Brauer, M.; Nieuwenhuijsen, M.J.; et al. Exploring pathways linking greenspace to health: Theoretical and methodological guidance. Environ. Res. 2017, 158, 301–317. [Google Scholar] [CrossRef]
- Pugh, T.A.M.; MacKenzie, A.R.; Whyatt, J.D.; Hewitt, C.N. Effectiveness of Green Infrastructure for Improvement of Air Quality in Urban Street Canyons. Environ. Sci. Technol. 2012, 46, 7692–7699. [Google Scholar] [CrossRef]
- Paull, N.J.; Irga, P.J.; Torpy, F.R. Active green wall plant health tolerance to diesel smoke exposure. Environ. Pollut. 2018, 240, 448–456. [Google Scholar] [CrossRef] [PubMed]
- Liu, F.; Chen, G.; Huo, W.; Wang, C.; Liu, S.; Li, N.; Mao, S.; Hou, Y.; Lu, Y.; Xiang, H. Associations between long-term exposure to ambient air pollution and risk of type 2 diabetes mellitus: A systematic review and meta-analysis. Environ. Pollut. 2019, 252 Pt B, 1235–1245. [Google Scholar] [CrossRef]
- Sarkar, C. Residential greenness and adiposity: Findings from the UK Biobank. Environ. Int. 2017, 106, 1–10. [Google Scholar] [CrossRef] [PubMed]
- Pereira, G.; Christian, H.; Foster, S.; Boruff, B.; Bull, F.C.; Knuiman, M.; Giles-Corti, B. The association between neighborhood greenness and weight status: An observational study in Perth Western Australia. Environ. Health 2013, 12, 49. [Google Scholar] [CrossRef]
- Taylor, R. Type 2 Diabetes: Etiology and reversibility. Diabetes Care 2013, 36, 1047–1055. [Google Scholar] [CrossRef] [PubMed]
- Sarkar, C.; Webster, C.; Gallacher, J. Residential greenness and prevalence of major depressive disorders: A cross-sectional, observational, associational study of 94 879 adult UK Biobank participants. Lancet Planet. Health 2018, 2, e162–e173. [Google Scholar] [CrossRef]
- Pun, V.C.; Manjourides, J.; Suh, H. Association of neighborhood greenness with self-perceived stress, depression and anxiety symptoms in older U.S adults. Environ. Health 2018, 17, 1–11. [Google Scholar] [CrossRef]
- Fox, C.S.; Golden, S.H.; Anderson, C.A.M.; Bray, G.A.; Burke, L.E.; De Boer, I.H.; Deedwania, P.C.; Eckel, R.H.; Ershow, A.G.; Fradkin, J.; et al. Update on Prevention of Cardiovascular Disease in Adults with Type 2 Diabetes Mellitus in Light of Recent Evidence: A Scientific Statement from the American Heart Association and the American Diabetes Association. Diabetes Care 2015, 38, 1777–1803. [Google Scholar] [CrossRef]
- Di, N.; Li, S.; Xiang, H.; Xie, Y.; Mao, Z.; Hou, J.; Liu, X.; Huo, W.; Yang, B.; Dong, G.; et al. Associations of Residential Greenness with Depression and Anxiety in Rural Chinese Adults. Innovation 2020, 1, 100054. [Google Scholar] [CrossRef]
- Ferrannini, G.; de Bacquer, D.; De Backer, G.; Kotseva, K.; Mellbin, L.; Wood, D.; Rydén, L. Screening for Glucose Perturbations and Risk Factor Management in Dysglycemic Patients with Coronary Artery Disease-A Persistent Challenge in Need of Substantial Improvement: A Report from ESC EORP EUROASPIRE V. Diabetes Care 2020, 43, 726–733. [Google Scholar] [CrossRef]
- Labib, S.; Huck, J.J.; Lindley, S. Modelling and mapping eye-level greenness visibility exposure using multi-source data at high spatial resolutions. Sci. Total. Environ. 2020, 755 Pt 1, 143050. [Google Scholar] [CrossRef]
- Ki, D.; Lee, S. Analyzing the effects of Green View Index of neighborhood streets on walking time using Google Street View and deep learning. Landsc. Urban Plan. 2021, 205, 103920. [Google Scholar] [CrossRef]
- Thiesse, L.; Rudzik, F.; Spiegel, K.; Leproult, R.; Pieren, R.; Wunderli, J.M.; Foraster, M.; Héritier, H.; Eze, I.C.; Meyer, M.; et al. Adverse impact of nocturnal transportation noise on glucose regulation in healthy young adults: Effect of different noise scenarios. Environ. Int. 2018, 121 Pt 1, 1011–1023. [Google Scholar] [CrossRef]


| Characteristics a | No Type 2 Diabetes Mellitus | Type 2 Diabetes Mellitus | Total |
|---|---|---|---|
| N | 35,345 (90.6) | 3674 (9.4) | 39,019 (100.0) |
| NDVI (unit) * | 0.48 ± 0.07 | 0.47 ± 0.07 | 0.48 ± 0.07 |
| EVI (unit) * | 0.34 ± 0.06 | 0.33 ± 0.06 | 0.34 ± 0.06 |
| DNW (km) * | 3.66 ± 2.71 | 3.41 ± 2.53 | 3.64 ± 2.70 |
| FBG (mmol/L) * | 5.19 ± 0.58 | 8.95 ± 2.86 | 5.54 ± 1.50 |
| Age (years) * | 55.10 ± 12.34 | 60.35 ± 9.29 | 55.58 ± 12.18 |
| Age < 65 | 26,401 (74.7) | 2366 (64.4) | 28,767 (73.7) |
| Age ≥ 65 | 8944 (25.3) | 1318 (35.6) | 10,252 (26.3) |
| Sex | |||
| Male | 13,987 (39.6) | 1394 (37.9) | 15,381 (39.4) |
| Female | 21,358 (60.4) | 2280 (62.1) | 23,638 (60.6) |
| BMI (kg/m2) * | 24.69 ± 3.52 | 26.18 ± 3.67 | 24.83 ± 3.56 |
| BMI < 25 | 19,619 (55.5) | 1430 (38.9) | 21,049 (53.9) |
| BMI ≥ 25 | 15,726 (44.5) | 2244 (61.1) | 17,970 (46.1) |
| Education level * | |||
| Elementary school or below | 15,424 (43.6) | 2031 (55.3) | 17,455 (44.7) |
| Middle school | 14,346 (40.6) | 1211 (33.0) | 15,557 (39.9) |
| High school or above | 5575 (15.8) | 432 (11.8) | 6007 (15.4) |
| Marital status | |||
| Married/cohabiting | 31,784 (89.9) | 3255 (88.6) | 35,039 (89.8) |
| Widowed/single/ divorced/separation | 3561 (10.1) | 419 (11.4) | 3980 (10.2) |
| Monthly income * | |||
| Low | 12,464 (35.3) | 1447 (39.4) | 13,911 (35.7) |
| Medium | 11,653 (33.0) | 1181 (32.1) | 12,834 (32.9) |
| High | 11,228 (31.8) | 1048 (28.5) | 12,274 (31.5) |
| Smoking * | |||
| Never | 25,643 (72.5) | 2766 (75.3) | 28,409 (72.8) |
| Former | 2794 (7.9) | 372 (10.1) | 3166 (8.1) |
| Current | 6908 (19.5) | 536 (14.6) | 7444 (19.1) |
| Drinking * | |||
| Never | 27,265 (77.1) | 2900 (78.9) | 30,165 (77.3) |
| Former | 1578 (4.5) | 237 (6.5) | 1815 (4.7) |
| Current | 6502 (18.4) | 537 (14.6) | 7039 (18.0) |
| High-fat diet (≥75 g/day) * | |||
| No | 28,489 (80.6) | 3076 (83.7) | 31,565 (80.9) |
| Yes | 6856 (19.4) | 598 (16.3) | 7454 (19.1) |
| Fruit and vegetable intake (≥ 500 g/day) * | |||
| No | 20,354 (57.6) | 2358 (64.2) | 22,712 (58.2) |
| Yes | 14,991 (42.4) | 1316 (35.8) | 16,307 (41.8) |
| Physical activity * | |||
| Low | 11,142 (31.5) | 1439 (39.2) | 12,581 (32.2) |
| Medium | 13,445 (38.0) | 1300 (35.4) | 14,745 (37.8) |
| High | 10,758 (30.4) | 935 (25.4) | 11,693 (30.0) |
| Family history of diabetes * | |||
| No | 34,083 (96.4) | 3309 (90.1) | 37,392 (95.8) |
| Yes | 1262 (3.6) | 365 (9.9) | 1627 (4.2) |
| Type 2 Diabetes Mellitus or (95%CI) | Fasting Blood Glucose Levels %Change (95%CI) | |||||
|---|---|---|---|---|---|---|
| Crude | Model 1 | Model 2 | Crude | Model 1 | Model 2 | |
| Residential green space | ||||||
| NDVI | ||||||
| Continuous (per IQR) | 0.810 (0.780,0.842) * | 0.846 (0.813,0.880) * | 0.866 (0.830,0.903) * | −1.962 (−2.292,−1.631) * | −1.677 (−2.008,−1.345) * | −1.384 (−1.726,−1.040) * |
| Q1: <0.449 | Reference | Reference | Reference | Reference | Reference | Reference |
| Q2: 0.449–0.499 | 0.919 (0.840,1.006) | 0.923 (0.841,1.012) | 0.913 (0.832,1.003) | 2.125 (1.313,2.944) | 2.259 (1.449,3.075) | 2.170 (1.359,2.987) |
| Q3: 0.499–0.533 | 0.752 (0.684,0.825) * | 0.776 (0.706,0.855) * | 0.802 (0.727,0.884) | −2.166 (−2.942,−1.385) * | −1.913 (−2.687,−1.133) * | −1.561 (−2.349,−0.767) * |
| Q4: >0.533 | 0.571 (0.516,0.631) * | 0.641 (0.578,0.710) * | 0.675 (0.606,0.751) * | −3.671 (−4.439,−2.896) * | −3.000 (−3.773,−2.221) * | −2.470 (−3.269,−1.665) * |
| EVI | ||||||
| Continuous (per IQR) | 0.800 (0.764,0.837) * | 0.834 (0.796,0.874) * | 0.858 (0.817,0.901) * | −1.905 (−2.291,−1.517) * | −1.620 (−2.007,−1.232) * | −1.273 (−1.672,−0.871) * |
| Q1: <0.306 | Reference | Reference | Reference | Reference | Reference | Reference |
| Q2: 0.306–0.346 | 0.902 (0.823,0.989) | 0.899 (0.818,0.987) | 0.892 (0.810,0.981) | 1.499 (0.685,2.320) | 1.629 (0.817,2.448) | 1.573 (0.759,2.393) |
| Q3: 0.346–0.392 | 0.758 (0.691,0.831) * | 0.779 (0.709,0.857) * | 0.803 (0.729,0.884) | −1.993 (−2.754,−1.226) * | −1.693 (−2.454,−0.925) * | −1.402 (−2.173,−0.625) * |
| Q4: >0.392 | 0.622 (0.565,0.685) * | 0.676 (0.613,0.746) * | 0.713 (0.643,0.790) * | −3.803 (−4.549,−3.052) * | −3.336 (−4.084,−2.582) * | −2.770 (−3.545,−1.989) * |
| Residential blue space | ||||||
| Distance to the nearest water body | ||||||
| Continuous (per IQR) | 0.884 (0.837,0.934) * | 0.883 (0.836,0.933) * | 0.885 (0.838,0.935) * | −1.387 (−1.679,−1.094) * | −1.384 (−1.676,−1.091) * | −1.371 (−1.663,−1.078) * |
| <2 km | Reference | Reference | Reference | Reference | Reference | Reference |
| 2–5 km | 0.999 (0.919,1.087) | 0.998 (0.917,1.086) | 0.993 (0.912,1.081) | −0.608 (−1.096,−0.118) | −0.613 (−1.102,−0.123) | −0.635 (−1.123,−0.145) |
| >5 km | 0.842 (0.770,0.922) * | 0.842 (0.769,0.921) * | 0.843 (0.770,0.923) * | −1.840 (−2.347,−1.330) * | −1.839 (−2.346,−1.329) * | −1.829 (−2.335,−1.320) * |
| Group | Type 2 Diabetes Mellitus | Fasting Blood Glucose Levels | ||||||
|---|---|---|---|---|---|---|---|---|
| NDVI | EVI | NDVI | EVI | |||||
| OR (95%CI) | P-interaction | OR (95%CI) | P-interaction | %Change (95%CI) | P-interaction | %Change (95%CI) | P-interaction | |
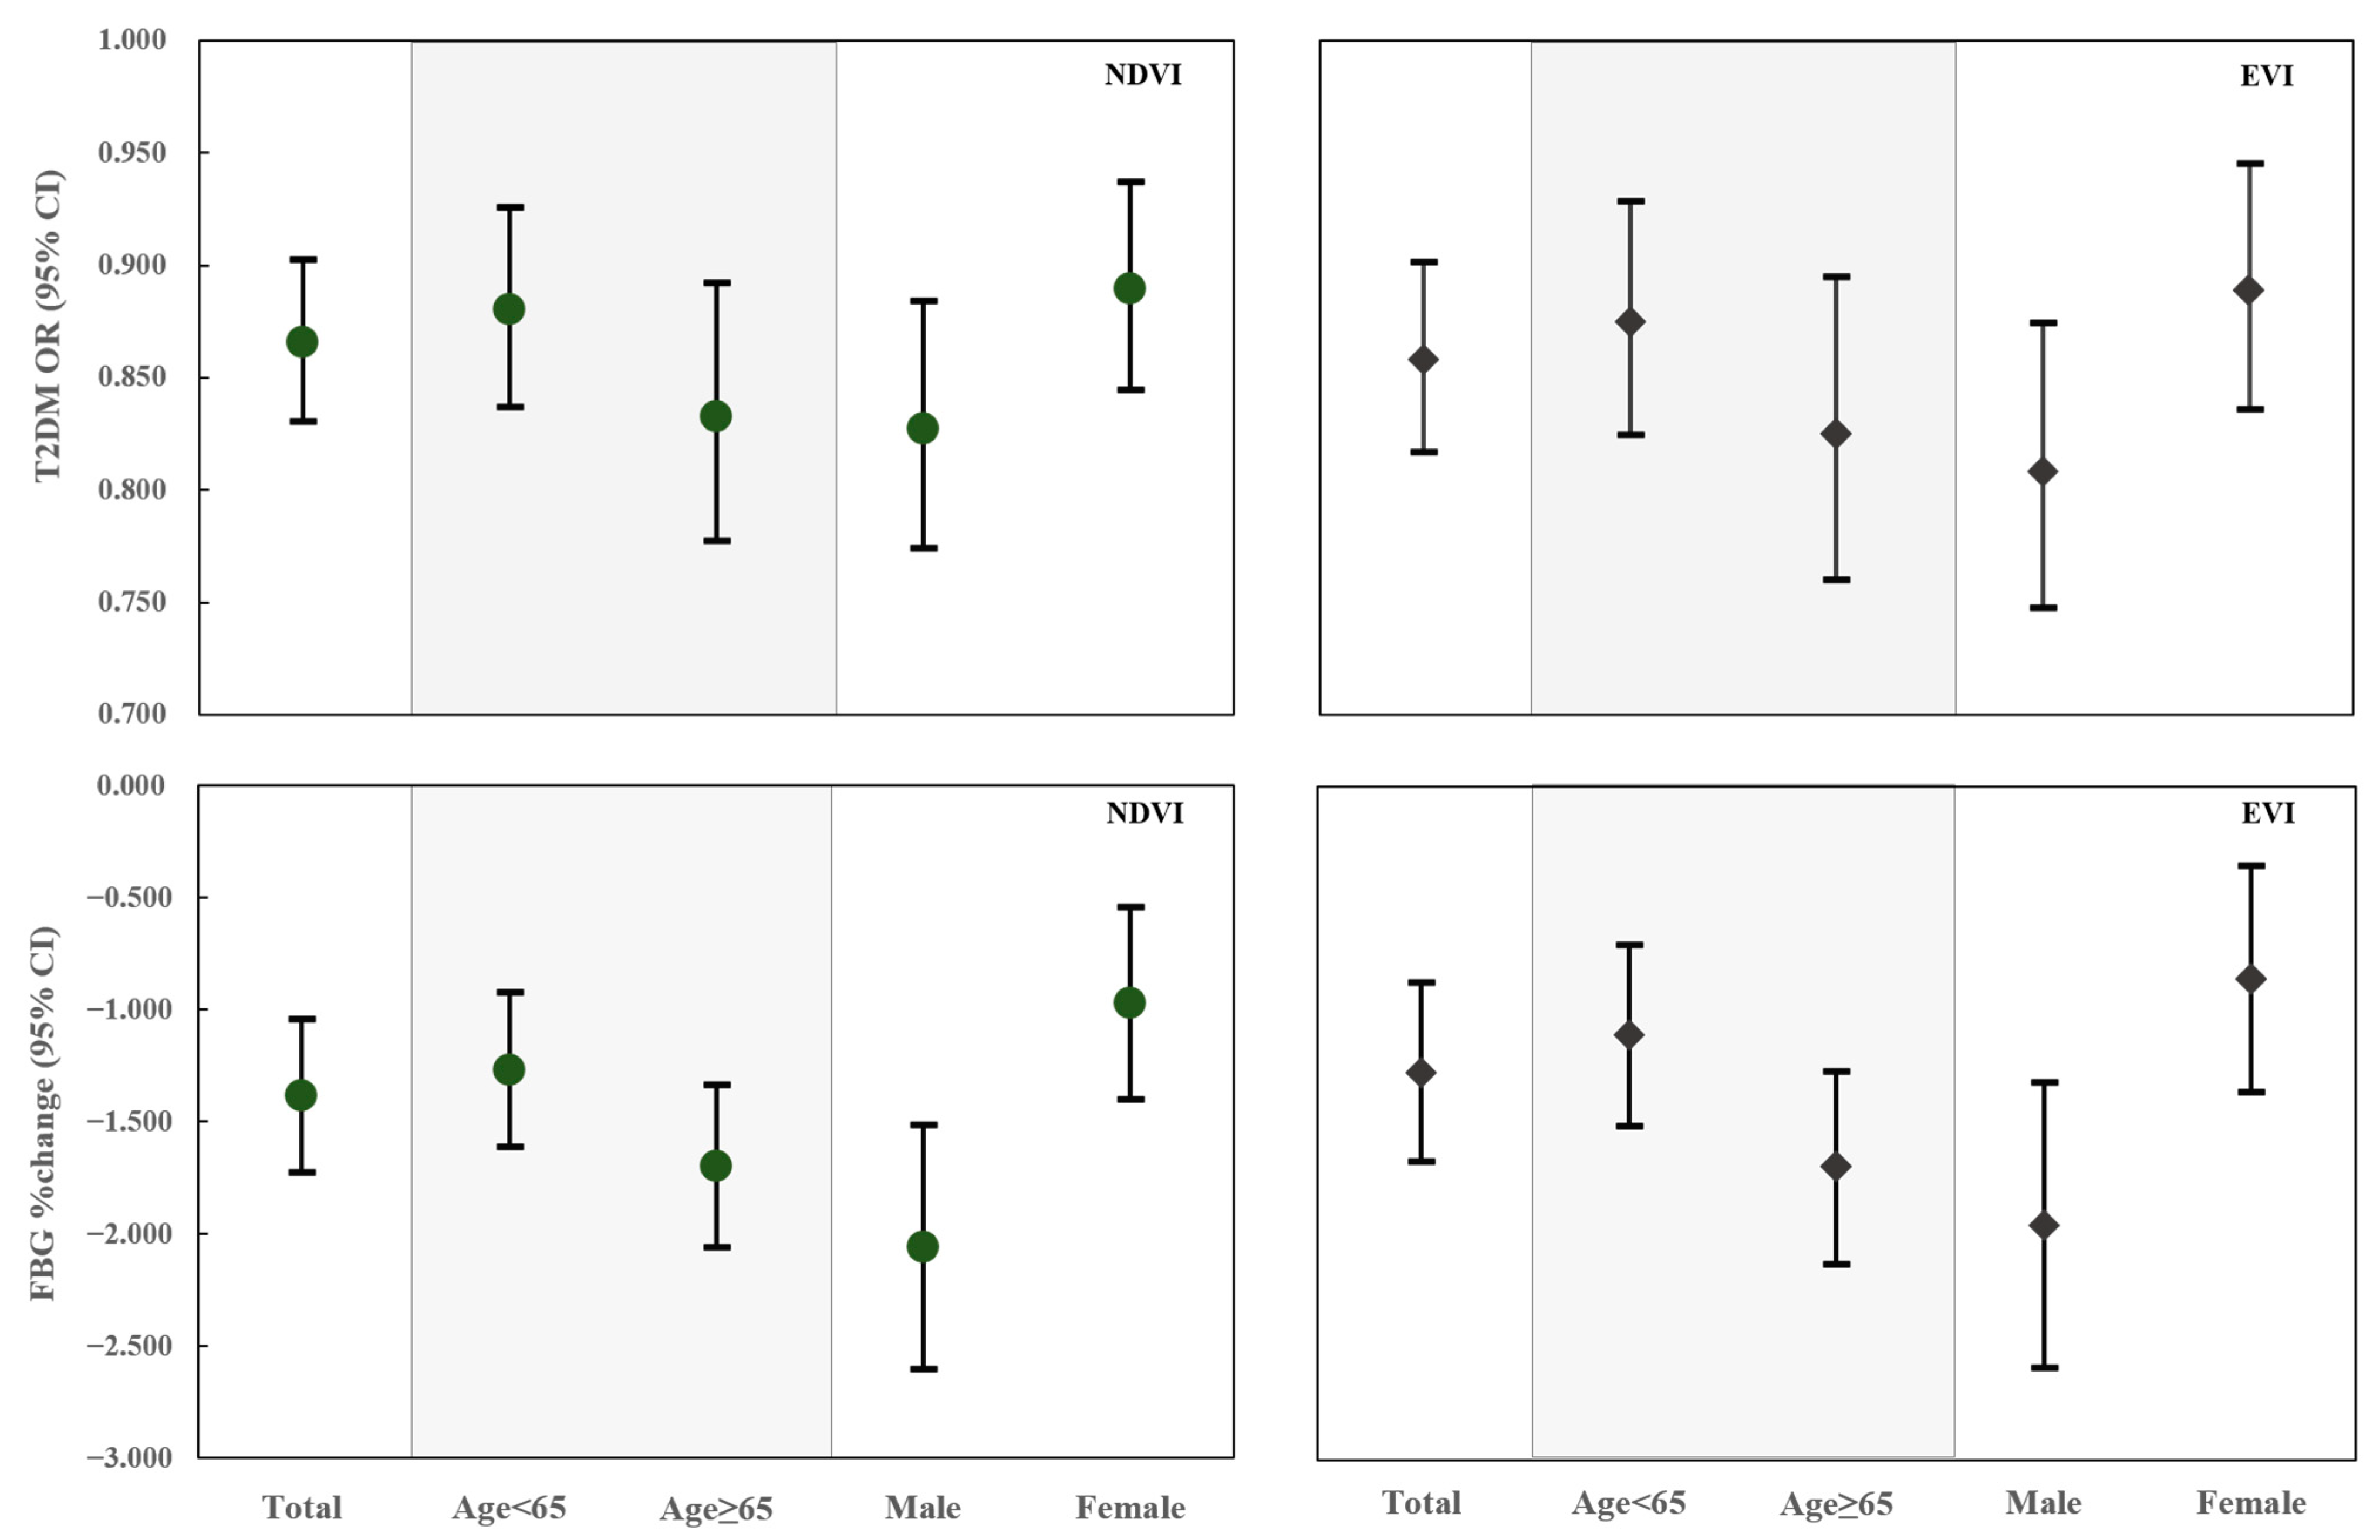
| Age (years) | ||||||||
| <65 | 0.880 (0.837,0.926) | 0.875 (0.825,0.929) | −1.268 (−1.614,−0.921) | −1.109 (−1.513,−0.702) | ||||
| ≥65 | 0.833 (0.777,0.892) | 0.197 | 0.825 (0.760,0.895) | 0.242 | −1.696 (−2.056,−1.336) | <0.001 | −1.696 (−2.124,−1.267) | <0.001 |
| Sex | ||||||||
| Male | 0.827 (0.774,0.884) | 0.809 (0.747,0.875) | −2.060 (−2.600,−1.516) | −1.954 (−2.586,−1.318) | ||||
| Female | 0.890 (0.845,0.937) | 0.084 | 0.889 (0.836,0.945) | 0.058 | −0.972 (−1.402,−0.541) | <0.001 | −0.859 (−1.360,−0.355) | 0.004 |
| BMI (kg/m2) | ||||||||
| <25 | 0.858 (0.821,0.895) | 0.846 (0.804,0.891) | −1.410 (−1.760,−1.059) | −1.298 (−1.710,−0.884) | ||||
| ≥25 | 0.872 (0.836,0.910) | 0.083 | 0.868 (0.825,0.913) | 0.071 | −1.352 (−1.705,−0.997) | 0.459 | −1.242 (−1.659,−0.823) | 0.621 |
| Monthly income | ||||||||
| Low | 0.861 (0.807,0.919) | 0.857 (0.794,0.925) | −1.427 (−1.981,−0.869) | |||||
| Medium | 0.857 (0.797,0.922) | 0.927 | 0.843 (0.773,0.920) | 0.782 | −1.464 (−2.047,−0.879) | 0.926 | −1.372 (−2.058,−0.682) | 0.783 |
| High | 0.881 (0.817,0.950) | 0.646 | 0.876 (0.802,0.957) | 0.713 | −1.248 (−1.847,−0.646) | 0.665 | −1.206 (−1.906,−0.502) | 0.942 |
| Physical activity | ||||||||
| Low | 0.860 (0.804,0.920) | 0.846 (0.781,0.917) | −1.220 (−1.812,−0.624) | |||||
| Medium | 0.837 (0.784,0.893) | 0.562 | 0.827 (0.766,0.893) | 0.678 | −1.493 (−2.128,−0.854) | 0.584 | −1.304 (−1.916,−0.688) | 0.561 |
| High | 0.925 (0.850,1.006) | 0.182 | 0.930 (0.843,1.025) | 0.141 | −1.438 (−1.963,−0.911) | 0.535 | −1.496 (−2.231,−0.754) | 0.369 |
Publisher’s Note: MDPI stays neutral with regard to jurisdictional claims in published maps and institutional affiliations. |
© 2021 by the authors. Licensee MDPI, Basel, Switzerland. This article is an open access article distributed under the terms and conditions of the Creative Commons Attribution (CC BY) license (http://creativecommons.org/licenses/by/4.0/).
Share and Cite
Li, R.; Chen, G.; Jiao, A.; Lu, Y.; Guo, Y.; Li, S.; Wang, C.; Xiang, H. Residential Green and Blue Spaces and Type 2 Diabetes Mellitus: A Population-Based Health Study in China. Toxics 2021, 9, 11. https://doi.org/10.3390/toxics9010011
Li R, Chen G, Jiao A, Lu Y, Guo Y, Li S, Wang C, Xiang H. Residential Green and Blue Spaces and Type 2 Diabetes Mellitus: A Population-Based Health Study in China. Toxics. 2021; 9(1):11. https://doi.org/10.3390/toxics9010011
Chicago/Turabian StyleLi, Ruijia, Gongbo Chen, Anqi Jiao, Yuanan Lu, Yuming Guo, Shanshan Li, Chongjian Wang, and Hao Xiang. 2021. "Residential Green and Blue Spaces and Type 2 Diabetes Mellitus: A Population-Based Health Study in China" Toxics 9, no. 1: 11. https://doi.org/10.3390/toxics9010011
APA StyleLi, R., Chen, G., Jiao, A., Lu, Y., Guo, Y., Li, S., Wang, C., & Xiang, H. (2021). Residential Green and Blue Spaces and Type 2 Diabetes Mellitus: A Population-Based Health Study in China. Toxics, 9(1), 11. https://doi.org/10.3390/toxics9010011