Bioanalytical and Mass Spectrometric Methods for Aldehyde Profiling in Biological Fluids


Abstract
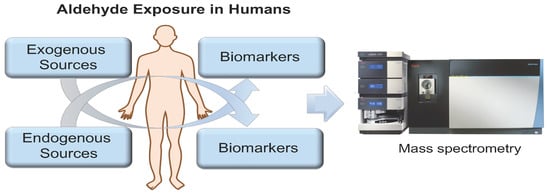
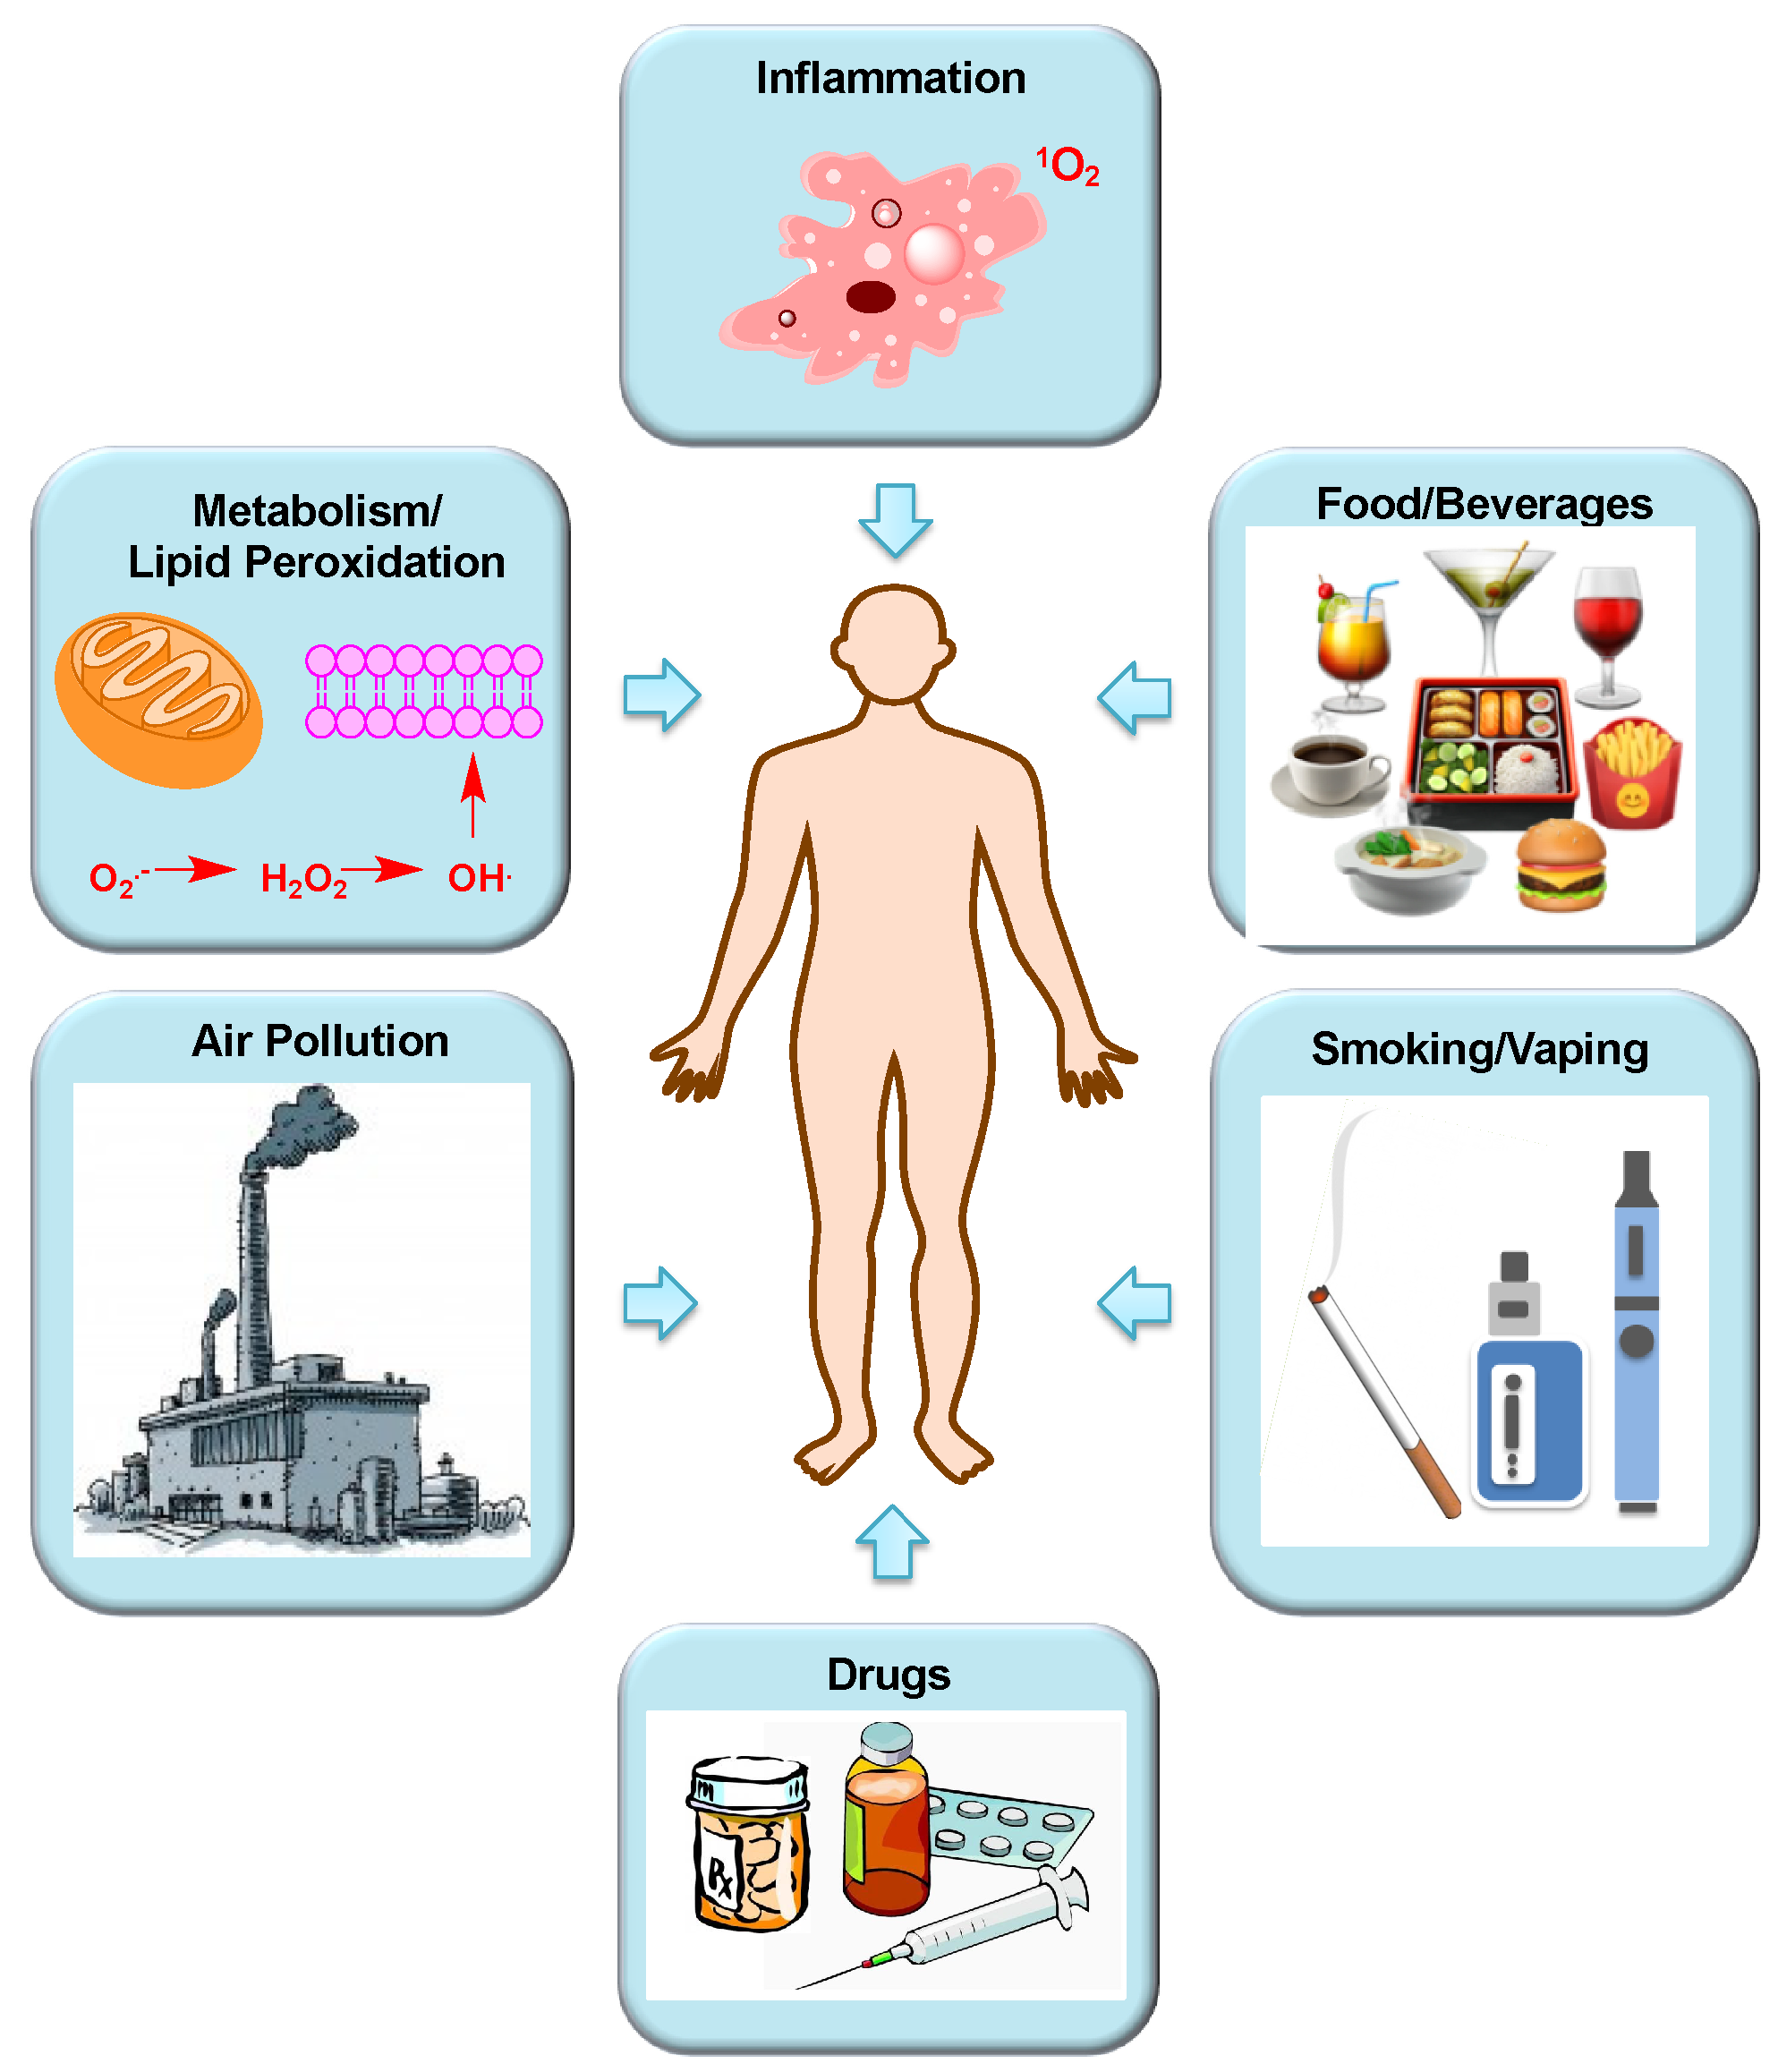
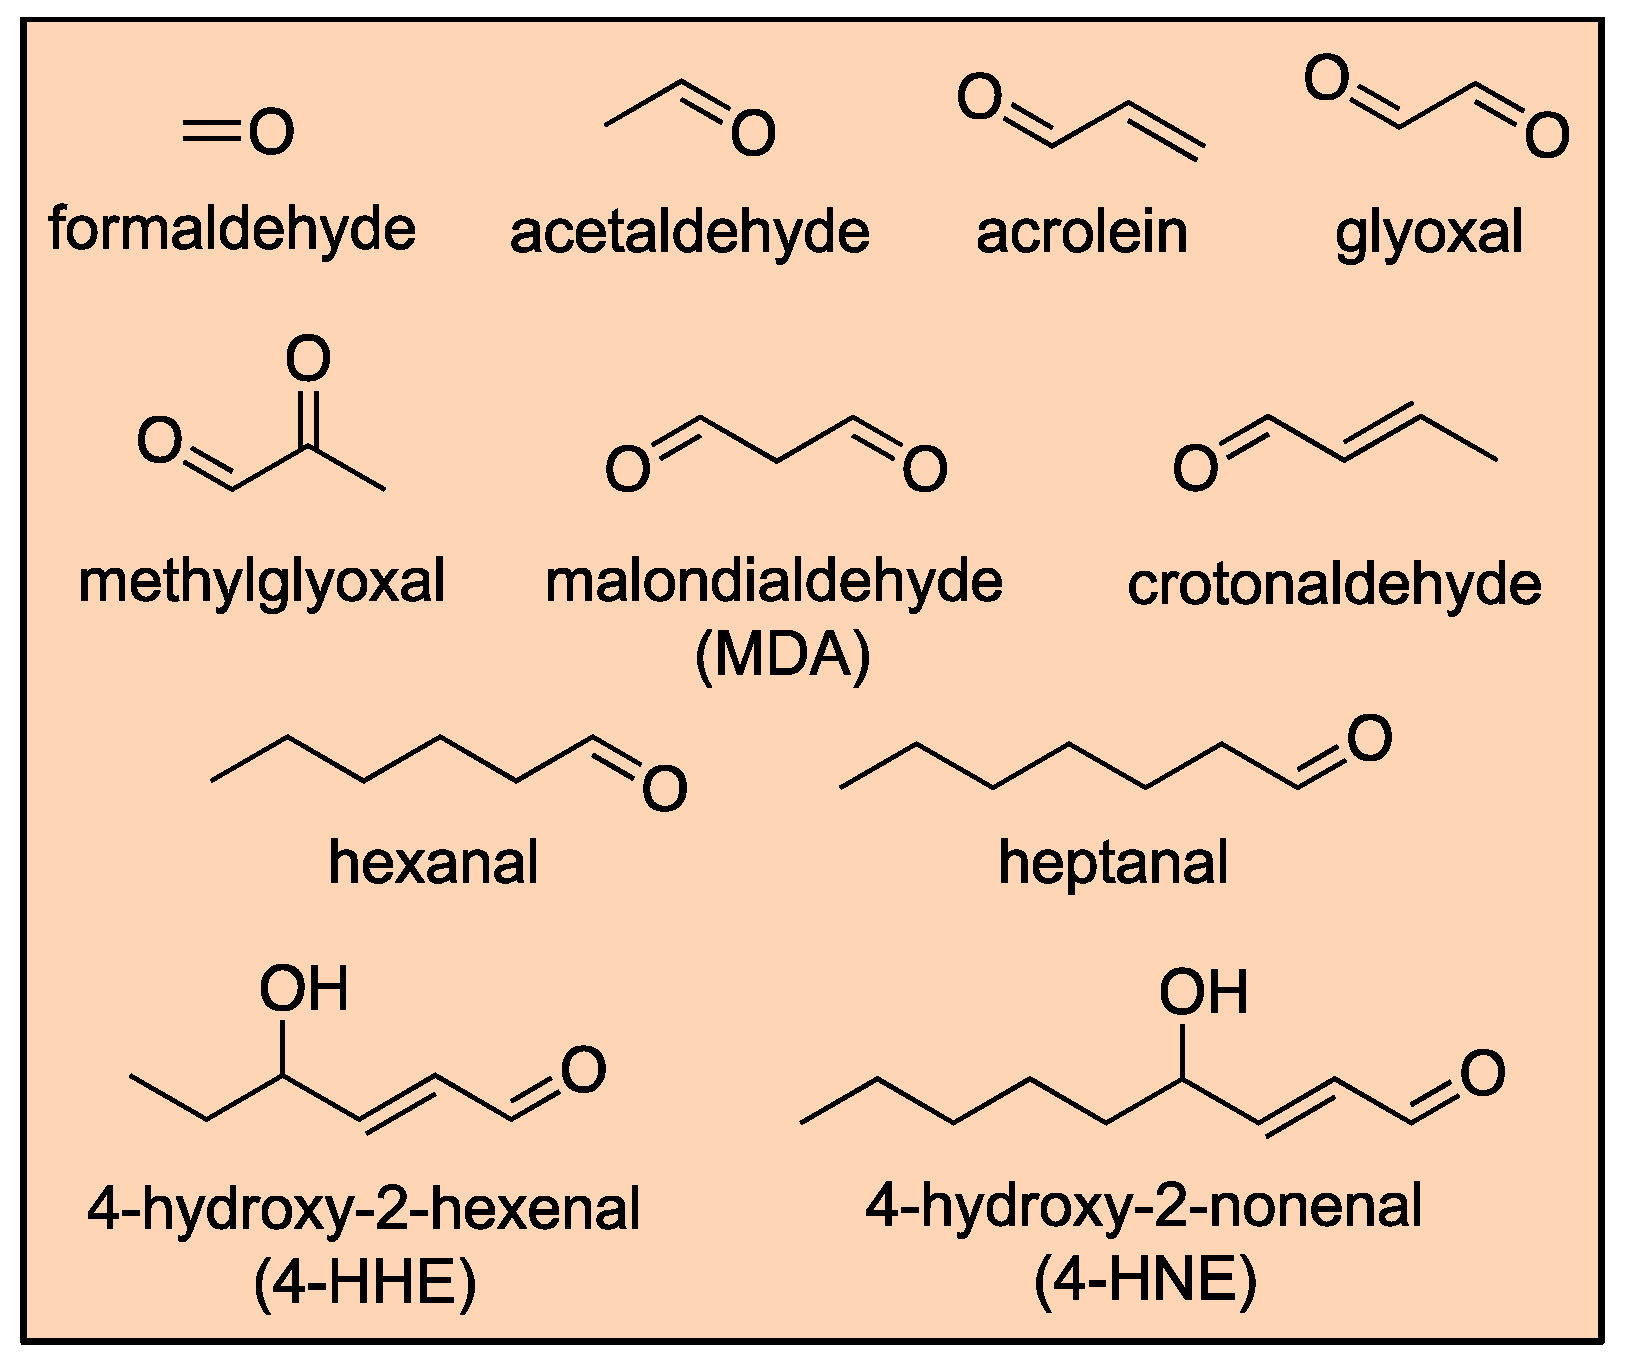
1. Introduction
Sources of Human Exposure to Aldehydes
2. Biological Consequences of Aldehyde Exposure on Genome Integrity, Carcinogenesis, and Other Diseases
3. Metabolism of Aldehydes
4. Bioanalytical and Mass Spectrometric Methods for Characterizing Aldehydes
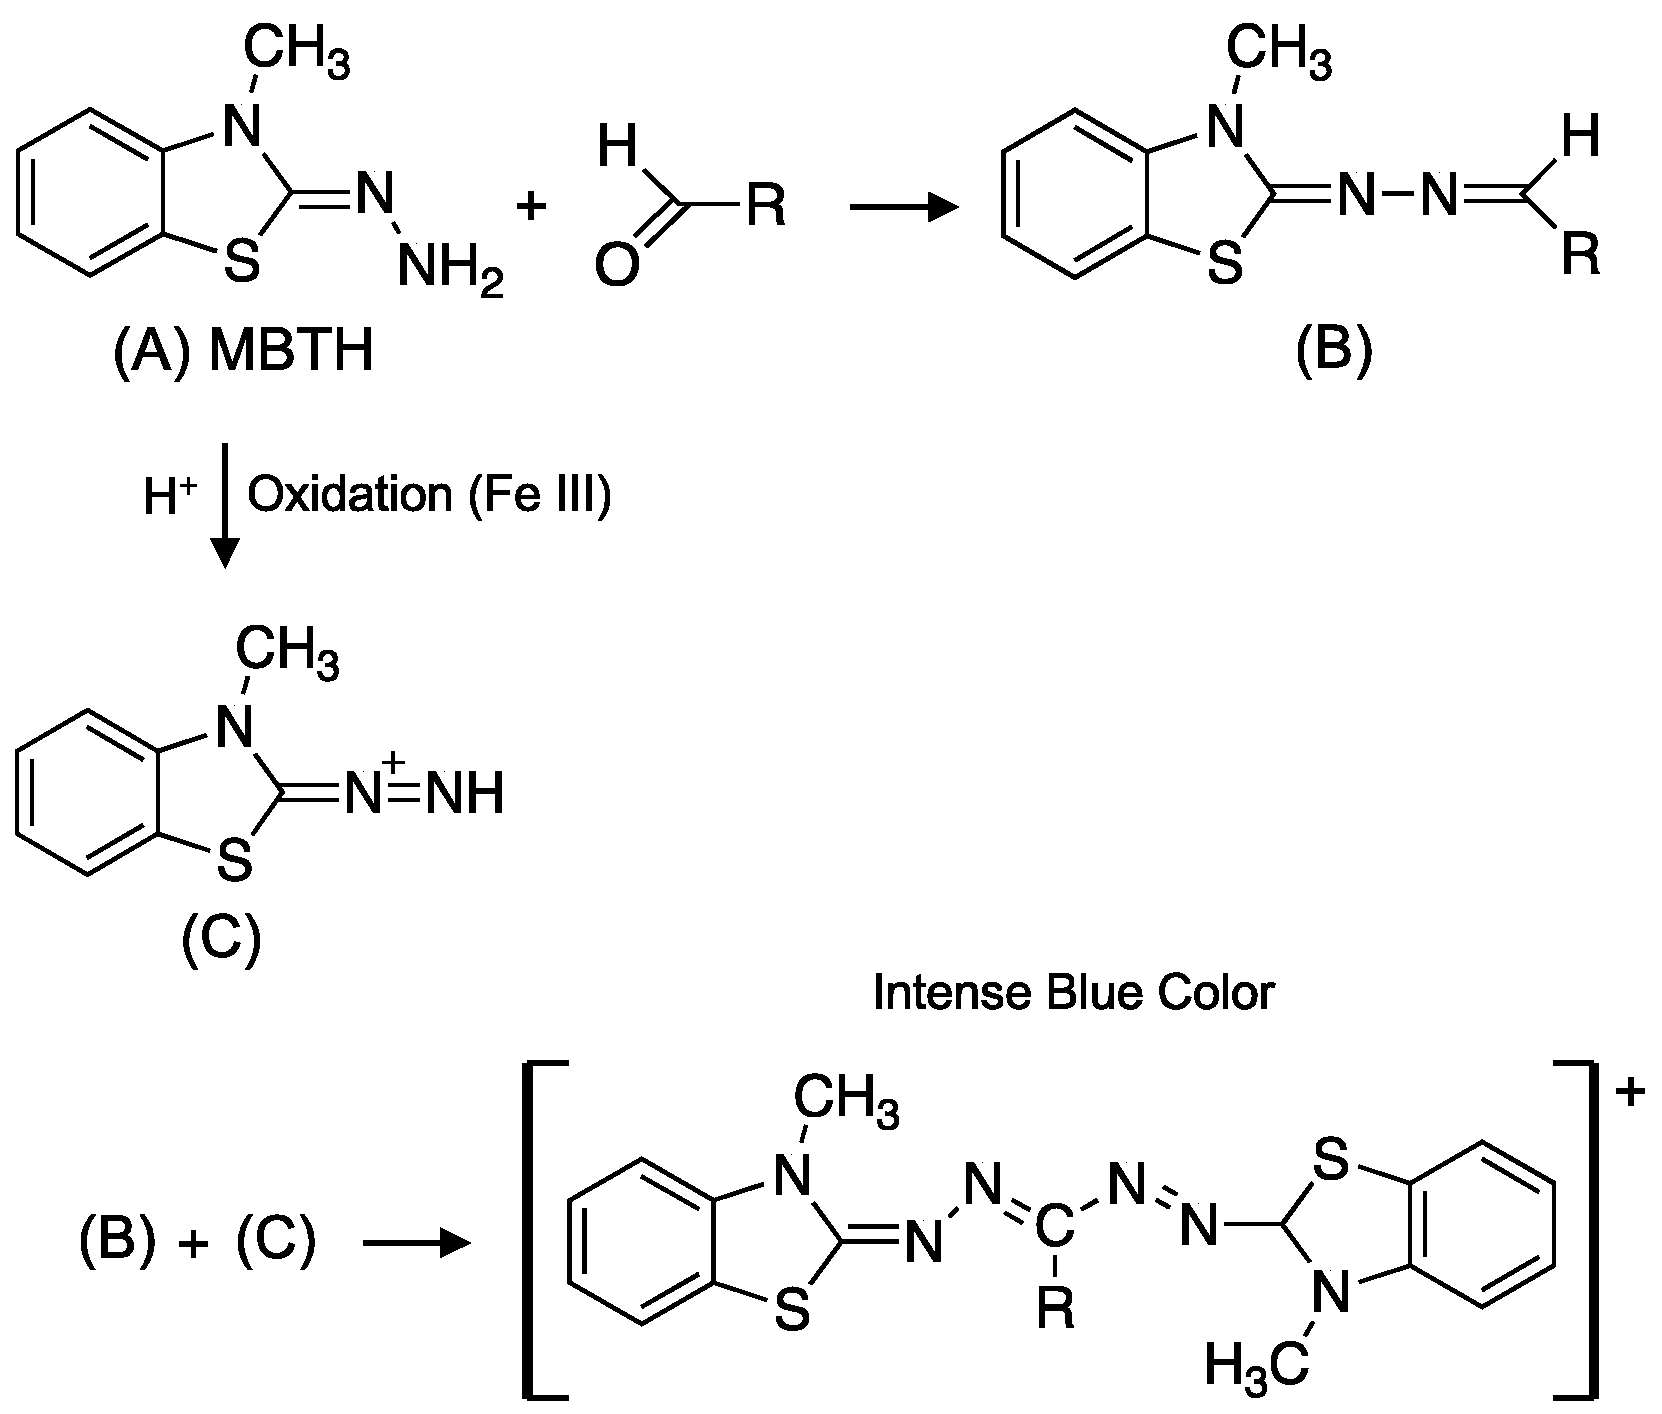
4.1. Colorimetric/Fluorimetric/Amperometric Methods
4.2. High-Performance Liquid Chromatography (HPLC) with Ultraviolet (UV)/Fluorescence Detection
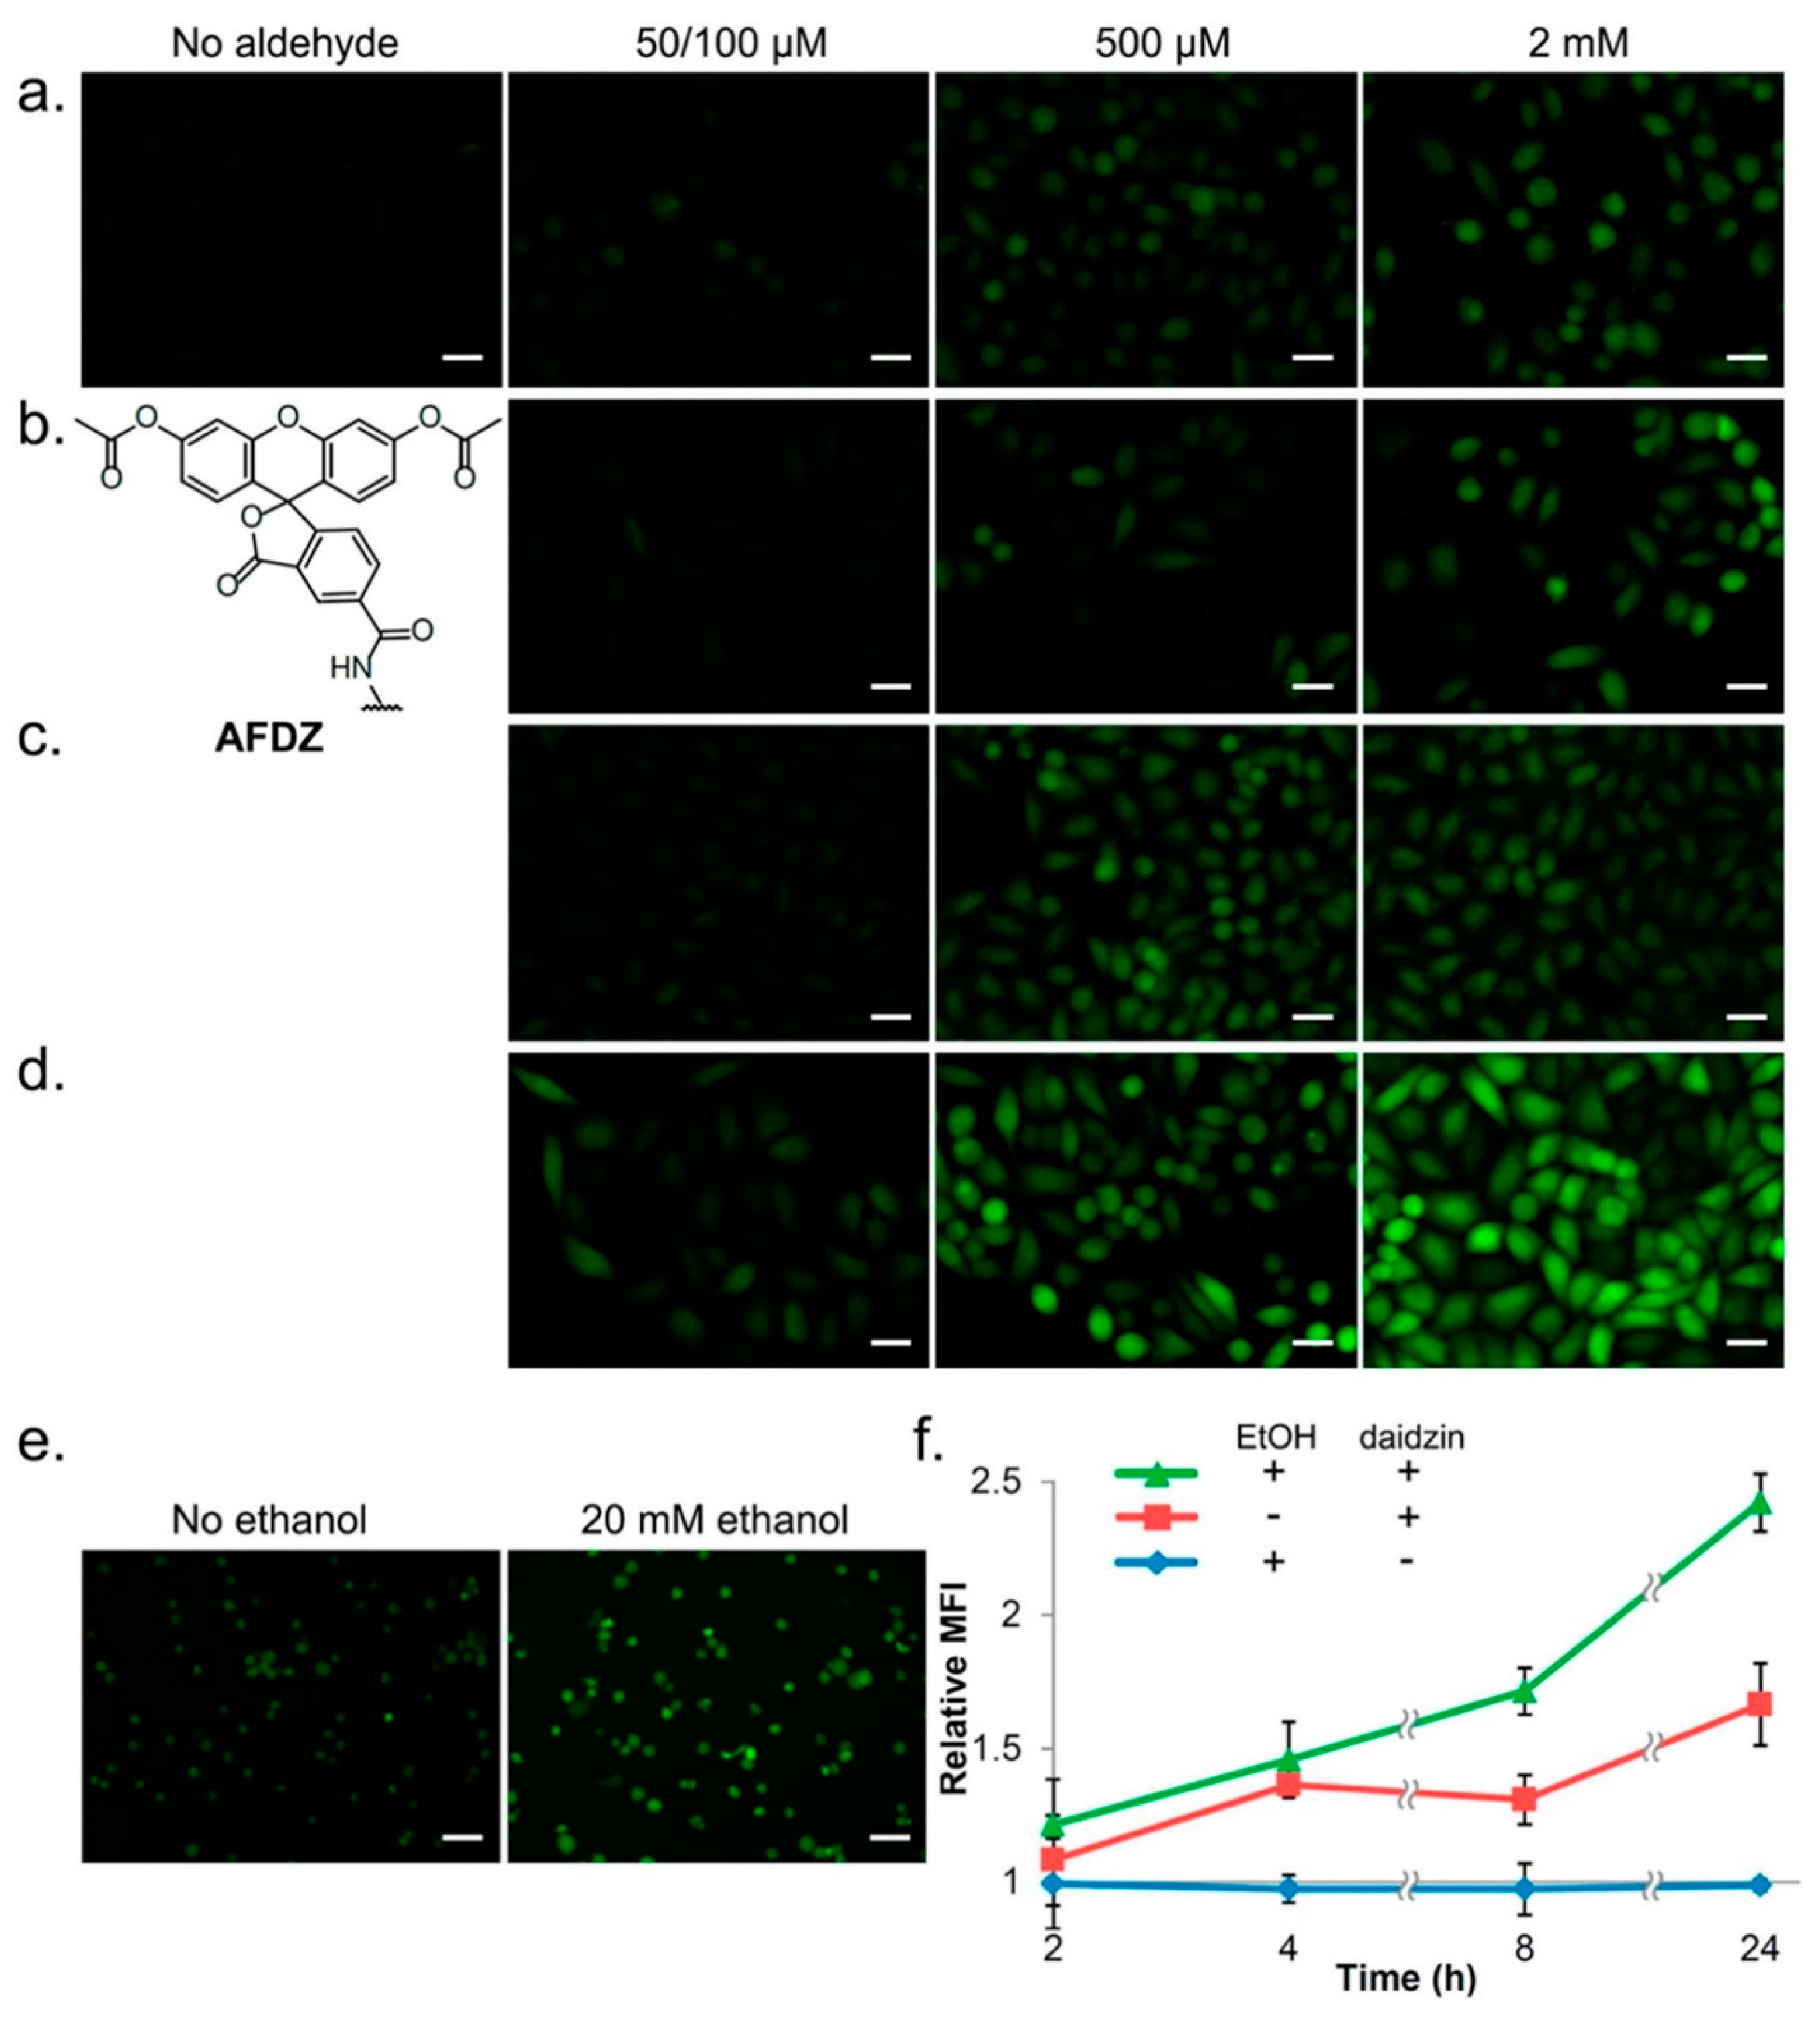
4.3. Aldehyde Visualization in Cells
4.4. Gas Chromatography (GC)/Gas Chromatography-Mass Spectrometry (GC-MS)
4.5. Liquid Chromatography-Mass Spectrometry (LC-MS)
4.5.1. Methods Based on Selected Reaction Monitoring (SRM)
4.5.2. Screening LC-MS Methods
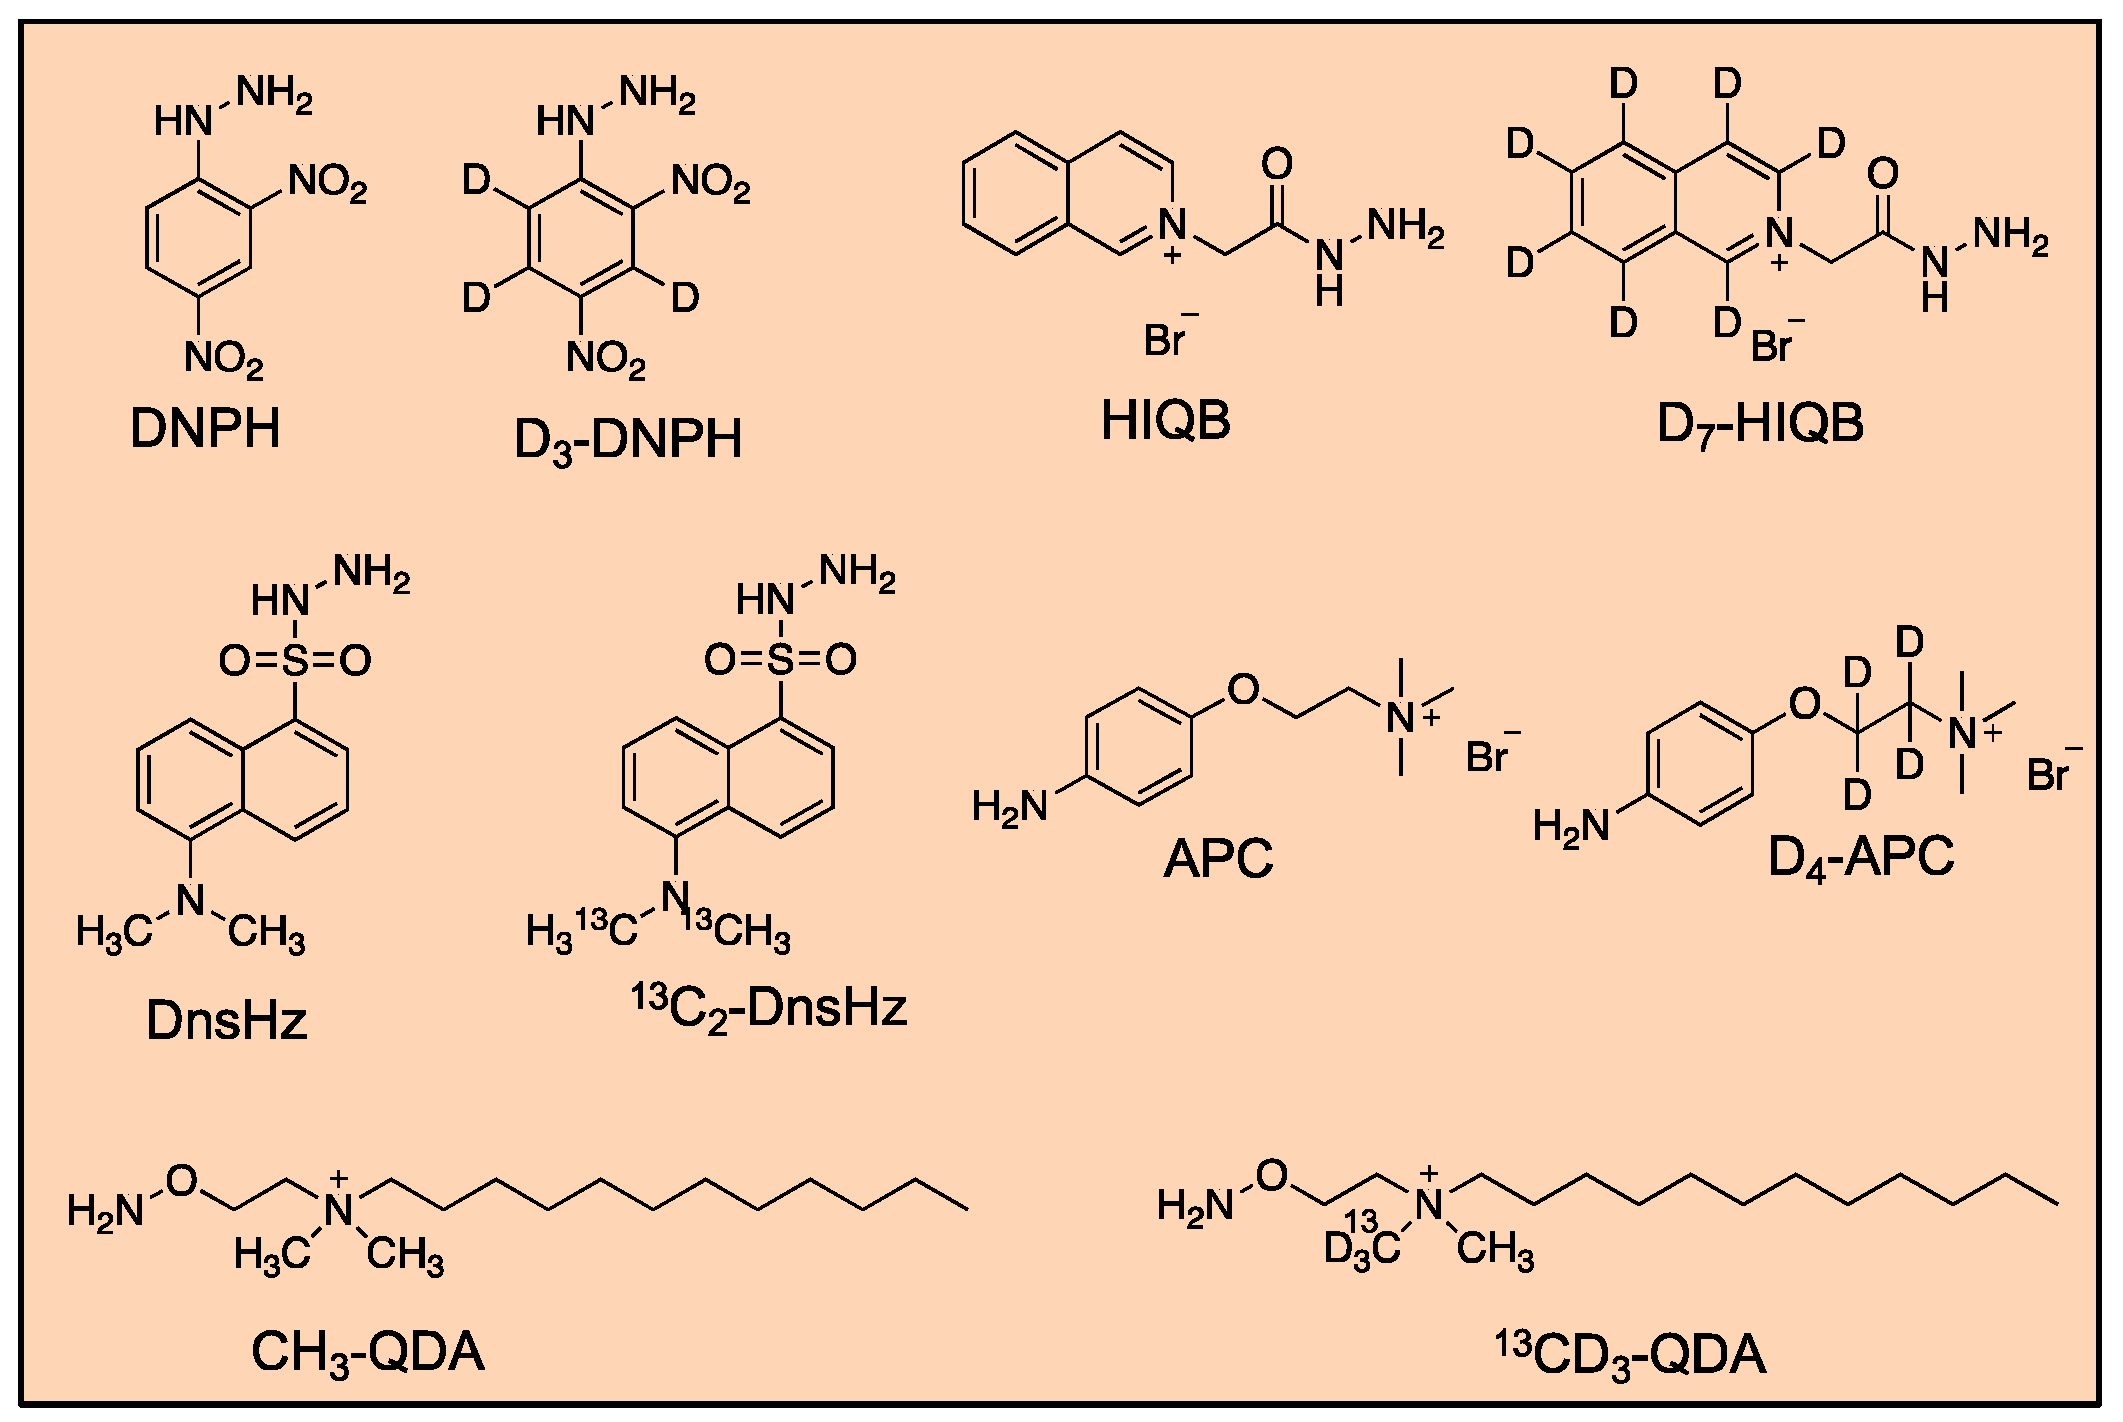
Differential Isotope Labeling for Profiling and Relative Quantitation of Aldehydes
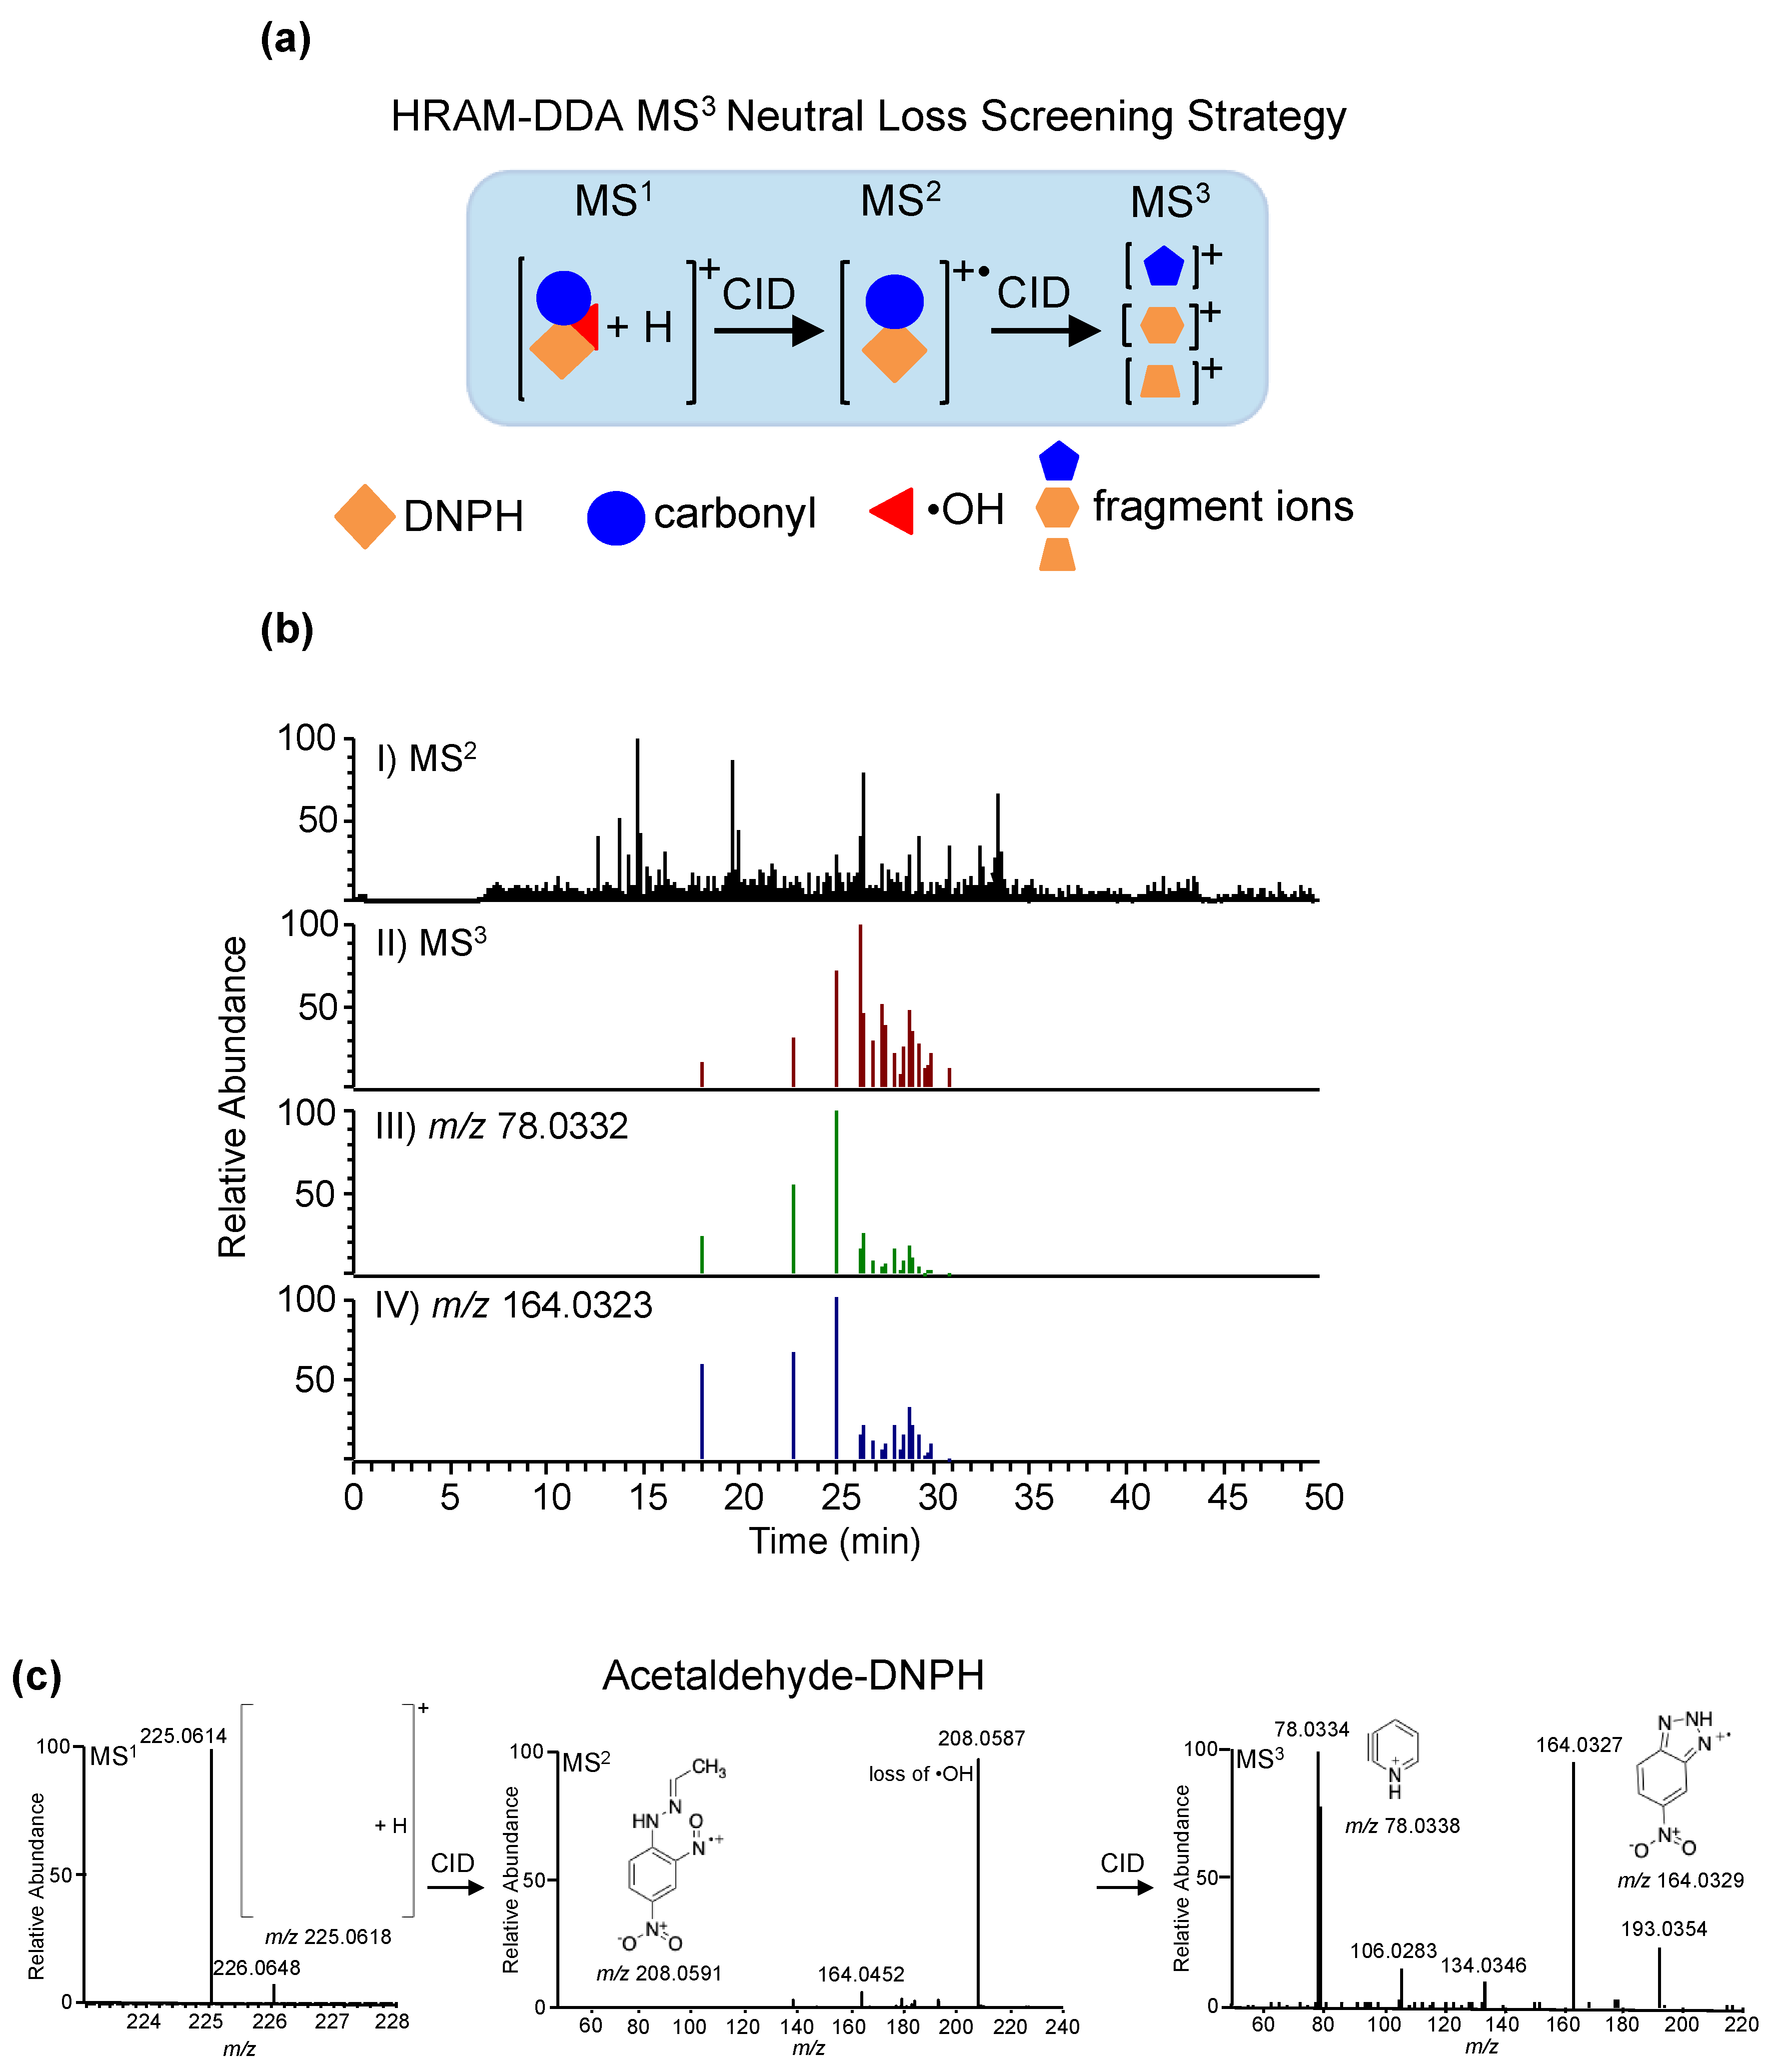
Methods Using High-Resolution/Accurate Mass Data Dependent Acquisition (DDA) and Data Independent Acquisition (DIA)
5. Future Perspectives
Author Contributions
Funding
Acknowledgments
Conflicts of Interest
Abbreviations
| 2,4-DNPH | 2,4-dinitrophenylhydrazine |
| PFPH | pentafluorophenyl hydrazine |
| 2-PB | 2-picoline borane |
| 4-APC | 4-(2-(trimethylammonio)ethoxy)benzenaminium halide |
| 4-APEBA | 4-(2-((4-bromophenethyl)dimethylammonio)ethoxy)benzenaminium dibromide |
| HIQB | N,N,N-triethyl-2-hydrazinyl-2-oxoethanaminium bromide |
| QDA | N-[2-(aminooxy)ethyl]-N,N-dimethyl-1-dodecylammonium |
| TSH | p-toluenesulfonylhydrazine |
| PFB-Br | 2,3,4,5,6-pentafluorobenzyl bromide |
| HTMOB | 4-hydrazino-N,N,N-trimethyl-4-oxobutanaminium iodide |
| DBD-H | 4-(N,N-dimethylaminosulfonyl)-7-hydrazino-2,1,3-benzoxadiazole |
| 4-MPD | 4-methoxy-o-phenylenediamine |
| FMOC-hydrazine | 9-fluorenylmethoxycarbonyl hydrazine |
| PFBHA/PFBOA | o-2,3,4,5,6-pentafluorobenzyl)hydroxylamine hydrochloride |
| ATM | 2-(aminooxy)ethyl-N,N,N-trimethylammonium iodide |
| AMAH | 4-(2-aminooxyethyl)-morpholin-4-ium chloride |
| TBARS | thiobarbituric acid reactive substances |
| 2-TBA | 2-thiobarbituric acid |
| TFEH | 2,2,2-trifluoroethylhydrazine |
| FAP-1/FP 1 | formaldehyde probe 1 |
| DEAC | diethylaminocoumarin |
| DAN | diaminonapththalene |
| RBH | rhodamine B hydrazide |
| DDB | 1,2-diamino-4,5-dimethoxybenzene |
| MSTFA | N-methyl-N-trimethylsilyl-trifluoroacetamide |
| 2-AA | 2-aminoacridone |
| 3-dG | 3-deoxyglucosone |
| BODIPY aminozide | 1,3,5,7-tetramethyl-8-aminozide-difluoroboradiaza-s-indacence |
| 5-HMF | 5-hydroxymethylfurfural |
| 4-HBA | 4-hydrazinobenzoic acid |
| DnsHz | dansylhydrazine |
| 9,10-PQ | 9,10-phenanthrenequinone |
| T3 | 2,4-bis-(diethylamino)-6-hydrazino-1,3,5-triazine |
| TMPP-AcPFP | S-pentafluorophenyl tris(2,4,6-trimethoxyphenyl)phosphonium acetate bromide |
| TMPP-PrG | 4-hydrazino-4-oxobutyl)[tris(2,4,6-trimethoxyphenyl)phosphonium bromide |
| TCPH | 2,4,6-trichlorophenylhydrazine |
| SALLE | salting-out assisted liquid–liquid extraction |
| DLLME | dispersive liquid–liquid microextraction |
| SIL-SPE-LC-DPIS-MS | stable isotope labeling-solid phase extraction-liquid chromatography-double precursor-ion scan mass spectrometry |
| DNLS-MS | double neutral loss scan mass spectrometry |
| HR-AM | high resolution accurate mass |
| MTS | mainstream tobacco smoke |
| EBC | exhaled breath condensate |
| ESI | electrospray ionization |
| APCI | atmospheric pressure chemical ionization |
| APPI | atmospheric pressure photoionization |
| UHPLC | ultra-high performance liquid chromatography |
| SWATH | sequential window acquisition of all theoretical fragment-ion spectra |
| QqTOF | quadrupole time-of-flight |
| UHR-FT MS | ultra-high resolution fourier transform mass spectrometry |
| LC-MSn | liquid chromatography tandem mass spectrometry |
| 4-HNE | 4-hydroxy-2-nonenal |
| 4-HHE | 4-hydroxy-2-hexenal |
| MDA | malondialdehyde |
| CID | collision-induced dissociation |
| HCD | high-energy C-trap dissociation |
| AIDA | alternate isotope-coded derivatization |
References
- O’Brien, P.J.; Siraki, A.G.; Shangari, N. Aldehyde sources, metabolism, molecular toxicity mechanisms, and possible effects on human health. Crit. Rev. Toxicol. 2005, 35, 609–662. [Google Scholar] [CrossRef] [PubMed]
- Atkinson, R. Gas-Phase Tropospheric Chemistry of Organic Compounds: A Review. Atmos. Environ. 1990, 24A, 1–41. [Google Scholar] [CrossRef]
- Riedel, K.; Weller, R.; Schrems, O. Variability of formaldehyde in the Antarctic troposphere. Phys. Chem. Chem. Phys. 1999, 1, 5523–5527. [Google Scholar] [CrossRef]
- Cecinato, A.; Yassaa, N.; Di Palo, V.; Possanzin, M. Observation of volatile and semi-volatile carbonyls in an Algerian urban environment using dinitrophenylhydrazine/silica-HPLC and pentafluorophenylhydrazine/silica-GC-MS. J. Environ. Monit. 2002, 4, 223–228. [Google Scholar] [CrossRef] [PubMed]
- Maldotti, A.; Chiorboli, C.; Bignozzi, C.; Bartocci, C.; Carassiti, V. Photooxidation of 1,3-butadiene containing systems: Rate constant determination for the reaction of acrolein with⋅OH radicals. Int. J. Chem. Kinet. 1980, 12, 905–913. [Google Scholar] [CrossRef]
- Destaillats, H.; Spaulding, R.S.; Charles, M.J. Ambient air measurement of acrolein and other carbonyls at the Oakland-San Francisco Bay Bridge toll plaza. Environ. Sci. Technol. 2002, 36, 2227–2235. [Google Scholar] [CrossRef] [PubMed]
- Rao, X.; Kobayashi, R.; White-Morris, R.; Spaulding, R.; Frazey, P.; Charles, M.J. GC/ITMS measurement of carbonyls and multifunctional carbonyls in PM2.5 particles emitted from motor vehicles. J. AOAC Int. 2001, 84, 699–705. [Google Scholar] [PubMed]
- Grosjean, E.; Grosjean, D.; Fraser, M.; Cass, G. Air Quality Model Evaluation Data for Organics. 2. C1−C14 Carbonyls in Los Angeles Air. Environ. Sci. Technol. 1996, 30, 2687–2703. [Google Scholar] [CrossRef]
- Dost, F.N. Acute toxicology of components of vegetation smoke. Rev. Environ. Contam. Toxicol. 1991, 119, 1–46. [Google Scholar] [PubMed]
- Materna, B.L.; Jones, J.R.; Sutton, P.M.; Rothman, N.; Harrison, R.J. Occupational exposures in California wildland fire fighting. Am. Ind. Hyg. Assoc. J. 1992, 53, 69–76. [Google Scholar] [CrossRef] [PubMed]
- Dempsey, C. A Comparison of Organic Emissions from Hazardous Waste Incinerators Versus the 1990 Toxics Release Inventory Air Releases. J. Air Waste Manage. Assoc. 1993, 43, 1374–1379. [Google Scholar] [CrossRef]
- Sverdrup, G.; Riggs, K.; Kelley, T.; Barrett, R.; Peltier, R. Toxic Emissions from a Cyclone Burner Boiler with an ESP and with the SNOX Demonstration and from a Pulverized Coal Burner Boiler with an ESP/Wet Flue Gas Desulfurization System. Gov. Rep. Announc. Indexes 1994, 21, 1–16. [Google Scholar]
- Wheeler, R.; Head, F.; McCawley, M. An Industrial Hygiene Characterization of Exposure to Diesel Emissions in an Underground Coal Mine. Environ. Int. 1981, 5, 485–488. [Google Scholar] [CrossRef]
- James, J.T. Carcinogens in spacecraft air. Radiat. Res. 1997, 148, S11–S16. [Google Scholar] [CrossRef] [PubMed]
- Brown, S.K. Chamber assessment of formaldehyde and VOC emissions from wood-based panels. Indoor Air 1999, 9, 209–215. [Google Scholar] [CrossRef] [PubMed]
- Kelley, T.; Sadola, J.; Smith, D. Emission rates of formaldehyde and other carbonyls from consumer and industrial products found in California homes. Proc. Int. Spec. Conf. Air Waste Manage. Assoc. 1996, 521–526. [Google Scholar]
- Pickrell, J.A.; Mokler, B.V.; Griffis, L.C.; Hobbs, C.H.; Bathija, A. Formaldehyde release rate coefficients from selected consumer products. Environ. Sci. Technol. 1983, 17, 753–757. [Google Scholar] [CrossRef] [PubMed]
- Galli, C.L.; Bettin, F.; Metra, P.; Fidente, P.; De Dominicis, E.; Marinovich, M. Novel analytical method to measure formaldehyde release from heated hair straightening cosmetic products: Impact on risk assessment. Regul. Toxicol. Pharmacol. 2015, 72, 562–568. [Google Scholar] [CrossRef]
- Rickert, W.S.; Robinson, J.C.; Young, J.C. Estimating the hazards of "less hazardous" cigarettes. I. Tar, nicotine, carbon monoxide, acrolein, hydrogen cyanide, and total aldehyde deliveries of Canadian cigarettes. J. Toxicol. Environ. Health 1980, 6, 351–365. [Google Scholar] [CrossRef]
- Mansfield, C.T.; Hodge, B.T.; Hege, R.B.; Hamlin, W.C. Analysis of formaldehyde in tobacco smoke by high performance liquid chromatography. J. Chromatogr. Sci. 1977, 15, 301–302. [Google Scholar] [CrossRef]
- Smith, C.J.; Hansch, C. The relative toxicity of compounds in mainstream cigarette smoke condensate. Food Chem. Toxicol. 2000, 38, 637–646. [Google Scholar] [CrossRef]
- Uchiyama, S.; Inaba, Y.; Kunugita, N. Determination of acrolein and other carbonyls in cigarette smoke using coupled silica cartridges impregnated with hydroquinone and 2,4-dinitrophenylhydrazine. J. Chromatogr. A 2010, 1217, 4383–4388. [Google Scholar] [CrossRef] [PubMed]
- Pang, X.; Lewis, A.C. Carbonyl compounds in gas and particle phases of mainstream cigarette smoke. Sci. Total Environ. 2011, 409, 5000–5009. [Google Scholar] [CrossRef] [PubMed]
- Borgerding, M.F.; Bodnar, J.A.; Chung, H.L.; Mangan, P.P.; Morrison, C.C.; Risner, C.H.; Rogers, J.C.; Simmons, D.F.; Uhrig, M.S.; Wendelboe, F.N.; et al. Chemical and biological studies of a new cigarette that primarily heats tobacco. Part 1. Chemical composition of mainstream smoke. Food Chem. Toxicol. 1998, 36, 169–182. [Google Scholar] [CrossRef]
- Swauger, J.E.; Steichen, T.J.; Murphy, P.A.; Kinsler, S. An analysis of the mainstream smoke chemistry of samples of the U.S. cigarette market acquired between 1995 and 2000. Regul. Toxicol. Pharmacol. 2002, 35, 142–156. [Google Scholar] [CrossRef] [PubMed]
- Hecht, S.S. Tobacco carcinogens, their biomarkers and tobacco-induced cancer. Nat. Rev. Cancer 2003, 3, 733–744. [Google Scholar] [CrossRef]
- Uchiyama, S.; Ohta, K.; Inaba, Y.; Kunugita, N. Determination of carbonyl compounds generated from the e-cigarette using coupled silica cartridges impregnated with hydroquinone and 2,4-dinitrophenylhydrazine, followed by high-performance liquid chromatography. Anal. Sci. 2013, 29, 1219–1222. [Google Scholar] [CrossRef]
- Lee, M.S.; LeBouf, R.F.; Son, Y.S.; Koutrakis, P.; Christiani, D.C. Nicotine, aerosol particles, carbonyls and volatile organic compounds in tobacco- and menthol-flavored e-cigarettes. Environ. Health 2017, 16, 42. [Google Scholar] [CrossRef]
- Hahn, J.; Monakhova, Y.B.; Hengen, J.; Kohl-Himmelseher, M.; Schüssler, J.; Hahn, H.; Kuballa, T.; Lachenmeier, D.W. Electronic cigarettes: Overview of chemical composition and exposure estimation. Tob. Induc. Dis. 2014, 12, 23. [Google Scholar] [CrossRef]
- Ogunwale, M.A.; Chen, Y.; Theis, W.S.; Nantz, M.H.; Conklin, D.J.; Fu, X.A. A novel method of nicotine quantification in electronic cigarette liquids and aerosols. Anal. Methods 2017, 9, 4261–4266. [Google Scholar] [CrossRef]
- Pankow, J.F.; Kim, K.; McWhirter, K.J.; Luo, W.; Escobedo, J.O.; Strongin, R.M.; Duell, A.K.; Peyton, D.H. Benzene formation in electronic cigarettes. PLoS One 2017, 12, e0173055. [Google Scholar] [CrossRef]
- Cheng, T. Chemical evaluation of electronic cigarettes. Tob. Control 2014, 23 (Suppl. 2), 11–17. [Google Scholar] [CrossRef]
- Bekki, K.; Uchiyama, S.; Ohta, K.; Inaba, Y.; Nakagome, H.; Kunugita, N. Carbonyl compounds generated from electronic cigarettes. Int. J. Environ. Res. Public Health 2014, 11, 11192–11200. [Google Scholar] [CrossRef]
- Khlystov, A.; Samburova, V. Flavoring Compounds Dominate Toxic Aldehyde Production during E-Cigarette Vaping. Environ. Sci. Technol. 2016, 50, 13080–13085. [Google Scholar] [CrossRef]
- Samburova, V.; Bhattarai, C.; Strickland, M.; Darrow, L.; Angermann, J.; Son, Y.; Khlystov, A. Aldehydes in exhaled breath during e-cigarette vaping: Pilot study results. Toxics 2018, 6, 46. [Google Scholar] [CrossRef]
- Sleiman, M.; Logue, J.M.; Montesinos, V.N.; Russell, M.L.; Litter, M.I.; Gundel, L.A.; Destaillats, H. Emissions from electronic cigarettes: Key parameters affecting the release of harmful chemicals. Environ. Sci. Technol. 2016, 50, 9644–9651. [Google Scholar] [CrossRef]
- Salamanca, J.C.; Meehan-Atrash, J.; Vreeke, S.; Escobedo, J.O.; Peyton, D.H.; Strongin, R.M. E-cigarettes can emit formaldehyde at high levels under conditions that have been reported to be non-averse to users. Sci. Rep. 2018, 8, 7559. [Google Scholar] [CrossRef]
- Bauer, R.; Cowan, D.A.; Crouch, A. Acrolein in wine: Importance of 3-hydroxypropionaldehyde and derivatives in production and detection. J. Agric. Food Chem. 2010, 58, 3243–3250. [Google Scholar] [CrossRef]
- Osorio, V.M.; Cardeal, Z.L. Analytical methods to assess carbonyl compounds in foods and beverages. J. Braz. Chem. Soc. 2013, 24, 1711–1718. [Google Scholar] [CrossRef]
- Yokoyama, A.; Tsutsumi, E.; Imazeki, H.; Suwa, Y.; Nakamura, C.; Mizukami, T.; Yokoyama, T. Salivary acetaldehyde concentration according to alcoholic beverage consumed and aldehyde dehydrogenase-2 genotype. Alcohol. Clin. Exp. Res. 2008, 32, 1607–1614. [Google Scholar] [CrossRef]
- Li, Y.; Steppi, A.; Zhou, Y.; Mao, F.; Miller, P.C.; He, M.M.; Zhao, T.; Sun, Q.; Zhang, J. Tumoral expression of drug and xenobiotic metabolizing enzymes in breast cancer patients of different ethnicities with implications to personalized medicine. Sci. Rep. 2017, 7, 4747. [Google Scholar] [CrossRef]
- Weng, M.W.; Lee, H.W.; Park, S.H.; Hu, Y.; Wang, H.T.; Chen, L.C.; Rom, W.N.; Huang, W.C.; Lepor, H.; Wu, X.R.; et al. Aldehydes are the predominant forces inducing DNA damage and inhibiting DNA repair in tobacco smoke carcinogenesis. Proc. Natl. Acad. Sci. USA 2018, 115, E6152–E6161. [Google Scholar] [CrossRef]
- Garaycoechea, J.I.; Crossan, G.P.; Langevin, F.; Mulderrig, L.; Louzada, S.; Yang, F.; Guilbaud, G.; Park, N.; Roerink, S.; Nik-Zainal, S.; et al. Alcohol and endogenous aldehydes damage chromosomes and mutate stem cells. Nature 2018, 553, 171–177. [Google Scholar] [CrossRef]
- Trewick, S.C.; Henshaw, T.F.; Hausinger, R.P.; Lindahl, T.; Sedgwick, B. Oxidative demethylation by Escherichia coli Alkb directly reverts DNA base damage. Nature 2002, 419, 174–178. [Google Scholar] [CrossRef]
- Kooistra, S.M.; Helin, K. Molecular mechanisms and potential functions of histone demethylases. Nat. Rev. Mol. Cell Biol. 2012, 13, 297–311. [Google Scholar] [CrossRef]
- Vasiliou, V.; Nebert, D.W. Analysis and update of the human aldehyde dehydrogenase (ALDH) gene family. Hum. Genom. 2005, 2, 138–143. [Google Scholar]
- Finkel, T.; Holbrook, N.J. Oxidants, oxidative stress and the biology of ageing. Nature 2000, 408, 239–247. [Google Scholar] [CrossRef]
- Lin, M.T.; Beal, M.F. Mitochondrial dysfunction and oxidative stress in neurodegenerative diseases. Nature 2006, 443, 787–795. [Google Scholar] [CrossRef]
- Pizzimenti, S.; Ciamporcero, E.; Daga, M.; Pettazzoni, P.; Arcaro, A.; Cetrangolo, G.; Minelli, R.; Dianzani, C.; Lepore, A.; Gentile, F.; et al. Interaction of aldehydes derived from lipid peroxidation and membrane proteins. Front. Physiol. 2013, 4, 242. [Google Scholar] [CrossRef]
- Guéraud, F.; Atalay, M.; Bresgen, N.; Cipak, A.; Eckl, P.M.; Huc, L.; Jouanin, I.; Siems, W.; Uchida, K. Chemistry and biochemistry of lipid peroxidation products. Free Radic. Res. 2010, 44, 1098–1124. [Google Scholar] [CrossRef]
- Poli, G.; Schaur, R.J.; Siems, W.G.; Leonarduzzi, G. 4-hydroxynonenal: A membrane lipid oxidation product of medicinal interest. Med. Res. Rev. 2008, 28, 569–631. [Google Scholar] [CrossRef]
- Dianzani, M.U. 4-hydroxynonenal from pathology to physiology. Mol. Aspects Med. 2003, 24, 263–272. [Google Scholar] [CrossRef]
- Thornalley, P.J. Pharmacology of methylglyoxal: Formation, modification of proteins and nucleic acids, and enzymatic detoxification—A role in pathogenesis and antiproliferative chemotherapy. Gen. Pharmacol. 1996, 27, 565–573. [Google Scholar] [CrossRef]
- Singh, S.; Brocker, C.; Koppaka, V.; Chen, Y.; Jackson, B.C.; Matsumoto, A.; Thompson, D.C.; Vasiliou, V. Aldehyde dehydrogenases in cellular responses to oxidative/electrophilic stress. Free Radic. Biol. Med. 2013, 56, 89–101. [Google Scholar] [CrossRef]
- Pontel, L.B.; Rosado, I.V.; Burgos-Barragan, G.; Garaycoechea, J.I.; Yu, R.; Arends, M.J.; Chandrasekaran, G.; Broecker, V.; Wei, W.; Liu, L.; et al. Endogenous formaldehyde is a hematopoietic stem cell genotoxin and metabolic carcinogen. Mol. Cell 2015, 60, 177–188. [Google Scholar] [CrossRef]
- Baan, R.; Straif, K.; Grosse, Y.; Secretan, B.; El Ghissassi, F.; Bouvard, V.; Altieri, A.; Cogliano, V.; WHO International Agency for Research on Cancer Monograph Working Group. Carcinogenicity of alcoholic beverages. Lancet Oncol. 2007, 8, 292–293. [Google Scholar] [CrossRef]
- Secretan, B.; Straif, K.; Baan, R.; Grosse, Y.; El Ghissassi, F.; Bouvard, V.; Benbrahim-Tallaa, L.; Guha, N.; Freeman, C.; Galichet, L.; et al. A review of human carcinogens—Part e: Tobacco, areca nut, alcohol, coal smoke, and salted fish. Lancet Oncol. 2009, 10, 1033–1034. [Google Scholar] [CrossRef]
- Wilbourn, J.; Heseltine, E.; Møller, H. IARC evaluates wood dust and formaldehyde. International agency for research on cancer. Scand. J. Work Environ. Health 1995, 21, 229–232. [Google Scholar] [CrossRef]
- IARC Working Group on the Evaluation of Carcinogenic Risks to Humans. Formaldehyde, 2-butoxyethanol and 1-tert-butoxypropan-2-ol. IARC Monogr. Eval. Carcinog. Risks Hum. 2006, 88, 1–478. [Google Scholar]
- Wang, M.; McIntee, E.J.; Cheng, G.; Shi, Y.; Villalta, P.W.; Hecht, S.S. Identification of DNA adducts of acetaldehyde. Chem. Res. Toxicol. 2000, 13, 1149–1157. [Google Scholar] [CrossRef]
- Wang, Y.; Millonig, G.; Nair, J.; Patsenker, E.; Stickel, F.; Mueller, S.; Bartsch, H.; Seitz, H.K. Ethanol-induced cytochrome P4502E1 causes carcinogenic etheno-DNA lesions in alcoholic liver disease. Hepatology 2009, 50, 453–461. [Google Scholar] [CrossRef] [PubMed]
- Linhart, K.; Bartsch, H.; Seitz, H.K. The role of reactive oxygen species (ROS) and cytochrome P-450 2E1 in the generation of carcinogenic etheno-DNA adducts. Redox Biol. 2014, 3, 56–62. [Google Scholar] [CrossRef] [PubMed]
- Balbo, S.; Brooks, P.J. Implications of acetaldehyde-derived DNA adducts for understanding alcohol-related carcinogenesis. Adv. Exp. Med. Biol. 2015, 815, 71–88. [Google Scholar] [PubMed]
- Brooks, P.J.; Theruvathu, J.A. DNA adducts from acetaldehyde: Implications for alcohol-related carcinogenesis. Alcohol 2005, 35, 187–193. [Google Scholar] [CrossRef] [PubMed]
- Tan, S.L.W.; Chadha, S.; Liu, Y.; Gabasova, E.; Perera, D.; Ahmed, K.; Constantinou, S.; Renaudin, X.; Lee, M.; Aebersold, R.; et al. A class of environmental and endogenous toxins induces BRCA2 haploinsufficiency and genome instability. Cell 2017, 169, 1105–1118. [Google Scholar] [CrossRef] [PubMed]
- Hoffman, E.A.; Frey, B.L.; Smith, L.M.; Auble, D.T. Formaldehyde crosslinking: A tool for the study of chromatin complexes. J. Biol. Chem. 2015, 290, 26404–26411. [Google Scholar] [CrossRef] [PubMed]
- Maynard, S.; Fang, E.F.; Scheibye-Knudsen, M.; Croteau, D.L.; Bohr, V.A. DNA damage, DNA repair, aging, and neurodegeneration. Cold Spring Harb. Perspect. Med. 2015, 5, a025130. [Google Scholar] [CrossRef] [PubMed]
- Yang, M.Y.; Wang, Y.B.; Han, B.; Yang, B.; Qiang, Y.W.; Zhang, Y.; Wang, Z.; Huang, X.; Liu, J.; Chen, Y.D.; et al. Activation of aldehyde dehydrogenase 2 slows down the progression of atherosclerosis via attenuation of ER stress and apoptosis in smooth muscle cells. Acta Pharmacol. Sin. 2018, 39, 48–58. [Google Scholar] [CrossRef] [PubMed]
- Uchida, K. Role of reactive aldehyde in cardiovascular diseases. Free Radic. Biol. Med. 2000, 28, 1685–1696. [Google Scholar] [CrossRef]
- Barrera, G.; Pizzimenti, S.; Daga, M.; Dianzani, C.; Arcaro, A.; Cetrangolo, G.P.; Giordano, G.; Cucci, M.A.; Graf, M.; Gentile, F. Lipid peroxidation-derived aldehydes, 4-hydroxynonenal and malondialdehyde in aging-related disorders. Antioxidants (Basel) 2018, 7, 102. [Google Scholar] [CrossRef]
- Jaganjac, M.; Tirosh, O.; Cohen, G.; Sasson, S.; Zarkovic, N. Reactive aldehydes—Second messengers of free radicals in diabetes mellitus. Free Radic. Res. 2013, 47 (Suppl. 1), 39–48. [Google Scholar] [CrossRef] [PubMed]
- Hill, B.G.; Bhatnagar, A. Beyond reactive oxygen species: Aldehydes as arbitrators of alarm and adaptation. Circ. Res. 2009, 105, 1044–1046. [Google Scholar] [CrossRef] [PubMed]
- Matveychuk, D.; Dursun, S.M.; Wood, P.L.; Baker, G.B. Reactive aldehydes and neurodegenerative disorders. Klin. Psikofarmakol. Bülteni Bull. Clin. Psychopharmacol. 2011, 21, 277–288. [Google Scholar] [CrossRef]
- Negre-Salvayre, A.; Coatrieux, C.; Ingueneau, C.; Salvayre, R. Advanced lipid peroxidation end products in oxidative damage to proteins. Potential role in diseases and therapeutic prospects for the inhibitors. Br. J. Pharmacol. 2008, 153, 6–20. [Google Scholar] [CrossRef] [PubMed]
- Burke, W.J.; Li, S.W.; Chung, H.D.; Ruggiero, D.A.; Kristal, B.S.; Johnson, E.M.; Lampe, P.; Kumar, V.B.; Franko, M.; Williams, E.A.; et al. Neurotoxicity of MAO metabolites of catecholamine neurotransmitters: Role in neurodegenerative diseases. Neurotoxicology 2004, 25, 101–115. [Google Scholar] [CrossRef]
- Burke, W.J.; Kumar, V.B.; Pandey, N.; Panneton, W.M.; Gan, Q.; Franko, M.W.; O’Dell, M.; Li, S.W.; Pan, Y.; Chung, H.D.; et al. Aggregation of alpha-synuclein by DOPAL, the monoamine oxidase metabolite of dopamine. Acta Neuropathol. 2008, 115, 193–203. [Google Scholar] [CrossRef] [PubMed]
- Panneton, W.M.; Kumar, V.B.; Gan, Q.; Burke, W.J.; Galvin, J.E. The neurotoxicity of DOPAL: Behavioral and stereological evidence for its role in Parkinson disease pathogenesis. PLoS ONE 2010, 5, e15251. [Google Scholar] [CrossRef] [PubMed]
- Chaplen, F.W.; Fahl, W.E.; Cameron, D.C. Evidence of high levels of methylglyoxal in cultured Chinese hamster ovary cells. Proc. Natl. Acad. Sci. USA 1998, 95, 5533–5538. [Google Scholar] [CrossRef] [PubMed]
- Niki, E. Lipid peroxidation: Physiological levels and dual biological effects. Free Radic. Biol. Med. 2009, 47, 469–484. [Google Scholar] [CrossRef]
- Beisswenger, P.J.; Howell, S.K.; Touchette, A.D.; Lal, S.; Szwergold, B.S. Metformin reduces systemic methylglyoxal levels in type 2 diabetes. Diabetes 1999, 48, 198–202. [Google Scholar] [CrossRef]
- Strzinek, R.A.; Scholes, V.E.; Norton, S.J. The purification and characterization of liver glyoxalase I from normal mice and from mice bearing a lymphosarcoma. Cancer Res. 1972, 32, 2359–2364. [Google Scholar] [PubMed]
- Dobler, D.; Ahmed, N.; Song, L.; Eboigbodin, K.E.; Thornalley, P.J. Increased dicarbonyl metabolism in endothelial cells in hyperglycemia induces anoikis and impairs angiogenesis by RGD and GFOGER motif modification. Diabetes 2006, 55, 1961–1969. [Google Scholar] [CrossRef] [PubMed]
- Bhutia, Y.; Ghosh, A.; Sherpa, M.L.; Pal, R.; Mohanta, P.K. Serum malondialdehyde level: Surrogate stress marker in the Sikkimese diabetics. J. Nat. Sci. Biol. Med. 2011, 2, 107–112. [Google Scholar] [PubMed]
- Moghe, A.; Ghare, S.; Lamoreau, B.; Mohammad, M.; Barve, S.; McClain, C.; Joshi-Barve, S. Molecular mechanisms of acrolein toxicity: Relevance to human disease. Toxicol. Sci. 2015, 143, 242–255. [Google Scholar] [CrossRef] [PubMed]
- Zarkovic, K. 4-hydroxynonenal and neurodegenerative diseases. Mol. Asp. Med. 2003, 24, 293–303. [Google Scholar] [CrossRef]
- Markesbery, W.R.; Lovell, M.A. Four-hydroxynonenal, a product of lipid peroxidation, is increased in the brain in Alzheimer’s disease. Neurobiol. Aging 1998, 19, 33–36. [Google Scholar] [CrossRef]
- Lovell, M.A.; Ehmann, W.D.; Mattson, M.P.; Markesbery, W.R. Elevated 4-hydroxynonenal in ventricular fluid in Alzheimer’s disease. Neurobiol. Aging 1997, 18, 457–461. [Google Scholar] [CrossRef]
- Lovell, M.A.; Xie, C.; Markesbery, W.R. Acrolein is increased in Alzheimer’s disease brain and is toxic to primary hippocampal cultures. Neurobiol. Aging 2001, 22, 187–194. [Google Scholar] [CrossRef]
- Nagaraj, R.H.; Shipanova, I.N.; Faust, F.M. Protein cross-linking by the Maillard reaction. Isolation, characterization, and in vivo detection of a lysine-lysine cross-link derived from methylglyoxal. J. Biol. Chem. 1996, 271, 19338–19345. [Google Scholar] [CrossRef] [PubMed]
- Boveris, A.; Chance, B. The mitochondrial generation of hydrogen peroxide. General properties and effect of hyperbaric oxygen. Biochem. J. 1973, 134, 707–716. [Google Scholar] [CrossRef] [PubMed]
- Solivio, M.J. Investigation of DNA-Protein Cross-Links Generated in Biologically Relevant Oxidant Systems. Ph.D. Thesis, University of Cincinnati, Cincinnati, OH, USA, 2013. [Google Scholar]
- Siems, W.; Grune, T. Intracellular metabolism of 4-hydroxynonenal. Mol. Asp. Med. 2003, 24, 167–175. [Google Scholar] [CrossRef]
- Zhao, Y.; Miriyala, S.; Miao, L.; Mitov, M.; Schnell, D.; Dhar, S.K.; Cai, J.; Klein, J.B.; Sultana, R.; Butterfield, D.A.; et al. Redox proteomic identification of HNE-bound mitochondrial proteins in cardiac tissues reveals a systemic effect on energy metabolism after doxorubicin treatment. Free Radic. Biol. Med. 2014, 72, 55–65. [Google Scholar] [CrossRef] [PubMed]
- Nathan, C.; Cunningham-Bussel, A. Beyond oxidative stress: An immunologist’s guide to reactive oxygen species. Nat. Rev. Immunol. 2013, 13, 349–361. [Google Scholar] [CrossRef] [PubMed]
- Weissman, L.; de Souza-Pinto, N.C.; Stevnsner, T.; Bohr, V.A. DNA repair, mitochondria, and neurodegeneration. Neuroscience 2007, 145, 1318–1329. [Google Scholar] [CrossRef] [PubMed]
- Lazurko, C.; Radonjic, I.; Suchý, M.; Liu, G.; Rolland-Lagan, A.G.; Shuhendler, A. Fingerprinting biogenic aldehydes through pattern recognition analyses of excitation-emission matrices. Chembiochem 2019, 20, 543–554. [Google Scholar] [CrossRef]
- Gomes, K.M.; Bechara, L.R.; Lima, V.M.; Ribeiro, M.A.; Campos, J.C.; Dourado, P.M.; Kowaltowski, A.J.; Mochly-Rosen, D.; Ferreira, J.C. Aldehydic load and aldehyde dehydrogenase 2 profile during the progression of post-myocardial infarction cardiomyopathy: Benefits of Alda-1. Int. J. Cardiol. 2015, 179, 129–138. [Google Scholar] [CrossRef]
- Zambelli, V.O.; Gross, E.R.; Chen, C.H.; Gutierrez, V.P.; Cury, Y.; Mochly-Rosen, D. Aldehyde dehydrogenase-2 regulates nociception in rodent models of acute inflammatory pain. Sci. Transl. Med. 2014, 6, 251ra118. [Google Scholar] [CrossRef]
- Grune, T.; Siems, W.; Kowalewski, J.; Zollner, H.; Esterbauer, H. Identification of metabolic pathways of the lipid peroxidation product 4-hydroxynonenal by enterocytes of rat small intestine. Biochem. Int. 1991, 25, 963–971. [Google Scholar]
- Grune, T.; Siems, W.G.; Zollner, H.; Esterbauer, H. Metabolism of 4-hydroxynonenal, a cytotoxic lipid peroxidation product, in Ehrlich mouse ascites cells at different proliferation stages. Cancer Res. 1994, 54, 5231–5235. [Google Scholar]
- Siems, W.G.; Zollner, H.; Grune, T.; Esterbauer, H. Metabolic fate of 4-hydroxynonenal in hepatocytes: 1,4-dihydroxynonene is not the main product. J. Lipid. Res. 1997, 38, 612–622. [Google Scholar]
- Hartley, D.P.; Ruth, J.A.; Petersen, D.R. The hepatocellular metabolism of 4-hydroxynonenal by alcohol dehydrogenase, aldehyde dehydrogenase, and glutathione S-transferase. Arch. Biochem. Biophys. 1995, 316, 197–205. [Google Scholar] [CrossRef]
- Wang, J.; Wang, H.; Hao, P.; Xue, L.; Wei, S.; Zhang, Y.; Chen, Y. Inhibition of aldehyde dehydrogenase 2 by oxidative stress is associated with cardiac dysfunction in diabetic rats. Mol. Med. 2011, 17, 172–179. [Google Scholar] [CrossRef]
- Teng, S.; Beard, K.; Pourahmad, J.; Moridani, M.; Easson, E.; Poon, R.; O’Brien, P.J. The formaldehyde metabolic detoxification enzyme systems and molecular cytotoxic mechanism in isolated rat hepatocytes. Chem. Biol. Interact. 2001, 130–132, 285–296. [Google Scholar] [CrossRef]
- Walport, L.J.; Hopkinson, R.J.; Schofield, C.J. Mechanisms of human histone and nucleic acid demethylases. Curr. Opin. Chem. Biol. 2012, 16, 525–534. [Google Scholar] [CrossRef]
- Heck, H.D.; Casanova-Schmitz, M.; Dodd, P.B.; Schachter, E.N.; Witek, T.J.; Tosun, T. Formaldehyde (CH2O) concentrations in the blood of humans and Fischer-344 rats exposed to CH2O under controlled conditions. Am. Ind. Hyg. Assoc. J. 1985, 46, 1–3. [Google Scholar] [CrossRef]
- Luo, W.; Li, H.; Zhang, Y.; Ang, C.Y. Determination of formaldehyde in blood plasma by high-performance liquid chromatography with fluorescence detection. J. Chromatogr. B Biomed. Sci. Appl. 2001, 753, 253–257. [Google Scholar] [CrossRef]
- Nagy, K.; Pollreisz, F.; Takáts, Z.; Vékey, K. Atmospheric pressure chemical ionization mass spectrometry of aldehydes in biological matrices. Rapid Commun. Mass Spectrom. 2004, 18, 2473–2478. [Google Scholar] [CrossRef]
- Tong, Z.; Han, C.; Luo, W.; Wang, X.; Li, H.; Luo, H.; Zhou, J.; Qi, J.; He, R. Accumulated hippocampal formaldehyde induces age-dependent memory decline. AGE (Dordr) 2013, 35, 583–596. [Google Scholar] [CrossRef]
- Bae, S.; Chon, J.; Field, M.S.; Stover, P.J. Alcohol Dehydrogenase 5 Is a Source of Formate for De Novo Purine Biosynthesis in HepG2 Cells. J. Nutr. 2017, 147, 499–505. [Google Scholar] [CrossRef]
- Burgos-Barragan, G.; Wit, N.; Meiser, J.; Dingler, F.A.; Pietzke, M.; Mulderrig, L.; Pontel, L.B.; Rosado, I.V.; Brewer, T.F.; Cordell, R.L.; et al. Mammals divert endogenous genotoxic formaldehyde into one-carbon metabolism. Nature 2017, 548, 549–554. [Google Scholar] [CrossRef]
- Ducker, G.S.; Rabinowitz, J.D. One-carbon metabolism in health and disease. Cell Metab. 2017, 25, 27–42. [Google Scholar] [CrossRef] [PubMed]
- MacAllister, S.L.; Choi, J.; Dedina, L.; O’Brien, P.J. Metabolic mechanisms of methanol/formaldehyde in isolated rat hepatocytes: Carbonyl-metabolizing enzymes versus oxidative stress. Chem. Biol. Interact. 2011, 191, 308–314. [Google Scholar] [CrossRef] [PubMed]
- Friedenson, B. A common environmental carcinogen unduly affects carriers of cancer mutations: Carriers of genetic mutations in a specific protective response are more susceptible to an environmental carcinogen. Med. Hypotheses 2011, 77, 791–797. [Google Scholar] [CrossRef] [PubMed]
- Lee, S.L.; Wang, M.F.; Lee, A.I.; Yin, S.J. The metabolic role of human ADH3 functioning as ethanol dehydrogenase. FEBS Lett. 2003, 544, 143–147. [Google Scholar] [CrossRef]
- Duester, G.; Farrés, J.; Felder, M.R.; Holmes, R.S.; Höög, J.O.; Parés, X.; Plapp, B.V.; Yin, S.J.; Jörnvall, H. Recommended nomenclature for the vertebrate alcohol dehydrogenase gene family. Biochem. Pharmacol. 1999, 58, 389–395. [Google Scholar] [CrossRef]
- Vasiliou, V.; Pappa, A. Polymorphisms of human aldehyde dehydrogenases. Consequences for drug metabolism and disease. Pharmacology 2000, 61, 192–198. [Google Scholar] [CrossRef]
- Wermuth, B.; Platts, K.L.; Seidel, A.; Oesch, F. Carbonyl reductase provides the enzymatic basis of quinone detoxication in man. Biochem. Pharmacol. 1986, 35, 1277–1282. [Google Scholar] [CrossRef]
- Richardson, S.D.; Caughran, T.V.; Poiger, T.; Guo, Y.B.; Crumley, F.G. Application of DNPH derivatization with LC/MS to the identification of polar carbonyl disinfection by-products in drinking water. Ozone Sci. Eng. 2000, 22, 653–675. [Google Scholar] [CrossRef]
- NIOSH. Aldehydes, screening: Method 2539. In Manual of Analytical Methods (NMAM), 4th ed.; NIOSH: Washington, DC, USA, 1994. [Google Scholar]
- ASTM. Standard Test Method for Determination of Formaldehyde and Other Carbonyl Compounds in Air (Active Sampler Methodology); ASTM International: West Conshohocken, PA, USA, 2009. [Google Scholar]
- US Environmental Protection Agency. Compendium Method to-11A: Determination of Formaldehye in Ambient Air Using Adsorbent Cartridge Followed by High Performance Liquid Chromatorgraphy (HPLC); EPA: Washington, DC, USA, 1999.
- US Environmental Protection Agency. National Air Toxics Trends Station Work Plan Template; EPA: Washington, DC, USA, 2011.
- Santa, T. Derivatization reagents in liquid chromatography/electrospray ionization tandem mass spectrometry. Biomed. Chromatogr. 2011, 25, 1–10. [Google Scholar] [CrossRef]
- Santa, T.; Al-Dirbashi, O.Y.; Ichibangase, T.; Rashed, M.S.; Fukushima, T.; Imai, K. Synthesis of 4-[2-(N,N-dimethylamino)ethylaminosulfonyl]-7-N-methylhydrazino-2,1,3-benzoxadiazole (DAABD-MHz) as a derivatization reagent for aldehydes in liquid chromatography/electrospray ionization-tandem mass spectrometry. Biomed. Chromatogr. 2008, 22, 115–118. [Google Scholar] [CrossRef]
- Johnson, D.W. A modified Girard derivatizing reagent for universal profiling and trace analysis of aldehydes and ketones by electrospray ionization tandem mass spectrometry. Rapid Commun. Mass Spectrom. 2007, 21, 2926–2932. [Google Scholar] [CrossRef]
- Barry, S.J.; Carr, R.M.; Lane, S.J.; Leavens, W.J.; Manning, C.O.; Monté, S.; Waterhouse, I. Use of S-pentafluorophenyl tris(2,4,6-trimethoxyphenyl)phosphonium acetate bromide and (4-hydrazino-4-oxobutyl) [tris(2,4,6-trimethoxyphenyl)phosphonium bromide for the derivatization of alcohols, aldehydes and ketones for detection by liquid chromatography/electrospray mass spectrometry. Rapid Commun. Mass Spectrom. 2003, 17, 484–497. [Google Scholar]
- Yagi, K. A simple fluorometric assay for lipoperoxide in blood plasma. Biochem. Med. 1976, 15, 212–216. [Google Scholar] [CrossRef]
- Armstrong, D.; Browne, R. The analysis of free radicals, lipid peroxides, antioxidant enzymes and compounds related to oxidative stress as applied to the clinical chemistry laboratory. Adv. Exp. Med. Biol. 1994, 366, 43–58. [Google Scholar]
- Del Rio, D.; Pellegrini, N.; Colombi, B.; Bianchi, M.; Serafini, M.; Torta, F.; Tegoni, M.; Musci, M.; Brighenti, F. Rapid fluorimetric method to detect total plasma malondialdehyde with mild derivatization conditions. Clin. Chem. 2003, 49, 690–692. [Google Scholar] [CrossRef]
- Ramdzan, A.N.; Almeida, M.I.G.S.; McCullough, M.J.; Kolev, S.D. Development of a microfluidic paper-based analytical device for the determination of salivary aldehydes. Anal. Chim. Acta 2016, 919, 47–54. [Google Scholar] [CrossRef]
- Zhang, J.; Zhang, H.; Li, M.; Zhang, D.; Chu, Q.; Ye, J. A novel capillary electrophoretic method for determining methylglyoxal and glyoxal in urine and water samples. J. Chromatogr. A 2010, 1217, 5124–5129. [Google Scholar] [CrossRef]
- Zweiner, C.; Glauner, T.; Frimmel, F.H. Method optimization for the determination of carbonyl compounds in disinfected water by DNPH derivatization and LC-ESI-MS-MS. Anal. Bioanal. Chem. 2002, 372, 615–621. [Google Scholar] [CrossRef]
- Chi, Y.G.; Feng, Y.L.; Wen, S.; Lu, H.X.; Yu, Z.Q.; Zhang, W.B.; Sheng, G.Y.; Fu, J.M. Determination of carbonyl compounds in the atmosphere by DNPH derivatization and LC-ESI-MS/MS detection. Talanta 2007, 72, 539–545. [Google Scholar] [CrossRef]
- Grosjean, E.; Green, P.G.; Grosjean, D. Liquid chromatography analysis of carbonyl (2,4-dinitrophenyl)hydrazones with detection by diode array ultraviolet spectroscopy and by atmospheric pressure negative chemical ionization mass spectrometry. Anal. Chem. 1999, 71, 1851–1861. [Google Scholar] [CrossRef]
- Van Leeuwen, S.M.; Hendriksen, L.; Karst, U. Determination of aldehydes and ketones using derivatization with 2,4-dinitrophenylhydrazine and liquid chromatography-atmospheric pressure photoionization-mass spectrometry. J. Chromatogr. A 2004, 1058, 107–112. [Google Scholar] [CrossRef]
- Ochs, S.D.M.; Fasciotti, M.; Netto, A.D.P. Analysis of 31 hydrazones of carbonyl compounds by RRLC-UV and RRLC-MS(/MS): A comparison of methods. J. Spectrosc. 2015, 2015, 1–11. [Google Scholar] [CrossRef]
- Wang, Y.; Cui, P. Reactive carbonyl species derived from omega-3 and omega-6 fatty acids. J. Agric. Food Chem. 2015, 63, 6293–6296. [Google Scholar] [CrossRef]
- Zhu, H.; Li, X.; Shoemaker, C.F.; Wang, S.C. Ultrahigh performance liquid chromatography analysis of volatile carbonyl compounds in virgin olive oils. J. Agric. Food Chem. 2013, 61, 12253–12259. [Google Scholar] [CrossRef]
- Faizan, M.; Esatbeyoglu, T.; Bayram, B.; Rimbach, G. A fast and validated method for the determination of malondialdehyde in fish liver using high-performance liquid chromatography with a photodiode array detector. J. Food Sci. 2014, 79, C484–C488. [Google Scholar] [CrossRef]
- De Lima, L.F.; Brandão, P.F.; Donegatti, T.A.; Ramos, R.M.; Gonçalves, L.M.; Cardoso, A.A.; Pereira, E.A.; Rodrigues, J.A. 4-hydrazinobenzoic acid as a derivatizing agent for aldehyde analysis by HPLC-UV and CE-DAD. Talanta 2018, 187, 113–119. [Google Scholar] [CrossRef]
- Wu, J.Y.; Shi, Z.G.; Feng, Y.Q. Determination of 5-hydroxymethylfurfural using derivatization combined with polymer monolith microextraction by high-performance liquid chromatography. J. Agric. Food Chem. 2009, 57, 3981–3988. [Google Scholar] [CrossRef]
- Banos, C.E.; Silva, M. Liquid chromatography-tandem mass spectrometry for the determination of low-molecular mass aldehydes in human urine. J. Chromatogr. B Anal. Technol. Biomed. Life Sci. 2010, 878, 653–658. [Google Scholar] [CrossRef]
- Miller, J.H.; Gardner, W.P.; Gonzalez, R.R. UHPLC separation with MS analysis for eight carbonyl compounds in mainstream tobacco smoke. J. Chromatogr. Sci. 2010, 48, 12–17. [Google Scholar] [CrossRef]
- Oenning, A.L.; Morés, L.; Dias, A.N.; Carasek, E. A new configuration for bar adsorptive microextraction (BAμE) for the quantification of biomarkers (hexanal and heptanal) in human urine by HPLC providing an alternative for early lung cancer diagnosis. Anal. Chim. Acta 2017, 965, 54–62. [Google Scholar] [CrossRef]
- Lili, L.; Xu, H.; Song, D.; Cui, Y.; Hu, S.; Zhang, G. Analysis of volatile aldehyde biomarkers in human blood by derivatization and dispersive liquid-liquid microextraction based on solidification of floating organic droplet method by high performance liquid chromatography. J. Chromatogr. A 2010, 1217, 2365–2370. [Google Scholar] [CrossRef]
- Liu, J.F.; Yuan, B.F.; Feng, Y.Q. Determination of hexanal and heptanal in human urine using magnetic solid phase extraction coupled with in-situ derivatization by high performance liquid chromatography. Talanta 2015, 136, 54–59. [Google Scholar] [CrossRef]
- Xu, H.; Lv, L.; Hu, S.; Song, D. High-performance liquid chromatographic determination of hexanal and heptanal in human blood by ultrasound-assisted headspace liquid-phase microextraction with in-drop derivatization. J. Chromatogr. A 2010, 1217, 2371–2375. [Google Scholar] [CrossRef]
- Xu, H.; Wang, S.; Zhang, G.; Huang, S.; Song, D.; Zhou, Y.; Long, G. A novel solid-phase microextraction method based on polymer monolith frit combining with high-performance liquid chromatography for determination of aldehydes in biological samples. Anal. Chim. Acta 2011, 690, 86–93. [Google Scholar] [CrossRef]
- Zhang, H.J.; Huang, J.F.; Lin, B.; Feng, Y.Q. Polymer monolith microextraction with in situ derivatization and its application to high-performance liquid chromatography determination of hexanal and heptanal in plasma. J. Chromatogr. A 2007, 1160, 114–119. [Google Scholar] [CrossRef]
- Yilmaz, B.; Asci, A.; Kucukoglu, K.; Albayrak, M. Simple high-performance liquid chromatography method for formaldehyde determination in human tissue through derivatization with 2,4-dinitrophenylhydrazine. J. Sep. Sci. 2016, 39, 2963–2969. [Google Scholar] [CrossRef]
- Guan, X.Y.; Rubin, E.; Anni, H. An optimized method for the measurement of acetaldehyde by high-performance liquid chromatography. Alcohol. Clin. Exp. Res. 2012, 36, 398–405. [Google Scholar] [CrossRef]
- Uchiyama, S.; Inaba, Y.; Matsumoto, M.; Suzuki, G. Reductive amination of aldehyde 2,4-dinitorophenylhydrazones using 2-picoline borane and high-performance liquid chromatographic analysis. Anal. Chem. 2009, 81, 485–489. [Google Scholar] [CrossRef]
- Di Padova, C.; Alderman, J.; Lieber, C.S. Improved methods for the measurement of acetaldehyde concentrations in plasma and red blood cells. Alcohol. Clin. Exp. Res. 1986, 10, 86–89. [Google Scholar] [CrossRef]
- Nielsen, F.; Mikkelsen, B.B.; Nielsen, J.B.; Andersen, H.R.; Grandjean, P. Plasma malondialdehyde as biomarker for oxidative stress: Reference interval and effects of life-style factors. Clin. Chem. 1997, 43, 1209–1214. [Google Scholar]
- Grotto, D.; Santa Maria, L.D.; Boeira, S.; Valentini, J.; Charão, M.F.; Moro, A.M.; Nascimento, P.C.; Pomblum, V.J.; Garcia, S.C. Rapid quantification of malondialdehyde in plasma by high performance liquid chromatography-visible detection. J. Pharm. Biomed. Anal. 2007, 43, 619–624. [Google Scholar] [CrossRef]
- Steghens, J.P.; van Kappel, A.L.; Denis, I.; Collombel, C. Diaminonaphtalene, a new highly specific reagent for HPLC-UV measurement of total and free malondialdehyde in human plasma or serum. Free Radic. Biol. Med. 2001, 31, 242–249. [Google Scholar] [CrossRef]
- Xiong, X.J.; Wang, H.; Rao, W.B.; Guo, X.F.; Zhang, H.S. 1,3,5,7-Tetramethyl-8-aminozide-difluoroboradiaza-s-indacene as a new fluorescent labeling reagent for the determination of aliphatic aldehydes in serum with high performance liquid chromatography. J. Chromatogr. A 2010, 1217, 49–56. [Google Scholar] [CrossRef]
- Fathy Bakr Ali, M.; Kishikawa, N.; Ohyama, K.; Abdel-Mageed Mohamed, H.; Mohamed Abdel-Wadood, H.; Mohamed Mohamed, A.; Kuroda, N. Chromatographic determination of aliphatic aldehydes in human serum after pre-column derivatization using 2,2′-furil, a novel fluorogenic reagent. J. Chromatogr. A 2013, 1300, 199–203. [Google Scholar] [CrossRef]
- Imazato, T.; Shiokawa, A.; Kurose, Y.; Katou, Y.; Kishikawa, N.; Ohyama, K.; Ali, M.F.; Ueki, Y.; Maehata, E.; Kuroda, N. Determination of 4-hydroxy-2-nonenal in serum by high-performance liquid chromatography with fluorescence detection after pre-column derivatization using 4-(N,N-dimethylaminosulfonyl)-7-hydrazino-2,1,3-benzoxadiazole. Biomed. Chromatogr. 2014, 28, 891–894. [Google Scholar] [CrossRef]
- Li, P.; Ding, G.; Deng, Y.; Punyapitak, D.; Li, D.; Cao, Y. Determination of malondialdehyde in biological fluids by high-performance liquid chromatography using rhodamine B hydrazide as the derivatization reagent. Free Radic. Biol. Med. 2013, 65, 224–231. [Google Scholar] [CrossRef]
- Giera, M.; Kloos, D.P.; Raaphorst, A.; Mayboroda, O.A.; Deelder, A.M.; Lingeman, H.; Niessen, W.M. Mild and selective labeling of malondialdehyde with 2-aminoacridone: Assessment of urinary malondialdehyde levels. Analyst 2011, 136, 2763–2769. [Google Scholar] [CrossRef]
- Mao, J.; Zhang, H.; Luo, J.; Li, L.; Zhao, R.; Zhang, R.; Liu, G. New method for HPLC separation and fluorescence detection of malonaldehyde in normal human plasma. J. Chromatogr. B Anal. Technol. Biomed. Life Sci. 2006, 832, 103–108. [Google Scholar] [CrossRef]
- Seljeskog, E.; Hervig, T.; Mansoor, M.A. A novel HPLC method for the measurement of thiobarbituric acid reactive substances (TBARS). A comparison with a commercially available kit. Clin. Biochem. 2006, 39, 947–954. [Google Scholar] [CrossRef]
- Ojeda, A.G.; Wrobel, K.; Escobosa, A.R.; Garay-Sevilla, M.E. High-performance liquid chromatography determination of glyoxal, methylglyoxal, and diacetyl in urine using 4-methoxy-o-phenylenediamine as derivatizing reagent. Anal. Biochem. 2014, 449, 52–58. [Google Scholar] [CrossRef]
- Akira, K.; Matsumoto, Y.; Hashimoto, T. Determination of urinary glyoxal and methylglyoxal by high-performance liquid chromatography. Clin. Chem. Lab. Med. 2004, 42, 147–153. [Google Scholar] [CrossRef]
- Paci, A.; Rieutord, A.; Guillaume, D.; Traoré, F.; Ropenga, J.; Husson, H.P.; Brion, F. Quantitative high-performance liquid chromatographic determination of acrolein in plasma after derivatization with Luminarin 3. J. Chromatogr. B Biomed. Sci. Appl. 2000, 739, 239–246. [Google Scholar] [CrossRef]
- Al-Rawithi, S.; el-Yazigi, A.; Nicholls, P.J. Determination of acrolein in urine by liquid chromatography and fluorescence detection of its quinoline derivative. Pharm. Res. 1993, 10, 1587–1590. [Google Scholar] [CrossRef]
- Roth, A.; Li, H.; Anorma, C.; Chan, J. A reaction-based fluorescent probe for imaging of formaldehyde in living cells. J. Am. Chem. Soc. 2015, 137, 10890–10893. [Google Scholar] [CrossRef]
- Brewer, T.F.; Chang, C.J. An aza-cope reactivity-based fluorescent probe for imaging formaldehyde in living cells. J. Am. Chem. Soc. 2015, 137, 10886–10889. [Google Scholar] [CrossRef]
- Yuen, L.H.; Saxena, N.S.; Park, H.S.; Weinberg, K.; Kool, E.T. Dark hydrazone fluorescence labeling agents enable imaging of cellular aldehydic load. ACS Chem. Biol. 2016, 11, 2312–2319. [Google Scholar] [CrossRef]
- Vogel, M.; Buldt, A.; Karst, U. Hydrazine reagents as derivatizing agents in environmental analysis—A critical review. Fresenius J. Anal. Chem. 2000, 366, 781–791. [Google Scholar] [CrossRef]
- Chou, C.-C.; Que Hee, S.S. Saliva-available carbonyl compounds in some chewing tobaccos. J. Agric. Food Chem. 1994, 42, 2225–2230. [Google Scholar] [CrossRef]
- Lapolla, A.; Flamini, R.; Dalla Vedova, A.; Senesi, A.; Reitano, R.; Fedele, D.; Basso, E.; Seraglia, R.; Traldi, P. Glyoxal and methylglyoxal levels in diabetic patients: Quantitative determination by a new GC/MS method. Clin. Chem. Lab. Med. 2003, 41, 1166–1173. [Google Scholar] [CrossRef]
- Takeuchi, A.; Takigawa, T.; Abe, M.; Kawai, T.; Endo, Y.; Yasugi, T.; Endo, G.; Ogino, K. Determination of formaldehyde in urine by headspace gas chromatography. Bull. Environ. Contam. Toxicol. 2007, 79, 1–4. [Google Scholar] [CrossRef]
- Tsikas, D.; Rothmann, S.; Schneider, J.Y.; Gutzki, F.M.; Beckmann, B.; Frölich, J.C. Simultaneous GC-MS/MS measurement of malondialdehyde and 4-hydroxy-2-nonenal in human plasma: Effects of long-term L-arginine administration. Anal. Biochem. 2017, 524, 31–44. [Google Scholar] [CrossRef] [PubMed]
- Deng, C.; Li, N.; Zhang, X. Development of headspace solid-phase microextraction with on-fiber derivatization for determination of hexanal and heptanal in human blood. J. Chromatogr. B Anal. Technol. Biomed. Life Sci. 2004, 813, 47–52. [Google Scholar] [CrossRef] [PubMed]
- Deng, C.; Zhang, X. A simple, rapid and sensitive method for determination of aldehydes in human blood by gas chromatography/mass spectrometry and solid-phase microextraction with on-fiber derivatization. Rapid Commun. Mass Spectrom. 2004, 18, 1715–1720. [Google Scholar] [CrossRef] [PubMed]
- Fuchs, P.; Loeseken, C.; Schubert, J.K.; Miekisch, W. Breath gas aldehydes as biomarkers of lung cancer. Int. J. Cancer 2010, 126, 2663–2670. [Google Scholar] [CrossRef] [PubMed]
- Svensson, S.; Lärstad, M.; Broo, K.; Olin, A.C. Determination of aldehydes in human breath by on-fibre derivatization, solid-phase microextraction and GC-MS. J. Chromatogr. B Anal. Technol. Biomed. Life Sci. 2007, 860, 86–91. [Google Scholar] [CrossRef] [PubMed]
- Calejo, I.; Moreira, N.; Araújo, A.M.; Carvalho, M.; Bastos, M.e.L.; de Pinho, P.G. Optimisation and validation of a HS-SPME-GC-IT/MS method for analysis of carbonyl volatile compounds as biomarkers in human urine: Application in a pilot study to discriminate individuals with smoking habits. Talanta 2016, 148, 486–493. [Google Scholar] [CrossRef] [PubMed]
- Poli, D.; Goldoni, M.; Corradi, M.; Acampa, O.; Carbognani, P.; Internullo, E.; Casalini, A.; Mutti, A. Determination of aldehydes in exhaled breath of patients with lung cancer by means of on-fiber-derivatisation SPME-GC/MS. J. Chromatogr. B Anal. Technol. Biomed. Life Sci. 2010, 878, 2643–2651. [Google Scholar] [CrossRef] [PubMed]
- Shin, H.S. Determination of malondialdehyde in human blood by headspace-solid phase micro-extraction gas chromatography-mass spectrometry after derivatization with 2,2,2-trifluoroethylhydrazine. J. Chromatogr. B Anal. Technol. Biomed. Life Sci. 2009, 877, 3707–3711. [Google Scholar] [CrossRef] [PubMed]
- Li, N.; Deng, C.; Yin, X.; Yao, N.; Shen, X.; Zhang, X. Gas chromatography-mass spectrometric analysis of hexanal and heptanal in human blood by headspace single-drop microextraction with droplet derivatization. Anal. Biochem. 2005, 342, 318–326. [Google Scholar] [CrossRef]
- Stopforth, A.; Burger, B.V.; Crouch, A.M.; Sandra, P. Urinalysis of 4-hydroxynonenal, a marker of oxidative stress, using stir bar sorptive extraction-thermal desorption-gas chromatography/mass spectrometry. J. Chromatogr. B Anal. Technol. Biomed. Life Sci. 2006, 834, 134–140. [Google Scholar] [CrossRef] [PubMed]
- Wu, M.Y.; Chen, B.G.; Chang, C.D.; Huang, M.H.; Wu, T.G.; Chang, D.M.; Lee, Y.J.; Wang, H.C.; Lee, C.I.; Chern, C.L.; et al. A novel derivatization approach for simultaneous determination of glyoxal, methylglyoxal, and 3-deoxyglucosone in plasma by gas chromatography-mass spectrometry. J. Chromatogr. A 2008, 1204, 81–86. [Google Scholar] [CrossRef] [PubMed]
- Hanff, E.; Eisenga, M.F.; Beckmann, B.; Bakker, S.J.; Tsikas, D. Simultaneous pentafluorobenzyl derivatization and GC-ECNICI-MS measurement of nitrite and malondialdehyde in human urine: Close positive correlation between these disparate oxidative stress biomarkers. J. Chromatogr. B Anal. Technol. Biomed. Life Sci. 2017, 1043, 167–175. [Google Scholar] [CrossRef] [PubMed]
- Tsikas, D.; Rothmann, S.; Schneider, J.Y.; Suchy, M.T.; Trettin, A.; Modun, D.; Stuke, N.; Maassen, N.; Frölich, J.C. Development, validation and biomedical applications of stable-isotope dilution GC-MS and GC-MS/MS techniques for circulating malondialdehyde (MDA) after pentafluorobenzyl bromide derivatization: MDA as a biomarker of oxidative stress and its relation to 15(S)-8-iso-prostaglandin F2α and nitric oxide (NO). J. Chromatogr. B Anal. Technol. Biomed. Life Sci. 2016, 1019, 95–111. [Google Scholar]
- Stalikas, C.D.; Konidari, C.N. Analysis of malondialdehyde in biological matrices by capillary gas chromatography with electron-capture detection and mass spectrometry. Anal. Biochem. 2001, 290, 108–115. [Google Scholar] [CrossRef] [PubMed]
- Cighetti, G.; Debiasi, S.; Paroni, R.; Allevi, P. Free and total malondialdehyde assessment in biological matrices by gas chromatography-mass spectrometry: What is needed for an accurate detection. Anal. Biochem. 1999, 266, 222–229. [Google Scholar] [CrossRef] [PubMed]
- Pastor-Belda, M.; Fernández-García, A.J.; Campillo, N.; Pérez-Cárceles, M.D.; Motas, M.; Hernández-Córdoba, M.; Viñas, P. Glyoxal and methylglyoxal as urinary markers of diabetes. Determination using a dispersive liquid-liquid microextraction procedure combined with gas chromatography-mass spectrometry. J. Chromatogr. A 2017, 1509, 43–49. [Google Scholar] [CrossRef]
- Kandhro, A.J.; Mirza, M.A.; Khuhawar, M.Y. Capillary gas chromatographic determination of methylglyoxal from serum of diabetic patients by precolumn derivatization using meso-stilbenediamine as derivatizing reagent. J. Chromatogr. Sci. 2008, 46, 539–543. [Google Scholar] [CrossRef]
- Khuhawar, M.Y.; Zardari, L.A.; Laghari, A.J. Capillary gas chromatographic determination of methylglyoxal from serum of diabetic patients by precolumn derivatization with 1,2-diamonopropane. J. Chromatogr. B Anal. Technol. Biomed. Life Sci. 2008, 873, 15–19. [Google Scholar] [CrossRef]
- Antón, A.P.; Ferreira, A.M.; Pinto, C.G.; Cordero, B.M.; Pavón, J.L. Headspace generation coupled to gas chromatography-mass spectrometry for the automated determination and quantification of endogenous compounds in urine. Aldehydes as possible markers of oxidative stress. J. Chromatogr. A 2014, 1367, 9–15. [Google Scholar] [CrossRef]
- Zhang, X.; Wang, R.; Zhang, L.; Wei, J.; Ruan, Y.; Wang, W.; Ji, H.; Liu, J. Simultaneous determination of four aldehydes in gas phase of mainstream smoke by headspace gas chromatography-mass spectrometry. Int. J. Anal. Chem. 2019, 2019, 2105839. [Google Scholar] [CrossRef]
- Criado-García, L.; Arce, L. Extraction of toxic compounds from saliva by magnetic-stirring-assisted micro-solid-phase extraction step followed by headspace-gas chromatography-ion mobility spectrometry. Anal. Bioanal. Chem. 2016, 408, 6813–6822. [Google Scholar] [CrossRef] [PubMed]
- Andreoli, R.; Manini, P.; Corradi, M.; Mutti, A.; Niessen, W.M. Determination of patterns of biologically relevant aldehydes in exhaled breath condensate of healthy subjects by liquid chromatography/atmospheric chemical ionization tandem mass spectrometry. Rapid Commun. Mass Spectrom. 2003, 17, 637–645. [Google Scholar] [CrossRef] [PubMed]
- Chen, J.L.; Huang, Y.J.; Pan, C.H.; Hu, C.W.; Chao, M.R. Determination of urinary malondialdehyde by isotope dilution LC-MS/MS with automated solid-phase extraction: A cautionary note on derivatization optimization. Free Radic. Biol. Med. 2011, 51, 1823–1829. [Google Scholar] [CrossRef] [PubMed]
- Manini, P.; Andreoli, R.; Sforza, S.; Dall’Asta, C.; Galaverna, G.; Mutti, A.; Niessen, W.M. Evaluation of Alternate Isotope-Coded Derivatization Assay (AIDA) in the LC-MS/MS analysis of aldehydes in exhaled breath condensate. J. Chromatogr. B Anal. Technol. Biomed. Life Sci. 2010, 878, 2616–2622. [Google Scholar] [CrossRef] [PubMed]
- Van der Toorn, M.; Slebos, D.J.; de Bruin, H.G.; Gras, R.; Rezayat, D.; Jorge, L.; Sandra, K.; van Oosterhout, A.J. Critical role of aldehydes in cigarette smoke-induced acute airway inflammation. Respir. Res. 2013, 14, 45. [Google Scholar] [CrossRef] [PubMed]
- Prokai, L.; Szarka, S.; Wang, X.; Prokai-Tatrai, K. Capture of the volatile carbonyl metabolite of flecainide on 2,4-dinitrophenylhydrazine cartridge for quantitation by stable-isotope dilution mass spectrometry coupled with chromatography. J. Chromatogr. A 2012, 1232, 281–287. [Google Scholar] [CrossRef] [PubMed]
- Olson, K.L.; Swarin, S.J. Determination of Aldehydes and Ketones by Derivatization and Liquid-Chromatography Mass-Spectrometry. J. Chromatogr. 1985, 333, 337–347. [Google Scholar] [CrossRef]
- Lord, H.L.; Rosenfeld, J.; Volovich, V.; Kumbhare, D.; Parkinson, B. Determination of malondialdehyde in human plasma by fully automated solid phase analytical derivatization. J. Chromatogr. B Anal. Technol. Biomed. Life Sci. 2009, 877, 1292–1298. [Google Scholar] [CrossRef]
- Tomono, S.; Miyoshi, N.; Ohshima, H. Comprehensive analysis of the lipophilic reactive carbonyls present in biological specimens by LC/ESI-MS/MS. J. Chromatogr. B Anal. Technol. Biomed. Life Sci. 2015, 988, 149–156. [Google Scholar] [CrossRef]
- Cao, Y.; Guan, Q.; Sun, T.; Qi, W.; Guo, Y. Charged tag founded in N-(1-chloroalkyl)pyridinium quaternization for quantification of fatty aldehydes. Anal. Chim. Acta 2016, 937, 80–86. [Google Scholar] [CrossRef]
- Henning, C.; Liehr, K.; Girndt, M.; Ulrich, C.; Glomb, M.A. Extending the spectrum of α-dicarbonyl compounds in vivo. J. Biol. Chem. 2014, 289, 28676–28688. [Google Scholar] [CrossRef]
- Kim, H.J.; Shin, H.S. Simple derivatization of aldehydes with D-cysteine and their determination in beverages by liquid chromatography-tandem mass spectrometry. Anal. Chim. Acta 2011, 702, 225–232. [Google Scholar] [CrossRef] [PubMed]
- El-Maghrabey, M.; Kishikawa, N.; Kuroda, N. 9,10-Phenanthrenequinone as a mass-tagging reagent for ultra-sensitive liquid chromatography-tandem mass spectrometry assay of aliphatic aldehydes in human serum. J. Chromatogr. A 2016, 1462, 80–89. [Google Scholar] [CrossRef] [PubMed]
- Sobsey, C.A.; Han, J.; Lin, K.; Swardfager, W.; Levitt, A.; Borchers, C.H. Development and evaluation of a liquid chromatography-mass spectrometry method for rapid, accurate quantitation of malondialdehyde in human plasma. J. Chromatogr. B Anal. Technol. Biomed. Life Sci. 2016, 1029–1030, 205–212. [Google Scholar] [CrossRef] [PubMed]
- Oh, J.A.; Shin, H.S. Simple and sensitive determination of malondialdehyde in human urine and saliva using UHPLC-MS/MS after derivatization with 3,4-diaminobenzophenone. J. Sep. Sci. 2017, 40, 3958–3968. [Google Scholar] [CrossRef] [PubMed]
- Eggink, M.; Wijtmans, M.; Ekkebus, R.; Lingeman, H.; de Esch, I.J.; Kool, J.; Niessen, W.M.; Irth, H. Development of a selective ESI-MS derivatization reagent: Synthesis and optimization for the analysis of aldehydes in biological mixtures. Anal. Chem. 2008, 80, 9042–9051. [Google Scholar] [CrossRef] [PubMed]
- Eggink, M.; Wijtmans, M.; Kretschmer, A.; Kool, J.; Lingeman, H.; de Esch, I.J.; Niessen, W.M.; Irth, H. Targeted LC-MS derivatization for aldehydes and carboxylic acids with a new derivatization agent 4-APEBA. Anal. Bioanal. Chem. 2010, 397, 665–675. [Google Scholar] [CrossRef] [PubMed]
- Chen, D.; Ding, J.; Wu, M.K.; Zhang, T.Y.; Qi, C.B.; Feng, Y.Q. A liquid chromatography-mass spectrometry method based on post column derivatization for automated analysis of urinary hexanal and heptanal. J. Chromatogr. A 2017, 1493, 57–63. [Google Scholar] [CrossRef]
- Tie, C.; Hu, T.; Jia, Z.X.; Zhang, J.L. Derivatization Strategy for the Comprehensive Characterization of Endogenous Fatty Aldehydes Using HPLC-Multiple Reaction Monitoring. Anal. Chem. 2016, 88, 7762–7768. [Google Scholar] [CrossRef]
- Kolliker, S.; Oehme, M.; Dye, C. Structure elucidation of 2,4-dinitrophenylhydrazone derivatives of carbonyl compounds in ambient air by HPLC/MS and multiple MS/MS using atmospheric chemical ionization in the negative ion mode. Anal. Chem. 1998, 70, 1979–1985. [Google Scholar] [CrossRef]
- Brombacher, S.; Oehme, M.; Beukes, J.A. HPLC combined with multiple mass spectrometry (MSn): An alternative for the structure elucidation of compounds and artefacts found in smog chamber samples. J. Environ. Monit. 2001, 3, 311–316. [Google Scholar] [CrossRef] [PubMed]
- Mendonça, R.; Gning, O.; Di Cesaré, C.; Lachat, L.; Bennett, N.C.; Helfenstein, F.; Glauser, G. Sensitive and selective quantification of free and total malondialdehyde in plasma using UHPLC-HRMS. J. Lipid Res. 2017, 58, 1924–1931. [Google Scholar] [CrossRef] [PubMed]
- Dator, R.; Carrà, A.; Maertens, L.; Guidolin, V.; Villalta, P.W.; Balbo, S. A High Resolution/Accurate Mass (HRAM) Data-Dependent MS3 Neutral Loss Screening, Classification, and Relative Quantitation Methodology for Carbonyl Compounds in Saliva. J. Am. Soc. Mass Spectrom. 2017, 28, 608–618. [Google Scholar] [CrossRef] [PubMed]
- Yu, L.; Liu, P.; Wang, Y.L.; Yu, Q.W.; Yuan, B.F.; Feng, Y.Q. Profiling of aldehyde-containing compounds by stable isotope labelling-assisted mass spectrometry analysis. Analyst 2015, 140, 5276–5286. [Google Scholar] [CrossRef] [PubMed]
- Zheng, S.J.; Wang, Y.L.; Liu, P.; Zhang, Z.; Yu, L.; Yuan, B.F.; Feng, Y.Q. Stable isotope labeling-solid phase extraction-mass spectrometry analysis for profiling of thiols and aldehydes in beer. Food Chem. 2017, 237, 399–407. [Google Scholar] [CrossRef] [PubMed]
- Eggink, M.; Charret, S.; Wijtmans, M.; Lingeman, H.; Kool, J.; Niessen, W.M.; Irth, H. Development of an on-line weak-cation exchange liquid chromatography-tandem mass spectrometric method for screening aldehyde products in biological matrices. J. Chromatogr. B Anal. Technol. Biomed. Life Sci. 2009, 877, 3937–3945. [Google Scholar] [CrossRef] [PubMed]
- Zhao, S.; Dawe, M.; Guo, K.; Li, L. Development of High-Performance Chemical Isotope Labeling LC-MS for Profiling the Carbonyl Submetabolome. Anal. Chem. 2017, 89, 6758–6765. [Google Scholar] [CrossRef]
- Guo, N.; Peng, C.Y.; Zhu, Q.F.; Yuan, B.F.; Feng, Y.Q. Profiling of carbonyl compounds in serum by stable isotope labeling—Double precursor ion scan—Mass spectrometry analysis. Anal. Chim. Acta 2017, 967, 42–51. [Google Scholar] [CrossRef]
- Siegel, D.; Meinema, A.C.; Permentier, H.; Hopfgartner, G.; Bischoff, R. Integrated quantification and identification of aldehydes and ketones in biological samples. Anal. Chem. 2014, 86, 5089–5100. [Google Scholar] [CrossRef]
- Deng, P.; Higashi, R.M.; Lane, A.N.; Bruntz, R.C.; Sun, R.C.; Raju, M.V.R.; Nantz, M.H.; Qi, Z.; Fan, T.W. Correction: Quantitative profiling of carbonyl metabolites directly in crude biological extracts using chemoselective tagging and nanoESI-FTMS. Analyst 2018, 143, 999. [Google Scholar] [CrossRef]
- Mattingly, S.J.; Xu, T.; Nantz, M.H.; Higashi, R.M.; Fan, T.W. A carbonyl capture approach for profiling oxidized metabolites in cell extracts. Metabolomics 2012, 8, 989–996. [Google Scholar] [CrossRef] [PubMed][Green Version]
- Fu, X.A.; Li, M.; Biswas, S.; Nantz, M.H.; Higashi, R.M. A novel microreactor approach for analysis of ketones and aldehydes in breath. Analyst 2011, 136, 4662–4666. [Google Scholar] [CrossRef] [PubMed]
- Knipp, R.J.; Li, M.; Fu, X.-A.; Nantz, M.H. A versatile probe for chemoselective capture and analysis of carbonyl compounds in exhaled breath. Anal. Methods 2015, 7, 6027–6033. [Google Scholar] [CrossRef]
- Kolliker, S.; Oehme, M.; Merz, L. Unusual MSn fragmentation patterns of 2,4-dinitrophenylhydrazine and its propanone derivative. Rapid Commun. Mass Spectrom. 2001, 15, 2117–2126. [Google Scholar] [CrossRef]
- Szarka, S.; Prokai-Tatrai, K.; Prokai, L. Application of screening experimental designs to assess chromatographic isotope effect upon isotope-coded derivatization for quantitative liquid chromatography-mass spectrometry. Anal. Chem. 2014, 86, 7033–7040. [Google Scholar] [CrossRef] [PubMed]
- Deng, P.; Higashi, R.M.; Lane, A.N.; Bruntz, R.C.; Sun, R.C.; Ramakrishnam Raju, M.V.; Nantz, M.H.; Qi, Z.; Fan, T.W. Quantitative profiling of carbonyl metabolites directly in crude biological extracts using chemoselective tagging and nanoESI-FTMS. Analyst 2017, 143, 311–322. [Google Scholar] [CrossRef] [PubMed]
- Wild, C.P. Complementing the genome with an “exposome”: The outstanding challenge of environmental exposure measurement in molecular epidemiology. Cancer Epidemiol. Biomark. Prev. 2005, 14, 1847–1850. [Google Scholar] [CrossRef] [PubMed]


| Method Number | Matrix | Detection |
|---|---|---|
| EPA T0-11 | Ambient air | HPLC-UV |
| EPA 8315A | Liquid, solid, and gas samples | HPLC-UV |
| ASTM D5197 | Ambient air | HPLC-UV |
| NIOSH 2016 and 2532 | Ambient indoor air | HPLC-UV |
| EPA 554 | Drinking water | HPLC-UV |
| Analytes | Matrix | Derivatization Reagent | Analytical Method | LOD | LOQ | Reference |
|---|---|---|---|---|---|---|
| Colorimetric/Fluorimetric/Amperometric | ||||||
| Malondialdehyde | Plasma | 2-TBA | Fluorimetric | NR | NR | Yagi 1976 [128] |
| Malondialdehyde | Plasma, Serum, Tissue | 2-TBA | Fluorimetric | NR | NR | Armstrong et al. 1994 [129] |
| Malondialdehyde | Plasma | 2-TBA | Fluorimetric | 0.015 μmol L−1 | 0.025 μmol L−1 | Del Rio et al. 2003 [130] |
| Aldehydes | Saliva | MBTH | Colorimetric | 6.1 μM | NR | Ramdzan et al. 2016 [131] |
| Methylglyoxal and glyoxal | Urine and water | 2-TBA | CE-AD | 0.2 μg L−1 (methylglyoxal) 0.5 μg L−1 (glyoxal) | 1.0 μg L−1 (methylglyoxal) 2.0 μg L−1 (glyoxal) | Zhang et al. 2010 [132] |
| HPLC-UV | ||||||
| Acrolein, carbonyls | Cigarette smoke | HQ/2,4-DNPH | HPLC-UV | 0.015–0.074 μg | 0.05–0.25 μg | Uchiyama et al. 2010 [22] |
| Acetaldehyde | Plasma, red blood cells | 2,4-DNPH | HPLC-UV | NR | NR | Di Padova et al. 1986 [154] |
| Malondialdehyde | Plasma | 2-TBA | HPLC-UV | 0.05 μM | 0.17 μM | Grotto et al. 2007 [156] |
| Hexanal and heptanal | Urine | 2,4-DNPH | HPLC-UV | 1.0 μmol L−1 (hexanal); 0.7 μmol L−1 (heptanal) | 3.0 μmol L−1 (hexanal); 2.2 μmol L−1 (heptanal) | Oenning et al. 2017 [145] |
| Hexanal and heptanal | Blood | 2,4-DNPH | HPLC-UV | 7.9 nmol L−1 (hexanal); 2.3 nmol L−1 (heptanal) | NR | Lili et al. 2010 [146] |
| Hexanal and heptanal | Urine | 2,4-DNPH | HPLC-UV | 1.7 nmol L−1 (hexanal); 2.5 μmol L−1 (heptanal) | 5.7 nmol L−1 (hexanal); 8.3 μmol L−1 (heptanal) | Liu et al. 2015 [147] |
| Malondialdehyde | Plasma | 2-TBA | HPLC-UV | 0.02 μmol L−1 | NR | Nielsen et al. 1997 [155] |
| Malondialdehyde | Plasma, Serum | 2,3-DAN | HPLC-UV | < 50 pM | NR | Steghens et al. 2001 [157] |
| 5-Hydroxymethylfurfural | Beverages | 2,4-DNPH | HPLC-UV | 1.0 μg L−1 | 3.4 μg L−1 | Wu et al. 2009 [142] |
| Hexanal and heptanal | Blood | 2,4-DNPH | HPLC-UV | 0.8 nmol L−1 (hexanal); 0.8 nmol L−1 (heptanal) | NR | Xu et al. 2010 [148] |
| Hexanal and heptanal | Urine and Serum | 2,4-DNPH | HPLC-UV | 0.8 nmol L−1 (hexanal); 0.8 nmol L−1 (heptanal) | NR | Xu et al. 2011 [149] |
| Hexanal and heptanal | Plasma | 2,4-DNPH | HPLC-UV | 2.4 nmol L−1 (hexanal); 3.6 μmol L−1 (heptanal) | NR | Zhang et al. 2007 [150] |
| Formaldehyde | Human Tissue | 2,4-DNPH | HPLC-UV | 1.5 mg L−1 | 5.0 mg L−1 | Yilmas et al. 2016 [151] |
| Acetaldehyde | Cell culture media, rat blood and plasma | 2,4-DNPH | HPLC-UV | > 3 μM | NR | Guan et al. 2012 [152] |
| Carbonyls | Air | 2,4-DNPH/2-PB | HPLC-UV | NR | NR | Uchiyama et al. 2009 [153] |
| Carbonyls | Exhaled breath | 2,4-DNPH | HPLC-UV | 0.001-0.01 μg puff−1 | NR | Samburova et al. 2018 [35] |
| Formaldehyde | Cosmetic products | 2,4-DNPH | HPLC-UV | NR | 10 mg kg−1 | Galli et al. 2015 [18] |
| HPLC-Fluorescence/Fluorescence | ||||||
| Glyoxal and methylglyoxal | Urine | DDB | HPLC-Fluorescence | NR | NR | Akira et al. 2004 [166] |
| Malondialdehyde | Serum, Plasma | 2-TBA | HPLC-Fluorescence | NR | 0.05 μmol L−1 | Seljeskog et al. 2006 [164] |
| Acrolein | Urine | m-aminophenol | HPLC-Fluorescence | NR | NR | Al-Rawithi et al. 1993 [168] |
| Aliphatic aldehydes | Serum | 2,2’-furil | HPLC-Fluorescence | 0.19–0.50 nM | NR | Ali et al. 2013 [159] |
| 4-HNE | Serum | DBD-H | HPLC-Fluorescence | 0.06 μM | NR | Imazato et al. 2014 [160] |
| Malondialdehyde | Plasma, Urine | RBH | HPLC-Fluorescence | 0.25 nM | 0.80 nM | Li et al. 2013 [161] |
| Malondialdehyde | Plasma | FMOC-hydrazine | HPLC-Fluorescence | 4.0 nmol L−1 | NR | Mao et al. 2006 [163] |
| Glyoxal, methylglyoxal, and diacetyl | Urine | 4-MPD | HPLC-Fluorescence | 1.82–2.31 μg L−1 | 3.06–3.88 μg L−1 | Ojeda et al. 2014 [165] |
| Acrolein | Plasma | luminarin 3 | HPLC-Fluorescence | 100 nM | 300 nM | Paci et al. 2000 [167] |
| Aldehydes | Serum | BODIPY-aminozide | HPLC-Fluorescence | 0.43–0.69 nM | NR | Xiong et al. 2010 [158] |
| Malondialdehyde | Urine | 2-AA | HPLC-Fluorescence | 1.8 nM | 5.8 nM | Giera et al. 2011 [162] |
| Formaldehyde | Cells | FAP-1 | Fluorescence | NR | NR | Brewer et al. 2015 [170] |
| Formaldehyde | Cells | FP1 | Fluorescence | NR | NR | Roth et al. 2015 [169] |
| Total aldehydes | Cells | DarkZone dye/DEAC | Fluorescence | NR | NR | Yuen et al. 2016 [171] |
| Biogenic aldehydes | Aldehyde standards | methyl-5-methoxy-N-aminoanthranilate | Fluorescence | NR | NR | Lazurko et al. 2018 [96] |
| Gas Chromatography (GC)/Gas Chromatography-Mass Spectrometry (GC-MS) | ||||||
| Methylglyoxal | Serum | 1,2-diaminopropane | GC-FID | 40 μg L−1 | NR | Khuhawar et al. 2008 [193] |
| Methylglyoxal | Serum | meso-stilbenediamine | GC-FID | 25 μg L−1 | NR | Kandhro et al. 2008 [192] |
| Acetaldehyde | Saliva, blood | no derivatization | GC-FID | NR | NR | Yokohama et al. 2008 [40] |
| Butyraldehyde, Benzaldehyde, Tolualdehyde | Saliva | no derivatization | GC-IMS | 0.38–0.49 mg L−1 | 1.26–1.66 mg L−1 | Criado-Garcia et al. 2016 [196] |
| Pentanal, Hexanal, Heptanal, Octanal, Benzaldehyde | Urine | no derivatization | GC-MS | 0.04–0.08 μg L−1 | 0.12–0.24 μg L−1 | Anton et al. 2014 [194] |
| Acetaldehyde, propionaldehyde, acrolein, crotonaldehyde | MTS | no derivatization | GC-MS | 0.014–0.12 μg cig−1 | 0.045–0.38 μg cig−1 | Zhang et al. 2019 [195] |
| Volatile aldehydes | Urine | PFBHA | GC-MS | 0.009–15 μg L−1 | 0.029–50 μg L−1 | Calejo et al. 2016 [181] |
| Malondialdehyde | Plasma, RLM | Phenylhydrazine (PH) | GC-MS | 5 pmol injection−1 (LLOD) | NR | Cighetti et al. 1999 [190] |
| Hexanal and heptanal | Blood | PFBHA | GC-MS | 0.006 nM (hexanal); 0.005 nM (heptanal | NR | Deng et al. 2004 [177] |
| Aldehydes | Blood | PFBHA | GC-MS | 0.001–0.006 nM | NR | Deng et al. 2004 [178] |
| Malondialdehyde | Urine | PFB-Br | GC-MS | 0.7 nM | NR | Hanff et al. 2017 [187] |
| Glyoxal and methylglyoxal | Plasma | PFBOA | GC-MS | NR | NR | Lapolla et al. 2003 [174] |
| Hexanal and heptanal | Blood | PFBHA | GC-MS | 0.12 nM (hexanal); 0.16 nM (heptanal | NR | Li et al. 2005 [184] |
| Glyoxal and methylglyoxal | Urine | 2,3-DAN | GC-MS | 0.12 μg L−1 (glyoxal); 0.06 μg L−1 (methylglyoxal) | 0.40 μg L−1 (glyoxal); 0.2 μg L−1 (methylglyoxal) | Pastor-Belda et al. 2017 [191] |
| Malondialdehyde | Blood | TFEH | GC-MS | 0.4 μg L−1 | NR | Shin 2009 [183] |
| Malondialdehyde | Plasma, Urine | TCPH | GC-MS | 0.4 μM (MSD); 0.03 μM (ECD) | NR | Stalikas et al. 2001 [189] |
| C6-C10 aldehydes | Exhaled breath | PFBHA | GC-MS | 0.01–0.03 nM | 0.02–0.1 nM | Svensson et al. 2007 [180] |
| Glyoxal, methylglyoxal, and 3-dG | Plasma | PFBOA; MSTFA | GC-MS | 12.8–31.2 μg L−1 | 12.8–31.2 μg L−1 | Wu et al. 2008 [186] |
| Formaldehyde | Urine | PFBHA | GC-MS | 1.08 μg L−1 | 3.6 μg L−1 | Takeuchi et al. 2007 [175] |
| Volatile aldehydes | Exhaled breath | PFBHA | GC-MS | 1.3–56 pmol L−1 | 4.3–226 pmol L−1 | Fuchs et al. 2010 [179] |
| Aldehydes (C3-C9) | Exhaled breath | PFBHA | GC-MS | 1 x 10-12 M | 3 x 10-12 M | Poli et al. 2010 [182] |
| 4-HNE | Urine | PFBHA; sulfuric acid | GC-MS | 22.5 ng L−1 | 75 ng L−1 | Stopforth et al. 2006 [185] |
| Malondialdehyde and 4-HNE | Plasma | PFBHA | GC-MS | NR | NR | Tsikas et al. 2017 [176] |
| Carbonyls | Chewing Tobacco | PFBHA | GC-MS | NR | 100-1000 ppb | Chou et al. 1994 [173] |
| Carbonyls | MTS | PFPH | GC-MS | NR | NR | Pang et al. 2011 [23] |
| Malondialdehyde | Plasma | PFB-Br | GC-MS | 2 amol | 200 nM (LLOQ) | Tsikas et al. 2016 [188] |
| Analytes | Matrix | Derivatization Reagent | Ionization Technique | Ionization Mode | Flow rate (μL min−1) | MS Technique | LOD | LOQ | Reference |
|---|---|---|---|---|---|---|---|---|---|
| Fatty aldehydes | Plasma, brain tissue | T3 | ESI | (+) | 500 | LC-MS/MS | 0.1–1 ng L−1 | NR | Tie et al. 2016 [214] |
| Carbonyls | Air | 2,4-DNPH | APCI | (−) | 1000 | LC-MSn | 10 pg | NR | Kolliker et al. 1998 [215] |
| Carbonyls | Air | 2,4-DNPH | APCI | (−) | 1400 | LC-MS | 20–60 pg | 200-600 pg | Grosjean et al. 1999 [135] |
| Carbonyls | Air in smog chamber | 2,4-DNPH | APCI | (−) | 560 | LC-MSn | 0.5–1 ng | NR | Brombacher et al. 2001 [216] |
| Carbonyls | Standards | 2,4-DNPH | APCI | (−) | 550 | LC-MS/MS | 2.13–30.9 pg | NR | Ochs et al. 2015 [137] |
| Malondialdehyde | Plasma | 2,4-DNPH | ESI | (+) | 400 | UHPLC-HRMS | 32 nM | 100 nM | Mendonca et al. 2017 [217] |
| Carbonyls | Saliva | 2,4-DNPH; D3-2,4-DNPH | ESI | (+) | 0.3 | HR/AM DDA NL MS3 | 0.19–3.24 fmol | NR | Dator et al. 2017 [218] |
| Carbonyls | Engine exhaust, polymers, liquid soaps | 2,4-DNPH | APCI | (+) & (−) | 200 | LC-MS | NR | NR | Olson et al. 1985 [202] |
| Carbonyls | Automobile exhaust and cigarette smoke | 2,4-DNPH | APPI, APCI | (−) | 500 | LC-MS | 2.9–24 nmol L−1 | 9.7–80 nmol L−1 | Van Leeuwen et al. 2004 [136] |
| Carbonyls | MTS | 2,4-DNPH | ESI, APCI, APPI | (−) | 500 | UHPLC-MS | NR | 0.022–0.134 μg mL−1 | Miller et al. 2010 [144] |
| Aldehydes | EBC | 2,4-DNPH | APCI | (+) & (−) | 800 | LC -MS/MS | 0.3–1.0 nM | NR | Andreoli et al. 2003 [197] |
| LMM aldehydes | Urine | 2,4-DNPH | ESI | (−) | 300 | LC-MS/MS | 15–65 ng L−1 | 50–200 ng L−1 | Banos et al. 2010 [143] |
| Malondialdehyde | Urine | 2,4-DNPH | ESI | (+) | 200 | LC-MS/MS | 1.6 nmol L−1 | 6.4 nmol L−1 | Chen et al. 2011 [198] |
| Malondialdehyde and 4-HNE | EBC | 2,4-DNPH; D3-2,4-DNPH | ESI | (+) | 500 | LC-MS/MS | NR | NR | Manini et al. 2010 [199] |
| Trifluoroacetaldehyde | Human liver microsomes | 2,4-DNPH; D3-2,4-DNPH; 15N4-2,4-DNPH | ESI | (−) | 200 | LC-MS | 16 ± 4 μg L−1 (SIM) 23 ± 6 μg L−1 (NRS) * 59 ± 32 μg L−1 (SRM) | NR | Prokai et al. 2012 [201] |
| Aldehydes and ketones | Drinking water | 2,4-DNPH | ESI | (−) | 300 | LC-MS | 25–50 pg | NR | Richardson et al. 2000 [119] |
| Carbonyls | Air | 2,4-DNPH | ESI | (−) | 600 | LC-MS/MS | 0.4–9.4 ng (m3)−1 | NR | Chi et al. 2007 [134] |
| Carbonyls | Water | 2,4-DNPH | ESI | (−) | 300 | LC-MS | 0.13–0.76 μg L−1 | 0.48–2.69 μg L−1 | Zwiener et al. 2002 [133] |
| Aldehydes | Cigarette smoke | 2,4-DNPH | ESI | (−) | 300 | LC-MS | NR | NR | Van der Toorn et al. 2013 [200] |
| Malondialdehyde | Plasma | 3-nitrophenylhydrazine | ESI | (+) | 350 | LC-MS/MS | 0.007 μM (LLOD) | 0.02 μM (LLOQ) | Sobsey et al. 2016 [209] |
| Malondialdehyde | Urine, saliva | 3,4-diaminobenzophenone | ESI | (+) | 200 | LC-MS/MS | 0.03–0.1 μg L−1 | 0.1–0.3 μg L−1 | Oh et al. 2017 [210] |
| Aldehydes | Urine and white wine | 4-APC; D4-4-APC | ESI | (+) | 200 | SIL-LC-DNLS-MS | 1.2–10 nmol L−1 | NR | Yu et al. 2015 [219] |
| Aldehydes | Beverages | 4-APC; D4-4-APC | ESI | (+) | 200 | LC-DPIS/DNLS-MS | NR | NR | Zheng et al. 2017 [220] |
| Aldehydes | Plasma | 4-APC; NaBH3CN | ESI | (+) | 150 | LC-MS/MS | 0.5–2.5 nM | NR | Eggink et al. 2009 [221] |
| Aliphatic aldehydes | Urine | 4-APC; NaBH3CN | ESI | (+) | 150 | LC-MS | 3–33 nM | NR | Eggink et al. 2008 [211] |
| Aldehydes | Plasma, Urine | 4-APEBA; NaBH3CN | ESI | (+) | 150 | LC-MS/MS | NR | NR | Eggink et al. 2010 [212] |
| Aldehydes | Beverages | 4-HBA | ESI | (+) | 500 | LC-MS | NR | NR | De Lima et al. 2018 [141] |
| Aldehydes | Serum | 9,10-PQ | ESI | (+) | 500 | LC-MS/MS | 0.004–0.1 nM | 0.05–0.25 nM | El-Maghrabey et al. 2016 [208] |
| Aldehydes | Beverages | D-cysteine | ESI | (+) | 200 | LC-MS/MS | 0.2–1.9 μg L−1 | 0.7–6.0 μg L−1 | Kim et al. 2011 [207] |
| Aldehydes | Synthesis | DAABD-MHz | ESI | (+) | 200 | LC-MS/MS | 30–60 fmol | NR | Santa et al. 2008 [125] |
| Malondialdehyde | plasma | dansylhydrazine (DnsHz) | ESI | (+) | 300-1500 | LC-MS/MS | 0.016 mg L−1 | 0.054 mg L−1 | Lord et al. 2009 [203] |
| Carbonyls | Plasma | DnsHz | ESI | (+) | 200 | LC-MS/MS | 1-20 fmol | 2.5-50 fmol | Tomono et al. 2015 [204] |
| Carbonyls | Urine | DnsHz; 13C2-DnsHz | ESI | (+) | 180 | LC-MS | NR | NR | Zhao et al. 2017 [222] |
| Carbonyls | Serum | HIQB; D7-HIQB | ESI | (+) | 200 | IL-LC-DPIS-MS | 0.1–0.21 fmol | NR | Guo et al. 2017 [223] |
| Aldehydes and ketones | Urine, plasma | HTMOB | ESI | (+) | Infusion | LC-MS/MS | NR | NR | Johnson 2007 [126] |
| Hexanal and heptanal | Urine | hydroxylamine hydrochloride | ESI | NR | 200 | UHPLC-MS/MS | 15 nM (hexanal); 9 nM (heptanal) | NR | Chen et al. 2017 [213] |
| Fatty aldehydes | Tissue | N-(1-chloroalkyl)pyridinium | ESI | (+) | 300 | LC-MS/MS | < 0.3 ng L−1 | NR | Cao et al. 2016 [205] |
| α-dicarbonyls | Plasma | o-phenyldiamine | ESI | (+) | 1000 | LC-MS/MS | 0.5–42.2 nmol L−1 | 1.5–126.6 nmol L−1 | Henning et al. 2014 [206] |
| Aldehydes and ketones | Yeast extract | p-toluenesulfonylhydrazine | ESI | (+) & (−) | 350 | SWATH-QqTOF | 0.31 μM (ESI + only) 0.36 μM (ESI − only) 0.19 μM (ESI+ or ESI−) | NR | Siegel et al. 2014 [224] |
| Carbonyls | Tissue | QDA; 13CD3 labeled QDA | ESI | (+) | Infusion | UHR-FT-MS | 0.07–0.66 nM | 0.2–1.99 nM | Deng et al. 2018 [225] |
| Carbonyls | Cell extract | QDA; 13CD3 labeled QDA | ESI | (+) | Infusion | FT-ICR-MS | NR | NR | Mattingly et al. 2012 [226] |
| Carbonyls | Exhaled breath | ATM | ESI | (+) | Infusion | FT-ICR-MS | NR | NR | Fu et al. 2011 [227] |
| Carbonyls | Exhaled breath | AMAH | ESI | (+) | Infusion | FT-ICR-MS | NR | NR | Knipp et al. 2015 [228] |
| Aldehydes and ketones | Synthesis | TMPP-AcPFP; TMPP-PrG | ESI | (+) | 500 | LC-MS/MS | NR | NR | Barry et al. 2003 [127] |
© 2019 by the authors. Licensee MDPI, Basel, Switzerland. This article is an open access article distributed under the terms and conditions of the Creative Commons Attribution (CC BY) license (http://creativecommons.org/licenses/by/4.0/).
Share and Cite
Dator, R.P.; Solivio, M.J.; Villalta, P.W.; Balbo, S. Bioanalytical and Mass Spectrometric Methods for Aldehyde Profiling in Biological Fluids. Toxics 2019, 7, 32. https://doi.org/10.3390/toxics7020032
Dator RP, Solivio MJ, Villalta PW, Balbo S. Bioanalytical and Mass Spectrometric Methods for Aldehyde Profiling in Biological Fluids. Toxics. 2019; 7(2):32. https://doi.org/10.3390/toxics7020032
Chicago/Turabian StyleDator, Romel P., Morwena J. Solivio, Peter W. Villalta, and Silvia Balbo. 2019. "Bioanalytical and Mass Spectrometric Methods for Aldehyde Profiling in Biological Fluids" Toxics 7, no. 2: 32. https://doi.org/10.3390/toxics7020032
APA StyleDator, R. P., Solivio, M. J., Villalta, P. W., & Balbo, S. (2019). Bioanalytical and Mass Spectrometric Methods for Aldehyde Profiling in Biological Fluids. Toxics, 7(2), 32. https://doi.org/10.3390/toxics7020032