3.1. Geochemistry Characteristics of PTEs in Soils and Sediments
In
Table 6, the surface soil in the study area is generally weakly alkaline, with a pH range of 6.18–7.90 and an average value of 7.03. Except for the Cr and Pb elements, the average content of As, Cd, Cu, Ni, Zn, and U elements exceeds the soil background value in Sichuan Province [
30], which is 2.46, 18.00, 1.42, 1.52, 2.33, and 4.53 times higher than the background value. The coefficient of variation of Cr and Pb is less than 0.20, indicating weak variation, which suggests that Cr and Pb have a relatively uniform spatial distribution in the soil of the Zoige uranium mining area. The coefficients of variation for As, Cd, Cu, and Ni are greater than 0.5, indicating strong variability. The coefficients of variation for Zn and U are greater than 1, indicating abnormal strong variability. This suggests that there is a local aggregation phenomenon of As, Cd, Cu, Ni, Zn, and U content in the surface soil of the study area, and their spatial distribution is uneven. In addition to being controlled by geological background, they may also be influenced by human activities. To ensure the quality and safety of agricultural products and normal growth of crops, risk screening values (RSVs) of soil were developed by the Ministry of Environmental Protection of China, and the descriptive statistics are listed in
Table 6.
The descriptive statistical results of heavy metal element content in the sediment of the Zoige uranium mining area are shown in
Table 7. Among them, the average contents of As, Cd, Cu, Ni, U, and Zn elements exceeded the soil background values in Sichuan Province, which were 3.41, 65.63, 1.82, 4.40, 5.53, and 7.47 times the background values, respectively. Compared with the screening value for soil pollution risk in agricultural land [
31], the average content of As, Cd, Ni, and Zn elements in water sediment is higher, while the average content of other elements is lower than the background value. The exceedance rate of As is 63.33%, Cd is 100%, Ni is 36.67%, and Zn is 76.67%. According to
Table 7, the coefficient of variation of Cr and Pb in the sediment of the Zoige uranium mining area is less than 0.20, indicating weak variation. This suggests that the spatial distribution of Cr and Pb in the sediment of the Zoige uranium mining area is relatively uniform. The coefficients of variation for As, Cd, Cu, Ni, and Zn are all greater than 0.5, indicating strong variability. The coefficient of variation of Zn and U is greater than 1, indicating an abnormal strong variation and indicating local aggregation of As, Cd, Cu, Ni, Zn, and U contents in the study area. The spatial distribution of water series sediments in the Zoige uranium mining area is uneven, which may be influenced not only by the geological background, but also by human activities.
The concentrations of eight PTEs in the soil are higher than those in the Bayanwula uranium mining area and a uranium mining area in East China in
Table 7. The average uranium content in the Nuheting uranium mining area, a uranium mining area in northern Guangdong, and the Xiazhuang uranium mining area is higher than that in the study area, being 4.82 times, 2.42 times, and 2.51 times that of the study area, respectively. The arsenic content in a uranium mining area in northern Guangdong and a uranium tailings area in northwest China is significantly higher, being 36.57 times and 5.25 times that of the study area, respectively. The uranium content in a uranium tailings area in South China is similar to that in the Zoige uranium mining area. Among the eight PTEs in the study area, the highest concentrations are observed for As, Cd, Zn, and U, indicating significant impacts of the Zoige uranium mining area on these four elements. Based on the average heavy metal concentrations in the soil of this study, comparisons were made with the soil background values of Sichuan Province and China, and K
1 (the ratio of heavy metal concentrations in the surface soil of the study area to the Sichuan soil background values), and K
2 (the ratio of heavy metal concentrations in the surface soil of the study area to the Chinese soil background values) were calculated. The results show that, except for Cr and Pb, the remaining PTEs exhibit varying degrees of accumulation, with Cd and U showing the highest levels of accumulation.
The concentrations of eight PTEs in the sediments are higher than those in a uranium mining area in East China, a uranium mining area in northern Guangdong, and a uranium mining area in Jiangxi. The concentrations of Cr, Ni, and Pb in the Beishanhe uranium tailings area are higher than those in the Zoige uranium mining area, being 1.56 times, 2.09 times, and 2.16 times those of the study area, respectively. Based on the soil background values of Sichuan Province and China, K1 (the ratio of the average heavy metal concentrations in the sediments of the study area to the Sichuan soil background values), K2 (the ratio of the average heavy metal concentrations in the sediments of the study area to the Chinese soil background values), and K3 (the ratio of the average heavy metal concentrations in the sediments of the study area to the national sediment background values) were calculated. The results show that, except for Cr and Pb, the remaining PTEs exhibit varying degrees of accumulation
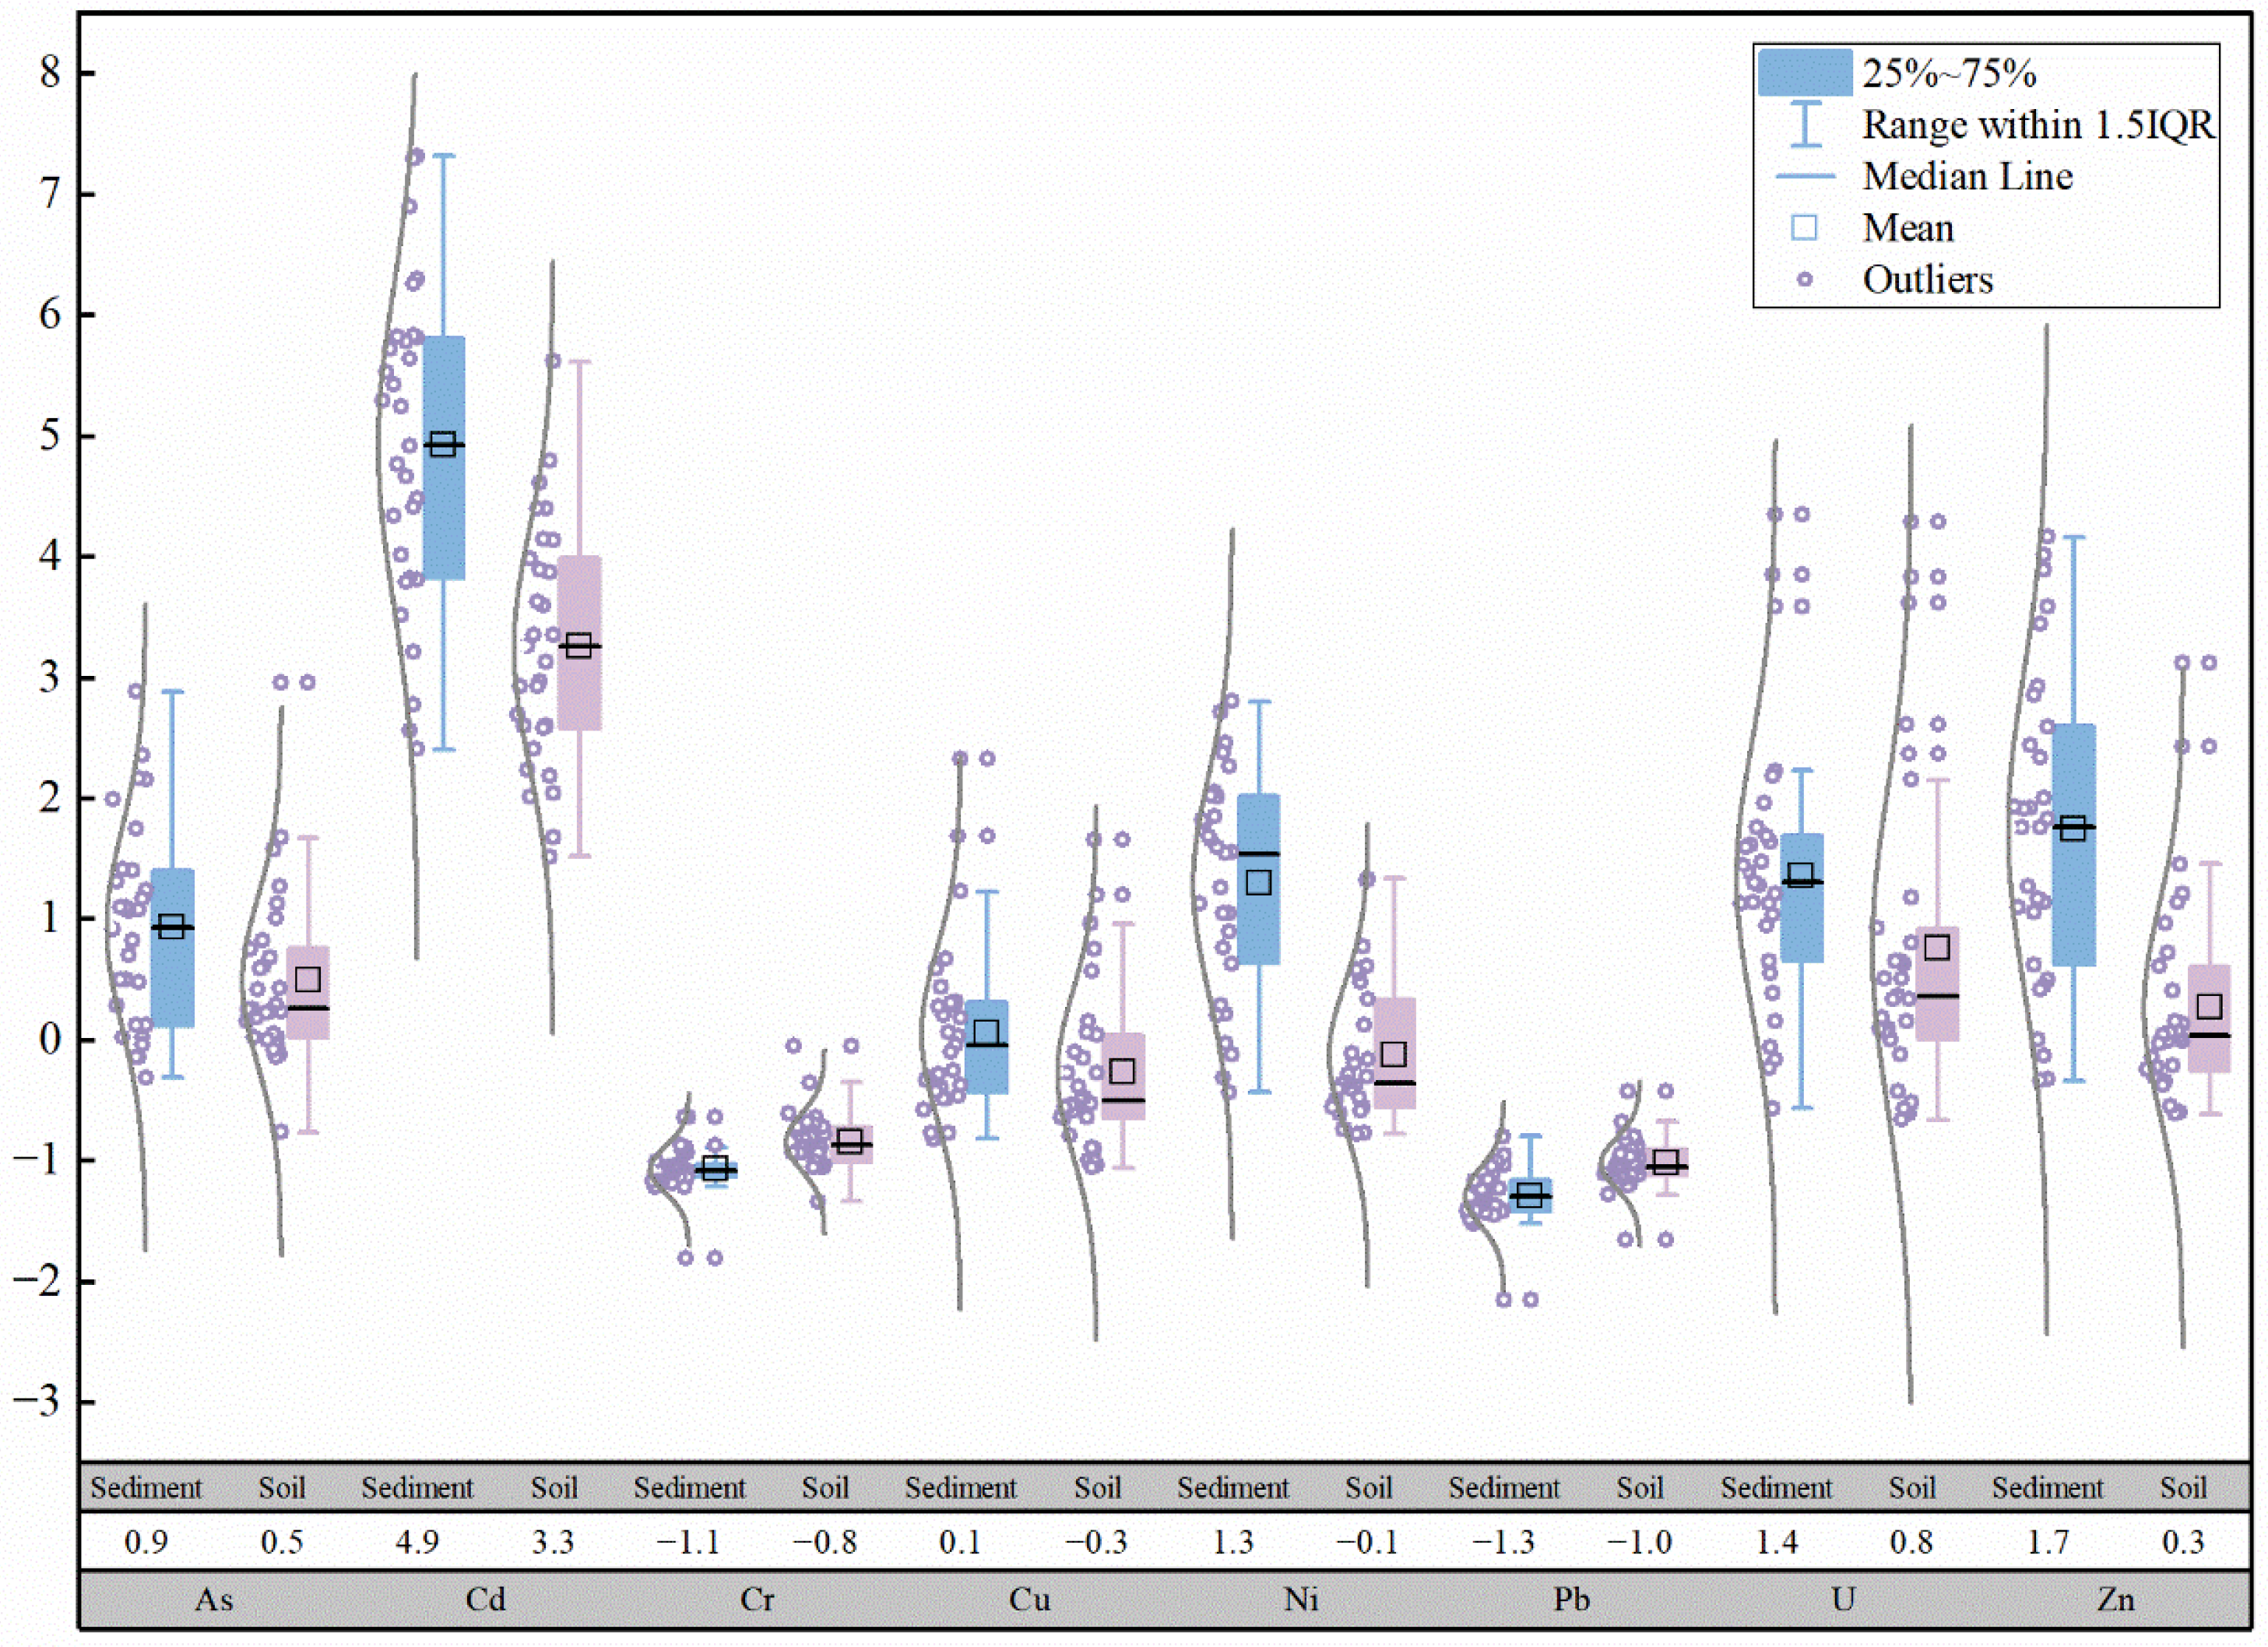
Based on the data from this study and previous research [
43], boxplots of heavy metal concentrations in the Zone Ⅲ and Zone Ⅳ of the Zoige uranium mining area in 2014 and 2022 were plotted, as shown in
Figure 2. Compared with previous studies, the concentrations of As, Cd, Pb, and U in the surface soil in 2022 decreased compared to 2014, with As and U showing the most significant reductions, while Cr, Cu, and Pb showed little difference. Compared to 2014, the reductions in As, Cd, Pb, and U concentrations in the surface soil of Zone Ⅲ were greater than those in Zone Ⅳ, while the increases in Cu and Zn concentrations in the Zone Ⅲ were greater than those in Zone Ⅳ, and the changes in Cr and Pb were minimal. In 2022, the abnormally high values of As, Cd, Cr, Cu, Ni, Pb, Zn, and U in the surface soil of the study area did not appear at the sampling points T09, T10, T11, T12, and T13, around the mining area. Based on field investigations, it is speculated that the former open-pit mining area may have been sealed with cement engineering measures to prevent the migration of uranium and other PTEs, while biological reclamation measures may have also contributed to the remediation of the soil around the mining area.
3.2. Sequential Extraction of PTEs
As shown in
Figure 3, significant variations exist in the chemical speciation of PTEs across sampling sites. Cadmium predominantly occurs in the high F1 fraction (carbonate-bound and water-soluble forms), indicating elevated bioavailability and ecological risks. The elevated F2 fractions (Fe-Mn oxide-bound) of Cd and Pb in accumulation Zone IV are attributed to local tailings deposits containing abundant Fe-Mn elements, as Pb and Cd exhibit preferential binding with Fe-Mn oxides compared to other metals (e.g., Cu, Zn) [
44]. Consequently, the dominance of F2 fractions for Cd, Pb in Zones I–V and Zn in Zone III suggests Fe-Mn oxides predominantly control these metals beyond residual forms.
Regarding organic-bound fractions (F3), Cd, Pb, Cu, U, and Zn demonstrate substantial proportions across all zones, reflecting strong organic matter control. Overall, As, Cr, Cu, Ni, Pb, U, and Zn mainly exist as residual fractions, with U showing the highest residual proportion, followed by Cr and As—consistent with previous studies [
45]—indicating low mobility and bioavailability under natural conditions. Notably, Cd exhibits the highest acid-soluble and reducible fractions, establishing it as a priority pollutant.
Sediments as predominantly occur as F1 fractions in all six zones, paralleled by substantial Ni, Zn fractions downstream, signaling high bioavailability. Cd shows elevated F2 fractions throughout, while Pb exhibits enhanced F2 fractions in Zones III-IV (abandoned mines, tailing areas, Fe, Mn-rich). U, Cu display prominent F3 fractions in Zone VI (organic-rich depositional environment). The Cd acid-soluble fraction significantly exceeds other elements, suggesting mining activities and polymetallic ore weathering drive its mobilization.
3.3. Mineralogy of Soil and Sediment
The mineralogical profiles (
Tables S1 and S2) reveal that soil and sediment matrices predominantly comprise feldspar, muscovite, quartz, clay minerals (9.7 ± 0.9%), calcite sphalerite, and bernalite. As shown in the elemental–mineral correlograms, calcium (R = 0.68,
p < 0.01) and calcite (R = 0.72,
p < 0.001) exhibit the strongest positive correlations with PTEs. Representative samples S4 and T25 (with highest PTE concentrations;
Figure 4 SEM-EDS) contain elevated calcite. In alkaline soils, PTEs tend to form hydrated hydroxides and insoluble carbonates or become adsorbed and immobilized by soil colloids, providing a certain buffering effect. Calcite is an important binder for soil aggregates and can form humus with organic matter, increasing the soil’s surface area and negative charge, thereby enhancing the adsorption of Cr
3+, Cu
2+, Pb
2+, Cd
2+, and Zn
2+. However, due to the hydrolysis effect in aquatic environments, the aggregates formed in sediments exhibit poor stability [
46,
47].
However, the mineral composition of soils and sediments predominantly consists of feldspar, quartz, and muscovite, which are chemically stable and exhibit limited correlation with heavy metal enrichment. For instance, samples with high quartz content (e.g., S01 and T11) may restrict heavy metal migration, due to their low porosity or poor permeability. Sample S30 (51.9% quartz + 41.9% feldspar) might display lower heavy metal concentrations if adsorptive minerals are absent.
S demonstrated a strong positive correlation with potentially toxic elements (PTEs). Sulfide minerals (e.g., sphalerite), iron oxides (e.g., bernalite), and clay minerals directly govern the occurrence forms and mobility of PTEs [
48]. These reactive minerals can adsorb, precipitate, or stabilize metals (e.g., Zn, Cd, As, Pb) through chemical interactions, thereby controlling their environmental risks or resource potential. Samples S4 and T25, which have high heavy metal concentrations, were selected for SEM analysis in
Figure 4. For example, sphalerite (ZnS) can oxidize through the following reaction, releasing Zn into the environment: ZnS(s) + 2O
2(aq) → Zn
2+ + SO
42−.
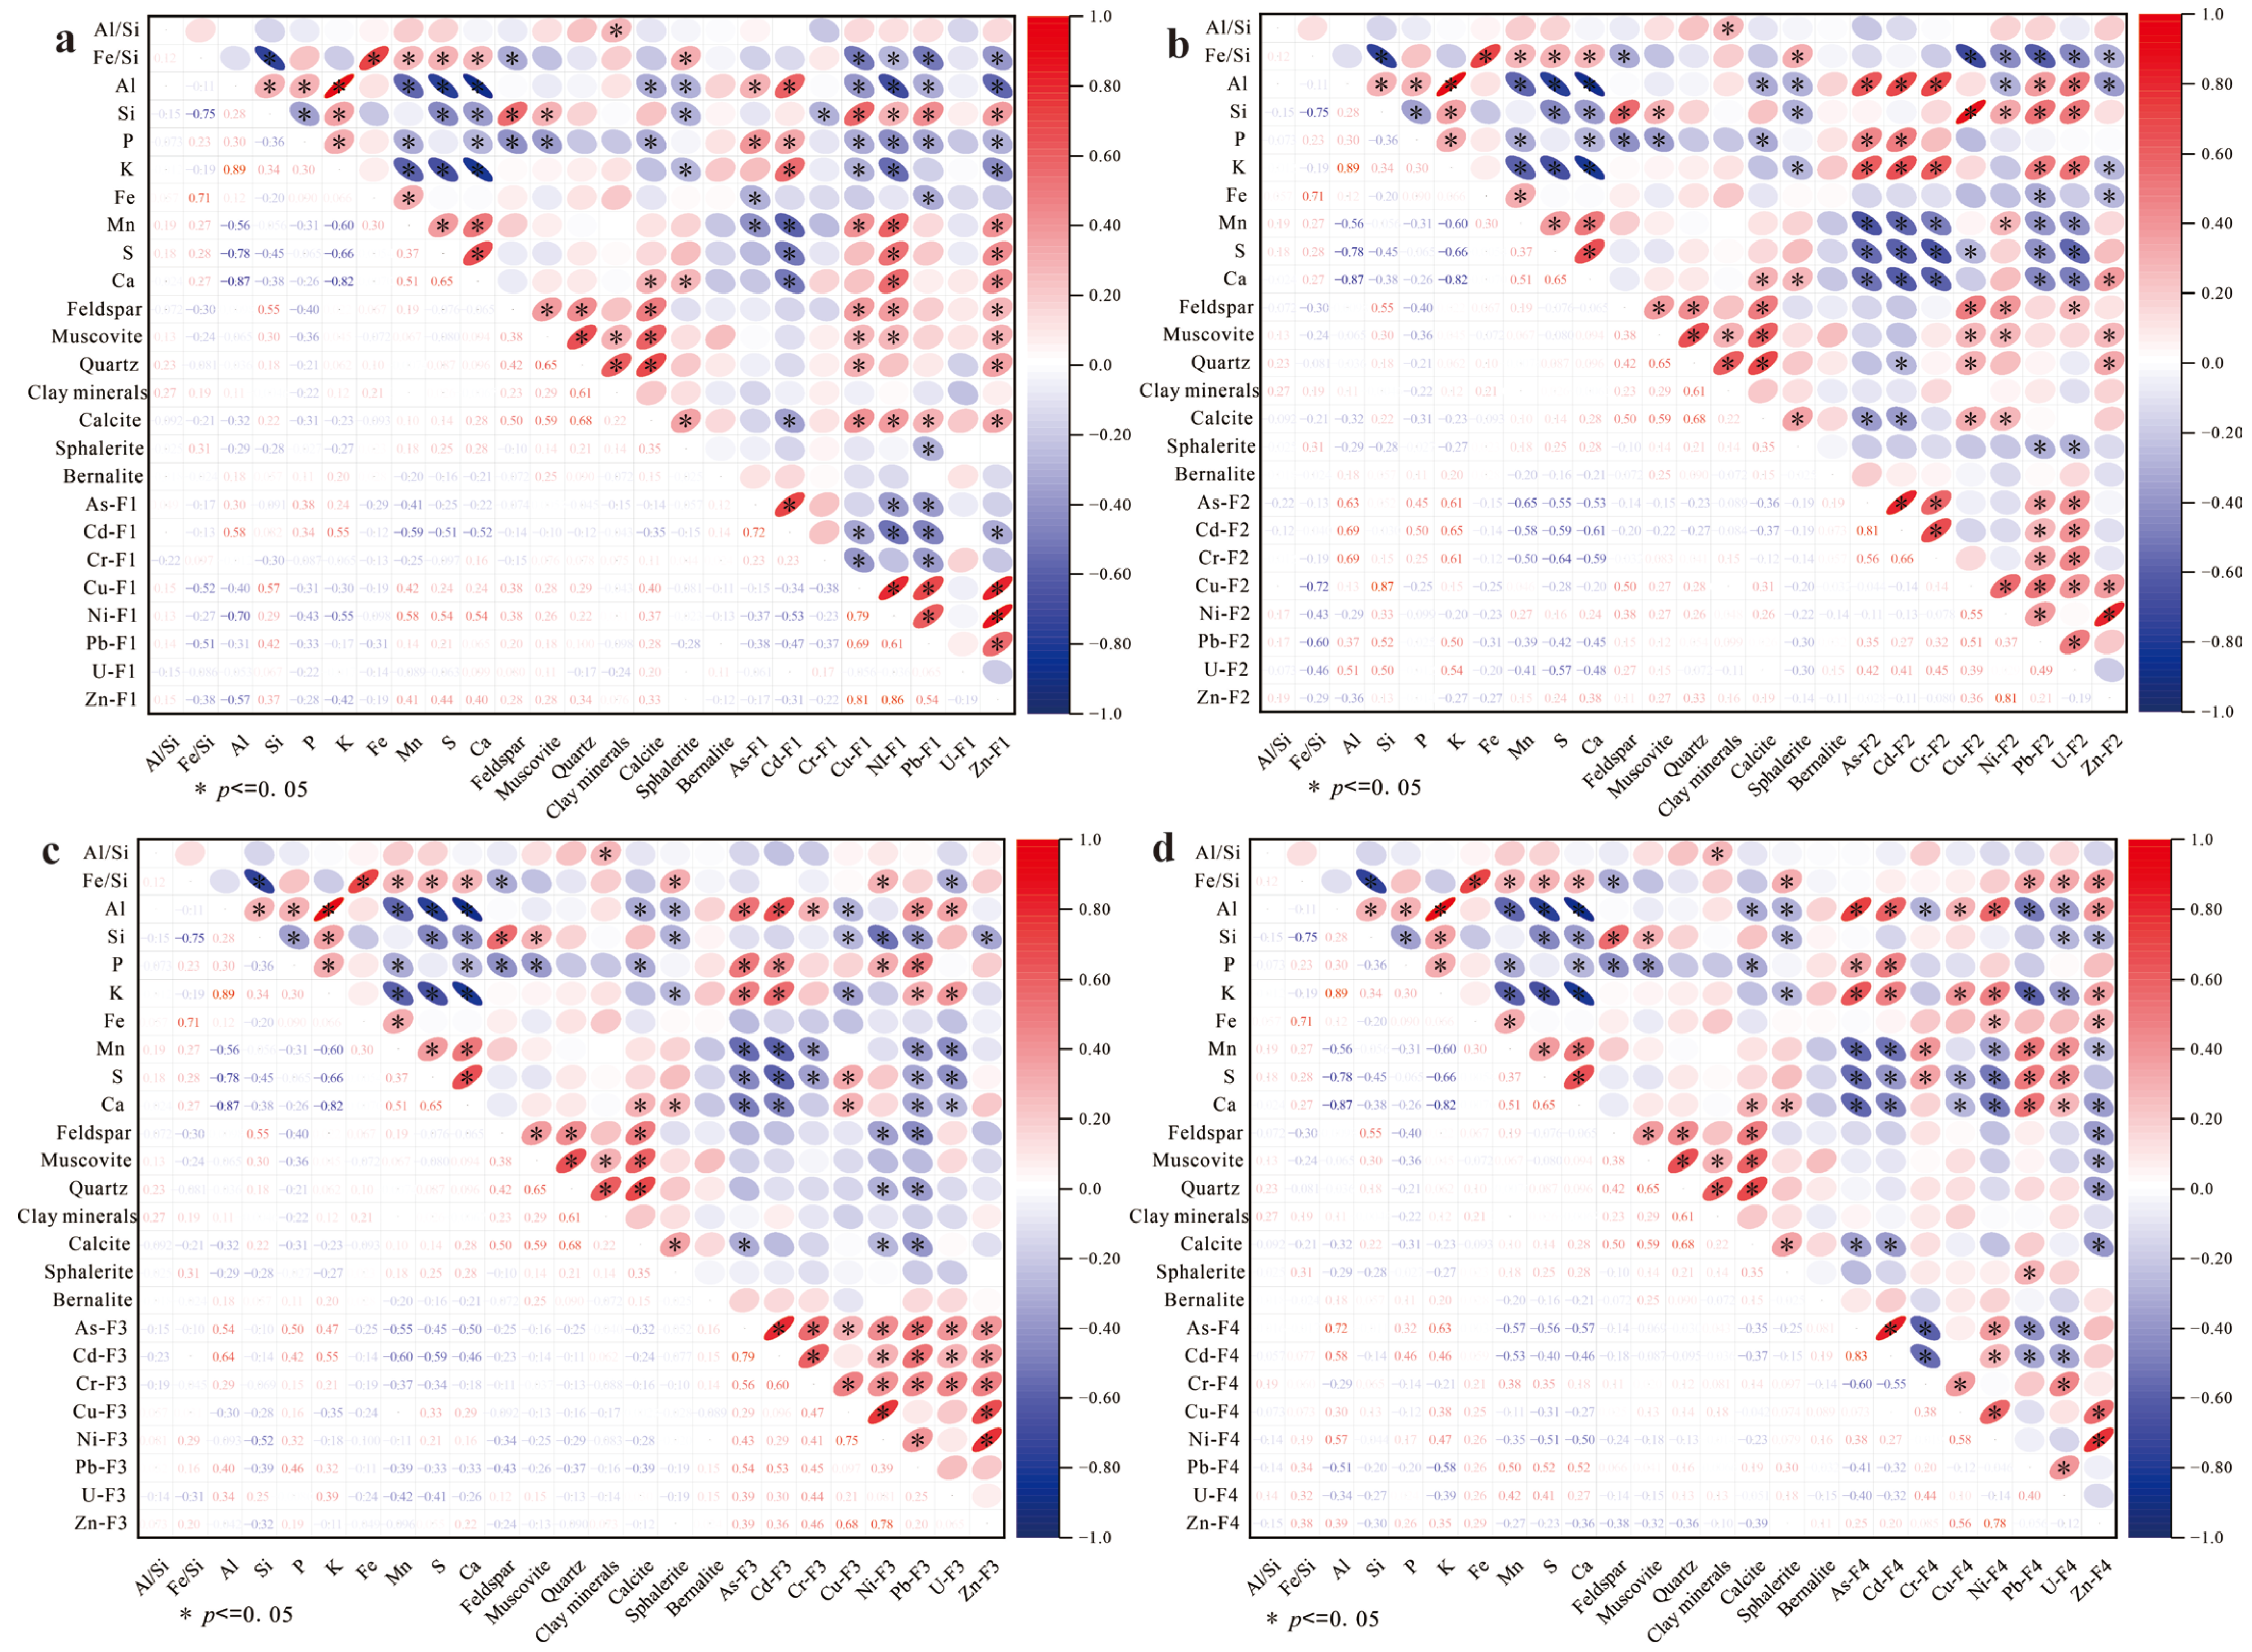
In sediments and soils, as shown as
Figure 5 and
Figure 6, Mn, S, and Ca exhibited moderate correlations (r = 0.40–0.52*) with acid-soluble fractions (F1) of Ni, Cu, and Zn. Weak acids preferentially dissolve carbonate minerals, releasing Ca
2+ and carbonate-bound metals (Ni, Cu, Zn) via congruent dissolution, resulting in source-dependent covariation between Ca and F1. In carbonate-rich zones, F1-Ca and F1 metals (Ni, Cu, Zn) often exhibit codependent trends, though deviations from linearity (r
2 = 0.18–0.34) suggest contributions from non-carbonate phases (e.g., organic matter or sulfides). Manganese oxides, serving as key adsorbents for transition metals, partially dissolve under acidic conditions, liberating Mn
2+ and adsorbed metal ions (e.g., Ni
2+, Cu
2+), thereby driving Mn-F1 metal correlations. Sulfur (as sulfate) may synchronize with Ca
2+ and Mn
2+ by ion exchange with SO
42−-bridged metal complexes.
As shown
Figure 6b, silicate minerals (feldspar, muscovite, quartz) showed moderate positive correlations (r ~0.47–0.55) with reducible fractions (F2) of metals bound to Fe-Mn oxides. This linkage likely arises from Fe and Mn cycling, which weathering of silicates (e.g., biotite) releases Fe
2+ and Mn
2+, oxidizing to form secondary oxides (e.g., ferrihydrite, goethite). F2 fraction (e.g., As, Pb) subsequently adsorb or coprecipitate onto these neoformed oxides. Silicate grains (e.g., quartz) act as nucleation templates for Fe-Mn oxide coatings, generating cryptic adsorption sites undetectable by bulk XRD but critical for metal sequestration. Lithogenic oxidation regions with high quartz content (e.g., S3, S4) often exhibit concurrent feldspar weathering, amplifying Fe-driven oxide generation and F2-metal enrichment. No systematic correlations were observed between residual (F3), oxidizable (F4) metal fractions, and mineral phases.
3.4. Spatial Distribution Characters of PTEs
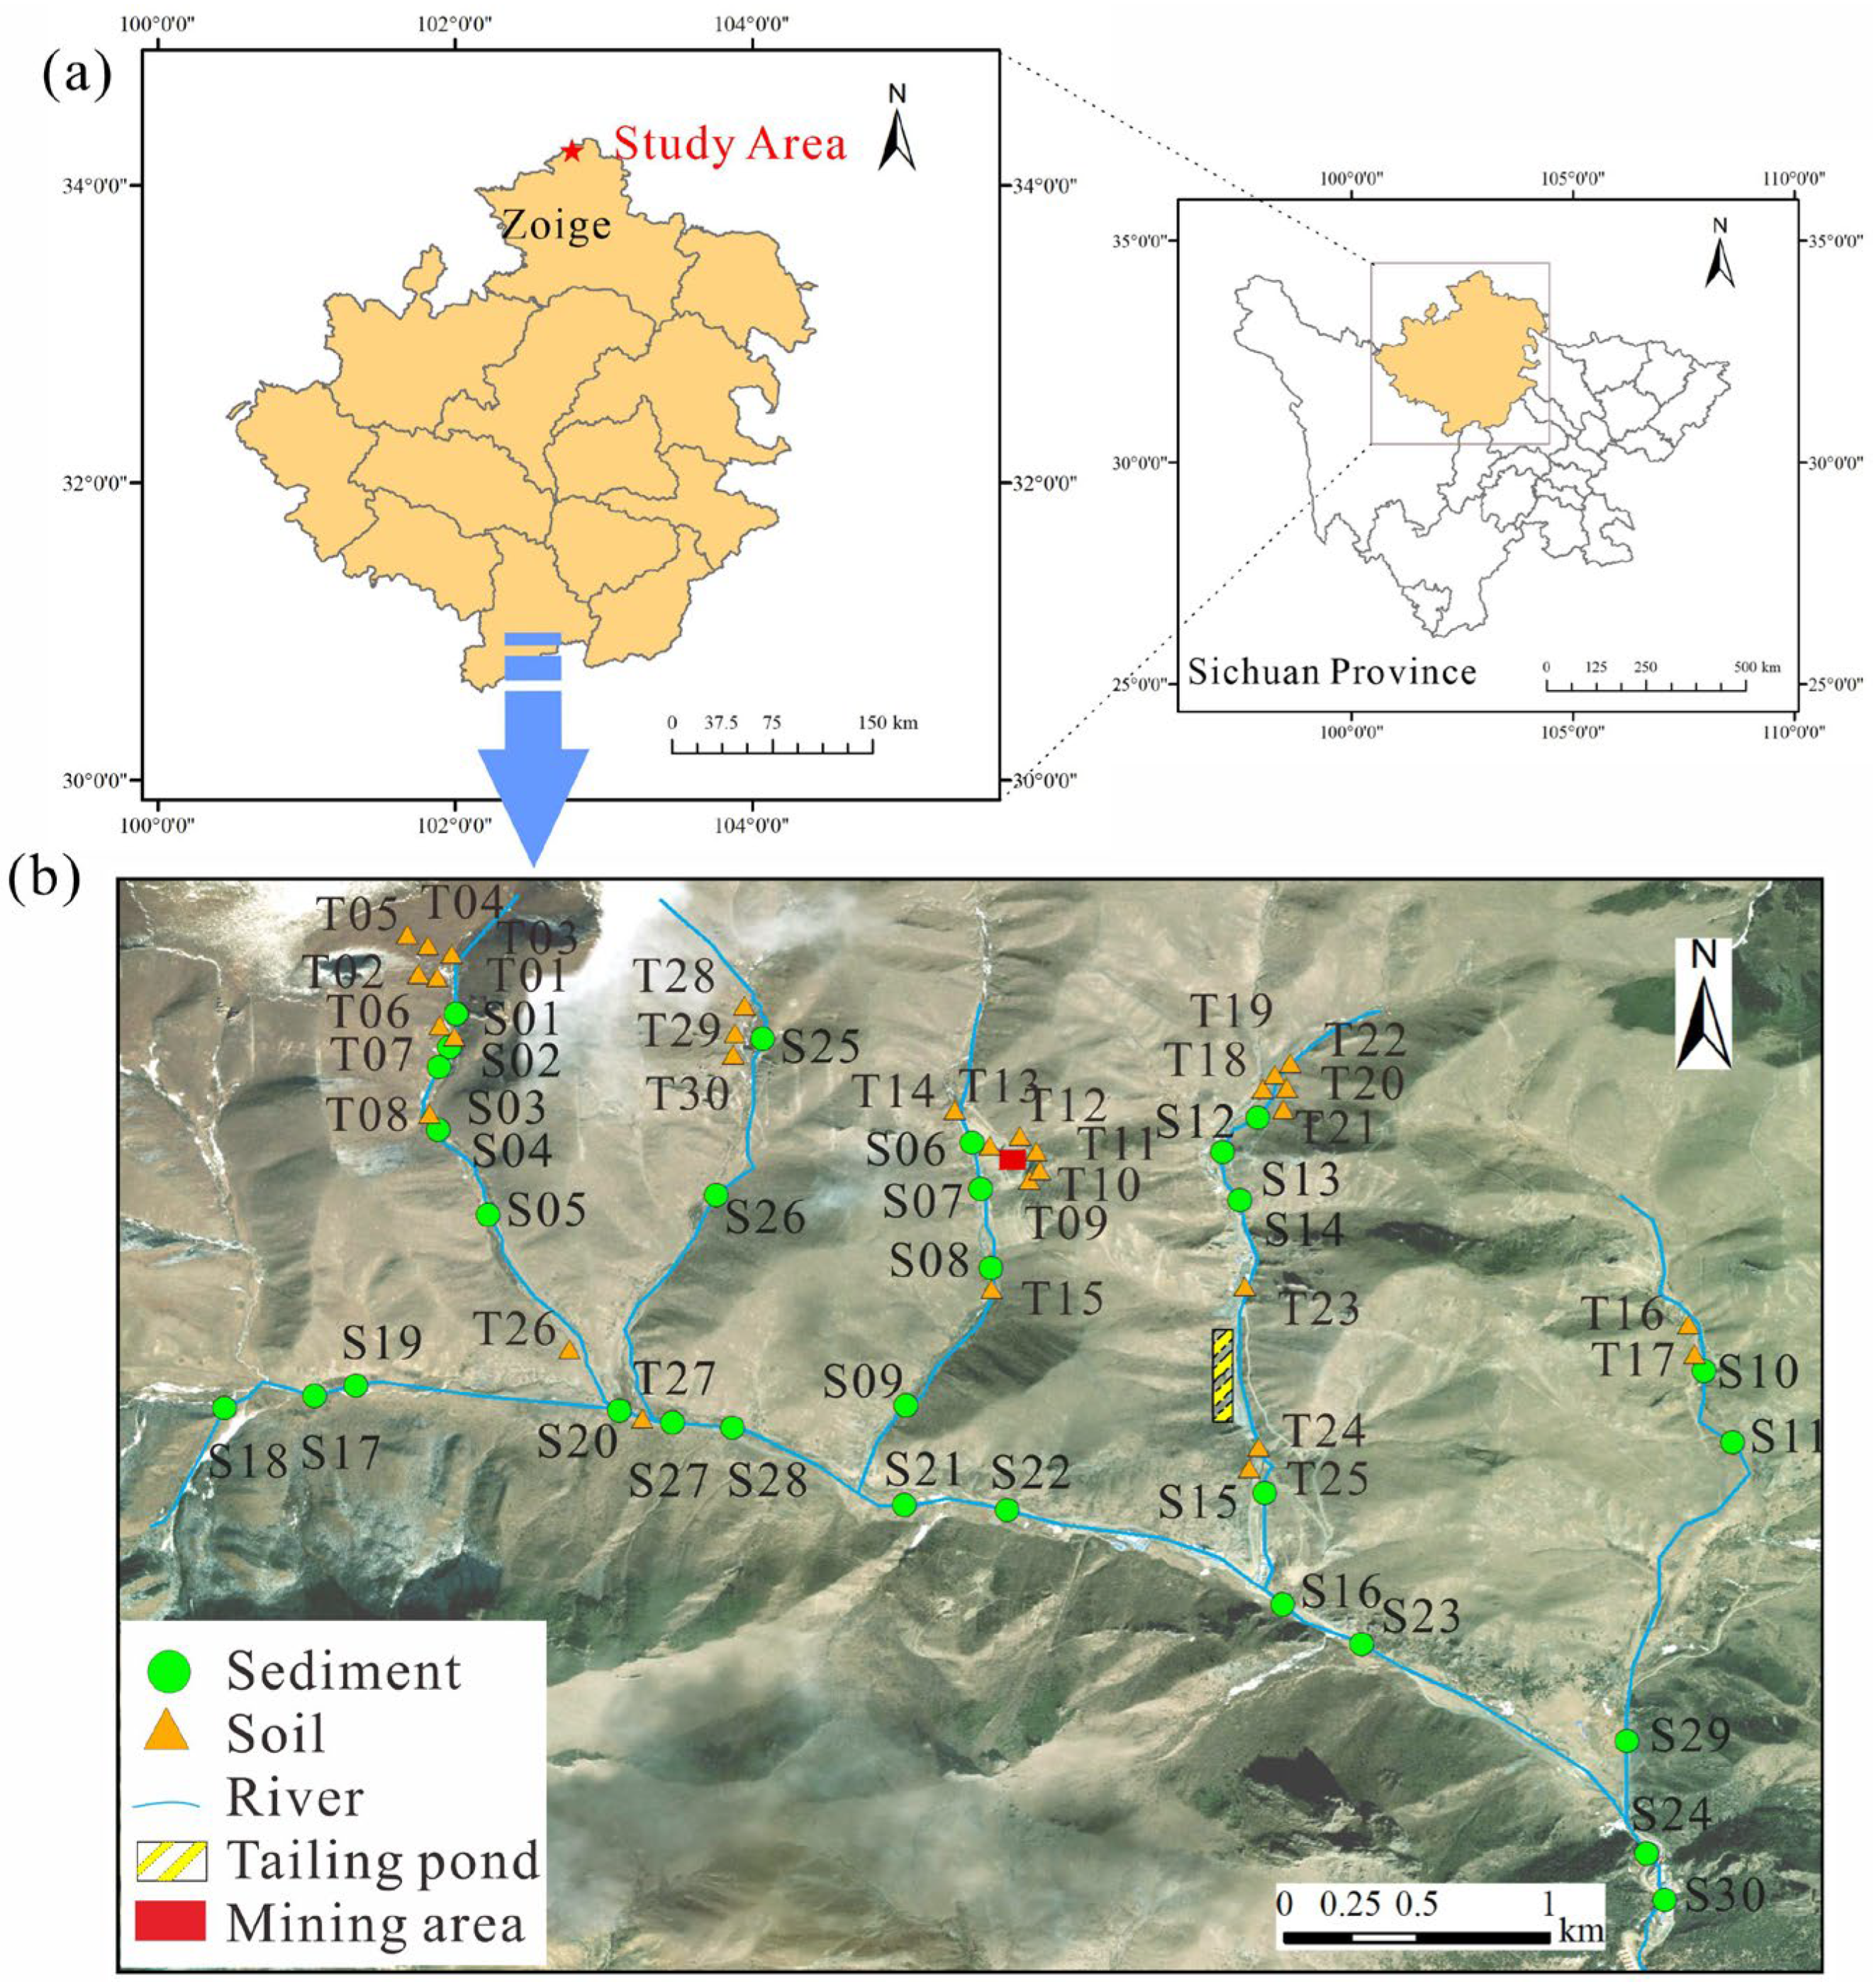
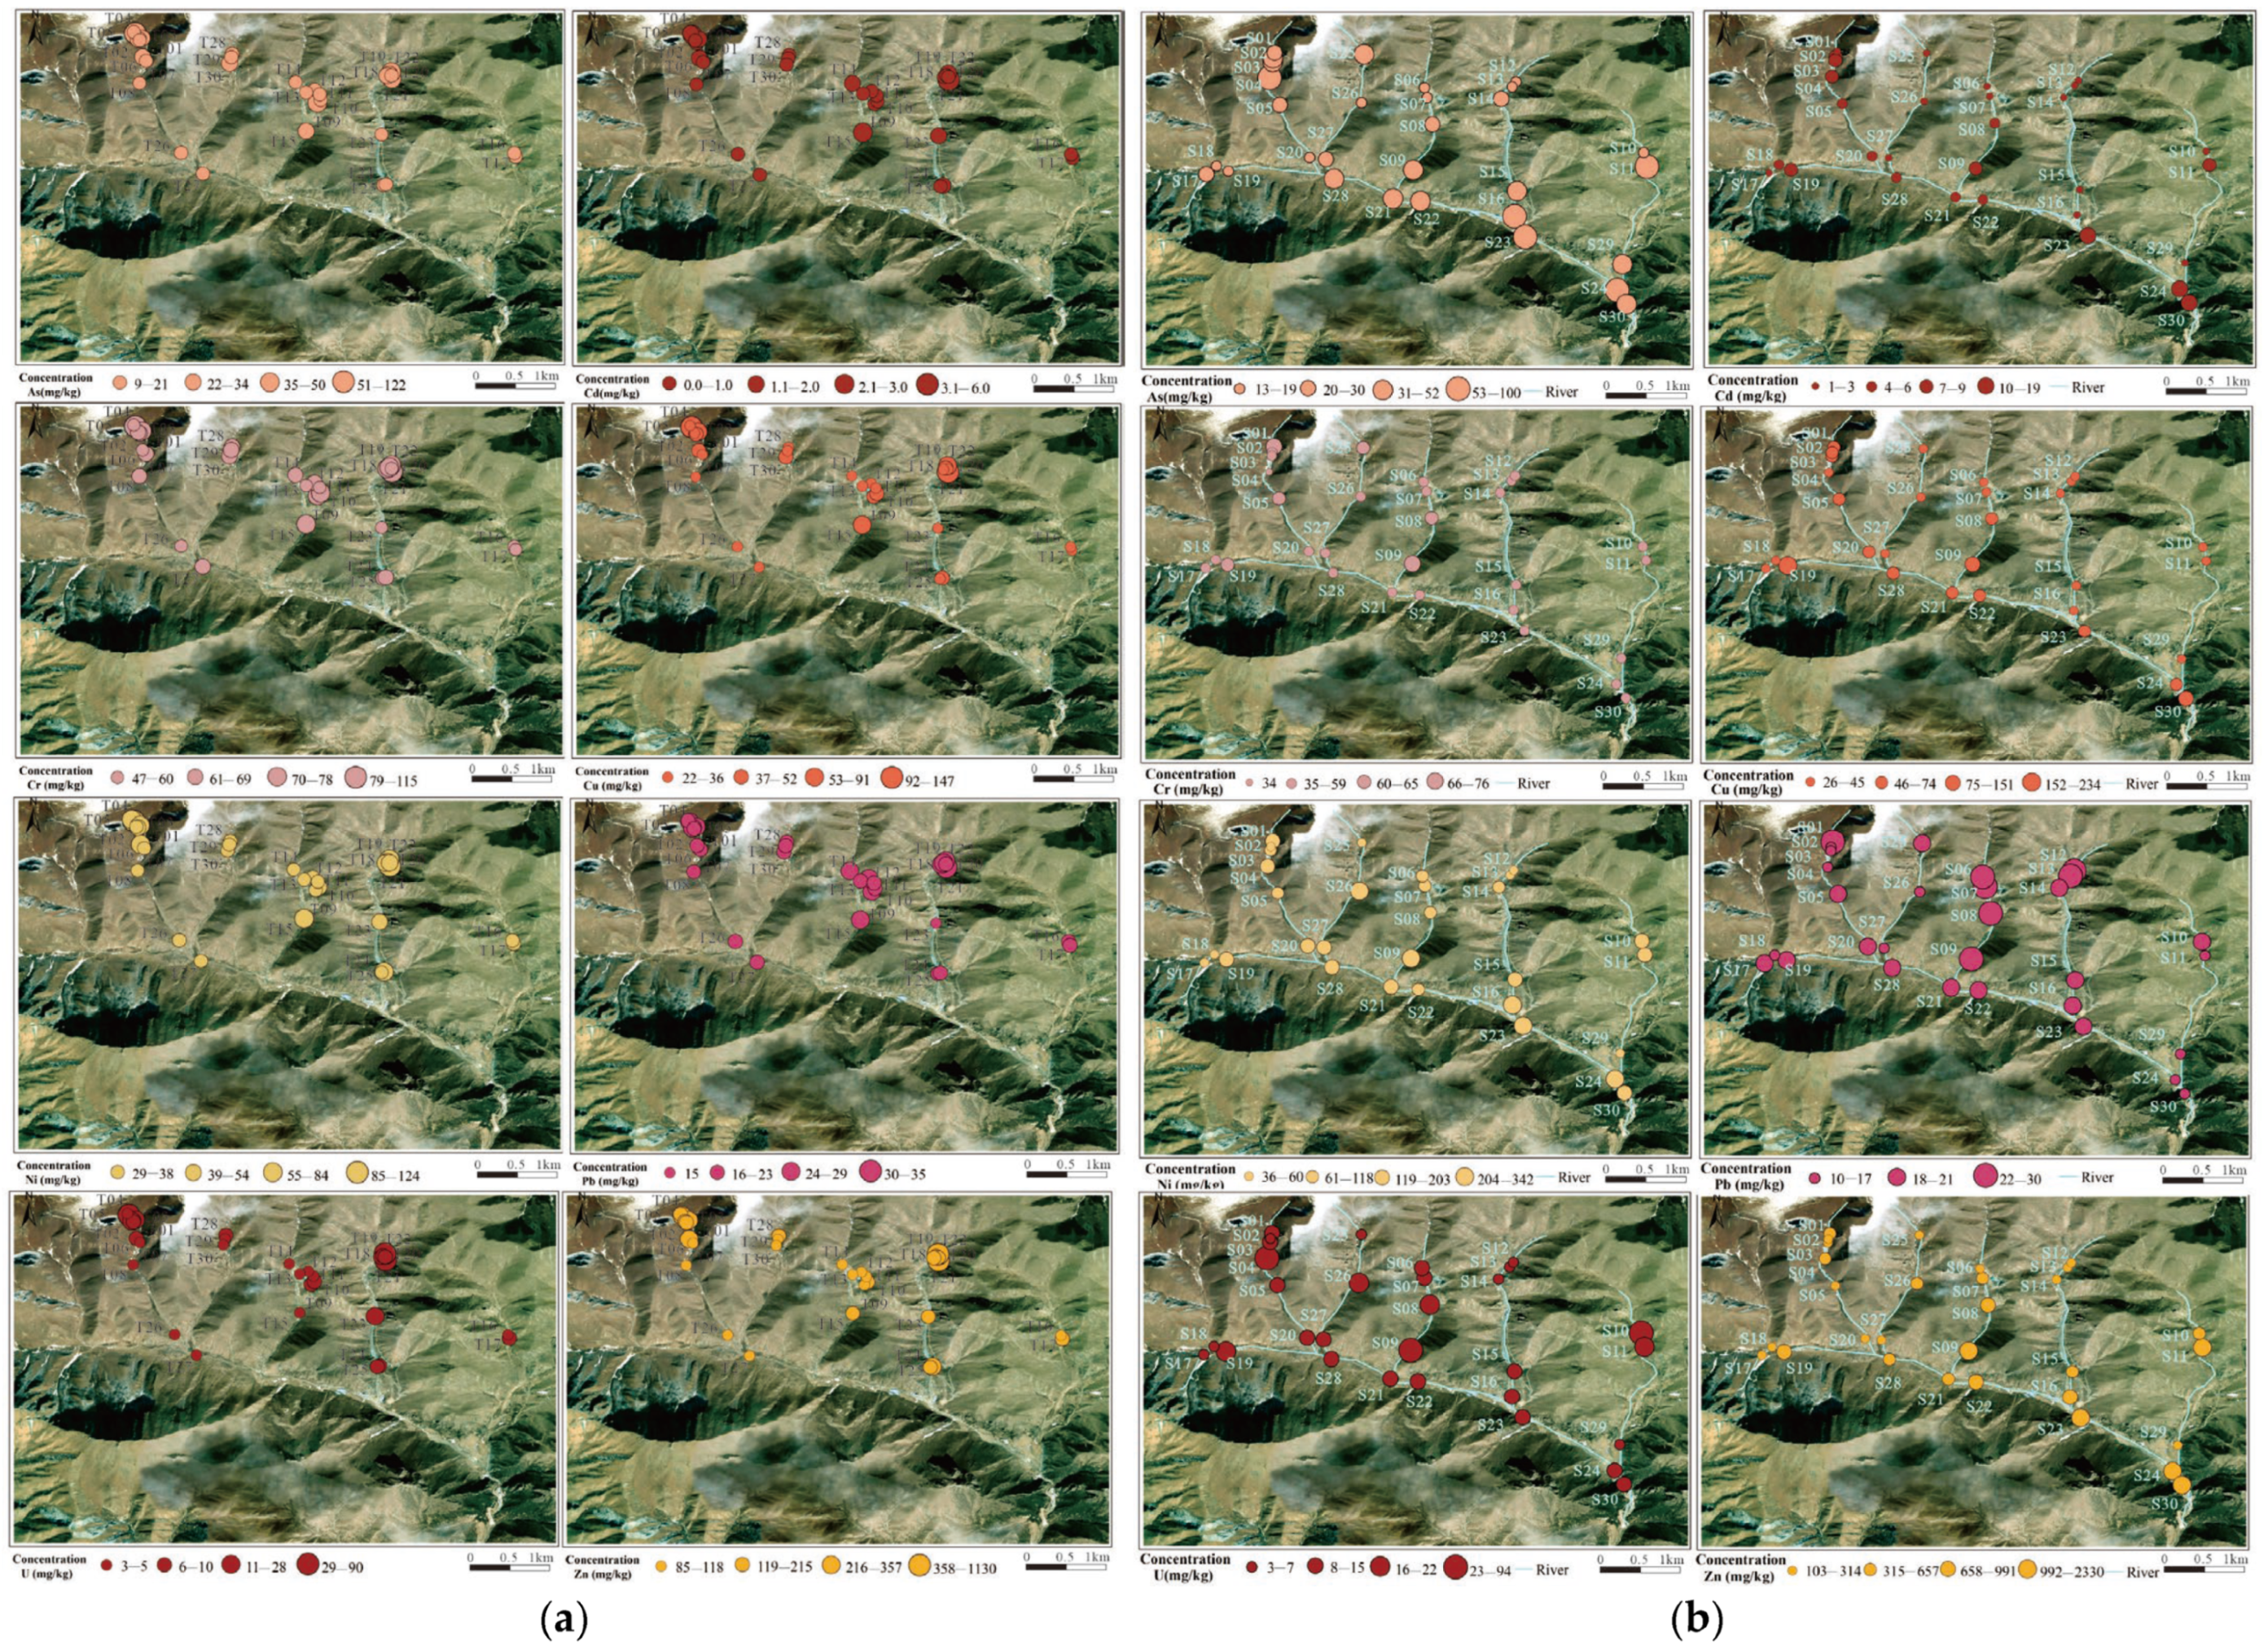
As shown in
Figure 7, the distribution of As, Cd, Cr, Cu, Ni, Pb, Zn, and U in the surface soil of the study area is related to the distribution of uranium ore bodies or tailings ponds, with high-value areas mainly located at the T14 sampling point in the northwest of the mining area—on the ore-rich lithological zone—and at the T15 sampling point in the south of the mining area, as well as the T23 and T25 sampling points near the tailings pond. The average concentration of Pb is lower than the soil background value of Sichuan Province, and its distribution is relatively uniform, with a small coefficient of variation, likely influenced by geological background materials and weathering accumulation, with minimal impact from human activities. The higher heavy metal concentrations in the soil near the tailings pond may be due to the accumulation of tailings and the leaching of heavy metal ions into the soil by rainwater.
The spatial distribution of heavy metal concentrations in the sediments around the Zoige uranium mining area is shown in
Figure 7b. The overall spatial distribution of heavy metals is characterized by the highest concentrations along the east–west trending ore bodies, downstream of the mining area and tailings pond, or at river confluences. The concentrations of Cr and Pb are lower than the soil background value of Sichuan Province, with small coefficients of variation, indicating minimal influence from human activities, and their distribution may be related to the natural geological background. The distribution of Cu differs from that of Cr and Pb, with higher concentrations at points S09, S19, and S30, possibly due to influences from human mining activities or other factors, in addition to the natural background. The highest concentration of Ni is found in Ⅵ, likely resulting from the deposition of Ni-bearing suspended particles carried by water flow from other gullies into the Sumulitanggou. The concentration of Zn increases downstream in Ⅲ, Ⅳ, and Ⅴ, while in Ⅵ higher Zn concentrations are observed at river confluences, such as at sampling points S23 at the confluence of Ⅳ and Ⅵ, and downstream points S24 and S30. The spatial distribution of U, particularly the high-concentration areas, is closely related to the east–west trend of the uranium ore bodies. For example, sampling points S04, S26, S08, and S10 from east to west are located in high-concentration zones of U within their respective gullies. Additionally, the U concentration at point S09 is 55 mg/kg, likely due to U from the open-pit mining area in Ⅲ being leached by rainwater and transported downstream by flowing water, where it is subsequently deposited.
3.5. Source Apportionment by Positive Matrix Factorization
Correlation analysis (
Figure 5) revealed distinct geochemical groupings among PTEs: Ni-Zn (r
2 = 0.92), Ni-Cd (r
2 = 0.87), U-Zn (r
2 = 0.86), Cd-Cu (r
2 = 0.85), Cd-Zn (r
2 = 0.84), and Cu-Ni (r
2 = 0.83) exhibited congeneric behavior, suggesting a shared lithogenic or anthropogenic source (e.g., uranium ore processing or sulfide weathering). As showed moderate correlations with U and six other metals (Cd, Cr, Cu, Ni, Zn), while U correlated similarly (r
2 = 0.5–0.7) with As, Cd, Cr, Cu, Ni, and Zn. This pattern implies potential redox-driven coprecipitation or joint mobilization via organic complexes. Pb demonstrated weak correlations (r
2 < 0.4) with Cd, Ni, U, and Zn, and Cr exhibited limited associations (r
2 < 0.40) with other metals. Their geochemical decoupling likely reflects distinct sources, such as Pb, atmospheric deposition from legacy leaded fuels or isolated mineral phases.
Intermediate correlations were observed for Ni-Zn (r2 = 0.81), Cd-Cu (r2 = 0.8), Cu-Zn (r2 = 0.73), U-Zn (r2 = 0.68), U-Ni (r2 = 0.65), Cd-Zn (r2 = 0.64), Cr-Pb (r2 = 0.63), Cu-Ni (r2 = 0.63), and As-Ni (r2 = 0.61), indicative of overlapping transport pathways. Cd-Pb showed significant anticorrelation, likely due to competitive adsorption on clay minerals or phase-specific sequestration.
For enhanced source discrimination, data were processed using EPA PMF 5.0 (a US EPA-developed Positive Matrix Factorization program). Repeated runs were performed by setting 3–5 factors. The optimal number of factors was determined when Qrobust/Qtrue exhibited a sharp decline, with increasing factor numbers.
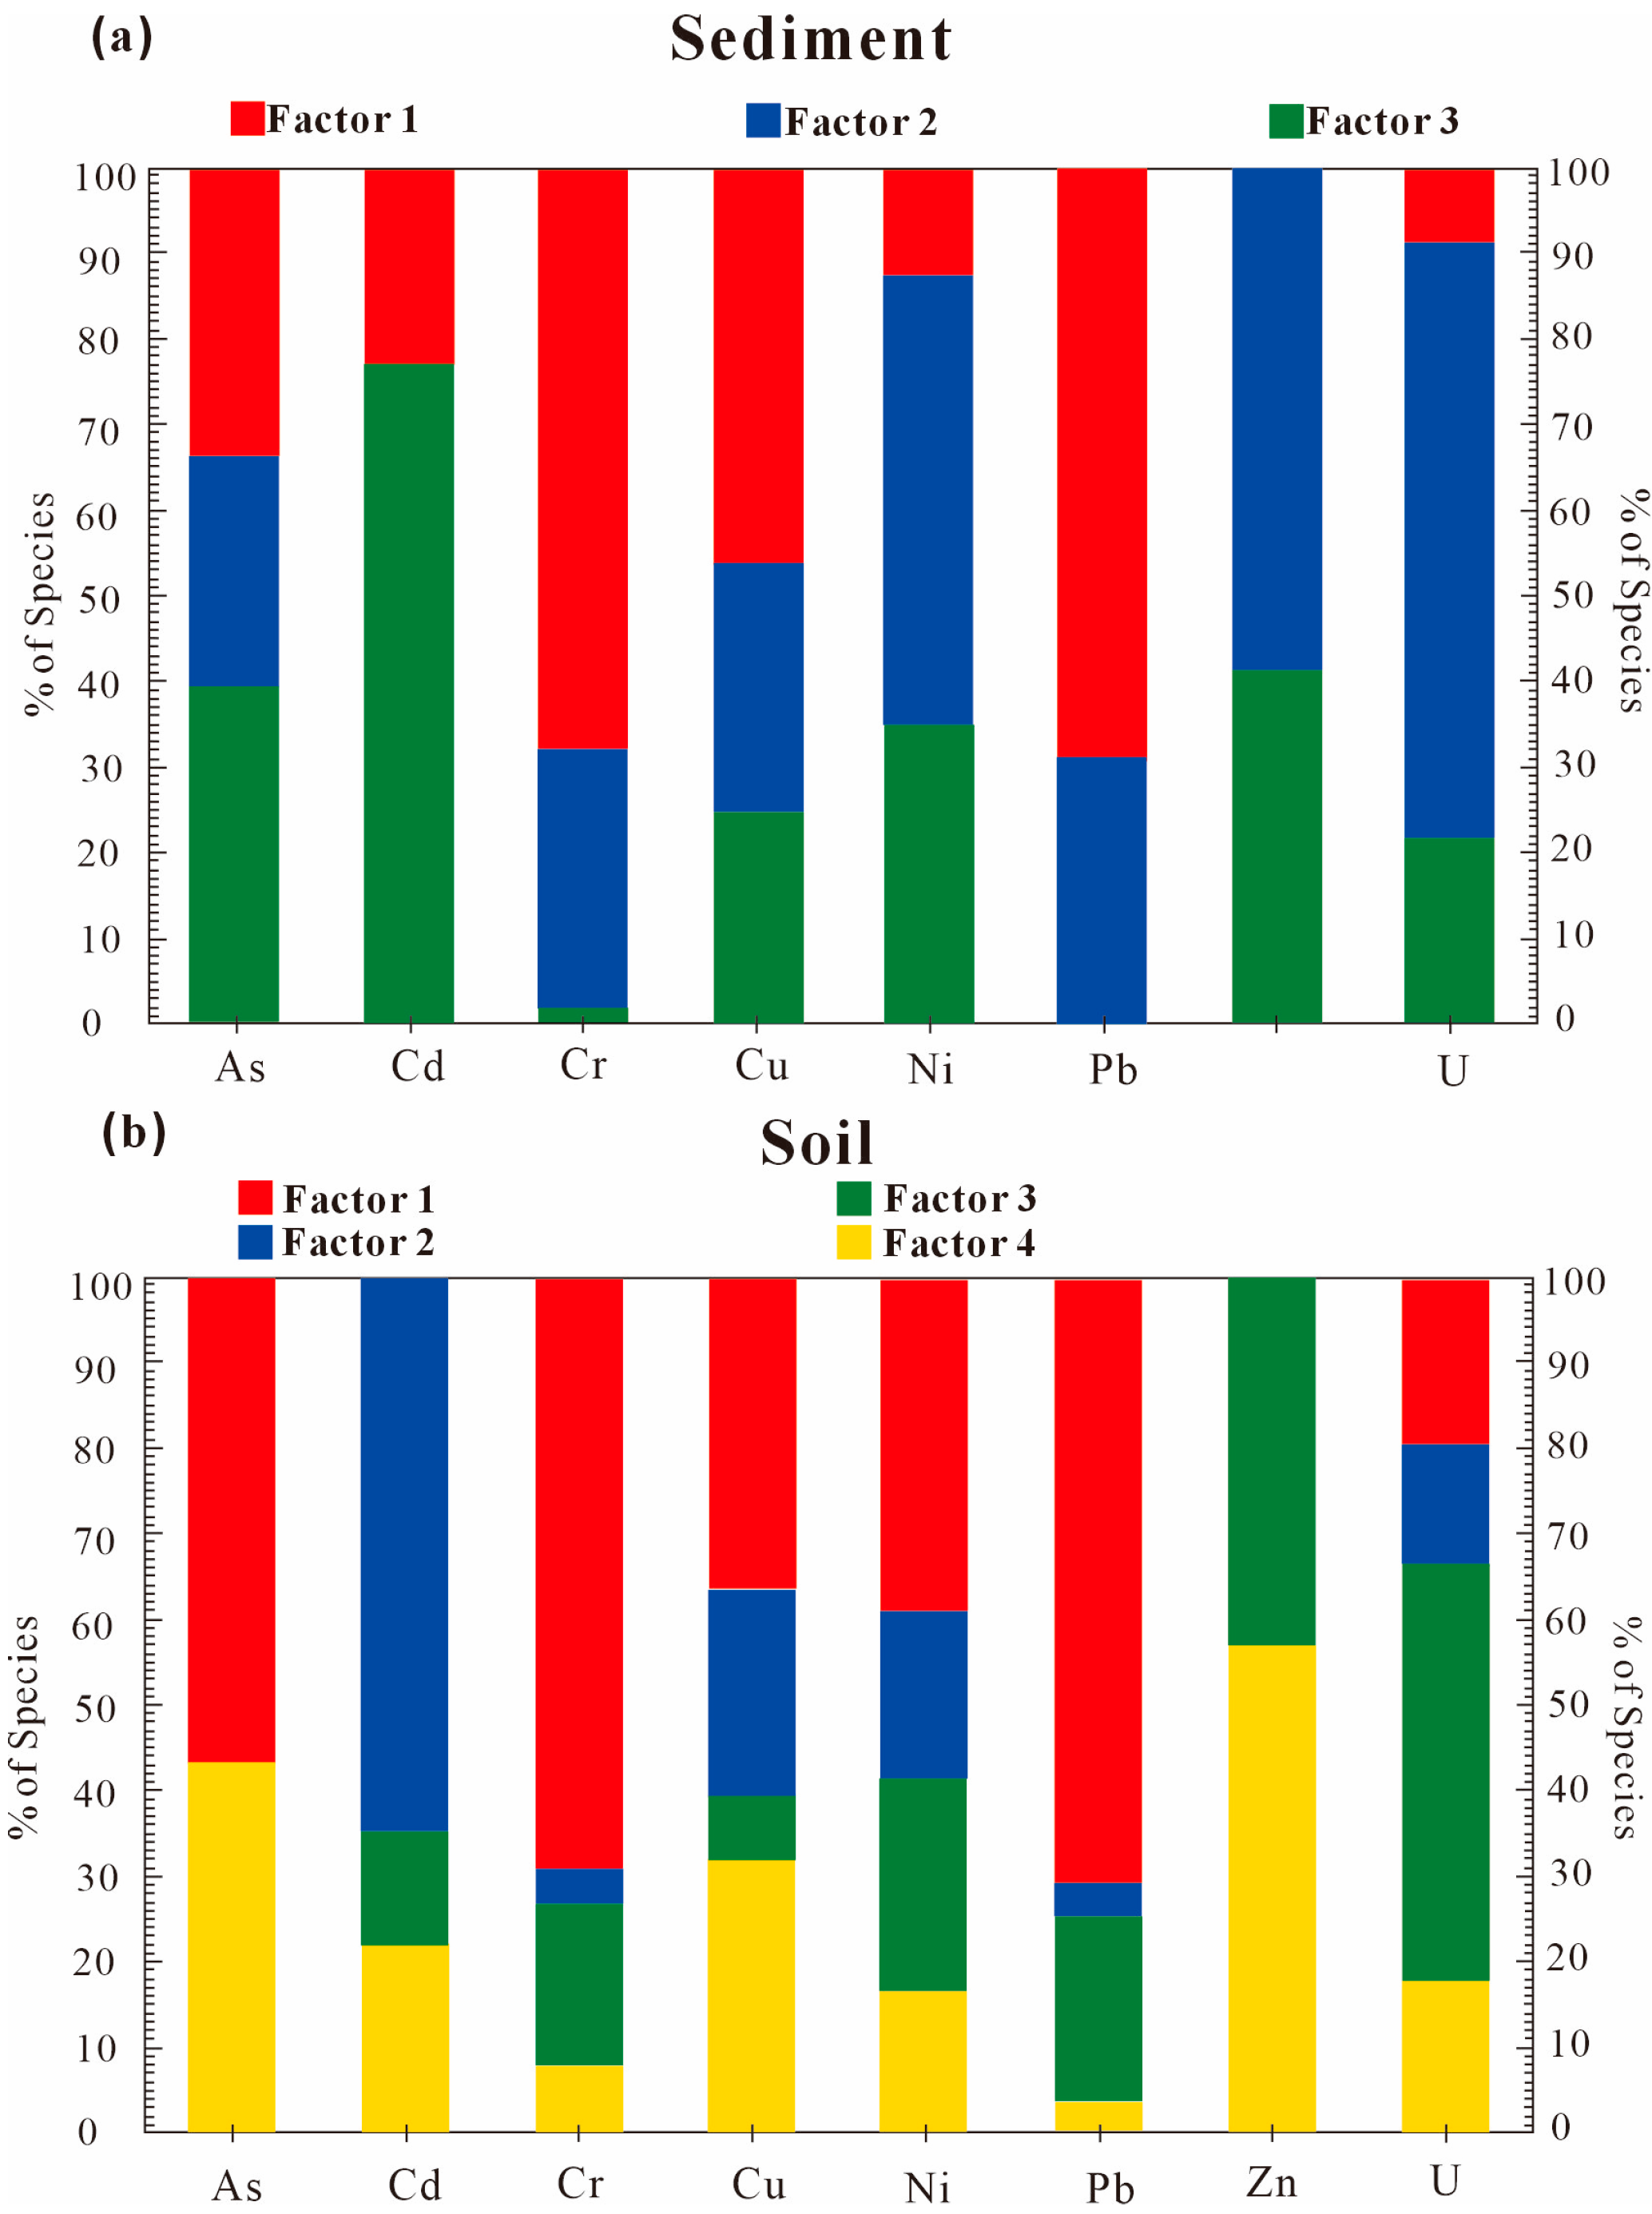
Factor 1 is a natural lithogenic source in
Figure 8, with Pb (71%) > Cr (69%) > As (57%) > Ni (40%) > Cu (37%), Cr and Pb, showing highly significant correlation. Cr and Pb concentrations are below Sichuan soil background values, with low coefficients of variation (Cr: 0.18; Pb: 0.15). I
geo < 0 and BCR sequential extraction results reveal >80% of Cr, Pb reside in residual fractions (silicate-bound), indicating minimal anthropogenic influence.
Factor 2 is an anthropogenic–natural composite source. Ranked in descending order of contribution loadings are the following: Cd (65%) > Cu (24%) > Ni (20%) > Zn (13%). Cd, with mean content higher than the Sichuan background, Cd-Cu (r = 0.85, p < 0.01), and Cd-Zn (r = 0.84, p < 0.01), have strong pairwise correlations. Localized enrichment in Zone IV (ore processing/tailing areas) is linked to sulfidic mineral smelting and uranium leaching.
Factor 3 is mining-related pollution. Ranked in descending order of contribution loadings are Zn (49%) > U (43%) > Ni (25%) > Pb (22%). U and Zn (coefficients of variation: 1.5 and 1.0, respectively) and elevated concentrations coincide with smelters and active mining zones.
Factor 4 is Uranium–As geogenic activity. Ranked in descending order of contribution loadings are U (57%) > As (43%) > Cu (32%). U-As co-mobilization via uranyl arsenate complexes (e.g., autunite/metatorbernite precipitation) is triggered by weathering of uraniferous tailings. Cement-sealed, yet unmanaged, waste ores act as persistent U and As sources during rainfall leaching.
In fluvial sediments, Factor 1 is the Lithogenic background. Ranked in descending order of contribution loadings are Pb (69%) > Cr (68%) > Cu (46%) > As (33%). Low variability (Cr: CV = 0.13; Pb: CV = 0.16) and sub-background concentrations align with chalcophile/siderophile-element behavior in erosional regimes [
49].
Factor 2 presented elevated loadings for U (70%), Zn (59%), and Ni (53%), where As, Cr, Cu, and Pb showed secondary loadings. Notably, sediment uranium concentrations exceeded the Chinese soil background value 5.57-fold (CV = 1.15), indicating substantial anthropogenic inputs. Spatial mapping revealed that U hotspots (
Figure S1) align linearly with east–west trending uranium ore belts (Mann–Whitney U = 187,
p < 0.001). We attribute this pattern to the long-term leaching of U-bearing acid mine drainage (AMD) from adjacent mining operations, consistent with prior findings in uranium-enriched catchments.
Factor 3 was characterized by significant loadings of Cd (77%), Zn (41%), As (40%), and Ni (35%). The strong Cd-Zn covariation (r = 0.89, p < 0.001) parallels their co-occurrence in vehicular lubricants and tire additives. Concurrently, As-Ni-Zn anomalies corresponded spatially with legacy tailings ponds (Kruskal–Wallis H = 23.7, p < 0.01), implicating combined mechanisms: (1) atmospheric deposition from vehicle emissions; (2) leachate infiltration from mining waste reservoirs. Factor 3, therefore, represents a mixed source involving mining transport activities and weathering of metallogenic parent materials.
3.6. Risk Assessment of PTEs
3.6.1. Geo-Accumulation Index
The geo-accumulation index indicates that, except for Cr and Pb, the elements As, Cd, Cu, Ni, Zn, and U in the soil and sediments exhibit varying degrees of pollution in
Figure 9. Statistical analysis of the geo-accumulation index evaluation results is provided in the
Supplementary Materials (Tables S1–S16). Overall, Cd in the soil is classified as heavily polluted, with 53.33% of the soil samples showing strong or higher levels of Cd pollution, and the geo-accumulation index ranging from 1.52 to 5.62. U in the soil is generally classified as lightly to moderately polluted, with the geo-accumulation index ranging from −0.66 to 4.29, spanning pollution levels from non-polluted to strong–extremely-severe pollution. Among these, 20% of the samples are non-polluted, 53.33% are lightly to moderately polluted, and a few samples reach strong to extremely severe pollution levels. This is mainly due to the proximity of samples T14, T15, and T25 to the tailings pond and mining area, resulting in relatively higher pollution levels. The overall pollution level of As in the soil is classified as light to moderate, with the geo-accumulation index ranging from −0.76 to 2.96, spanning pollution levels from non-polluted to moderate–strong pollution. Among these, 60% of the samples are lightly to moderately polluted, 20% are non-polluted, and a few samples reach moderate or moderate–strong pollution levels, mainly due to their proximity to the mining area and tailings pond. The overall pollution level of Zn in the soil is relatively weak, with the geo-accumulation index ranging from −0.16 to 3.12, spanning pollution levels from non-polluted to moderate–strong pollution. Among these, 50% of the samples are non-polluted, and 33% are lightly to moderately polluted. The pollution levels of Cu and Ni in the soil are relatively weak, with a high proportion of non-polluted samples, accounting for 73.33% and 70% of the samples, respectively.
In the sediments, Cd is, overall, classified as extremely severe pollution, with the geo-accumulation index ranging from 2.41 to 7.32, spanning pollution levels from moderate–strong pollution to extremely severe pollution. Among the samples in the study area, 90% of the sediment samples show strong or higher levels of Cd pollution. U in the sediments is generally classified as moderate pollution, with the geo-accumulation index ranging from −0.56 to 4.35, spanning pollution levels from non-polluted to strong–extremely severe pollution. Among these, 53% are moderately polluted, 17% are lightly to moderately polluted, 20% are strongly or extremely severely polluted, and 10% are non-polluted. As in the sediments is generally classified as light–moderate pollution and moderate pollution, with the geo-accumulation index ranging from −0.31 to 2.89, spanning pollution levels from non-polluted to moderate–strong pollution. Among these, 37% are lightly to moderately polluted, 37% are moderately polluted, and 13% are non-polluted or moderately-strongly polluted. In the sediments, Zn is overall classified as moderate pollution, with the geo-accumulation index ranging from −0.33 to 4.17, spanning pollution levels from non-polluted to strong–extremely severe pollution. Among these, 37% of the samples are moderately polluted, and 37% are moderately-strongly or more severely polluted. Ni in the sediments is generally classified as moderate pollution, with the geo-accumulation index ranging from −0.43 to 2.81, spanning pollution levels from non-polluted to moderate–strong pollution. Among these, 40% are moderately polluted, 27% are moderately-strongly polluted, and 13% and 20% are non-polluted and lightly to moderately polluted, respectively. The pollution level of Cu in the soil is relatively weak, with a high proportion of non-polluted samples at 53%, lightly to moderately polluted samples at 37%, and moderately polluted and moderately-strongly polluted samples at 7% and 3%, respectively.
3.6.2. The Contamination Factor
The CF of Cd in the surface soil of the study area is the highest, followed by U, As, and Zn. The PLI results for the surface soil in the study area are shown in
Figure 10a. The PLI for sample T14, located in the northwest of the mining area, is 6.01, while the PLI for samples T25 and T23, located south and north of the tailings pond, are 5.79 and 3.29, respectively, indicating extremely strong pollution. Most of the remaining samples are moderately to strongly polluted. The PLI values for samples T14, T15, T23, and T25 in the study area are significantly higher, reaching extremely strong pollution levels, primarily due to their proximity to the open-pit mining area and tailings pond.
In the sediments, the CF of Cd is the highest, followed by U, As, and Zn, while Cr and Pb have the lowest CF. The PLI results for the sediments in the study area are shown in
Figure 10. The PLI for sample S09 is 7.63, followed by samples S23 and S24 with PLI values of 5.38 and 5.52, respectively. The PLI values for samples S09, S23, and S24 in the study area are significantly higher, reaching extremely strong pollution levels, likely due to their proximity to the open-pit mining area and downstream regions of the tailings pond. When rivers flow through pollution sources, PTEs are adsorbed into the sediments, and the sediments carrying PTEs are deposited downstream, due to gravity, resulting in pollution in the downstream areas of the pollution sources.
The calculated comprehensive PLI for the surface soil in the study area is 1.78, indicating an overall moderate pollution level. This suggests that the soil environmental quality in the study area is significantly influenced by human activities, in addition to the natural geological background. The PLI levels of the 30 sampling points in the area were classified, and the results are shown in
Table 8. Among these, 70% of the samples are moderately polluted, 16.7% are strongly polluted, and 13.3% are extremely strongly polluted. The comprehensive PLI for the sediments is 2.99, indicating an overall strong pollution level. The PLI levels of all sampling points were classified and statistically analyzed, and the results are shown in
Table 9. Among these, 20% of the samples are moderately polluted, 30% are strongly polluted, and 50% are extremely strongly polluted.
3.6.3. Potential Ecological Risk
The PERI method was used to assess the pollution levels of eight PTEs in the soil and sediment, and the evaluation results are shown in
Table 9 and
Table 10. The average single potential ecological risk indices of the eight PTEs in the study area are ranked as Cd > U > As > Ni > Cu > Pb > Zn > Cr. Among these, the single-factor potential ecological risk indices of Cr, Cu, Ni, Pb, and Zn are all less than 40, indicating a slight risk level. The main potential ecological risk factors in the study area are As, Cd, and U. This is partly due to their high toxicity coefficients, which are 10, 30, and 20, respectively, contributing significantly to the single PERI. On the other hand, it is due to the varying degrees of enrichment of these three PTEs in the study area. The comprehensive PERI ranges from 180 to 2746, with an average of 684. Strong risk accounts for 36.7%, moderate and very strong risk account for 23.3% and 26.7%, respectively, and extremely strong risk accounts for 13.3%, indicating an overall high ecological risk.
The average single potential ecological risk indices of the eight PTEs in the sediments of the study area are ranked as Cd > U > As > Ni > Cu > Zn > Pb > Cr. Among these, the single-factor potential ecological risk indices of Cr, Cu, Pb, and Zn are all less than 40, indicating a slight risk level. The main potential ecological risk factor in the study area is Cd, followed by U and As. The comprehensive PERI ranges from 294 to 7408, with an average of 2183. Extremely strong risk accounts for 53.3%, very strong risk accounts for 23.3%, and moderate and strong risk account for 3.3% and 10%, respectively. The overall ecological risk is high, and should be given significant attention.
3.6.4. Potential Human Health Risk
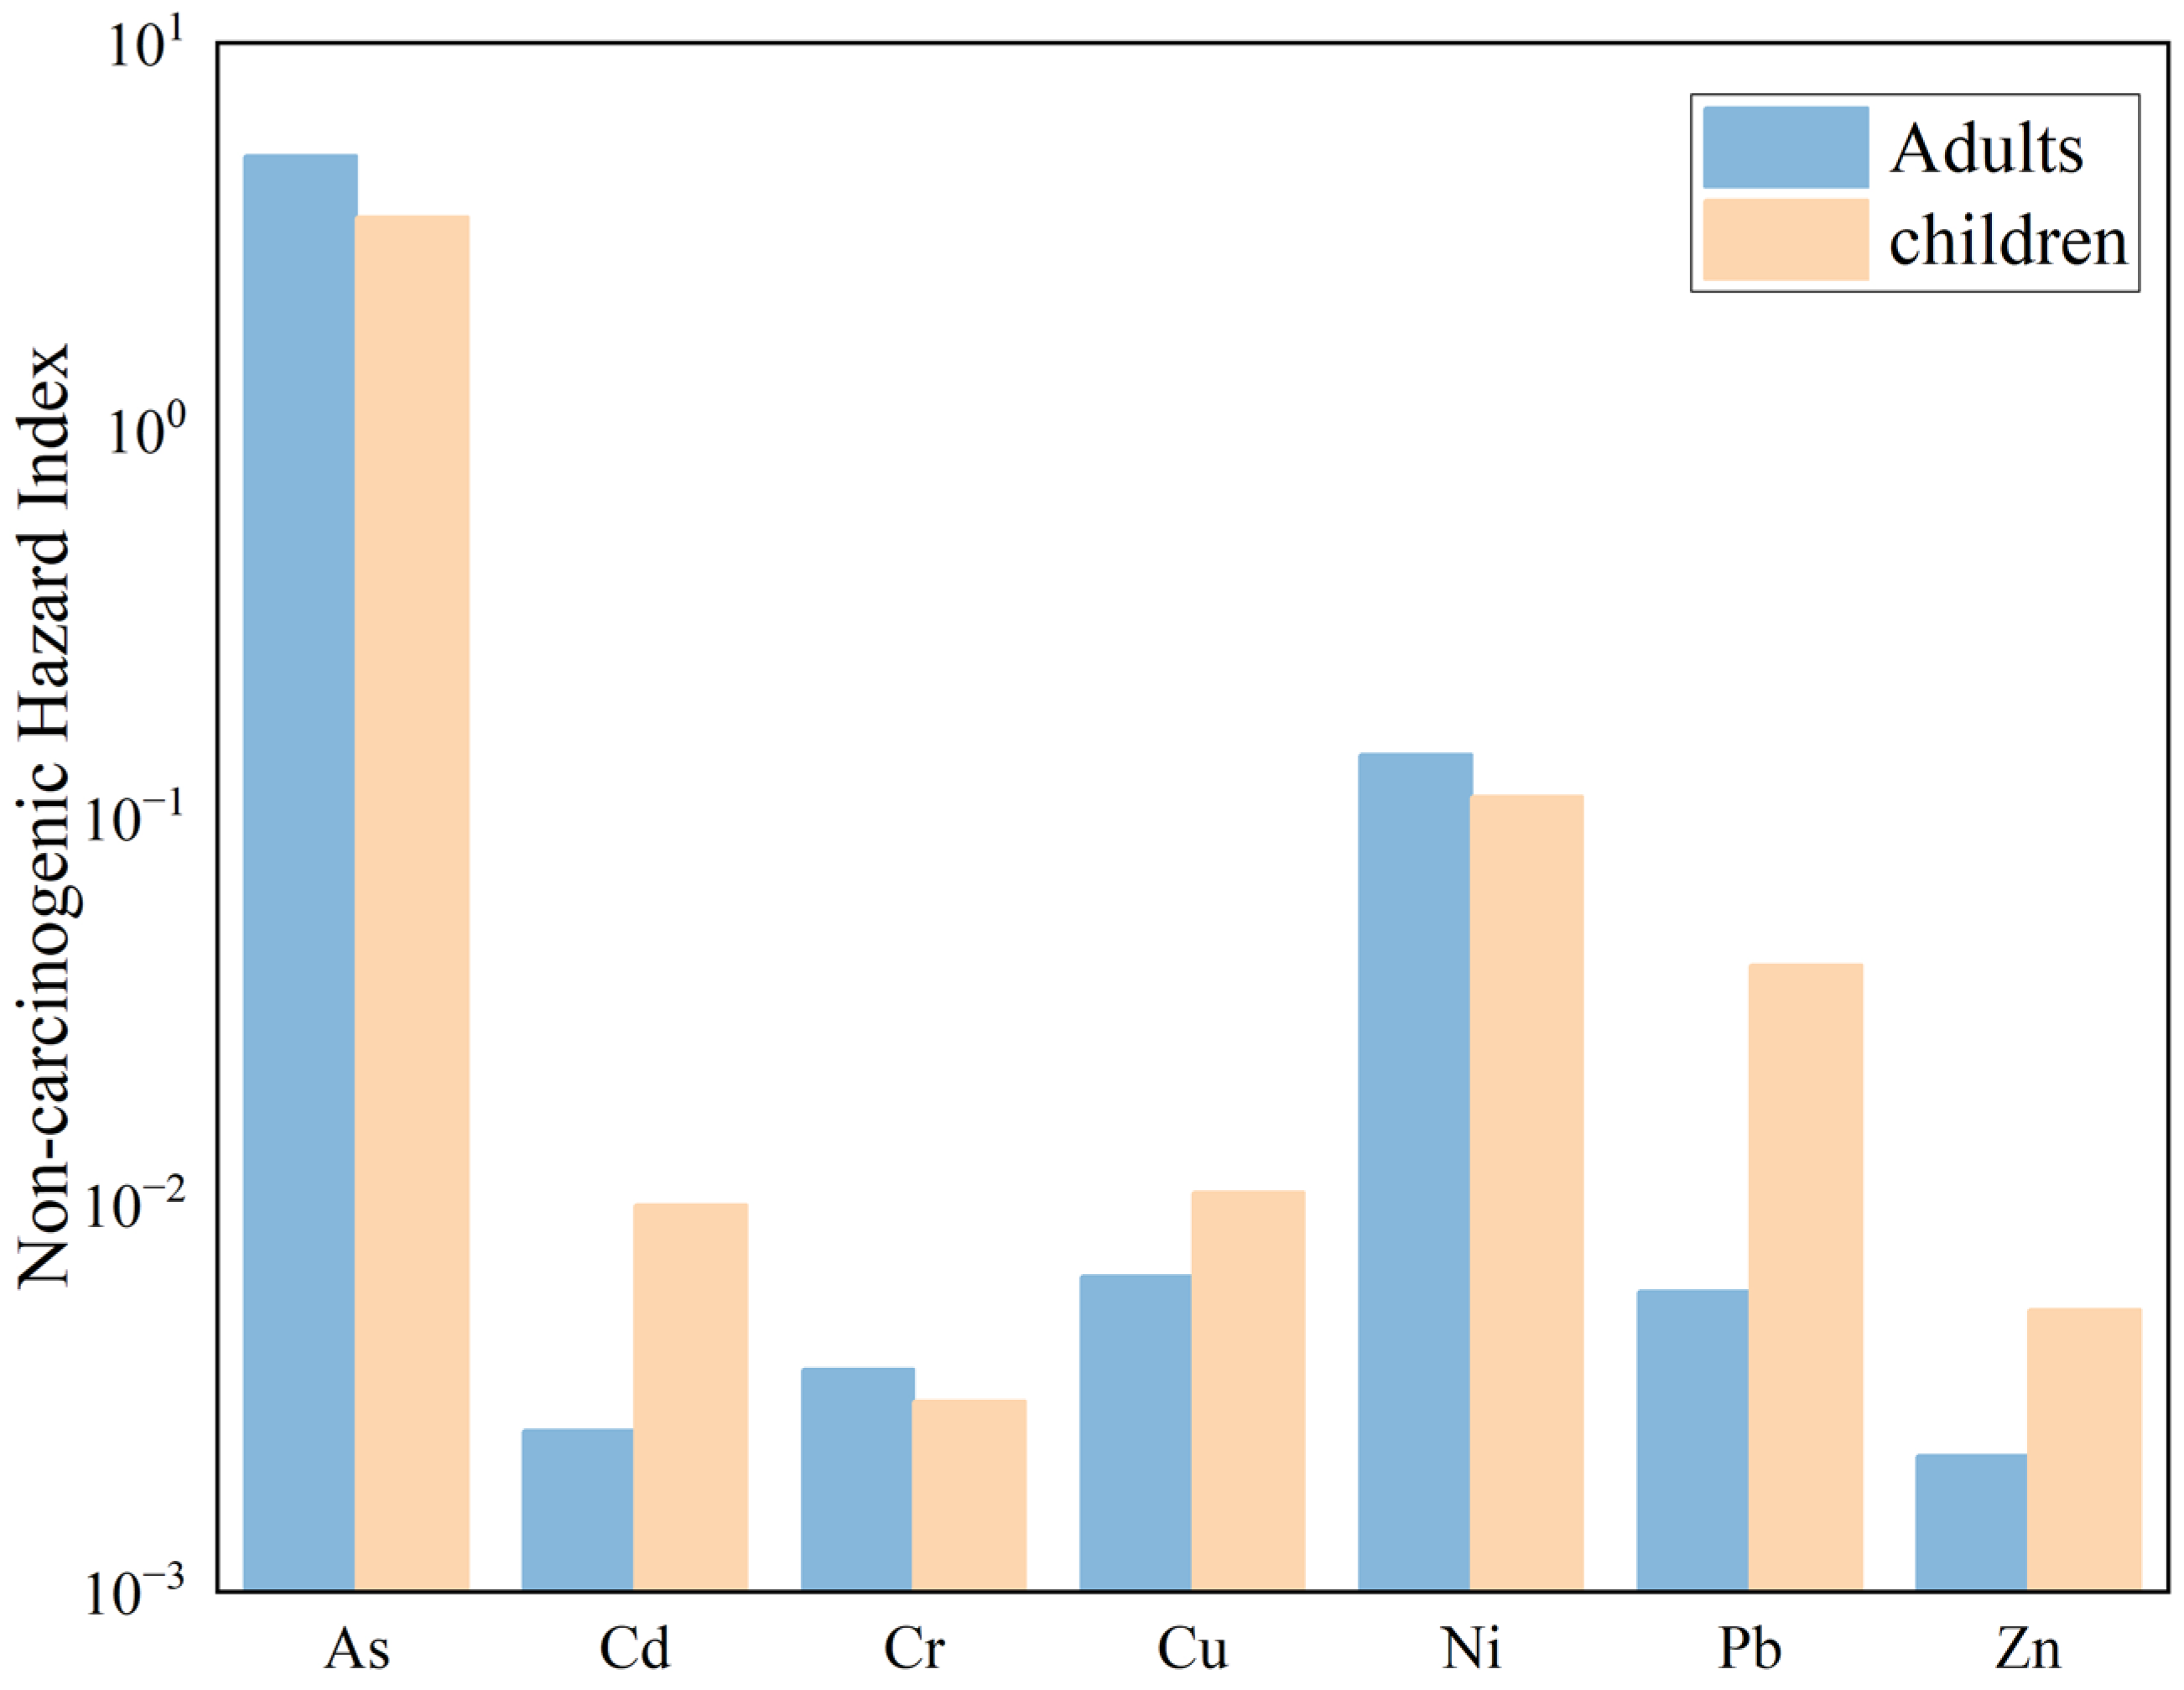
A non-carcinogenic health risk assessment was conducted for PTEs in the surface soil of the Zoige uranium mining area under three exposure pathways, and the results are shown in
Figure 11. The single non-carcinogenic health risk indices (HQ) for adults exposed to PTEs through oral ingestion, dermal contact, and inhalation are as follows: As (5.11 × 10
0), Cd (2.61 × 10
−3), Cr (3.76 × 10
−3), Cu (6.50 × 10
−3), Ni (1.45 × 10
−1), Pb (5.94 × 10
−3), and Zn (2.24 × 10
−3). Except for As, for which the HQ value is greater than 1, the HQ values of the other PTEs are all less than 1, indicating that As poses a certain potential hazard to adults. The total non-carcinogenic risk index (HI) for adults is 5.27 × 10
0, and since HI is greater than 1, it indicates that the exposure exceeds the threshold, suggesting a relatively high non-carcinogenic risk that requires attention. Overall, the PTEs in the soil of the Zoige uranium mining area pose a high non-carcinogenic risk to adults.
The single non-carcinogenic health risk indices (HQ) for children exposed to PTEs through oral ingestion, dermal contact, and inhalation are as follows: As (3.52 × 100), Cd (9.93 × 10⁻³), Cr (3.11 × 10⁻³), Cu (1.07 × 10⁻²), Ni (1.13 × 10⁻¹), Pb (4.14 × 10⁻²), and Zn (5.23 × 10⁻³). Among these, the HQ value for As is greater than 1, indicating that As also poses a non-carcinogenic risk to children. The total non-carcinogenic risk index (HI) for children is 3.72 × 100, and since HI is greater than 1, it indicates that the exposure exceeds the threshold, suggesting a relatively high non-carcinogenic risk. Therefore, the PTEs in the soil of the Zoige uranium mining area also pose a high non-carcinogenic risk to children.
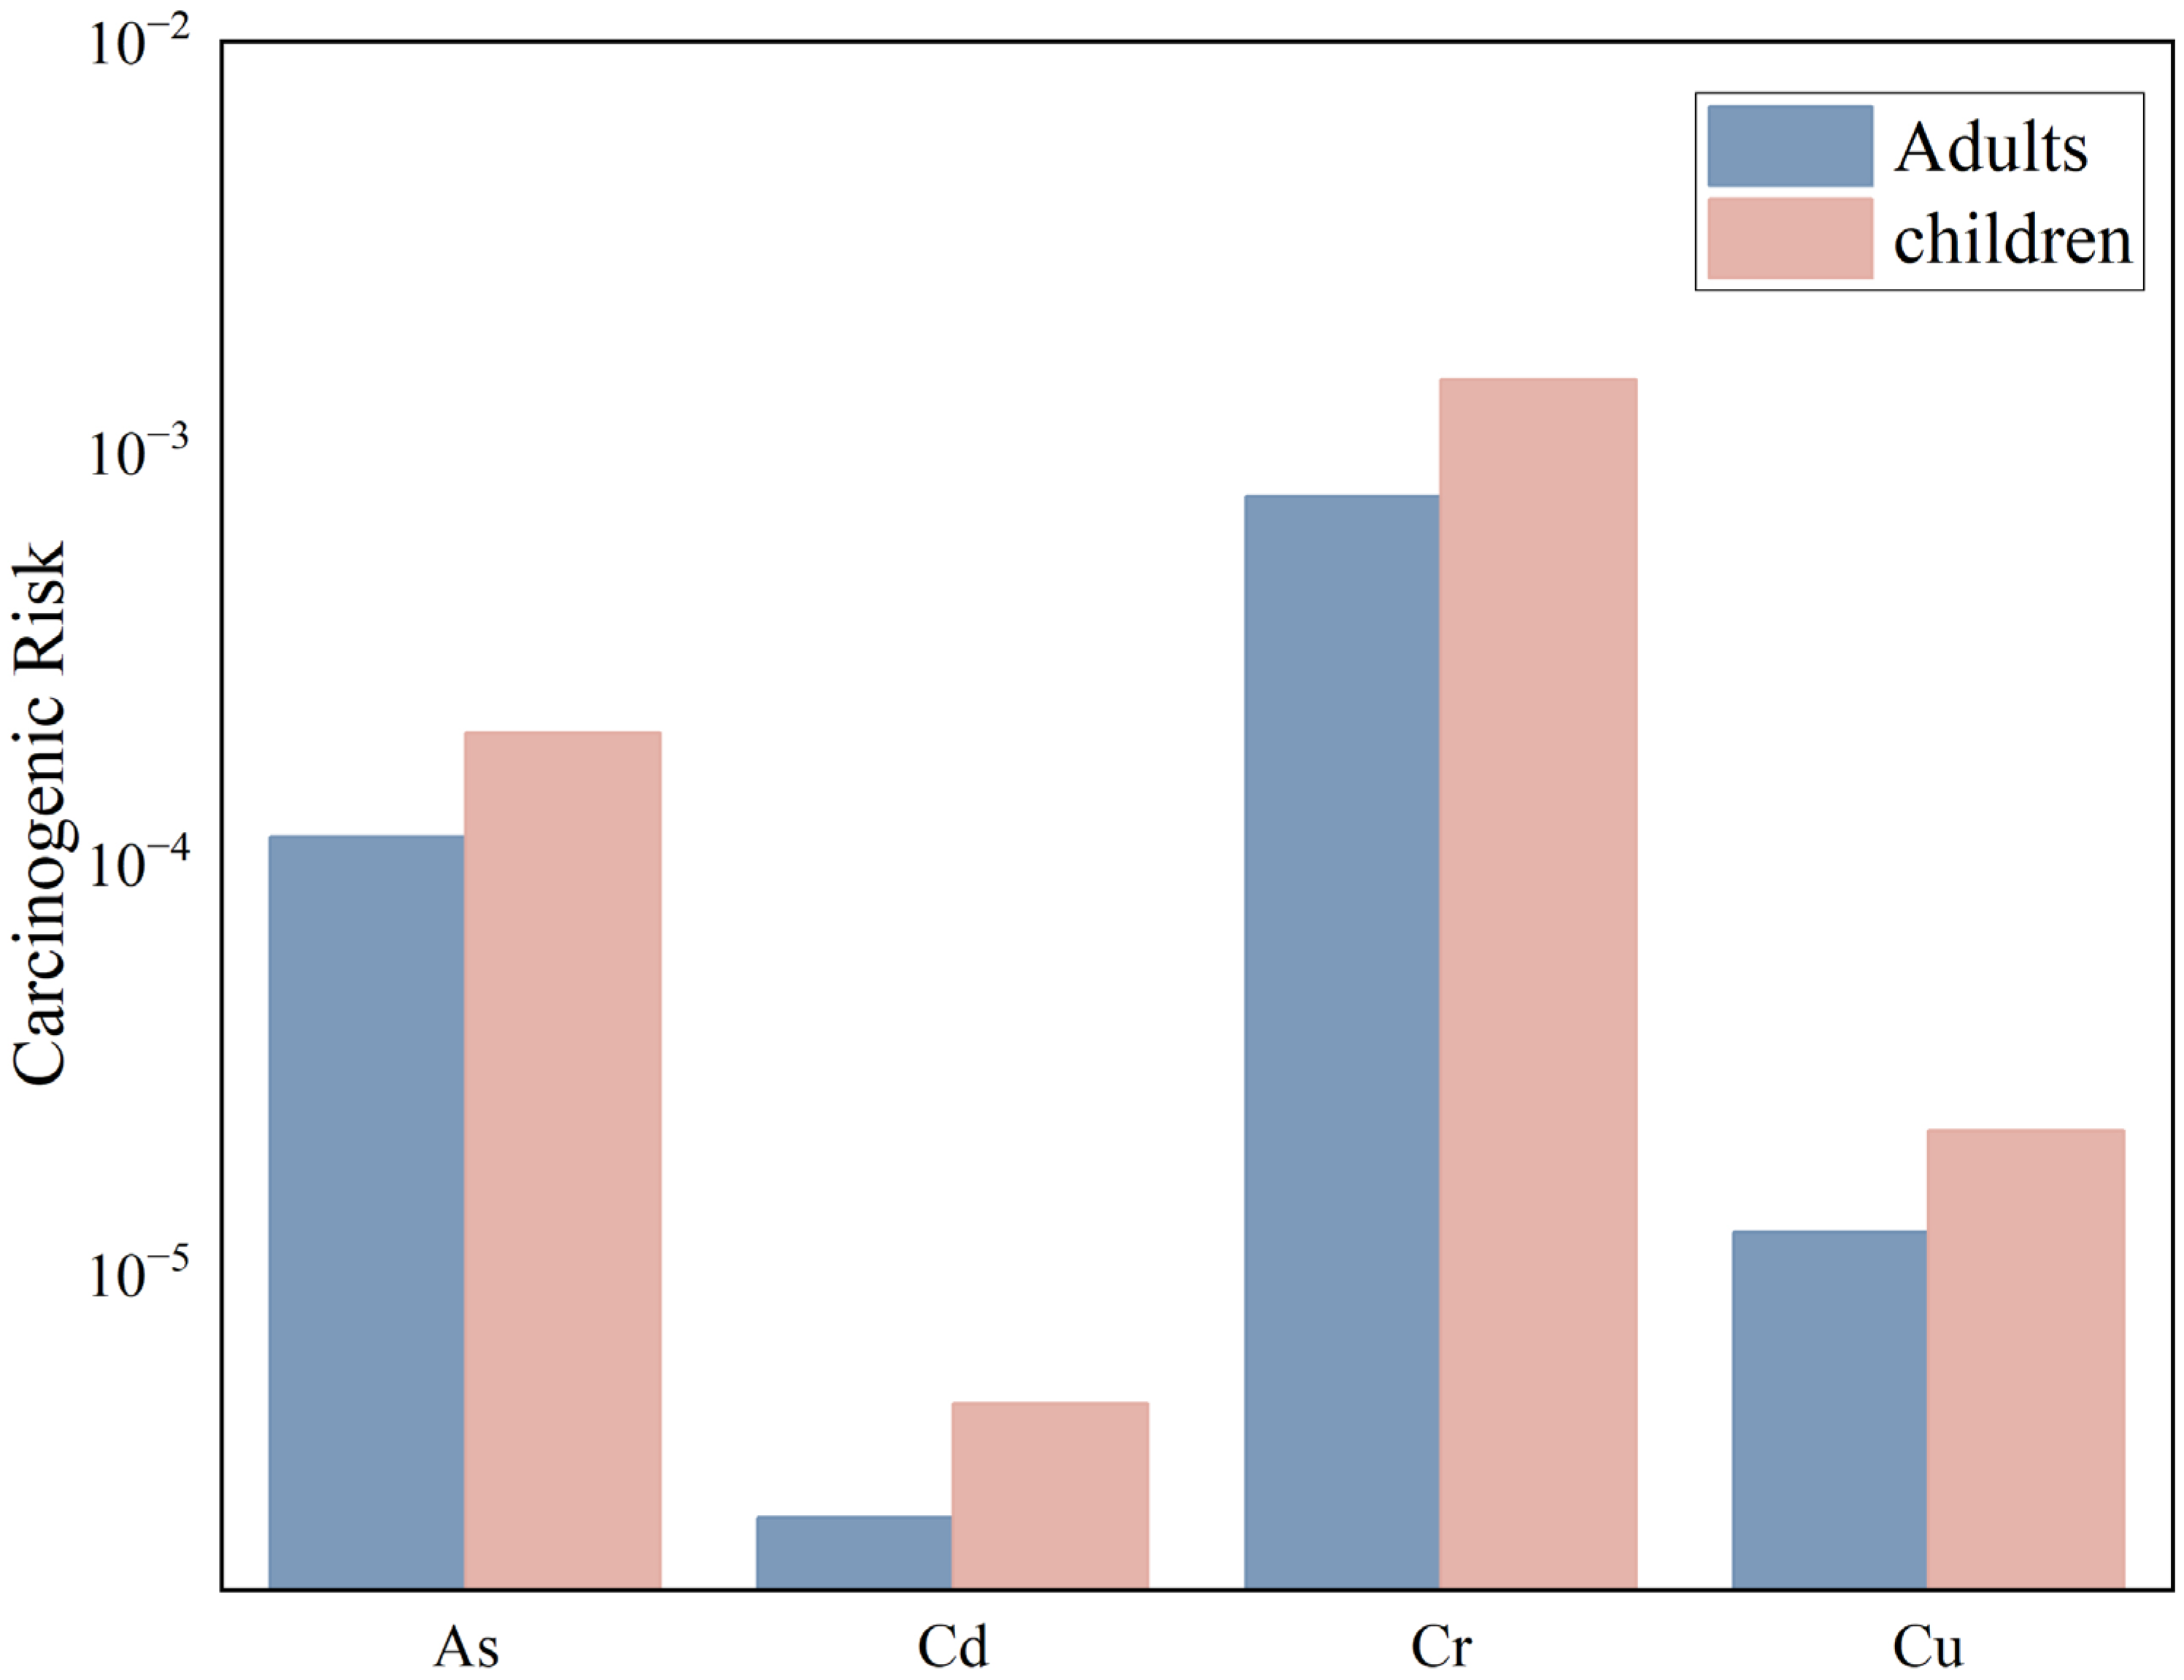
Due to the lack of carcinogenic slope factors for Cu, Pb, Zn, and U, this study only conducted a carcinogenic health risk assessment for the following four PTEs: As, Cd, Cr, and Ni. The carcinogenic health risk assessment for PTEs in the surface soil of the Zoige uranium mining area under three exposure pathways is shown in
Figure 12.
For adults exposed through oral ingestion, dermal contact, and inhalation, the carcinogenic health risk indices (CR) for the PTEs As, Cd, Cr, and Ni are 1.15 × 10⁻⁴, 2.55 × 10⁻⁶, 7.81 × 10⁻⁴, and 1.26 × 10⁻⁵, respectively, with the order of risk being Cr > As > Ni > Cd. The CR values for As and Cr exceed 1.0 × 10⁻⁴, indicating that As and Cr in the soil of the study area pose significant carcinogenic risks to adults. The total carcinogenic health risk (TCR) for adults is 9.12 × 10⁻⁴, and since TCR > 1 × 10⁻⁴, it indicates that adults in the study area face a high carcinogenic risk.
For children exposed through oral ingestion, dermal contact, and inhalation, the carcinogenic health risk indices (CR) for the PTEs As, Cd, Cr, and Ni are 2.07 × 10⁻⁴, 4.84 × 10⁻⁶, 1.50 × 10⁻³, and 2.23 × 10⁻⁵, respectively, with the order of risk being Cr > As > Ni > Cd. The CR values for As and Cr exceed 1.0 × 10⁻⁴, indicating that As and Cr in the soil of the study area pose significant carcinogenic risks to adults. The total carcinogenic health risk (TCR) for children is 1.74 × 10⁻³, and since TCR > 1 × 10⁻⁴, it indicates that children in the study area also face a high carcinogenic risk.


