
Spatial Distribution, Contamination Levels, and Health Risk Assessment of Potentially Toxic Elements in Household Dust in Cairo City, Egypt

 ,
,  ,
,  , and
, and
Abstract
1. Introduction
2. Materials and Methods
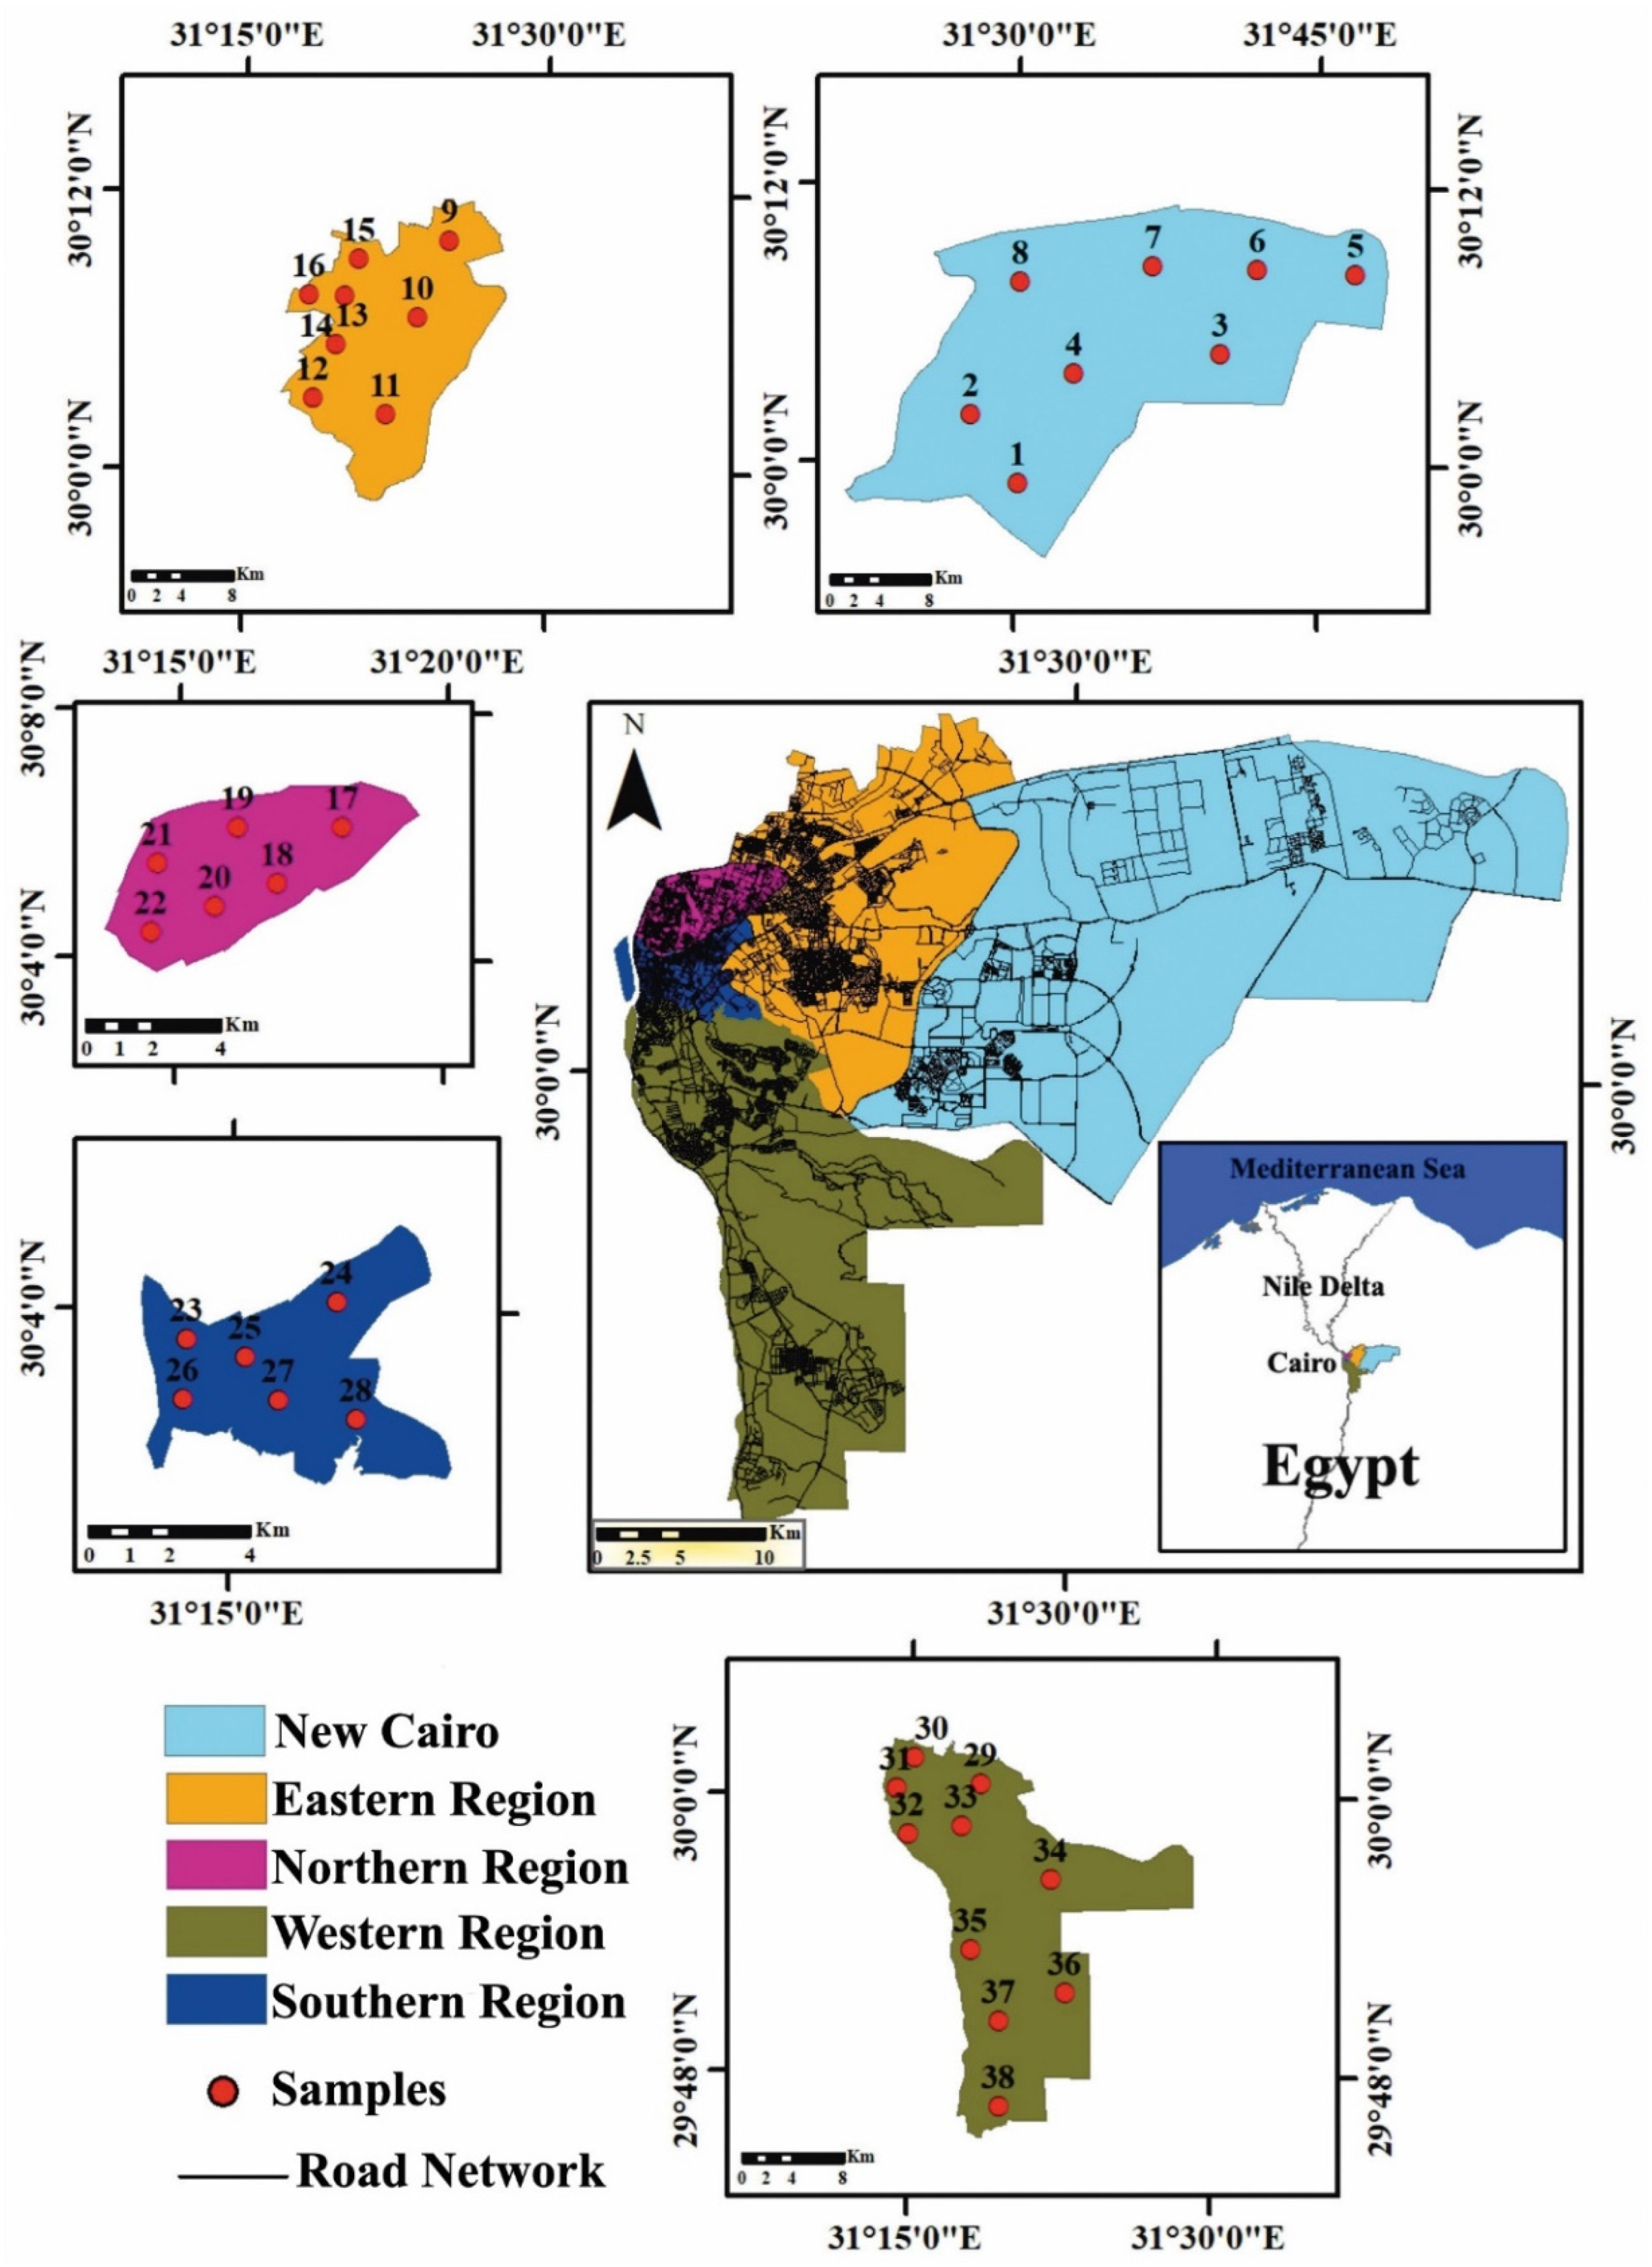
2.1. The Study Area
2.2. Sampling and Samples Preparation
2.3. Chemical Analyses
2.4. Contamination Levels
2.4.1. Contamination Factor (Cf)
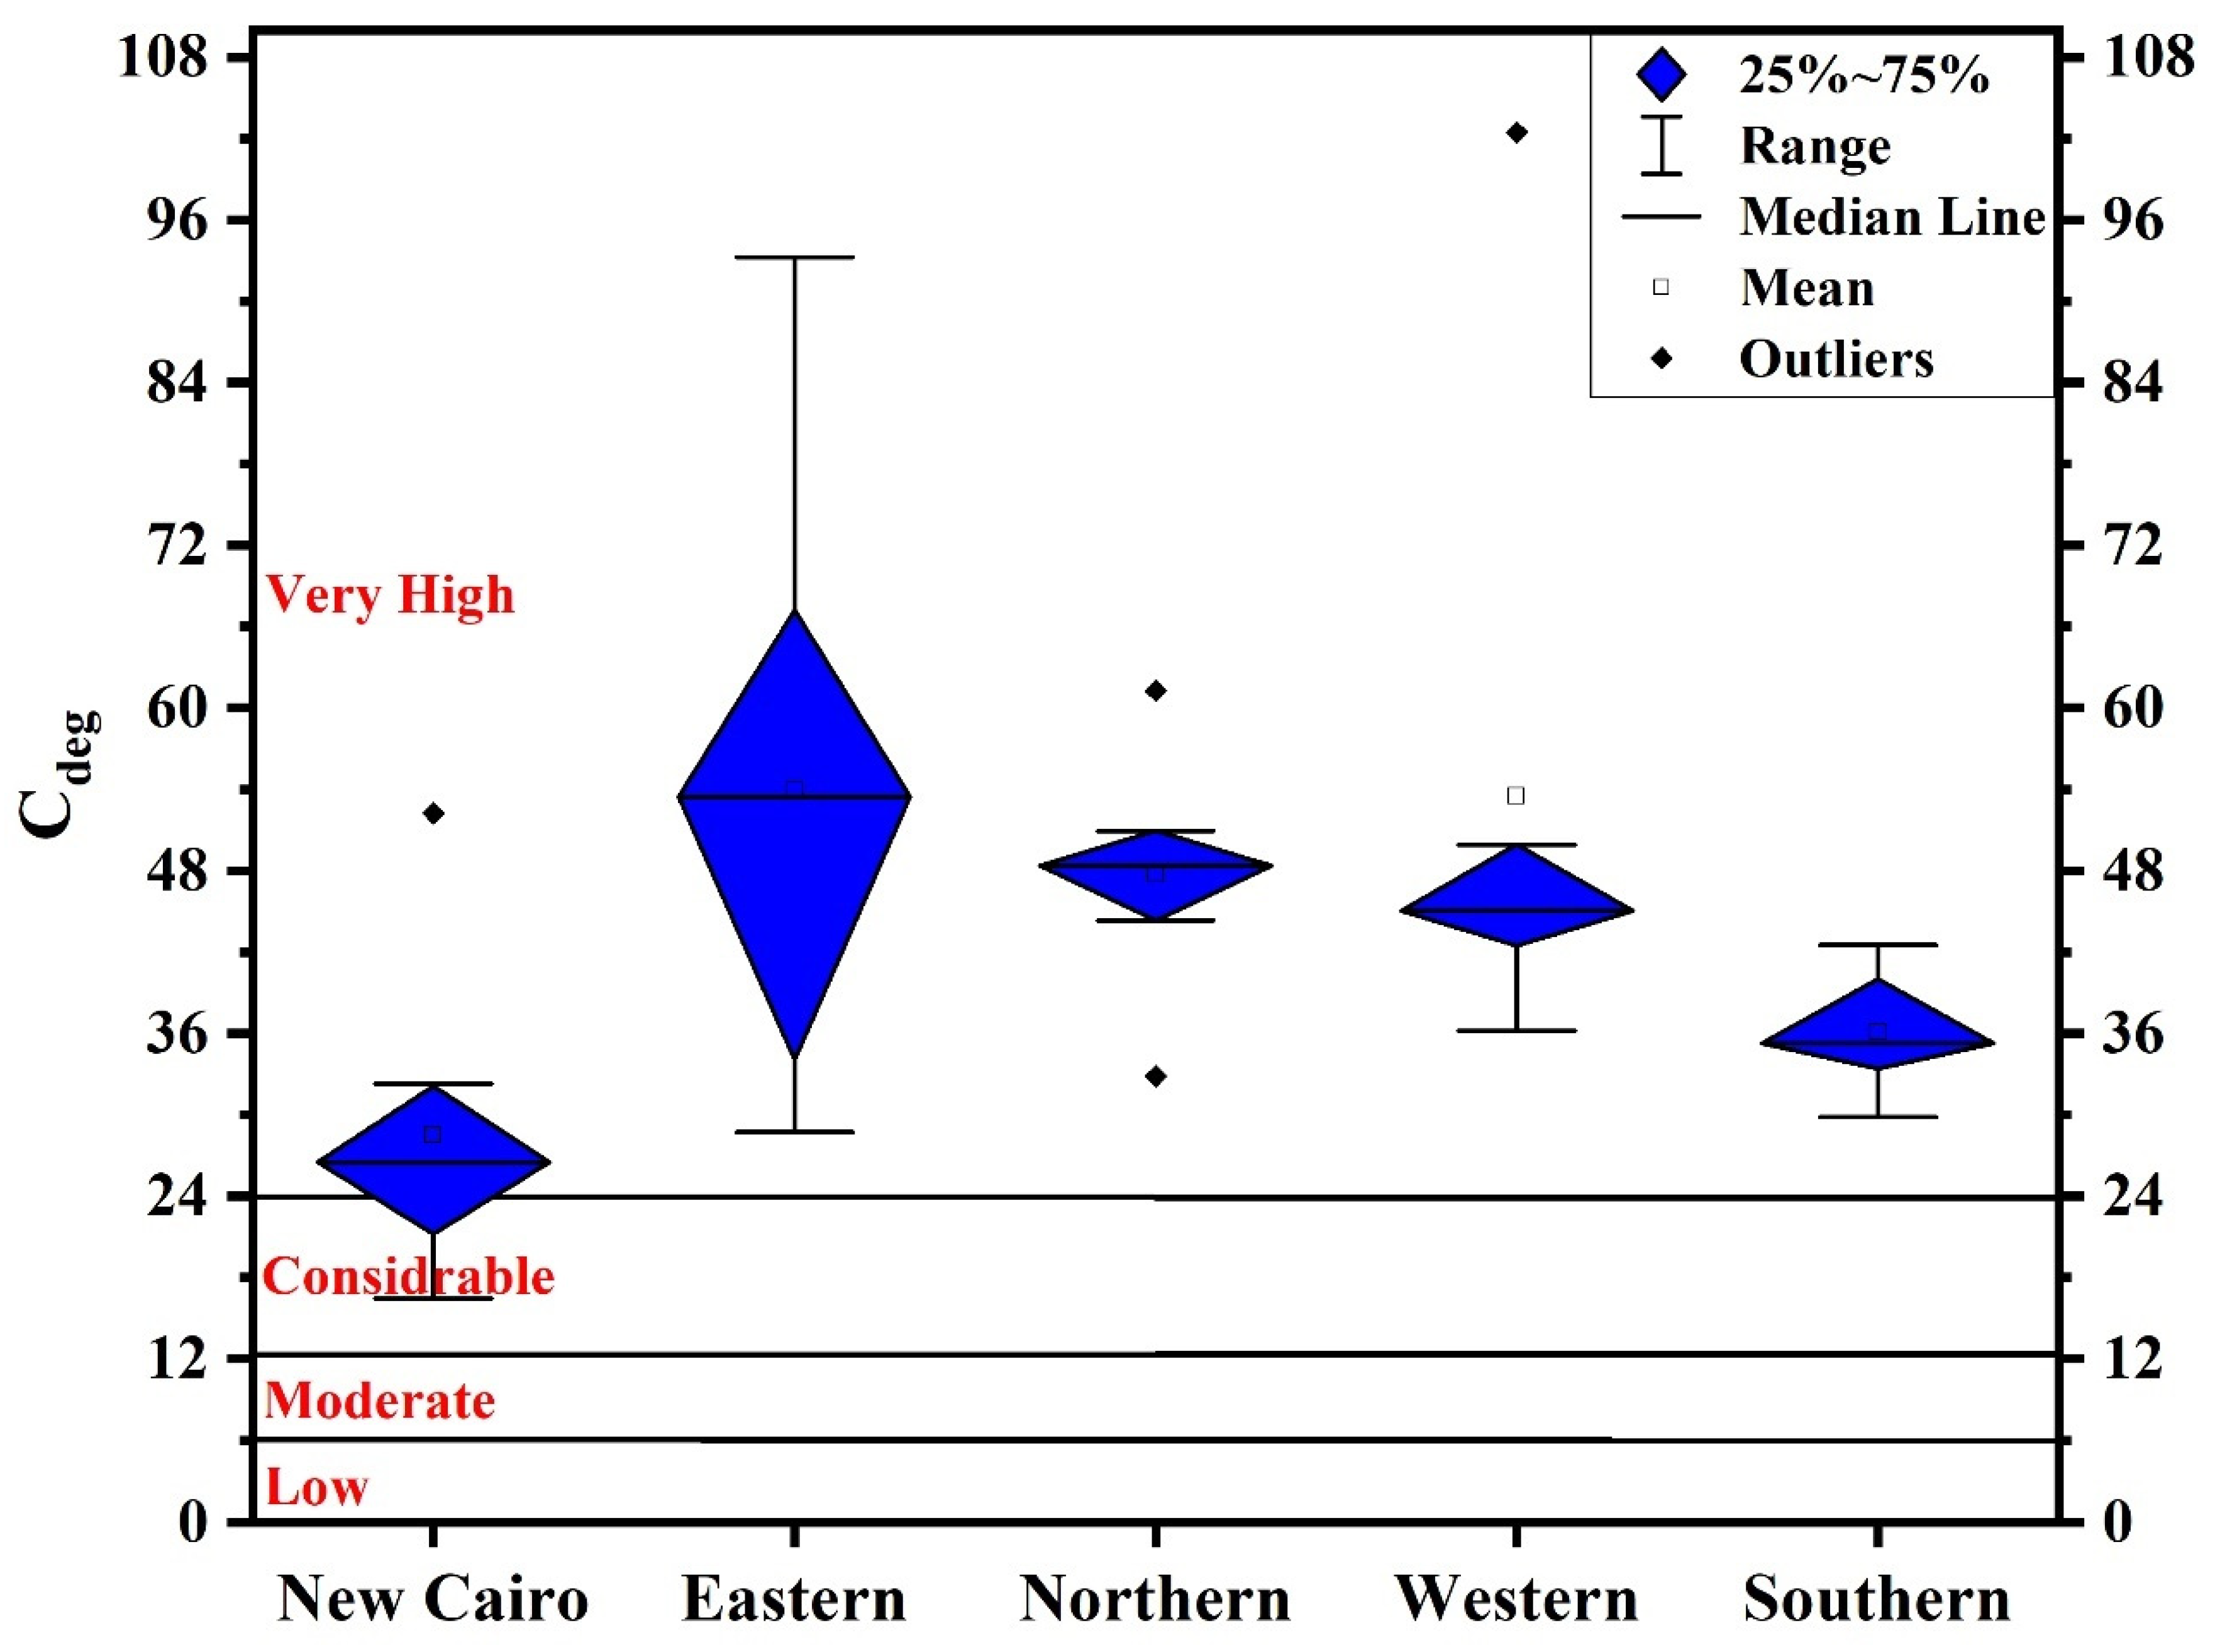
2.4.2. Contamination Degree (Cdeg)
2.5. Health Risk Assessment
2.6. Data Treatment
3. Results and Discussion
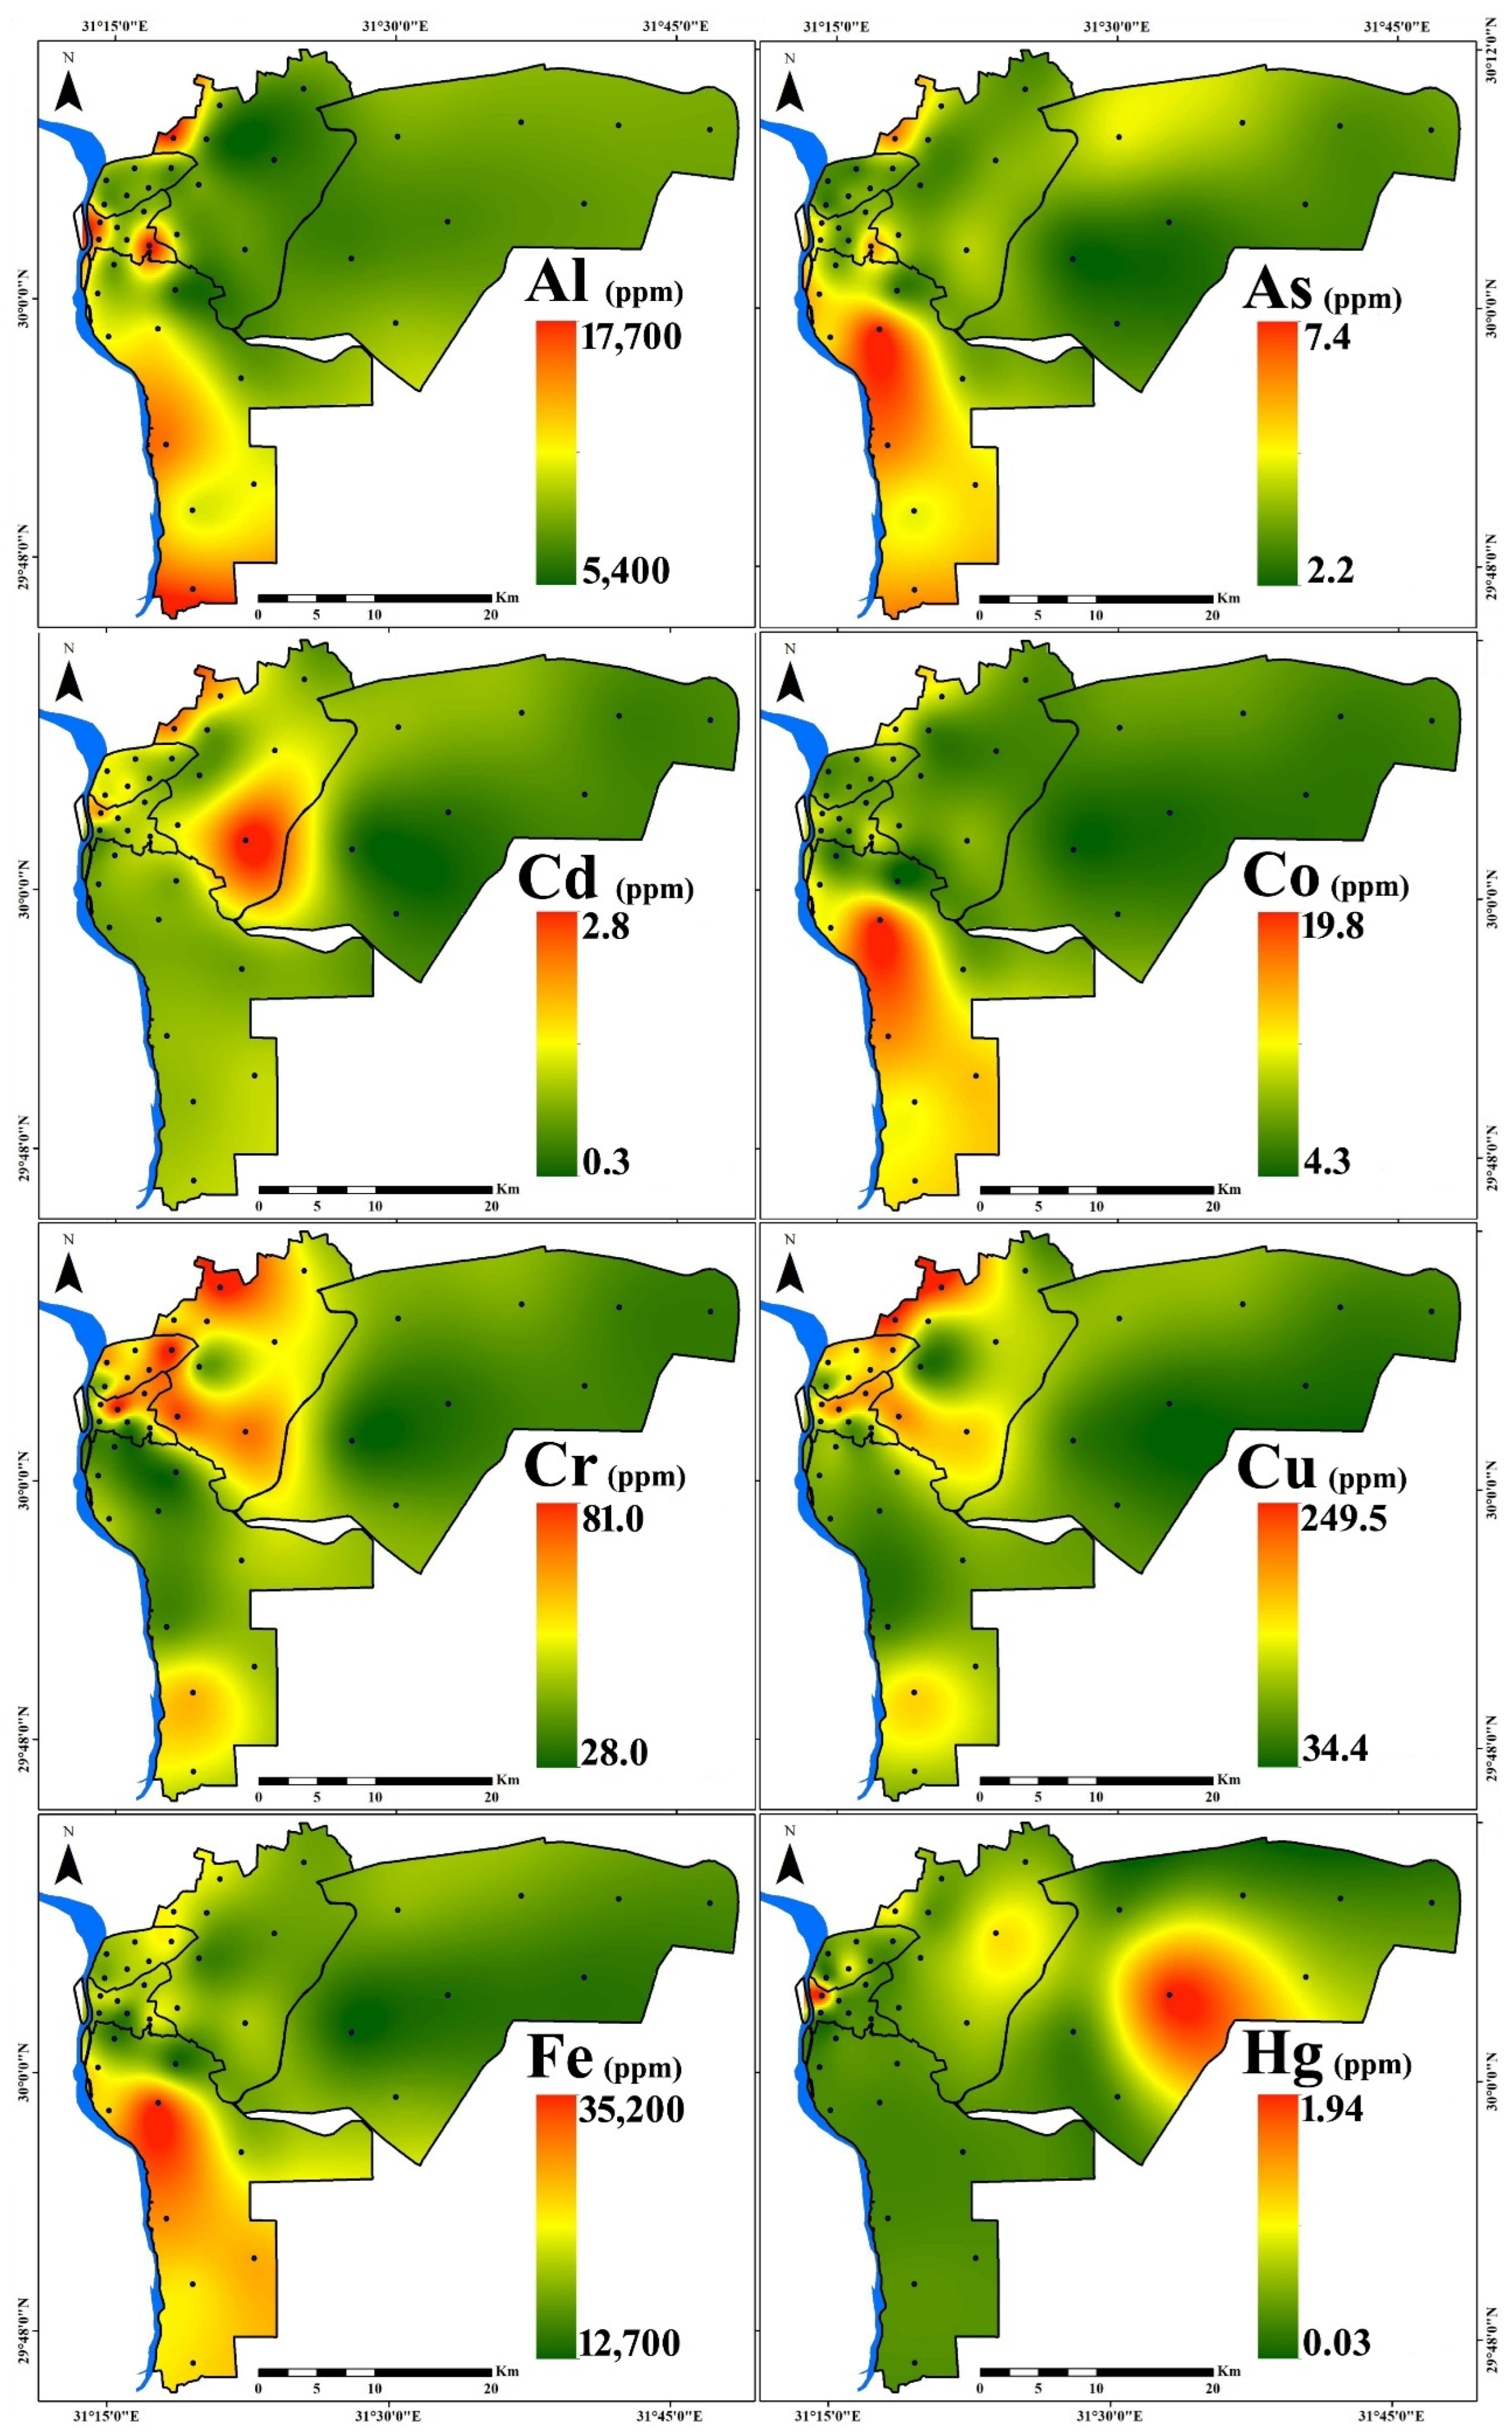
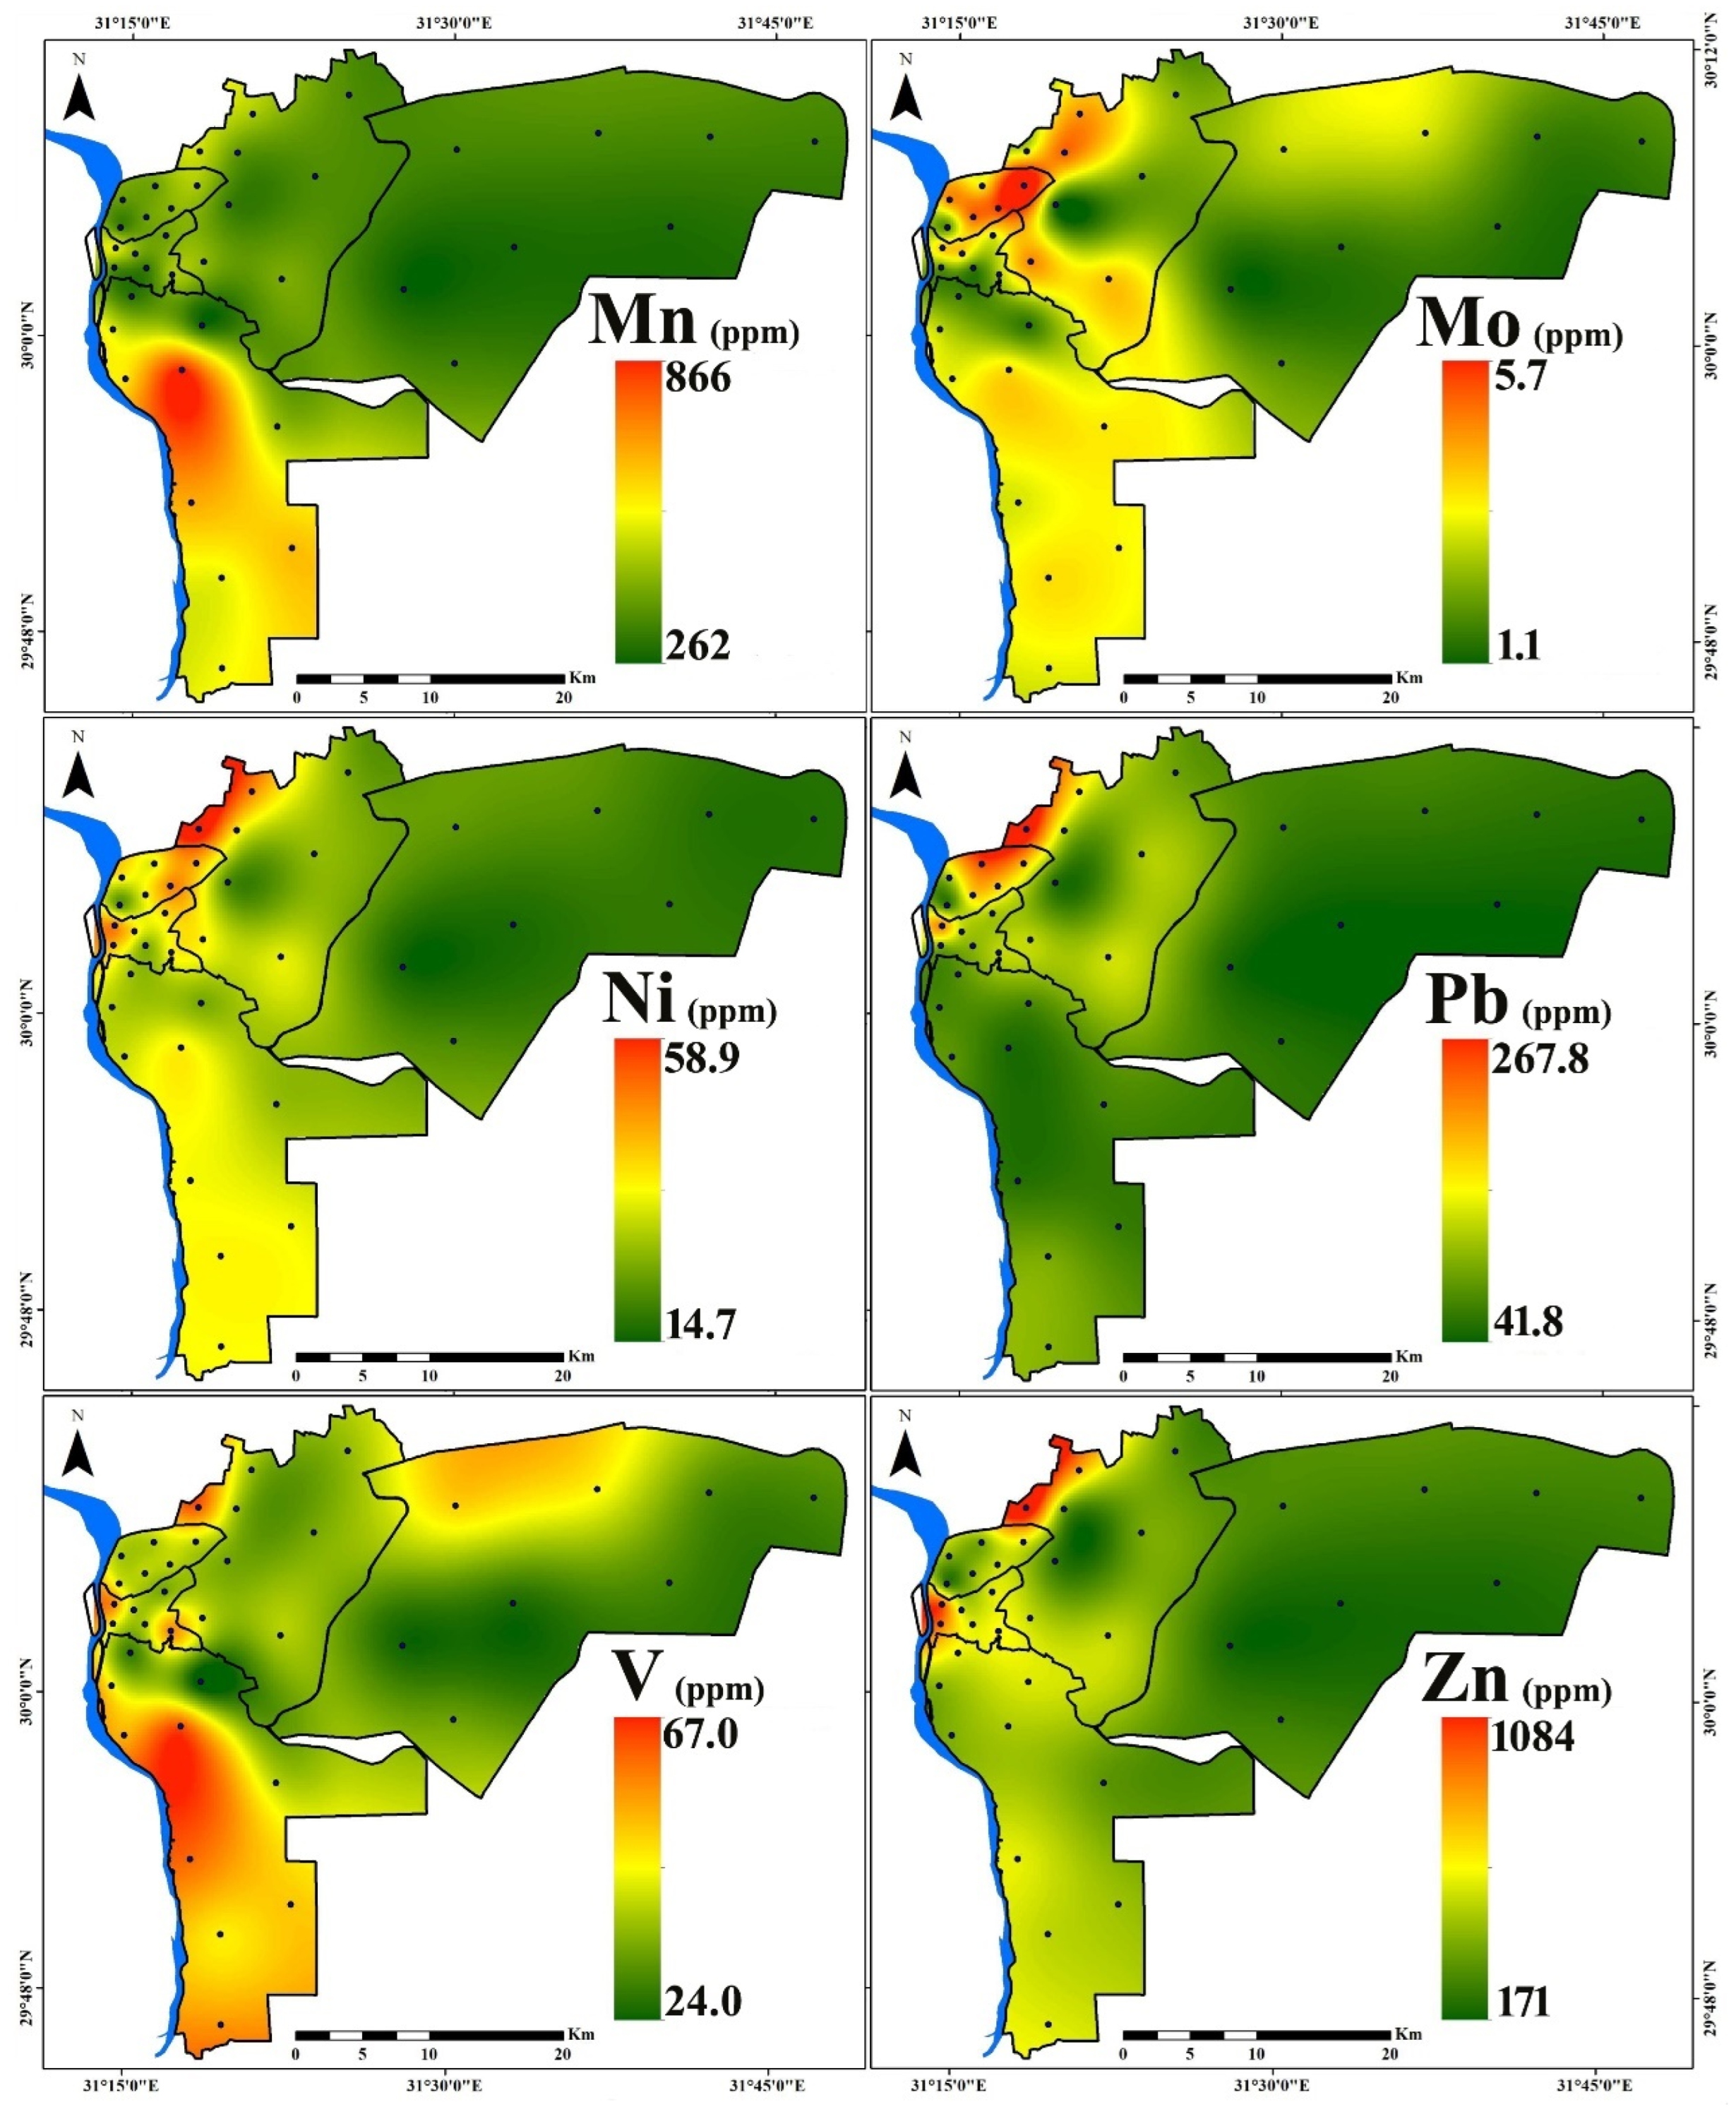
3.1. PTE Distribution
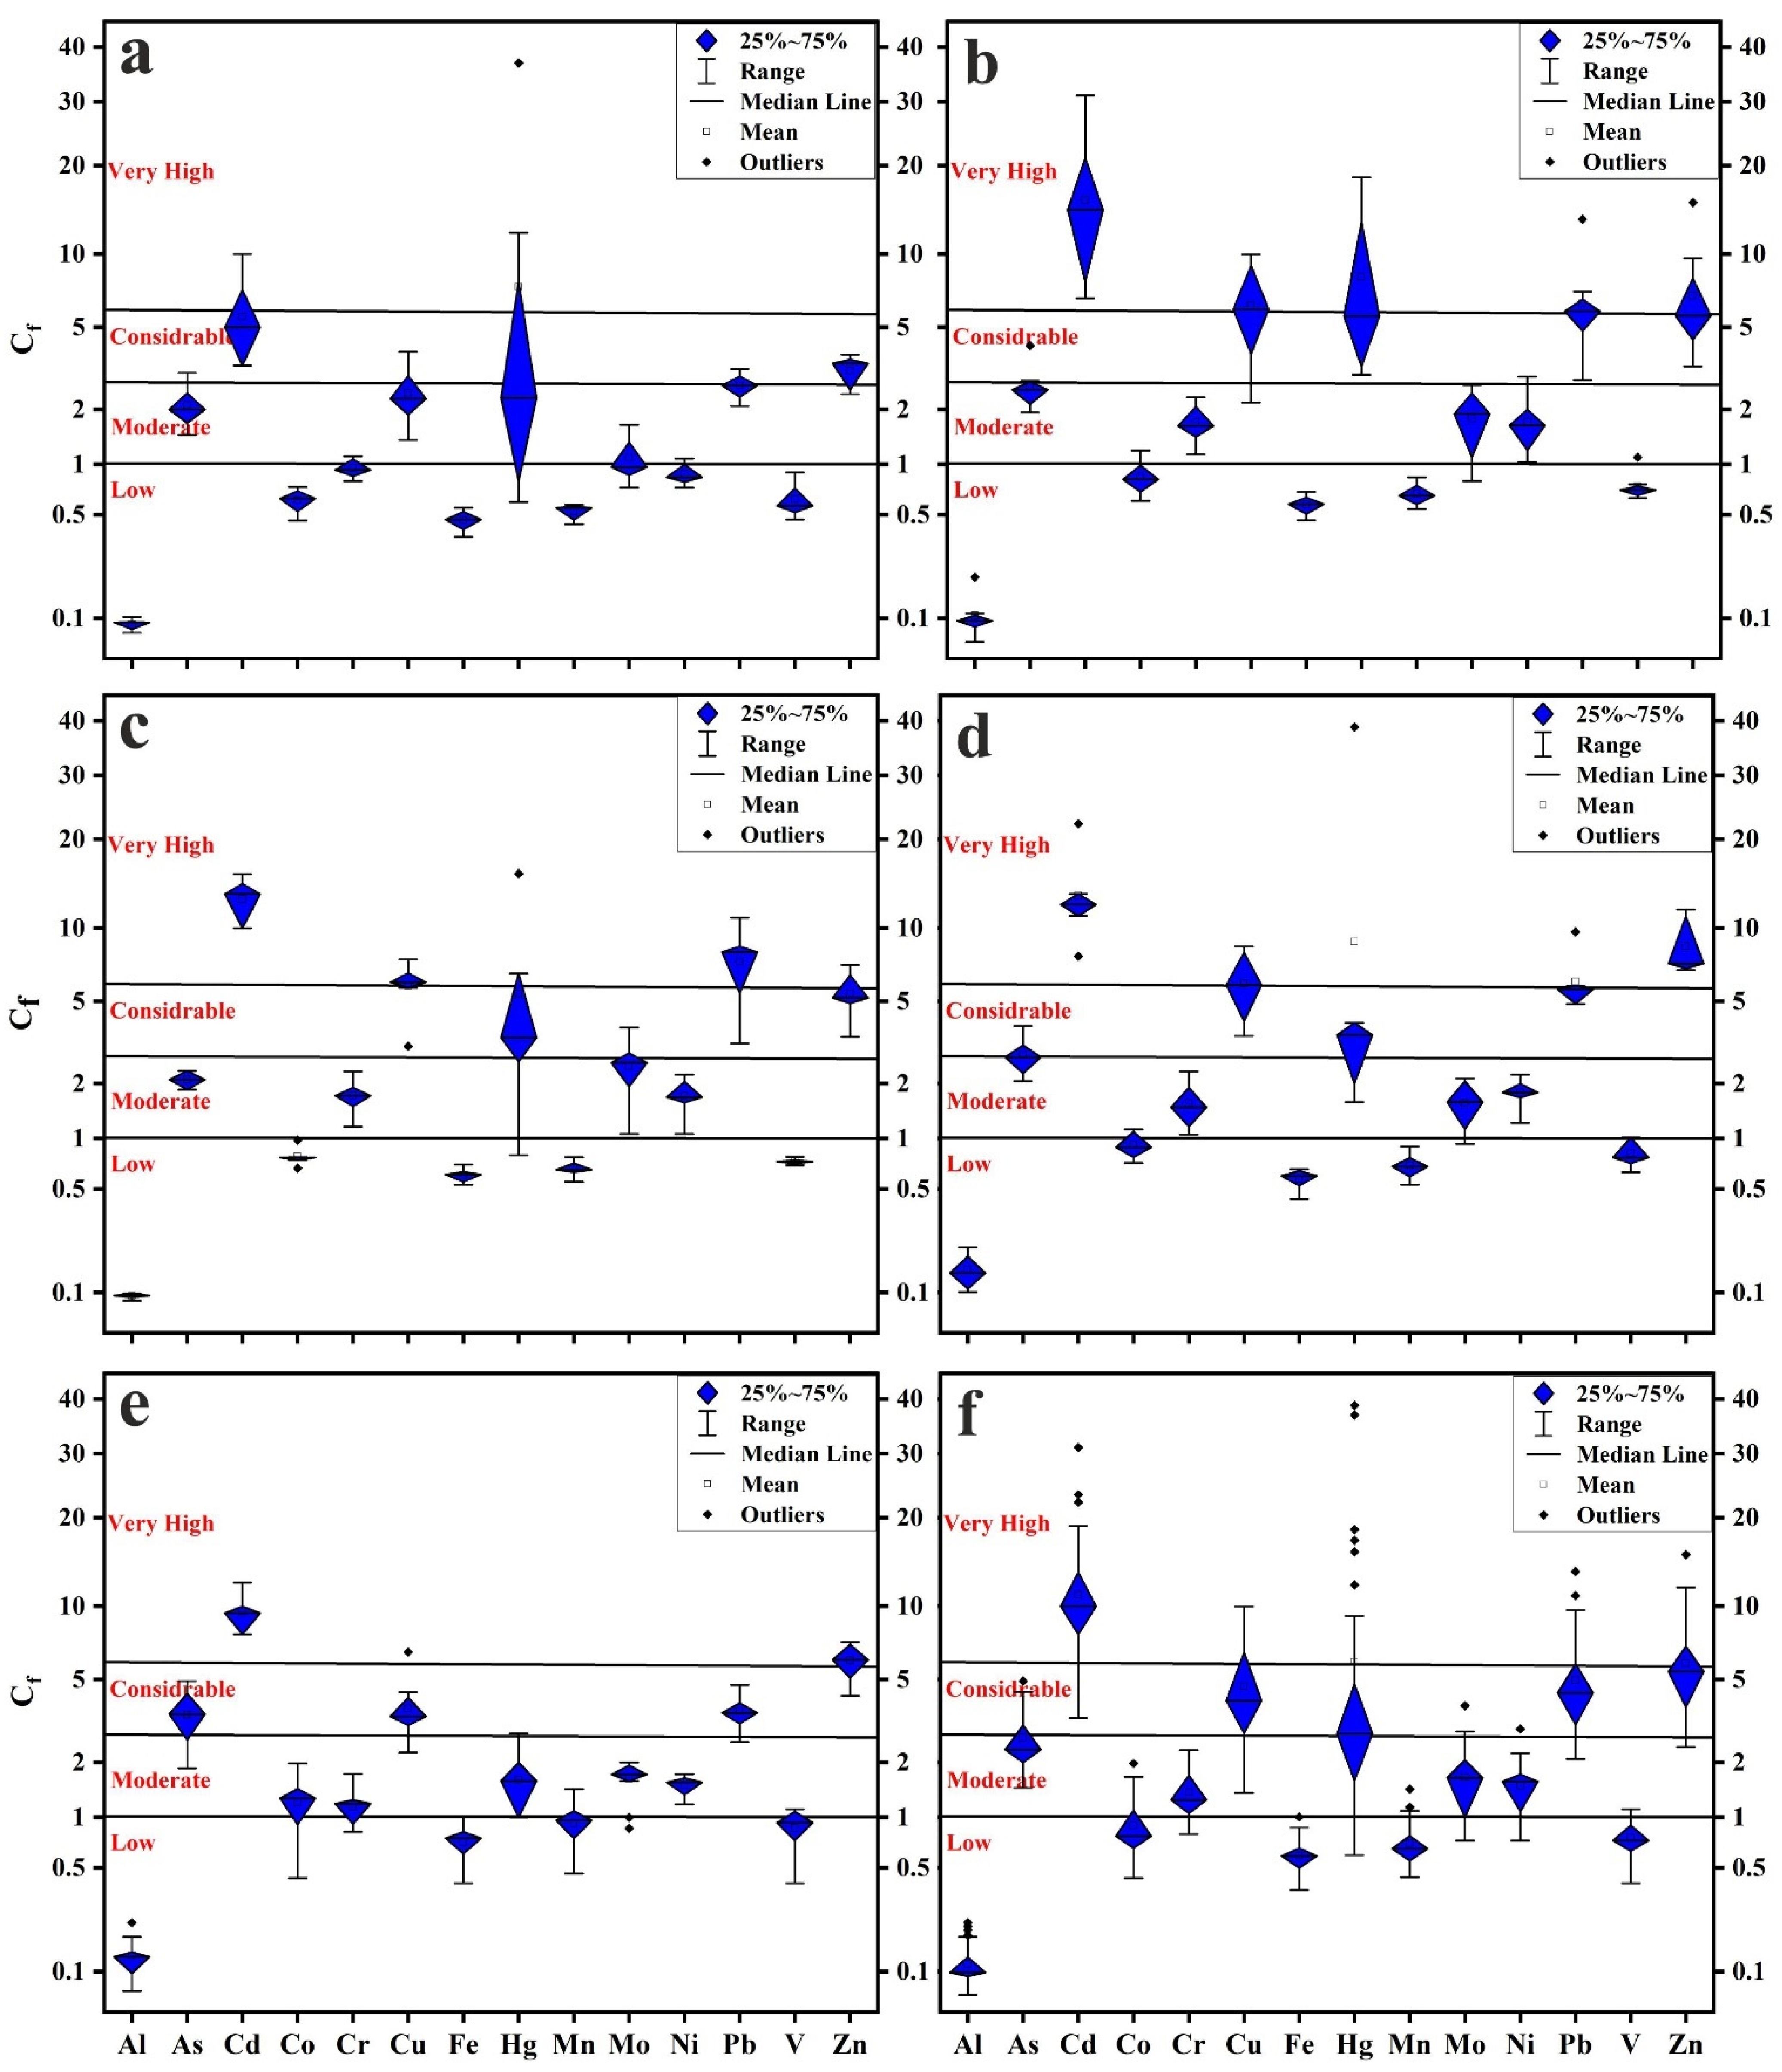
3.2. Contamination Levels
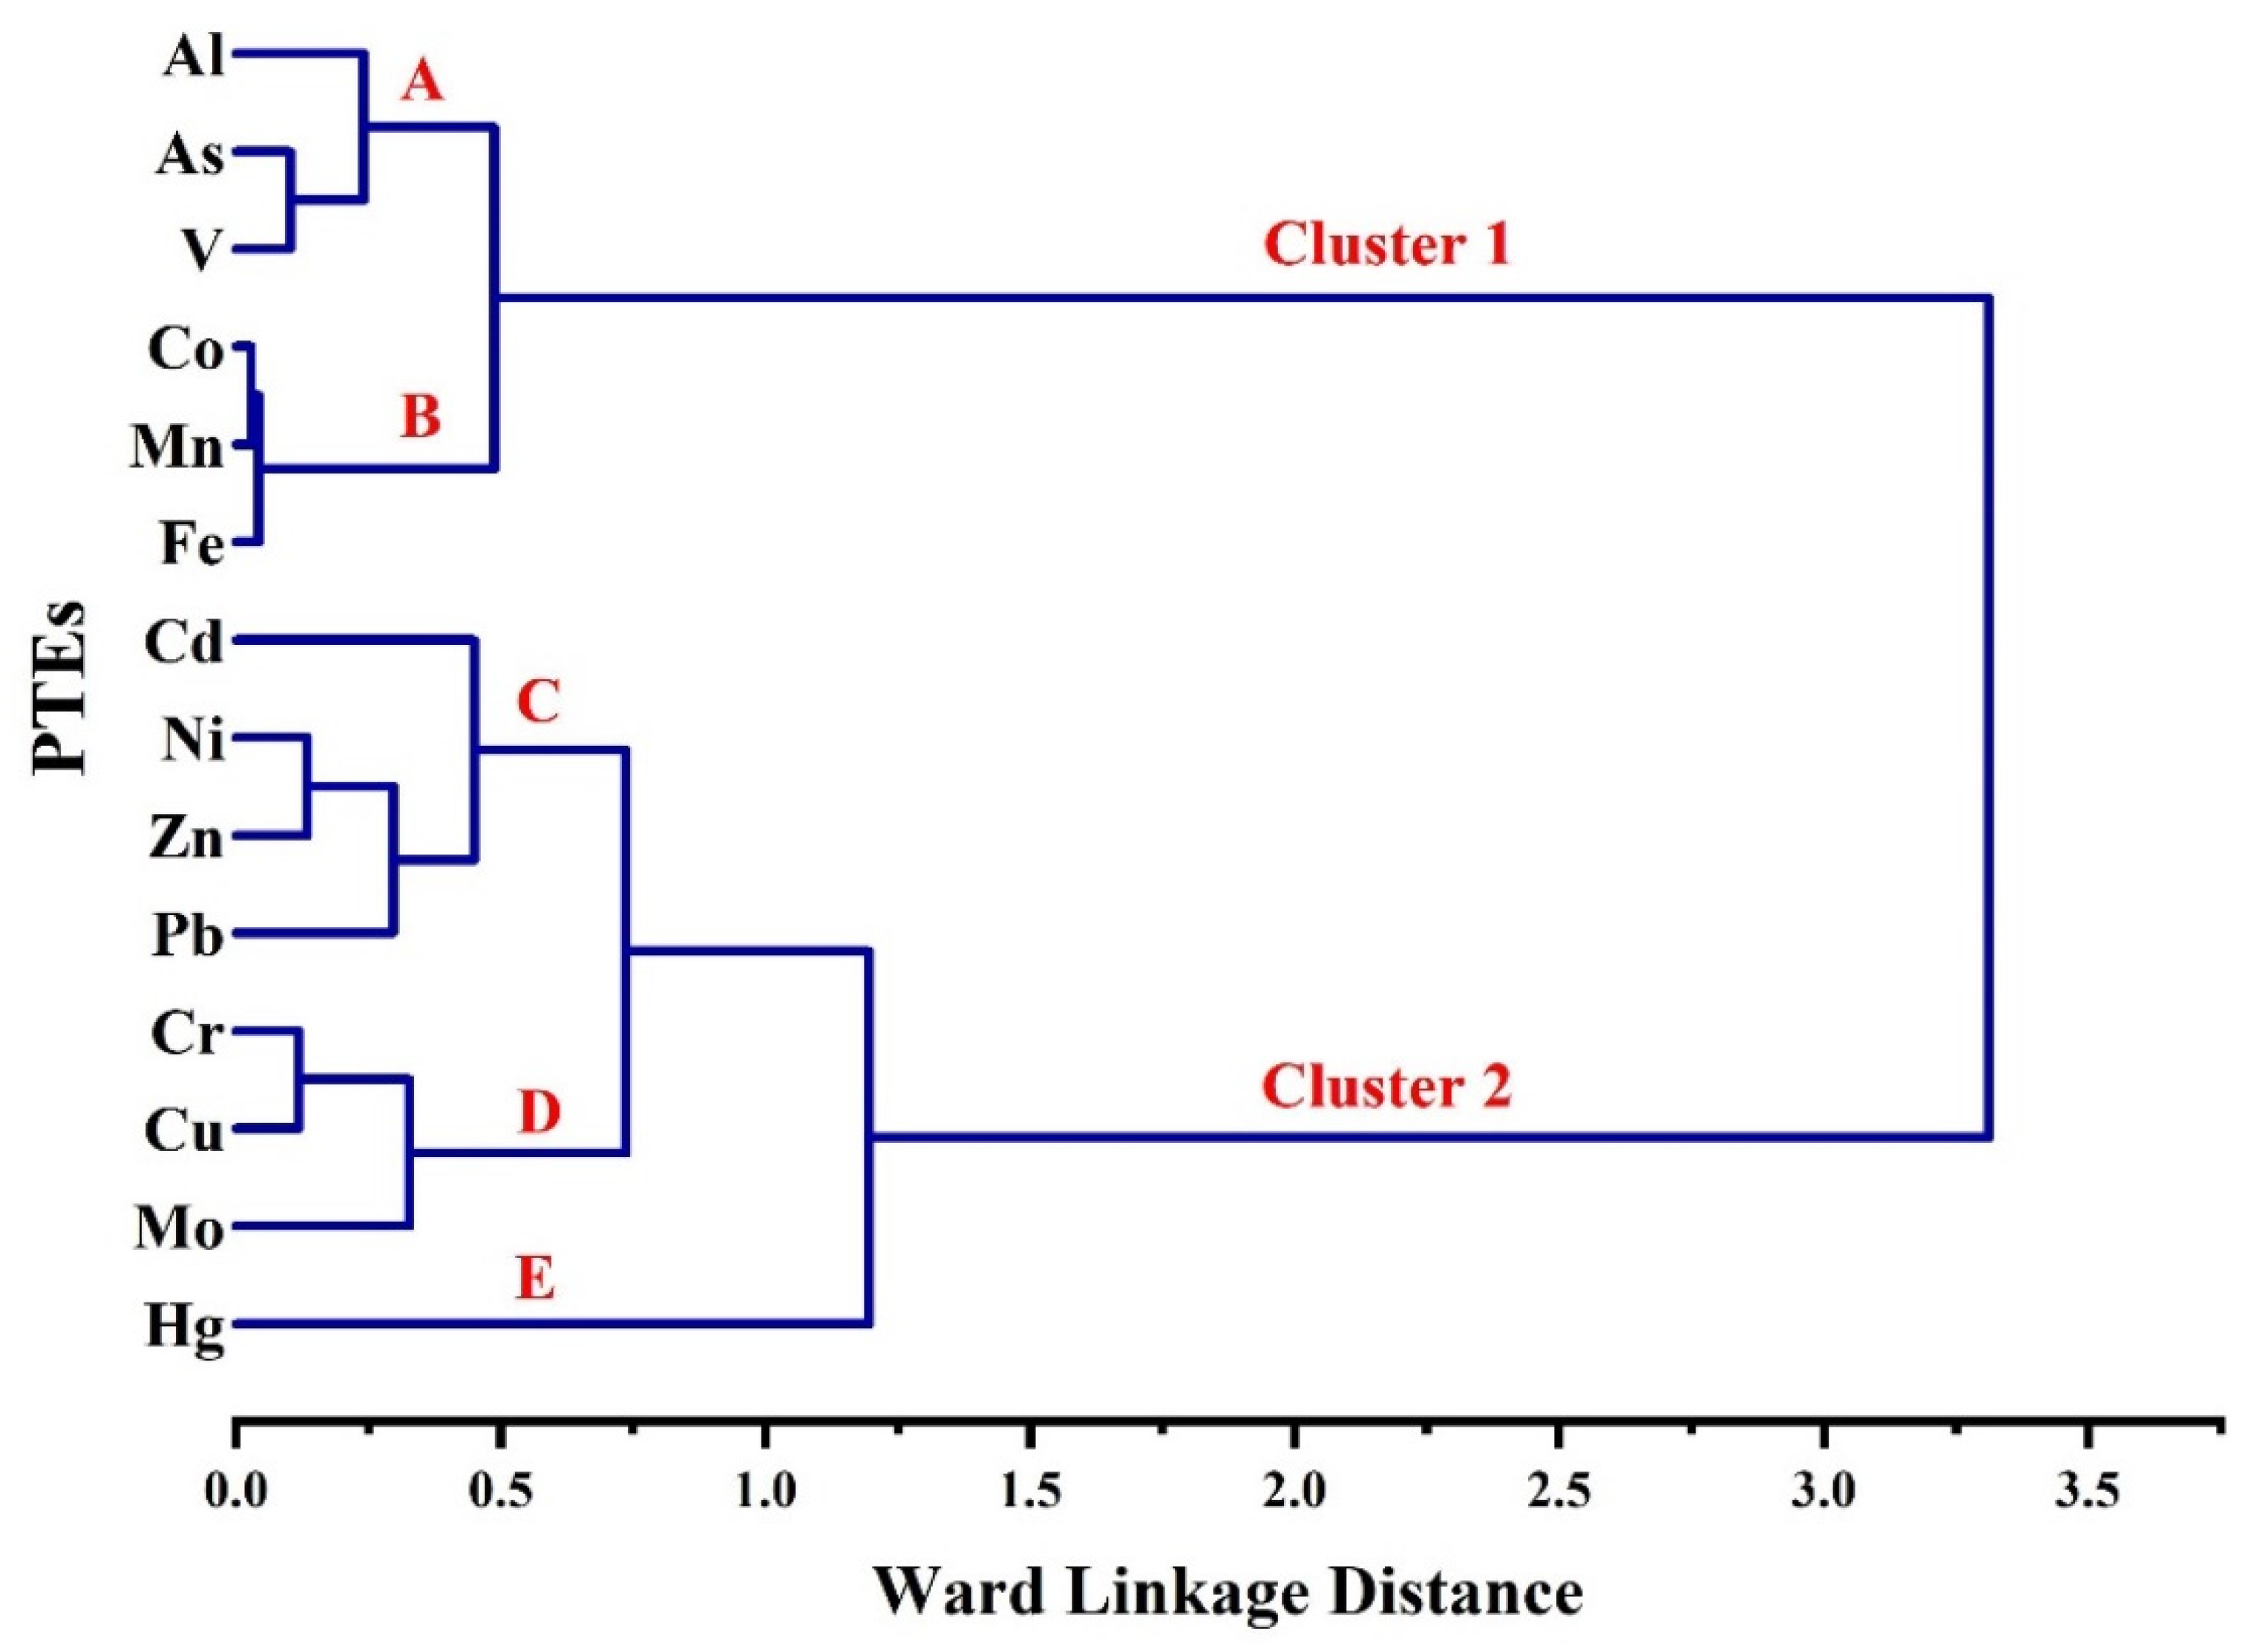
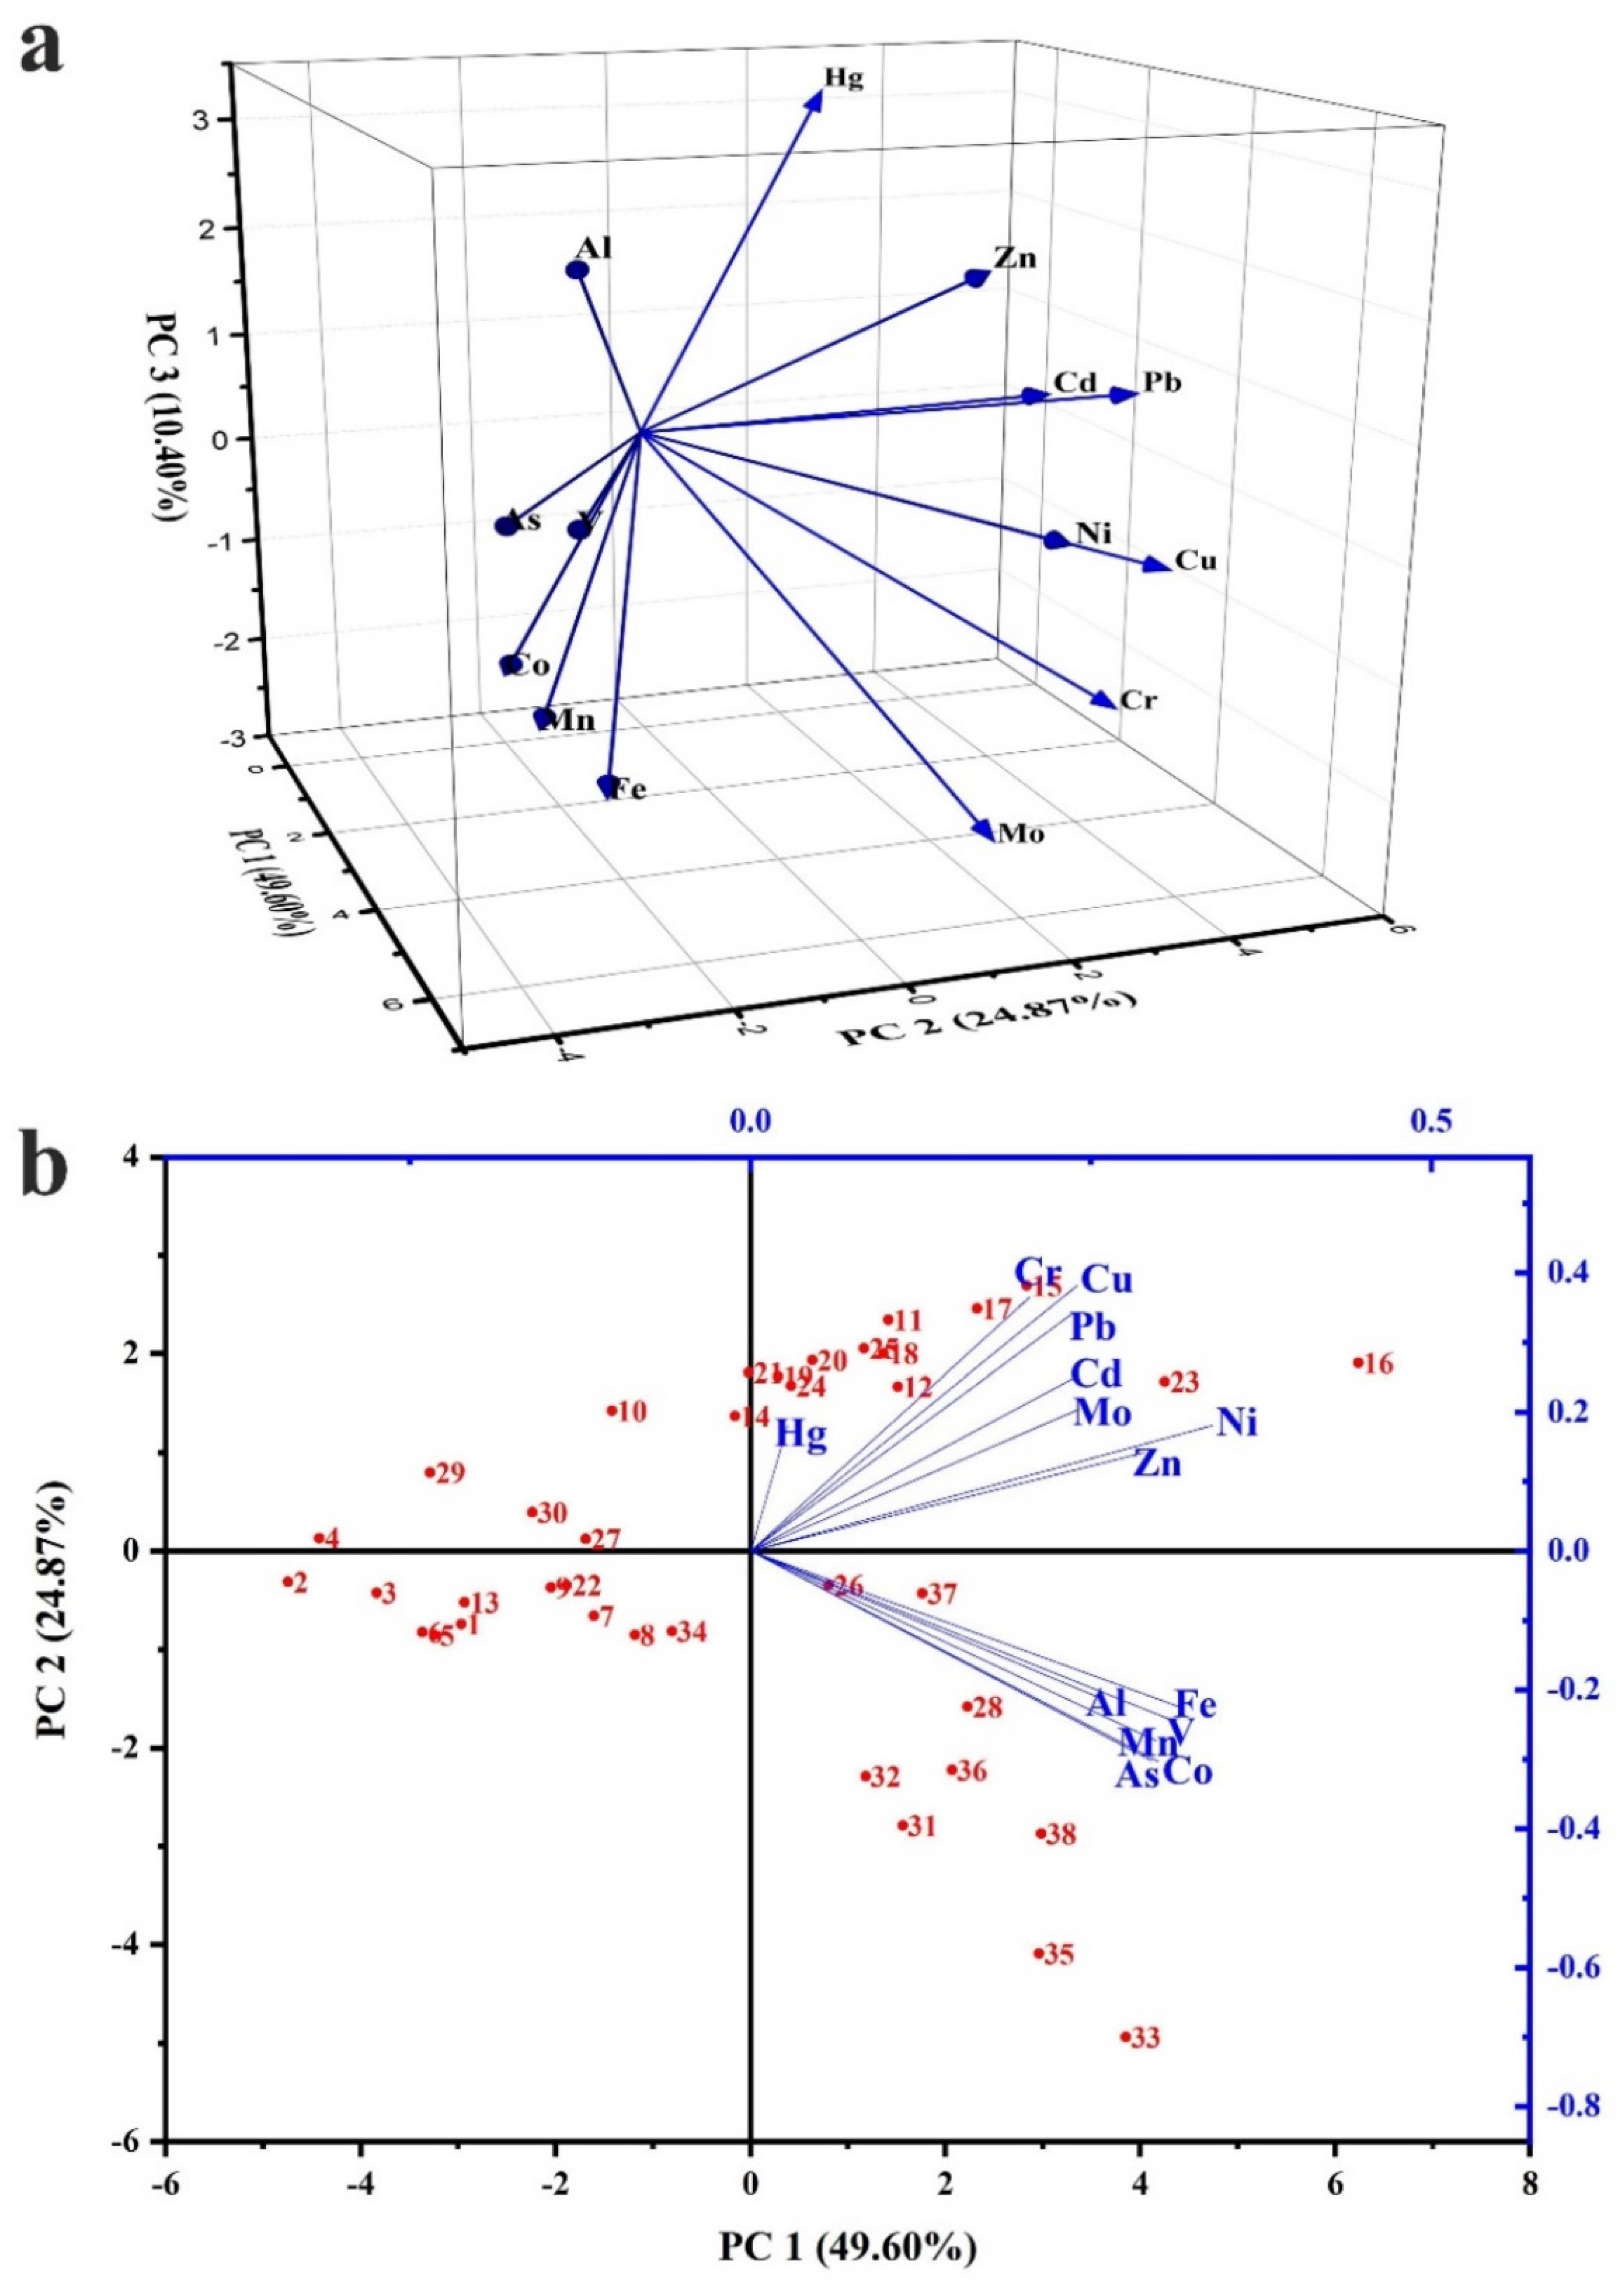
3.3. Correlations between PTEs
3.4. Health Risk Assessment
4. Conclusions
- (1)
- The levels of As, Cd, Cr, Cu, Hg, Mo, Ni, Pb, and Zn surpassed the background values of UCC, indicating anthropogenic influences. The lowest degrees of pollution were recorded for Al, Co, Fe, Mn, and V, while the highest degrees were recorded for Cd, Cu, Hg, Pb, and Zn, reaching considerably to very high pollution.
- (2)
- New Cairo recorded the slightest degree of contamination, ranging from considerably to very high pollution, while in other Cairo regions household dust is very high polluted. Elevated PTE concentrations in Cairo’s household dust may be due to industrial activities and heavy traffic emissions.
- (3)
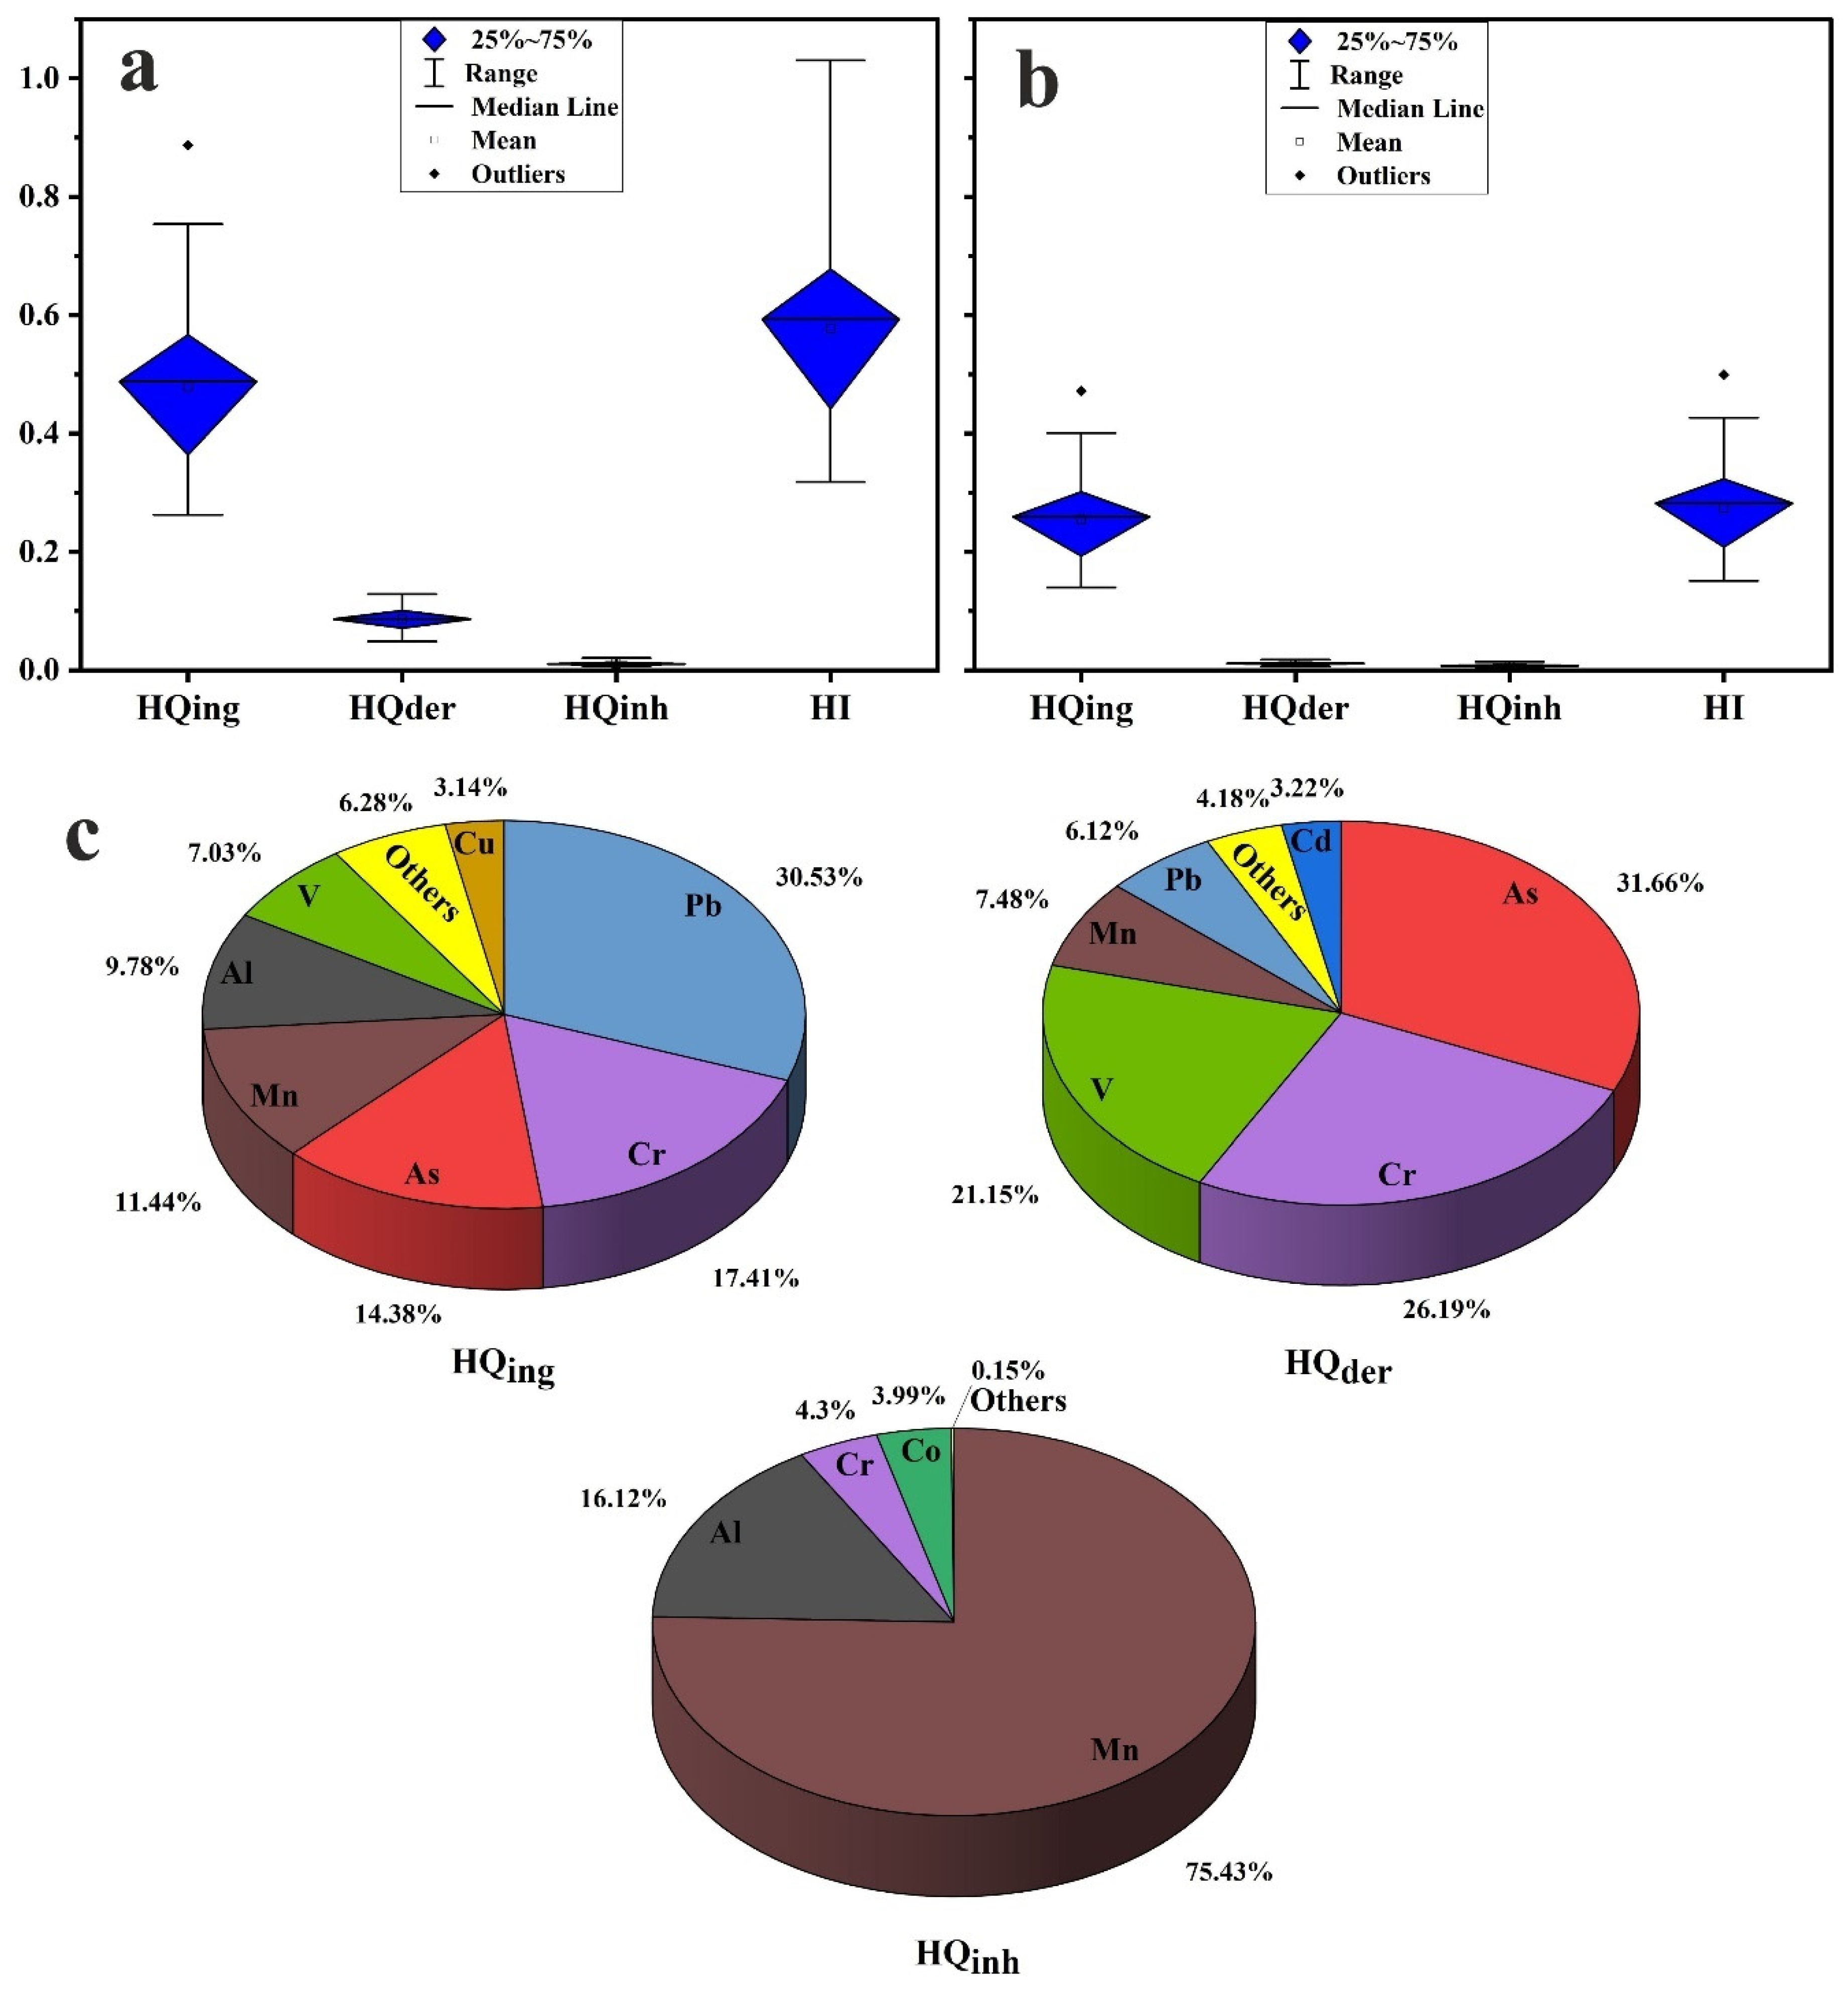
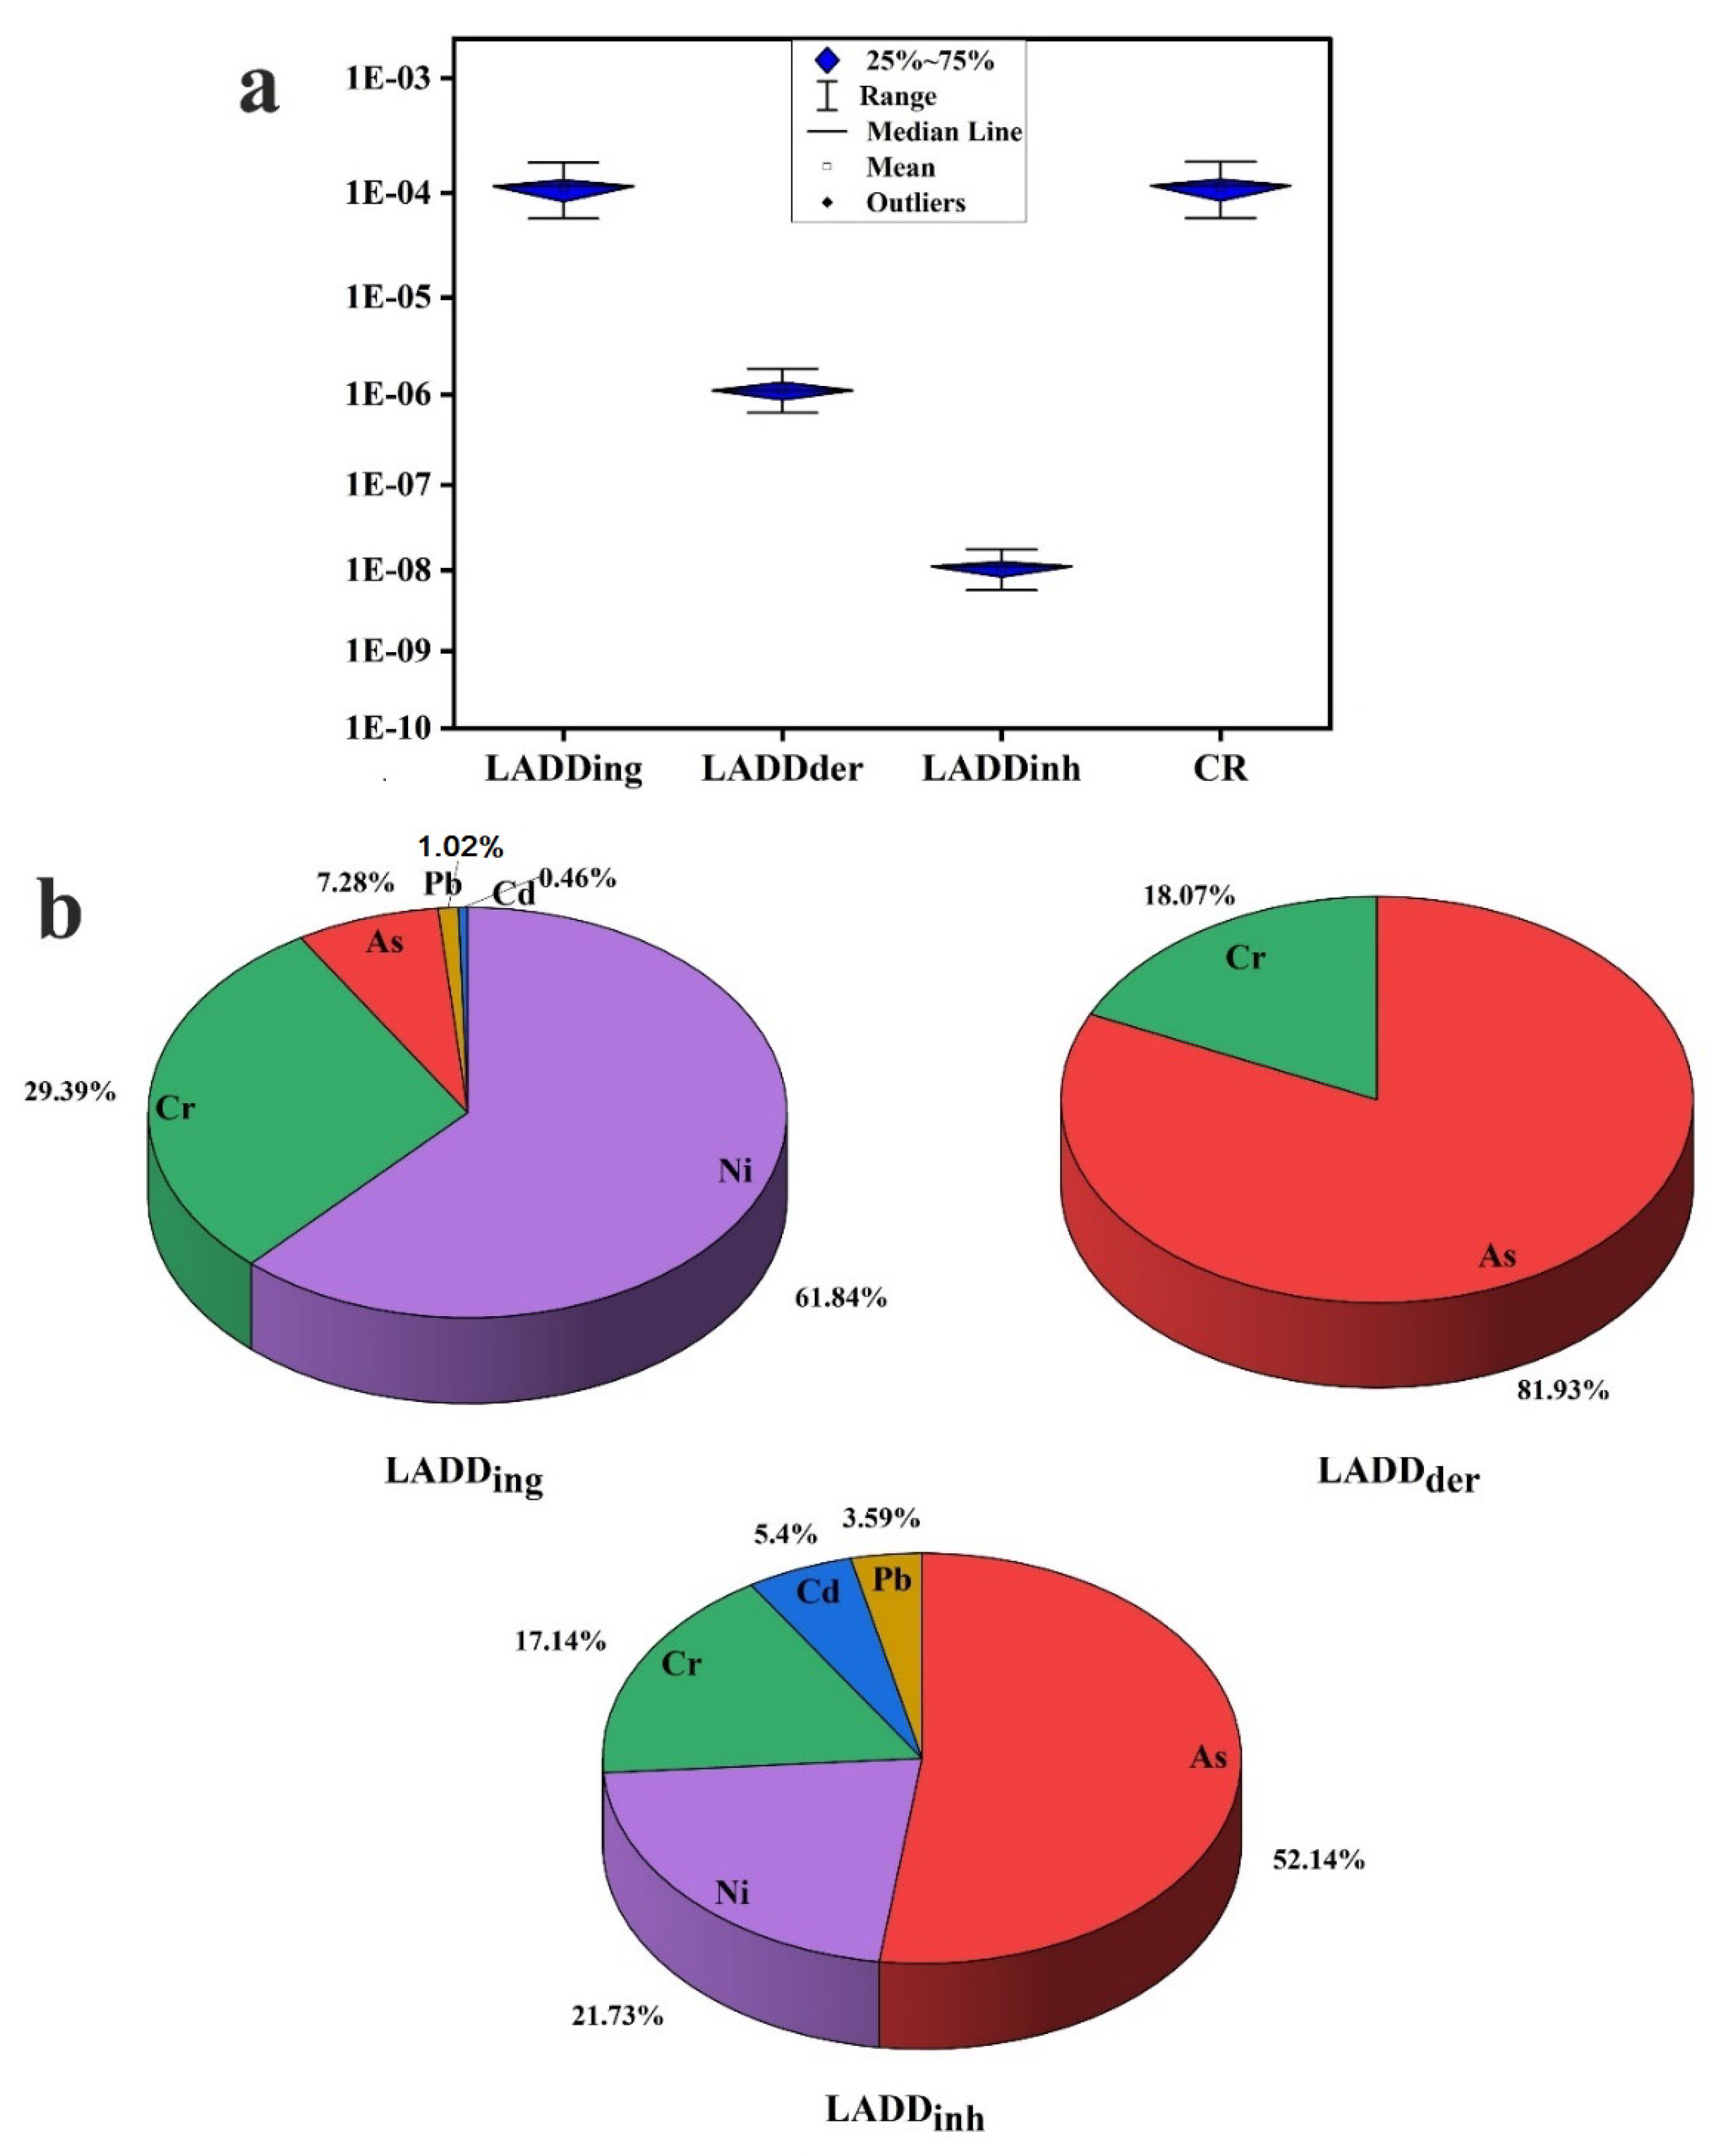
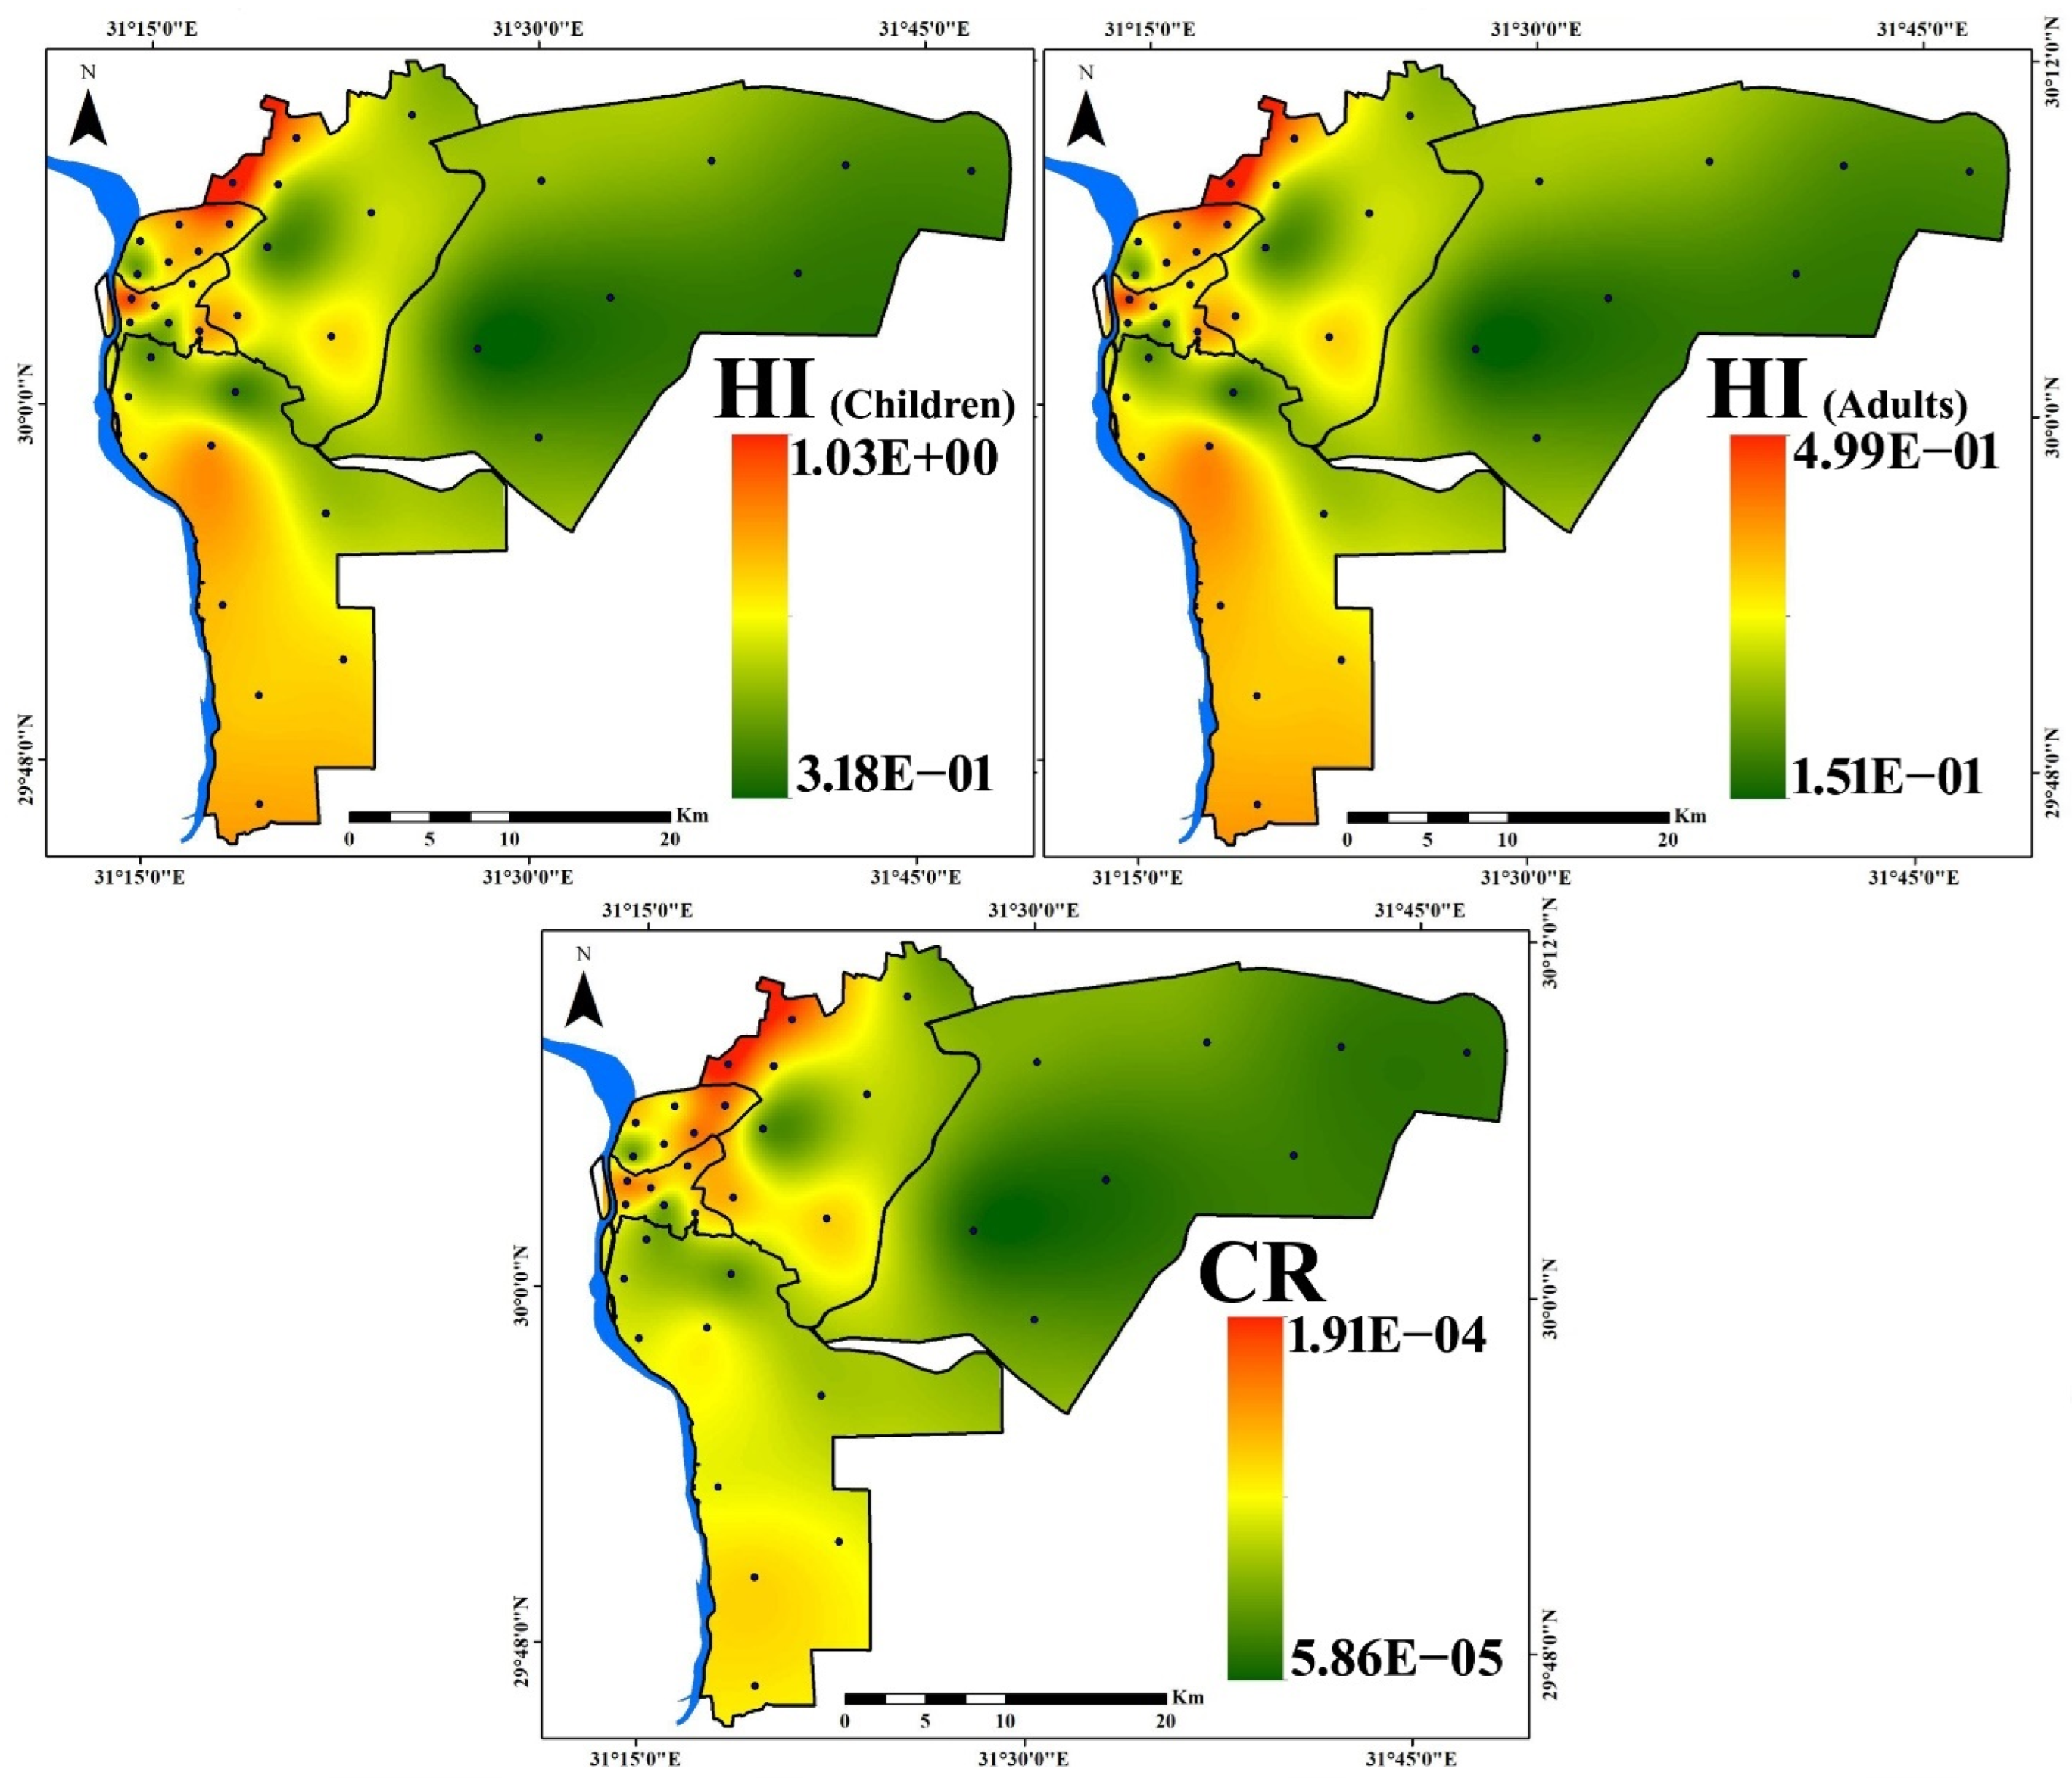
- The health risk assessment model revealed that the vital route of potential PTE exposure that leads to both noncarcinogenic and carcinogenic risks is ingestion, followed by dermal and inhalation pathways. The noncarcinogenic risk was generally in the safe range for adults’ exposure. Children are at risk in some sites, where HI values for the measured PTEs in household dust are higher than the recommended safe limit. Prolonged exposure to household dust in Cairo City would produce cancer risk to inhabitants.
- (4)
- The critical contributors to noncancer risk are Pb, As, Cr, Mn, V, and Al. The main causes of cancer risk are Ni, As, and Cr.
- (5)
- The study’s findings call for regular detection and assessment of the PTE concentrations and health risk in indoor dust in Cairo City, as well as initiation and facilitation of public health policy development, prevention of anthropogenic source pollutants, and implementation of specific control measures.
Supplementary Materials
Author Contributions
Funding
Institutional Review Board Statement
Informed Consent Statement
Data Availability Statement
Acknowledgments
Conflicts of Interest
References
- Alotaibi, M.O.; Albedair, L.A.; Alotaibi, N.M.; Elobeid, M.M.; Al-Swadi, H.A.; Alasmary, Z.; Ahmad, M. Pollution Indexing and Health Risk Assessment of Heavy-Metals-Laden Indoor and Outdoor Dust in Elementary School Environments in Riyadh, Saudi Arabia. Atmosphere 2022, 13, 464. [Google Scholar] [CrossRef]
- Chen, R.; Han, L.; Liu, Z.; Zhao, Y.; Li, R.; Xia, L.; Fan, Y. Assessment of Soil-Heavy Metal Pollution and the Health Risks in a Mining Area from Southern Shaanxi Province, China. Toxics 2022, 10, 385. [Google Scholar] [CrossRef] [PubMed]
- Yehia, M.; Baghdady, A.; Howari, F.M.; Awad, S.; Gad, A. Natural radioactivity and groundwater quality assessment in the northern area of the Western Desert of Egypt. J. Hydrol. Reg. Stud. 2017, 12, 331–344. [Google Scholar] [CrossRef]
- Mugudamani, I.; Oke, S.A.; Gumede, T.P. Influence of Urban Informal Settlements on Trace Element Accumulation in Road Dust and Their Possible Health Implications in Ekurhuleni Metropolitan Municipality, South Africa. Toxics 2022, 10, 253. [Google Scholar] [CrossRef]
- Farhat, H.I. Impact of Drain Effluent on Surficial Sediments in the Mediterranean Coastal Wetland: Sedimentological Characteristics and Metal Pollution Status at Lake Manzala, Egypt. J. Ocean Univ. China 2019, 18, 834–848. [Google Scholar] [CrossRef]
- Zhou, L.; Liu, G.; Shen, M.; Liu, Y. Potential Ecological and Health Risks of Heavy Metals for Indoor and Corresponding Outdoor Dust in Hefei, Central China. Chemosphere 2022, 302, 134864. [Google Scholar] [CrossRef] [PubMed]
- Davis, F.R.; Ali, H.H.; Rosenzweig, J.A.; Vrinceanu, D.; Maruthi Sridhar, B.B. Characterization of Chemical and Bacterial Concentrations in Floor Dust Samples in Southeast Texas Households. Int. J. Environ. Res. Public Health 2021, 18, 12399. [Google Scholar] [CrossRef] [PubMed]
- Baghdady, A.; Awad, S.; Gad, A. Assessment of metal contamination and natural radiation hazards in different soil types near iron ore mines, Bahariya Oasis, Egypt. Arab. J. Geosci. 2018, 11, 506. [Google Scholar] [CrossRef]
- Aguilera, A.; Bautista-Hernández, D.; Bautista, F.; Goguitchaichvili, A.; Cejudo, R. Is the Urban Form a Driver of Heavy Metal Pollution in Road Dust? Evidence from Mexico City. Atmosphere 2021, 12, 266. [Google Scholar] [CrossRef]
- Famuyiwa, A.O.; Davidson, C.M.; Ande, S.; Oyeyiola, A.O. Potentially Toxic Elements in Urban Soils from Public-Access Areas in the Rapidly Growing Megacity of Lagos, Nigeria. Toxics 2022, 10, 154. [Google Scholar] [CrossRef]
- Gad, A.; Abd El Bakey, S.M.; Sakr, S. Concentrations of heavy metals and associated human health risk in unrefined salts of inland hypersaline lakes, Egypt. Int. J. Environ. Anal. Chem. 2020, 102, 1278–1291. [Google Scholar] [CrossRef]
- Cao, S.; Wen, D.; Chen, X.; Duan, X.; Zhang, L.; Wang, B.; Qin, N.; Wei, F. Source Identification of Pollution and Health Risks to Metals in Household Indoor and Outdoor Dust: A Cross-Sectional Study in a Typical Mining Town, China. Environ. Pollut. 2022, 293, 118551. [Google Scholar] [CrossRef]
- Tashakor, M.; Behrooz, R.D.; Asvad, S.R.; Kaskaoutis, D.G. Tracing of Heavy Metals Embedded in Indoor Dust Particles from the Industrial City of Asaluyeh, South of Iran. Int. J. Environ. Res. Public Health 2022, 19, 7905. [Google Scholar] [CrossRef]
- Alghamdi, M.A.; Hassan, S.K.; Alzahrani, N.A.; Almehmadi, F.M.; Khoder, M.I. Risk Assessment and Implications of Schoolchildren Exposure to Classroom Heavy Metals Particles in Jeddah, Saudi Arabia. Int. J. Environ. Res. Public Health 2019, 16, 5017. [Google Scholar] [CrossRef]
- Pelfrêne, A.; Cave, M.R.; Wragg, J.; Douay, F. In Vitro Investigations of Human Bioaccessibility from Reference Materials Using Simulated Lung Fluids. Int. J. Environ. Res. Public Health 2017, 14, 112. [Google Scholar] [CrossRef] [PubMed]
- Jurowski, K.; Buszewski, B.; Piekoszewski, W. The analytical calibration in (bio)imaging/mapping of the metallic elements in biological samples–definitions, nomenclature and strategies: State of the art. Talanta 2015, 131, 273–285. [Google Scholar] [CrossRef] [PubMed]
- Cui, X.; Wang, X.; Liu, B. The Characteristics of Heavy Metal Pollution in Surface Dust in Tangshan, a Heavily Industrialized City in North China, and an Assessment of Associated Health Risks. J. Geochem. Explor. 2020, 210, 106432. [Google Scholar] [CrossRef]
- Wang, Y.; Fang, F.; Lin, Y.; Cai, J.; Zhang, C.; Ge, Y. Pollution and Influencing Factors of Heavy Metals from Rural Kitchen Dust in Anhui Province, China. Atmos. Pollut. Res. 2020, 11, 1211–1216. [Google Scholar] [CrossRef]
- Gohain, M.; Deka, P. Trace Metals in Indoor Dust from a University Campus in Northeast India: Implication for Health Risk. Environ. Monit. Assess. 2020, 192, 741. [Google Scholar] [CrossRef]
- Rasmussen, P.E.; Levesque, C.; Chénier, M.; Gardner, H.D. Contribution of metals in resuspended dust to indoor and personal inhalation exposures: Relationships between PM10 and settled dust. Build. Environ. 2018, 143, 513–522. [Google Scholar] [CrossRef]
- Cheng, Z.; Chen, L.J.; Li, H.H.; Lin, J.Q.; Yang, Z.B.; Yang, Y.X.; Xu, X.X.; Xian, J.R.; Shao, J.R.; Zhu, X.M. Characteristics and Health Risk Assessment of Heavy Metals Exposure via Household Dust from Urban Area in Chengdu, China. Sci. Total Environ. 2018, 619–620, 621–629. [Google Scholar] [CrossRef] [PubMed]
- Famuyiwa, A.O.; Entwistle, J.A. Characterising and communicating the potential hazard posed by potentially toxic elements in indoor dusts from schools across Lagos, Nigeria. Environ. Sci. Process. Impacts 2021, 23, 867. [Google Scholar] [CrossRef]
- Hassan, S.K.M. Metal concentrations and distribution in the household, stairs and entryway dust of some Egyptian homes. Atmos. Environ. 2012, 54, 207–215. [Google Scholar] [CrossRef]
- Khoder, M.I.; Hassan, S.K.; El-Abssawy, A.A. An Evaluation of Loading Rate of Dust, Pb, Cd, and Ni and Metals Mass Concentration in the Settled Surface Dust in Domestic Houses and Factors Affecting Them. Indoor Built Environ. 2010, 19, 391–399. [Google Scholar] [CrossRef]
- Marinho-Reis, A.P.; Costa, C.; Rocha, F.; Cave, M.; Wragg, J.; Valente, T.; Sequeira-Braga, A.; Noack, Y. Biogeochemistry of Household Dust Samples Collected from Private Homes of a Portuguese Industrial City. Geosciences 2020, 10, 392. [Google Scholar] [CrossRef]
- Osman, R.; Melegy, A.; Dawood, Y.; Gad, A. Distribution of some potentially toxic heavy metals in the soil of Shoubra El Kheima, Egypt. Egypt. J. Chem. 2021, 64, 1965–1980. [Google Scholar] [CrossRef]
- Ibrahim, E.A.; Selim, E.M.M. Pollution and health risk assessment of trace metal in vegetable field soils in the Eastern Nile Delta, Egypt. Environ. Monit. Assess. 2022, 194, 540. [Google Scholar] [CrossRef]
- Osman, R.; Dawood, Y.H.; Melegy, A.; El-Bady, M.S.; Saleh, A.; Gad, A. Distributions and Risk Assessment of the Natural Radionuclides in the Soil of Shoubra El Kheima, South Nile Delta, Egypt. Atmosphere 2022, 13, 98. [Google Scholar] [CrossRef]
- Ramadan, R.S.; Dawood, Y.H.; Yehia, M.M.; Gad, A. Environmental and health impact of current uranium mining activities in southwestern Sinai, Egypt. Environ. Earth Sci. 2022, 81, 213. [Google Scholar] [CrossRef]
- Nasralla, M.M. Studies on indoor air quality in Egypt. Environ. Int. 1980, 4, 469–473. [Google Scholar] [CrossRef]
- Safar, Z.S.; Labib, M.W. Assessment of particulate matter and lead levels in the Greater Cairo area for the period 1998–2007. J. Advan. Res. 2010, 1, 53–63. [Google Scholar] [CrossRef]
- Lowenthal, D.H.; Gertler, A.W.; Labib, M.W. Particulate matter source apportionment in Cairo: Recent measurements and comparison with previous studies. Int. J. Environ. Sci. Technol. 2014, 11, 657–670. [Google Scholar] [CrossRef]
- Hindy, K.T.; Baghdady, A.R.; Howari, F.M.; Abdelmaksoud, A.S. A Qualitative Study of Airborne Minerals and Associated Organic Compounds in Southeast of Cairo, Egypt. Int. J. Environ. Res. Public Health 2018, 15, 568. [Google Scholar] [CrossRef] [PubMed]
- Shaltout, A.A.; Hassan, S.K.; Alomairy, S.E.; Manousakas, M.; Karydas, A.G.; Eleftheriadis, E. Correlation between inorganic pollutants in the suspended particulate matter (SPM) and fine particulate matter (PM2.5) collected from industrial and residential areas in Greater Cairo, Egypt. Air Qual. Atmos. Health 2019, 12, 241–250. [Google Scholar] [CrossRef]
- Abdel-Salam, M.M.M. Relationship between residential indoor air quality and socioeconomic factors in two urban areas in Alexandria, Egypt. Build. Environ. 2022, 207, 108425. [Google Scholar] [CrossRef]
- Hassan, S.K.; El-Abssawy, A.A.; Khoder, M.I. Chemical Composition, Characterization and Factors Affecting Household Dust (<20 μm) in Greater Cairo, Egypt. Open J. Air Pollut. 2015, 4, 184–197. [Google Scholar] [CrossRef]
- Hassan, Y.; Shoeib, T. Levels of polybrominated diphenyl ethers and novel flame retardants in microenvironment dust from Egypt: An assessment of human exposure. Sci. Total Environ. 2015, 505, 47–55. [Google Scholar] [CrossRef]
- Shoeib, T.; Hassan, Y.; Rauert, C.; Harner, T. Poly- and perfluoroalkyl substances (PFASs) in indoor dust and food packaging materials in Egypt: Trends in developed and developing countries. Chemosphere 2016, 144, 1573–1581. [Google Scholar] [CrossRef]
- Khairy, M.A.; Lohmann, R. Organophosphate flame retardants in the indoor and outdoor dust and gas-phase of Alexandria, Egypt. Chemosphere 2019, 220, 275–285. [Google Scholar] [CrossRef]
- Hassan, S.K.; El-Mekawy, A.; Alghamdi, M.A.; Khoder, M.I. Insights into the house dust-bound polycyclic aromatic hydrocarbons and their potential human health risk in Greater Cairo, Egypt. Indoor Built Environ. 2022. [Google Scholar] [CrossRef]
- Heikal, H.M. Studies on the occurrence, identification and control of house dust mites at rural houses of Shebin El-Kom locality, Egypt. Pak. J. Biol. Sci. 2015, 18, 179–184. [Google Scholar] [CrossRef] [PubMed][Green Version]
- EL-Morsy, E.S.M. Preliminary survey of indoor and outdoor airborne microfungi at coastal buildings in Egypt. Aerobiologia 2006, 22, 197–210. [Google Scholar] [CrossRef]
- Radwan, S.M.A.; Abdel-Aziz, R.A. Evaluation of microbial content of indoor air in hot arid climate. Int. J. Environ. Sci. Technol. 2019, 16, 5429–5438. [Google Scholar] [CrossRef]
- Hassanien, M.A.; Rieuwerts, J.; Shakour, A.A.; Bitto, A. Seasonal and annual variations in air concentrations of Pb, Cd and PAHs in Cairo, Egypt. Int. J. Environ. Health Res. 2001, 11, 13–27. [Google Scholar] [CrossRef]
- Jadoon, W.A.; Abdel-Dayem, S.M.M.A.; Saqib, Z.; Takeda, K.; Sakugawa, H.; Hussain, M.; Shah, G.M.; Rehman, W.; Syed, J.H. Heavy metals in urban dusts from Alexandria and Kafr El-Sheikh, Egypt: Implications for human health. Environ. Sci. Pollut. Res. 2021, 28, 2007–2018. [Google Scholar] [CrossRef] [PubMed]
- Aly, D.; Dimitrijevic, B. Public green space quantity and distribution in Cairo, Egypt. J. Eng. Appl. Sci. 2022, 69, 15. [Google Scholar] [CrossRef]
- Higazy, M.; Essa, K.S.M.; Mubarak, F.; El-Sayed, E.M.; Sallam, A.M.; Talaat, M.S. Analytical Study of Fuel Switching from Heavy Fuel Oil to Natural Gas in clay brick factories at Arab Abu Saed, Greater Cairo. Sci. Rep. 2019, 9, 10081. [Google Scholar] [CrossRef]
- Saleh, A.; Dawood, Y.H.; Gad, A. Assessment of Potentially Toxic Elements’ Contamination in the Soil of Greater Cairo, Egypt Using Geochemical and Magnetic Attributes. Land 2022, 11, 319. [Google Scholar] [CrossRef]
- ISO 11466; Soil Quality—Extraction of Trace Elements Soluble in Aqua Regia. ISO: Geneva, Switzerland, 1995.
- Hakanson, L. An ecological risk index for aquatic pollution control: A sedimentological approach. Water Res. 1980, 14, 975–1001. [Google Scholar] [CrossRef]
- Taylor, S.R.; McLennan, S.M. The geochemical evolution of the continental crust. Rev. Geophys. 1995, 33, 241–265. [Google Scholar] [CrossRef]
- USEPA (United States Environmental Protection Agency). Risk Assessment Guidance for Superfund. Human Health Evaluation Manual (Part F, Supplemental Guidance for Inhalation Risk Assessment) EPA/540/R/070/002, Volume I; Office of Superfund Remediation and Technology Innovation: Washington, DC, USA, 2009.
- USEPA (United States Environmental Protection Agency). Exposure Factors Handbook 2011 Edition; EPA/600/R-09/052F; National Center for Environmental Assessment, Office of Research and Development U.S. Environmental Protection Agency: Washington, DC, USA, 2011.
- USEPA (United States Environmental Protection Agency). Integrated Risk Information System National Center for Environmental Assessment Office of Research and Development U.S.; Environmental Protection Agency: Washington, DC, USA, 2017.
- USEPA (United States Environmental Protection Agency). Child Specific Exposure Factors Handbook; EPA-600-P-00–002B; National Center for Environmental Assessment: Washington, DC, USA, 2002.
- USEPA (United States Environmental Protection Agency). Soil Screening Guidance: Technical Background Document; Office of Soild Waste and Emergency Response: Washington, DC, USA, 1996.
- Ferreira-Baptista, L.; De Miguel, E. Geochemistry and risk assessment of street dust in Luanda, Angola: A tropical urban environment. Atmos. Environ. 2005, 39, 4501–4512. [Google Scholar] [CrossRef]
- USDOE (United States Department of Energy). The Risk Assessment Information System (RAIS); Department of Energy’s Oak Ridge Operations Office (ORO): Oak Ridge, TN, USA, 2011.
- Lin, Y.; Fang, F.; Wang, F.; Xu, M. Pollution distribution and health risk assessment of heavy metals in indoor dust in Anhui rural, China. Environ. Monit. Assess. 2015, 187, 565. [Google Scholar] [CrossRef] [PubMed]
- Neisi, A.; Goudarzi, G.; Akbar Babaei, A.; Vosoughi, M.; Hashemzadeh, H.; Naimabadi, A.; Mohammadi, M.; Hashemzadeh, B. Study of heavy metal levels in indoor dust and their health risk assessment in children of Ahvaz city, Iran. Toxin Rev. 2016, 35, 16–23. [Google Scholar] [CrossRef]
- Nezhad, M.T.K.; Tabatabaii, S.M.; Gholami, A. Geochemical assessment of steel smelter-impacted urban soils, Ahvaz, Iran. J. Geochem. Explor. 2015, 152, 91–109. [Google Scholar] [CrossRef]
- Vosoughi, M.; Shahi Zavieh, F.; Mokhtari, S.A.; Sadeghi, H. Health risk assessment of heavy metals in dust particles precipitated on the screen of computer monitors. Environ. Sci. Pollut. Res. 2021, 28, 40771–40781. [Google Scholar] [CrossRef] [PubMed]
- Gaberšek, M.; Gosar, M. Towards a holistic approach to the geochemistry of solid inorganic particles in the urban environment. Sci. Total Environ. 2021, 763, 144214. [Google Scholar] [CrossRef]
- Stamatelopoulou, A.; Dasopoulou, M.; Bairachtari, K.; Karavoltsos, S.; Sakellari, A.; Maggos, T. Contamination and Potential Risk Assessment of Polycyclic Aromatic Hydrocarbons (PAHs) and Heavy Metals in House Settled Dust Collected from Residences of Young Children. Appl. Sci. 2021, 11, 1479. [Google Scholar] [CrossRef]
- Yadav, I.S.; Devi, N.L.; Singh, V.K.; Li, J.; Zhang, G. Spatial distribution, source analysis, and health risk assessment of heavy metals contamination in house dust and surface soil from four major cities of Nepal. Chemosphere 2019, 218, 1100–1113. [Google Scholar] [CrossRef]
- Mahfouz, M.; Yigiterhan, O.; Elnaiem, A.; Hassan, H.; Alfoldy, B. Elemental compositions of particulate matter retained on air condition unit’s filters at Greater Doha, Qatar. Environ. Geochem. Health 2019, 41, 2533–2548. [Google Scholar] [CrossRef]
- Kurt-Karakus, P.B. Determination of heavy metals in indoor dust from Istanbul, Turkey: Estimation of the health risk. Environ. Int. 2012, 50, 47–55. [Google Scholar] [CrossRef]
- Al-Dulaimi, E.M.; Shartooh, S.M.; Al-Heety, E.A. Concentration, Distribution, and Potential Sources of Heavy Metals in Households Dust in Al-Fallujah, Iraq. Iraqi Geol. J. 2021, 54, 120–130. [Google Scholar] [CrossRef]
- Dingle, J.H.; Kohl, L.; Khan, N.; Meng, M.; Shi, Y.A.; Pedroza-Brambila, M.; Chow, C.; Chan, A.W.H. Sources and composition of metals in indoor house dust in a mid-size Canadian city. Environ. Pollut. 2021, 289, 117867. [Google Scholar] [CrossRef] [PubMed]
- Chattopadhyay, G.; Lin, K.C.P.; Feitz, A.J. Household dust metal levels in the Sydney metropolitan area. Environ. Res. 2003, 93, 301–307. [Google Scholar] [CrossRef]
- Al-Harbi, M.; Alhajri, I.; Whalen, J.K. Characteristics and health risk assessment of heavy metal contamination from dust collected on household HVAC air filters. Chemosphere 2021, 277, 130276. [Google Scholar] [CrossRef] [PubMed]
- Yoshinaga, J.; Yamasaki, K.; Yonemura, A.; Ishibashi, Y.; Kaido, T.; Mizuno, K.; Takagi, M.; Tanaka, A. Lead and other elements in house dust of Japanese residences–Source of lead and health risks due to metal exposure. Environ. Pollut. 2014, 189, 223–228. [Google Scholar] [CrossRef]
- Evans, J.D. Straight Forward Statistics for the Behavioral Sciences; Brook/Cole Publishing: Pacific Grove, CA, USA, 1996. [Google Scholar]
- Khalifa, M.; Gad, A. Assessment of heavy metals contamination in agricultural soil of southwestern Nile Delta, Egypt. Soil. Sediment. Contam. 2018, 27, 619–642. [Google Scholar] [CrossRef]
- Marinho Reis, A.P.; Cave, M.; Sousa, A.J.; Wragg, J.; Rangel, M.J.; Oliveira, A.R.; Patinha, C.; Rocha, F.; Orsiere, T.; Noack, Y. Lead and Zinc Concentrations in Household Dust and Toenails of the Residents (Estarreja, Portugal): A Source-Pathway-Fate Model. Environ. Sci. Process. Impacts 2018, 20, 1210–1224. [Google Scholar] [CrossRef]
- Saleh, A. Evaluation of heavy metals pollution in the soil of Helwan, Cairo, Egypt using magnetic and chemical analysis techniques. In Proceedings of the SUPTM 2022, Online, 17–19 January 2022. [Google Scholar] [CrossRef]
- Ferguson, J.E.; Kim, N.D. Trace elements in street and house dusts: Source and speciation. Sci. Total Environ. 1991, 100, 125–150. [Google Scholar] [CrossRef]
- Turner, A. Oral bioaccessibility of trace metals in household dust: A review. Environ. Geochem. Health 2011, 33, 331–341. [Google Scholar] [CrossRef]
- Doležalová Weissmannová, H.; Mihočová, S.; Chovanec, P.; Pavlovský, J. Potential Ecological Risk and Human Health Risk Assessment of Heavy Metal Pollution in Industrial Affected Soils by Coal Mining and Metallurgy in Ostrava, Czech Republic. Int. J. Environ. Res. Public Health 2019, 16, 4495. [Google Scholar] [CrossRef]
- Gunier, R.B.; Jerrett, M.; Smith, D.R.; Jursa, T.; Yousefi, P.; Camacho, J.; Hubbard, A.; Eskenazi, B.; Bradman, A. Determinants of manganese levels in house dust samples from the CHAMACOS cohort. Sci. Total Environ. 2014, 497, 360–368. [Google Scholar] [CrossRef] [PubMed]
- Iwegbue, C.; Obi, G.; Emoyan, O.; Odali, E.; Egobueze, F.; Tesi, G.; Nwajei, G.; Martincigh, B. Characterization of metals in indoor dusts from electronic workshops, cybercafes and offices in southern Nigeria: Implications for on-site human exposure. Ecotoxicol. Environ. Saf. 2018, 159, 342–353. [Google Scholar] [CrossRef] [PubMed]
- Harb, M.; Ebqa’ai, M.; Al-rashidi, A.; Alaziqi, B.H.; Al Rashdi, M.S.; Ibrahim, B. Investigation of selected heavy metals in street and house dust from Al-Qunfudah, Kingdom of Saudi Arabia. Environ. Earth Sci. 2015, 74, 1755–1763. [Google Scholar] [CrossRef]
- Meza-Figueroa, D.; De La O-Villanueva, M.; De la Parra, M.L. Heavy metal distribution in dust from elementary schools in Hermosillo, Sonora, México. Atmos. Environ. 2007, 41, 276–288. [Google Scholar] [CrossRef]
- Dahmardeh Behrooz, R.; Tashakor, M.; Asvad, R.; Esmaili-Sari, A.; Kaskaoutis, D.G. Characteristics and Health Risk Assessment of Mercury Exposure via Indoor and Outdoor Household Dust in Three Iranian Cities. Atmosphere 2022, 13, 583. [Google Scholar] [CrossRef]
- Zhou, L.; Liu, G.; Shen, M.; Hu, R.; Sun, M.; Liu, Y. Characteristics and Health Risk Assessment of Heavy Metals in Indoor Dust from Different Functional Areas in Hefei, China. Environ. Pollut. 2019, 251, 839–849. [Google Scholar] [CrossRef]


| Term | Definition | Value | Ref. |
|---|---|---|---|
| Cs | PTE concentration | Site specific | [52,53,54,55,56,57] |
| IngR | Dust ingestion rate (mg day−1) | 200 (Children); 100 (Adults) | |
| InhR | Dust inhalation rate (m3 day−1) | 7.6 (Children); 20 (Adults) | |
| PEF | Particle emission factor (m3 kg−1) | 1.36 × 10⁹ | |
| SA | Exposed skin area (cm2) | 2699 (Children); 3950 (Adults) | |
| SL | Skin adherence factor (mg cm2 day−1) | 0.2 (Children); 0.07 (Adults) | |
| ABS | Dermal absorption factor (year) | 0.001 except for As (0.03) | |
| ED | Exposure duration (year) | 6 (Children); 24 (Adults) | |
| EF | Exposure frequency (day year−1) | 350 | |
| BW | Average body weight (kg) | 18.6 (Children); 70 (Adults) | |
| AT | Average life span for heavy metals (day) | noncarcinogens = ED×365; carcinogens = 70 × 365 | |
| CF | Transformation factor | 1 × 10⁻⁶ | |
| RfDing | Ingestion reference dose (mg kg day−1) | Al (1.00), As (3.00 × 10⁻⁴, Cd (1.00 × 10⁻³), Co (2.00 × 10⁻²), Cr (3.00 × 10⁻³), Cu (4.00 × 10⁻²), Hg (3.00 × 10⁻⁴), Mn (4.60 × 10⁻²), Mo (5.00 × 10⁻³), Ni (2.00 × 10⁻²), Pb (3.50 × 10⁻³), V (7.00 × 10⁻³), Zn (3.00 × 10⁻¹) | [57,58,59] |
| RfDinh | Inhalation reference dose (mg m3 −1) | Al (1.43 × 10⁻³), As (3.00 × 10⁻⁴), Cd (1.00 × 10⁻³), Co (5.71 × 10⁻⁶), Cr (2.86 × 10⁻⁵), Cu (4.02 × 10⁻²), Hg (8.75 × 10⁻⁵), Mn (1.43 × 10⁻⁵), Ni (2.06 × 10⁻²), Pb (3.25 × 10⁻³), V (7.00 × 10⁻³), Zn (3.00 × 10⁻¹) | [53,54,55,56,57,59,60] |
| RfDder | Dermal reference dose (mg kg day−1) | Al (1.00 × 10⁻¹), As (1.23 × 10⁻⁴), Cd (1.00 × 10⁻⁵), Co (1.60 2), Cr (6.00 × 10⁻⁵), Cu (1.20 × 10⁻²), Hg (2.10 × 10⁻⁵), Mn (1.84 × 10⁻³), Mo (1.90 × 10⁻³), Ni (5.40 × 10⁻³), Pb (5.25 × 10⁻⁴), V (7.00 × 10⁻⁵), Zn (6.00 × 10⁻²) | [53,54,55,56,57,59,60] |
| SLFing | Ingestion cancer slope factor (mg kg day−1) | As (1.5), Cd (0.38), Cr (0.5), Ni (1.7), Pb (0.0085) | [4,11,58] |
| SLFinh | Inhalation cancer slope factor (mg m3 −1) | As (15.1), Cd (6.3), Cr (0.42), Ni (0.84), Pb (0.042) | [4,57,60] |
| SLFder | Dermal contact cancer slope factor (mg kg day−1) | As (3.66), Cr (2) | [4,12] |
| Region | Al | As | Cd | Co | Cr | Cu | Fe | Hg | Mn | Mo | Ni | Pb | V | Zn | |
|---|---|---|---|---|---|---|---|---|---|---|---|---|---|---|---|
| New Cairo (n = 8) | Min. | 6300 | 2.2 | 0.3 | 4.6 | 28.0 | 34.4 | 12,700 | 0.03 | 262 | 1.1 | 14.7 | 41.8 | 28.0 | 171 |
| Max. | 8200 | 4.6 | 0.9 | 7.4 | 39.0 | 96.8 | 19,400 | 1.85 | 347 | 2.5 | 21.6 | 64.1 | 54.0 | 266 | |
| Mean | 7250 | 3.2 | 0.5 | 6.1 | 33.4 | 60.9 | 16,200 | 0.37 | 313 | 1.6 | 17.7 | 53.0 | 37.4 | 223 | |
| St.D. | 644 | 0.8 | 0.2 | 1.2 | 4.17 | 21.4 | 2389 | 0.63 | 34 | 0.5 | 2.5 | 7.9 | 9.5 | 40 | |
| Eastern (n = 8) | Min. | 5400 | 2.9 | 0.6 | 6.1 | 40.0 | 54.5 | 16,200 | 0.15 | 326 | 1.2 | 20.6 | 56.6 | 38.0 | 234 |
| Max. | 15,700 | 6.2 | 2.8 | 12.0 | 81.0 | 249.5 | 24,200 | 0.92 | 507 | 4.0 | 58.9 | 267.8 | 66.0 | 1084 | |
| Mean | 8413 | 3.9 | 1.4 | 8.5 | 60.1 | 155.7 | 20,175 | 0.41 | 402 | 2.7 | 34.2 | 127.1 | 44.8 | 486 | |
| St.D. | 3110 | 1.1 | 0.8 | 2.1 | 14.3 | 75.1 | 2796 | 0.31 | 64 | 1.1 | 12.7 | 62.6 | 9.0 | 279 | |
| Northern (n = 6) | Min. | 7000 | 2.8 | 0.9 | 6.7 | 41.0 | 77.3 | 18,600 | 0.04 | 332 | 1.6 | 21.3 | 63.8 | 42.0 | 244 |
| Max. | 7900 | 3.5 | 1.4 | 9.8 | 81.0 | 188.5 | 24,700 | 0.78 | 468 | 5.7 | 44.6 | 219.2 | 47.0 | 509 | |
| Mean | 7583 | 3.2 | 1.2 | 7.9 | 60.5 | 146.4 | 21,317 | 0.27 | 400 | 3.7 | 34.5 | 147.6 | 44.2 | 383 | |
| St.D. | 354 | 0.4 | 0.2 | 1.0 | 13.5 | 37.4 | 2187 | 0.27 | 46 | 1.4 | 8.1 | 54.0 | 1.7 | 93 | |
| Western (n = 6) | Min. | 8100 | 3.1 | 0.7 | 7.2 | 37.0 | 86.9 | 15,100 | 0.08 | 319 | 1.4 | 24.6 | 97.3 | 38.0 | 485 |
| Max. | 16,700 | 5.8 | 2.0 | 11.3 | 81.0 | 212.3 | 23,100 | 1.94 | 541 | 3.2 | 44.6 | 193.9 | 61.0 | 833 | |
| Mean | 11,683 | 4.2 | 1.2 | 9.2 | 55.2 | 149.4 | 20,233 | 0.45 | 418 | 2.4 | 35.9 | 121.9 | 49.3 | 605 | |
| St.D. | 3653 | 1.0 | 0.4 | 1.7 | 16.8 | 53.7 | 3020 | 0.73 | 79 | 0.7 | 6.7 | 36.3 | 9.8 | 161 | |
| Southern (n = 10) | Min. | 5800 | 2.8 | 0.7 | 4.3 | 29.0 | 56.4 | 14,000 | 0.05 | 277 | 1.3 | 23.8 | 50.9 | 24.0 | 300 |
| Max. | 17,700 | 7.4 | 1.1 | 19.8 | 61.0 | 164.3 | 35,200 | 0.14 | 866 | 3.0 | 34.7 | 94.9 | 67.0 | 515 | |
| Mean | 10,460 | 5.2 | 0.9 | 12.2 | 40.3 | 92.3 | 25,080 | 0.08 | 554 | 2.5 | 30.4 | 71.6 | 52.0 | 430 | |
| St.D. | 3434 | 1.5 | 0.2 | 4.8 | 9.5 | 30.4 | 6594 | 0.03 | 176 | 0.6 | 3.79 | 14.1 | 14.6 | 75 | |
| All Samples (n = 38) | Min. | 5400 | 2.2 | 0.3 | 4.3 | 28.0 | 34.4 | 12,700 | 0.03 | 262 | 1.1 | 14.7 | 41.8 | 24.0 | 171 |
| Max. | 17,700 | 7.4 | 2.8 | 19.8 | 81.0 | 249.5 | 35,200 | 1.94 | 866 | 5.7 | 58.9 | 267.8 | 67.0 | 1084 | |
| Mean | 9092 | 4.0 | 1.0 | 9.0 | 48.6 | 116.6 | 20,818 | 0.30 | 425 | 2.5 | 30.1 | 99.3 | 45.7 | 419 | |
| St.D. | 3065 | 1.3 | 0.5 | 3.4 | 15.9 | 58.6 | 4972 | 0.44 | 131 | 1.1 | 9.8 | 51.7 | 11.2 | 190 | |
| CV (%) | 33.7 | 32.3 | 51.7 | 38.3 | 32.8 | 50.3 | 23.9 | 148.1 | 31 | 41.6 | 32.5 | 52.1 | 24.6 | 45.4 | |
| UCC [51] | 80,400 | 1.5 | 0.09 | 10 | 35 | 25 | 35,000 | 0.05 | 600 | 1.5 | 20 | 20 | 60 | 71 | |
| Location | n | Al | As | Cd | Co | Cr | Cu | Fe | Hg | Mn | Mo | Ni | Pb | V | Zn | Ref. |
|---|---|---|---|---|---|---|---|---|---|---|---|---|---|---|---|---|
| Egypt (Cairo) | n = 38 | 9092 | 4.0 | 1.0 | 9.0 | 48.6 | 116.6 | 20,818 | 0.3 | 425 | 2.5 | 30.1 | 99.3 | 45.7 | 419 | This study |
| Egypt (Alexandria) | n = 5 | NA | NA | 0.8 | 3.2 | 29.2 | 141.0 | NA | NA | 237 | NA | 25.1 | 260.0 | NA | 771 | [45] |
| Egypt (Kafr El-Sheikh) | n = 4 | NA | NA | 0.3 | 8.6 | 33.4 | 46.1 | NA | NA | 438 | NA | 23.2 | 24.8 | NA | 257 | [45] |
| Saudi Arabia (Jeddah) | n = 10 | NA | 8.0 | 2.1 | 87.9 | 40.2 | NA | 8752 | NA | 392 | NA | 35.7 | 121.2 | NA | 343 | [14] |
| Saudi Arabia (Riyadh) | n = 18 | NA | NA | 0.1 | 3.5 | NA | 59.2 | 6520 | NA | 434 | NA | 15.2 | 5.0 | NA | 94 | [1] |
| Kuwait | n = 50 | 12,697 | 13.0 | NA | 12.5 | 90.0 | 209.0 | 14,453 | NA | 441 | NA | 56.0 | 158.0 | NA | 784 | [71] |
| Qatar (Doha) | n = 12 | 19,812 | 7.2 | 0.7 | 12.3 | 91.8 | 192.9 | 20,504 | NA | 370 | 15.1 | 68.7 | 65.3 | 52.1 | 824 | [66] |
| Iraq (Al-Fallujah) | n = 50 | NA | NA | 14.8 | NA | 289.5 | 65.0 | NA | NA | NA | NA | 105.7 | 75.6 | NA | 293 | [68] |
| Nigeria (Lagos) | n = 40 | 32,000 | 3.3 | 0.5 | NA | 130.0 | 28.1 | 24,500 | NA | 368 | NA | 20.9 | 47.4 | 52.4 | 208 | [22] |
| Turkey (Istanbul) | n = 31 | NA | NA | 0.8 | 5.0 | 55.0 | 156.0 | NA | NA | 136 | NA | 236.0 | 28.0 | NA | 832 | [67] |
| Iran (Ahvaz) | n = 108 | NA | NA | 0.5 | 8.5 | 18.0 | 106.0 | NA | NA | 100 | NA | 12.0 | 74.0 | NA | 554 | [60] |
| Japan | n = 100 | 15,700 | NA | 1.0 | 4.7 | 67.8 | 304.0 | 10,000 | NA | 226 | 2.1 | 59.6 | 57.9 | 24.7 | 920 | [72] |
| Slovenia (Maribor) * | n = 27 | 7400 | 4.1 | 1.1 | 6.2 | 65.0 | 140.0 | 12,700 | 0.3 | 306 | 2.9 | 38.0 | 69.0 | 17.0 | 716 | [63] |
| Portugal (Estarreja) | n = 19 | 10,500 | 11.1 | 1.0 | 5.5 | 70.6 | 261.0 | 11,900 | 0.4 | 178 | 3.2 | 67.0 | 174.0 | 15.0 | 1349 | [25] |
| Greece (Athens) | n = 20 | 4217 | 4.0 | 0.5 | NA | 65.2 | 339.0 | 4913 | 0.4 | 128 | NA | 29.9 | 46.1 | 9.0 | 401 | [64] |
| China (Huize) | n = 50 | NA | 88.5 | 25.2 | NA | 124.0 | 174.0 | NA | 1.9 | 1010 | NA | NA | 926.8 | NA | 3029 | [12] |
| Nepal * | n = 24 | NA | 3.0 | 1.8 | 28.1 | 231.0 | 275.0 | 838 | NA | 1650 | NA | 122.0 | 233.0 | NA | 1260 | [65] |
| USA (Texas) | n = 31 | 3738 | 3.6 | 1.9 | NA | 23.0 | 53.0 | 2939 | NA | 48 | NA | 12.0 | 38.0 | NA | 368 | [7] |
| Canada (Windsor) | n = 60 | 11,453 | 8.1 | 3.0 | NA | 65.8 | 139.0 | 10,826 | NA | 171 | 2.7 | 50.5 | 65.0 | 14.9 | 677 | [20] |
| Canada (Alberta) | n = 125 | 16,000 | 13.0 | 11.0 | 5.4 | 92.0 | 1900.0 | 26,000 | NA | 250 | 8.5 | 60.0 | 4500.0 | 15.0 | 14,000 | [69] |
| Australia (Sydney) | n = 82 | NA | NA | 4.4 | NA | 83.6 | 147.0 | 5850 | NA | 76 | NA | 27.2 | 389.0 | NA | 657 | [70] |
| Al | As | Cd | Co | Cr | Cu | Fe | Hg | Mn | Mo | Ni | Pb | V | Zn | |
|---|---|---|---|---|---|---|---|---|---|---|---|---|---|---|
| Al | 1.00 | 0.78 | 0.26 | 0.67 | −0.03 | 0.10 | 0.56 | 0.06 | 0.57 | 0.03 | 0.51 | 0.27 | 0.81 | 0.63 |
| As | 1.00 | 0.28 | 0.91 | −0.01 | 0.10 | 0.84 | −0.09 | 0.86 | 0.22 | 0.50 | 0.11 | 0.90 | 0.49 | |
| Cd | 1.00 | 0.24 | 0.59 | 0.69 | 0.27 | 0.30 | 0.22 | 0.42 | 0.62 | 0.65 | 0.35 | 0.61 | ||
| Co | 1.00 | 0.09 | 0.11 | 0.95 | −0.13 | 0.97 | 0.33 | 0.49 | 0.09 | 0.87 | 0.40 | |||
| Cr | 1.00 | 0.88 | 0.27 | 0.07 | 0.14 | 0.79 | 0.67 | 0.64 | 0.11 | 0.39 | ||||
| Cu | 1.00 | 0.25 | 0.13 | 0.14 | 0.66 | 0.81 | 0.79 | 0.16 | 0.68 | |||||
| Fe | 1.00 | −0.16 | 0.97 | 0.54 | 0.58 | 0.21 | 0.83 | 0.35 | ||||||
| Hg | 1.00 | −0.10 | −0.01 | 0.14 | 0.33 | −0.03 | 0.22 | |||||||
| Mn | 1.00 | 0.42 | 0.51 | 0.12 | 0.81 | 0.35 | ||||||||
| Mo | 1.00 | 0.67 | 0.56 | 0.32 | 0.30 | |||||||||
| Ni | 1.00 | 0.79 | 0.55 | 0.87 | ||||||||||
| Pb | 1.00 | 0.27 | 0.69 | |||||||||||
| V | 1.00 | 0.48 | ||||||||||||
| Zn | 1.00 | |||||||||||||
| Very Weak | Weak | Moderate | Strong | Very Strong | ||||||||||
| Noncancer Risk | ||||||||
|---|---|---|---|---|---|---|---|---|
| Children | Adults | |||||||
| ⅀HQing | ⅀HQder | ⅀HQinh | HI | ⅀HQing | ⅀HQder | ⅀HQinh | HI | |
| Min | 2.62 × 10⁻¹ | 4.85 × 10⁻² | 7.07 × 10⁻³ | 3.18 × 10⁻¹ | 1.39 × 10⁻¹ | 6.60 × 10⁻³ | 4.94 × 10⁻³ | 1.51 × 10⁻¹ |
| Max | 8.87 × 10⁻¹ | 1.28 × 10⁻¹ | 2.09 × 10⁻² | 1.03 | 4.72 × 10⁻¹ | 1.75 × 10⁻² | 1.46 × 10⁻² | 4.99 × 10⁻¹ |
| Mean | 4.79 × 10⁻¹ | 8.60 × 10⁻² | 1.14 × 10⁻² | 5.77 × 10⁻¹ | 2.55 × 10⁻¹ | 1.17 × 10⁻² | 7.95 × 10⁻³ | 2.74 × 10⁻¹ |
| Cancer Risk | ||||||||
| ⅀LADDing | ⅀LADDder | ⅀LADDinh | CR | |||||
| Min | 5.80 × 10⁻⁵ | 6.35 × 10⁻⁷ | 5.72 × 10⁻⁹ | 5.86 × 10⁻⁵ | ||||
| Max | 1.89 × 10⁻⁴ | 1.87 × 10⁻⁶ | 1.78 × 10⁻⁸ | 1.91 × 10⁻⁴ | ||||
| Mean | 1.12 × 10⁻⁴ | 1.15 × 10⁻⁶ | 1.09 × 10⁻⁸ | 1.13 × 10⁻⁴ | ||||
Publisher’s Note: MDPI stays neutral with regard to jurisdictional claims in published maps and institutional affiliations. |
© 2022 by the authors. Licensee MDPI, Basel, Switzerland. This article is an open access article distributed under the terms and conditions of the Creative Commons Attribution (CC BY) license (https://creativecommons.org/licenses/by/4.0/).
Share and Cite
Gad, A.; Saleh, A.; Farhat, H.I.; Dawood, Y.H.; Abd El Bakey, S.M. Spatial Distribution, Contamination Levels, and Health Risk Assessment of Potentially Toxic Elements in Household Dust in Cairo City, Egypt. Toxics 2022, 10, 466. https://doi.org/10.3390/toxics10080466
Gad A, Saleh A, Farhat HI, Dawood YH, Abd El Bakey SM. Spatial Distribution, Contamination Levels, and Health Risk Assessment of Potentially Toxic Elements in Household Dust in Cairo City, Egypt. Toxics. 2022; 10(8):466. https://doi.org/10.3390/toxics10080466
Chicago/Turabian StyleGad, Ahmed, Ahmed Saleh, Hassan I. Farhat, Yehia H. Dawood, and Sahar M. Abd El Bakey. 2022. "Spatial Distribution, Contamination Levels, and Health Risk Assessment of Potentially Toxic Elements in Household Dust in Cairo City, Egypt" Toxics 10, no. 8: 466. https://doi.org/10.3390/toxics10080466
APA StyleGad, A., Saleh, A., Farhat, H. I., Dawood, Y. H., & Abd El Bakey, S. M. (2022). Spatial Distribution, Contamination Levels, and Health Risk Assessment of Potentially Toxic Elements in Household Dust in Cairo City, Egypt. Toxics, 10(8), 466. https://doi.org/10.3390/toxics10080466