
Assessment of Soil-Heavy Metal Pollution and the Health Risks in a Mining Area from Southern Shaanxi Province, China

 , ,
, ,
Abstract
:1. Introduction
2. Materials and Methods
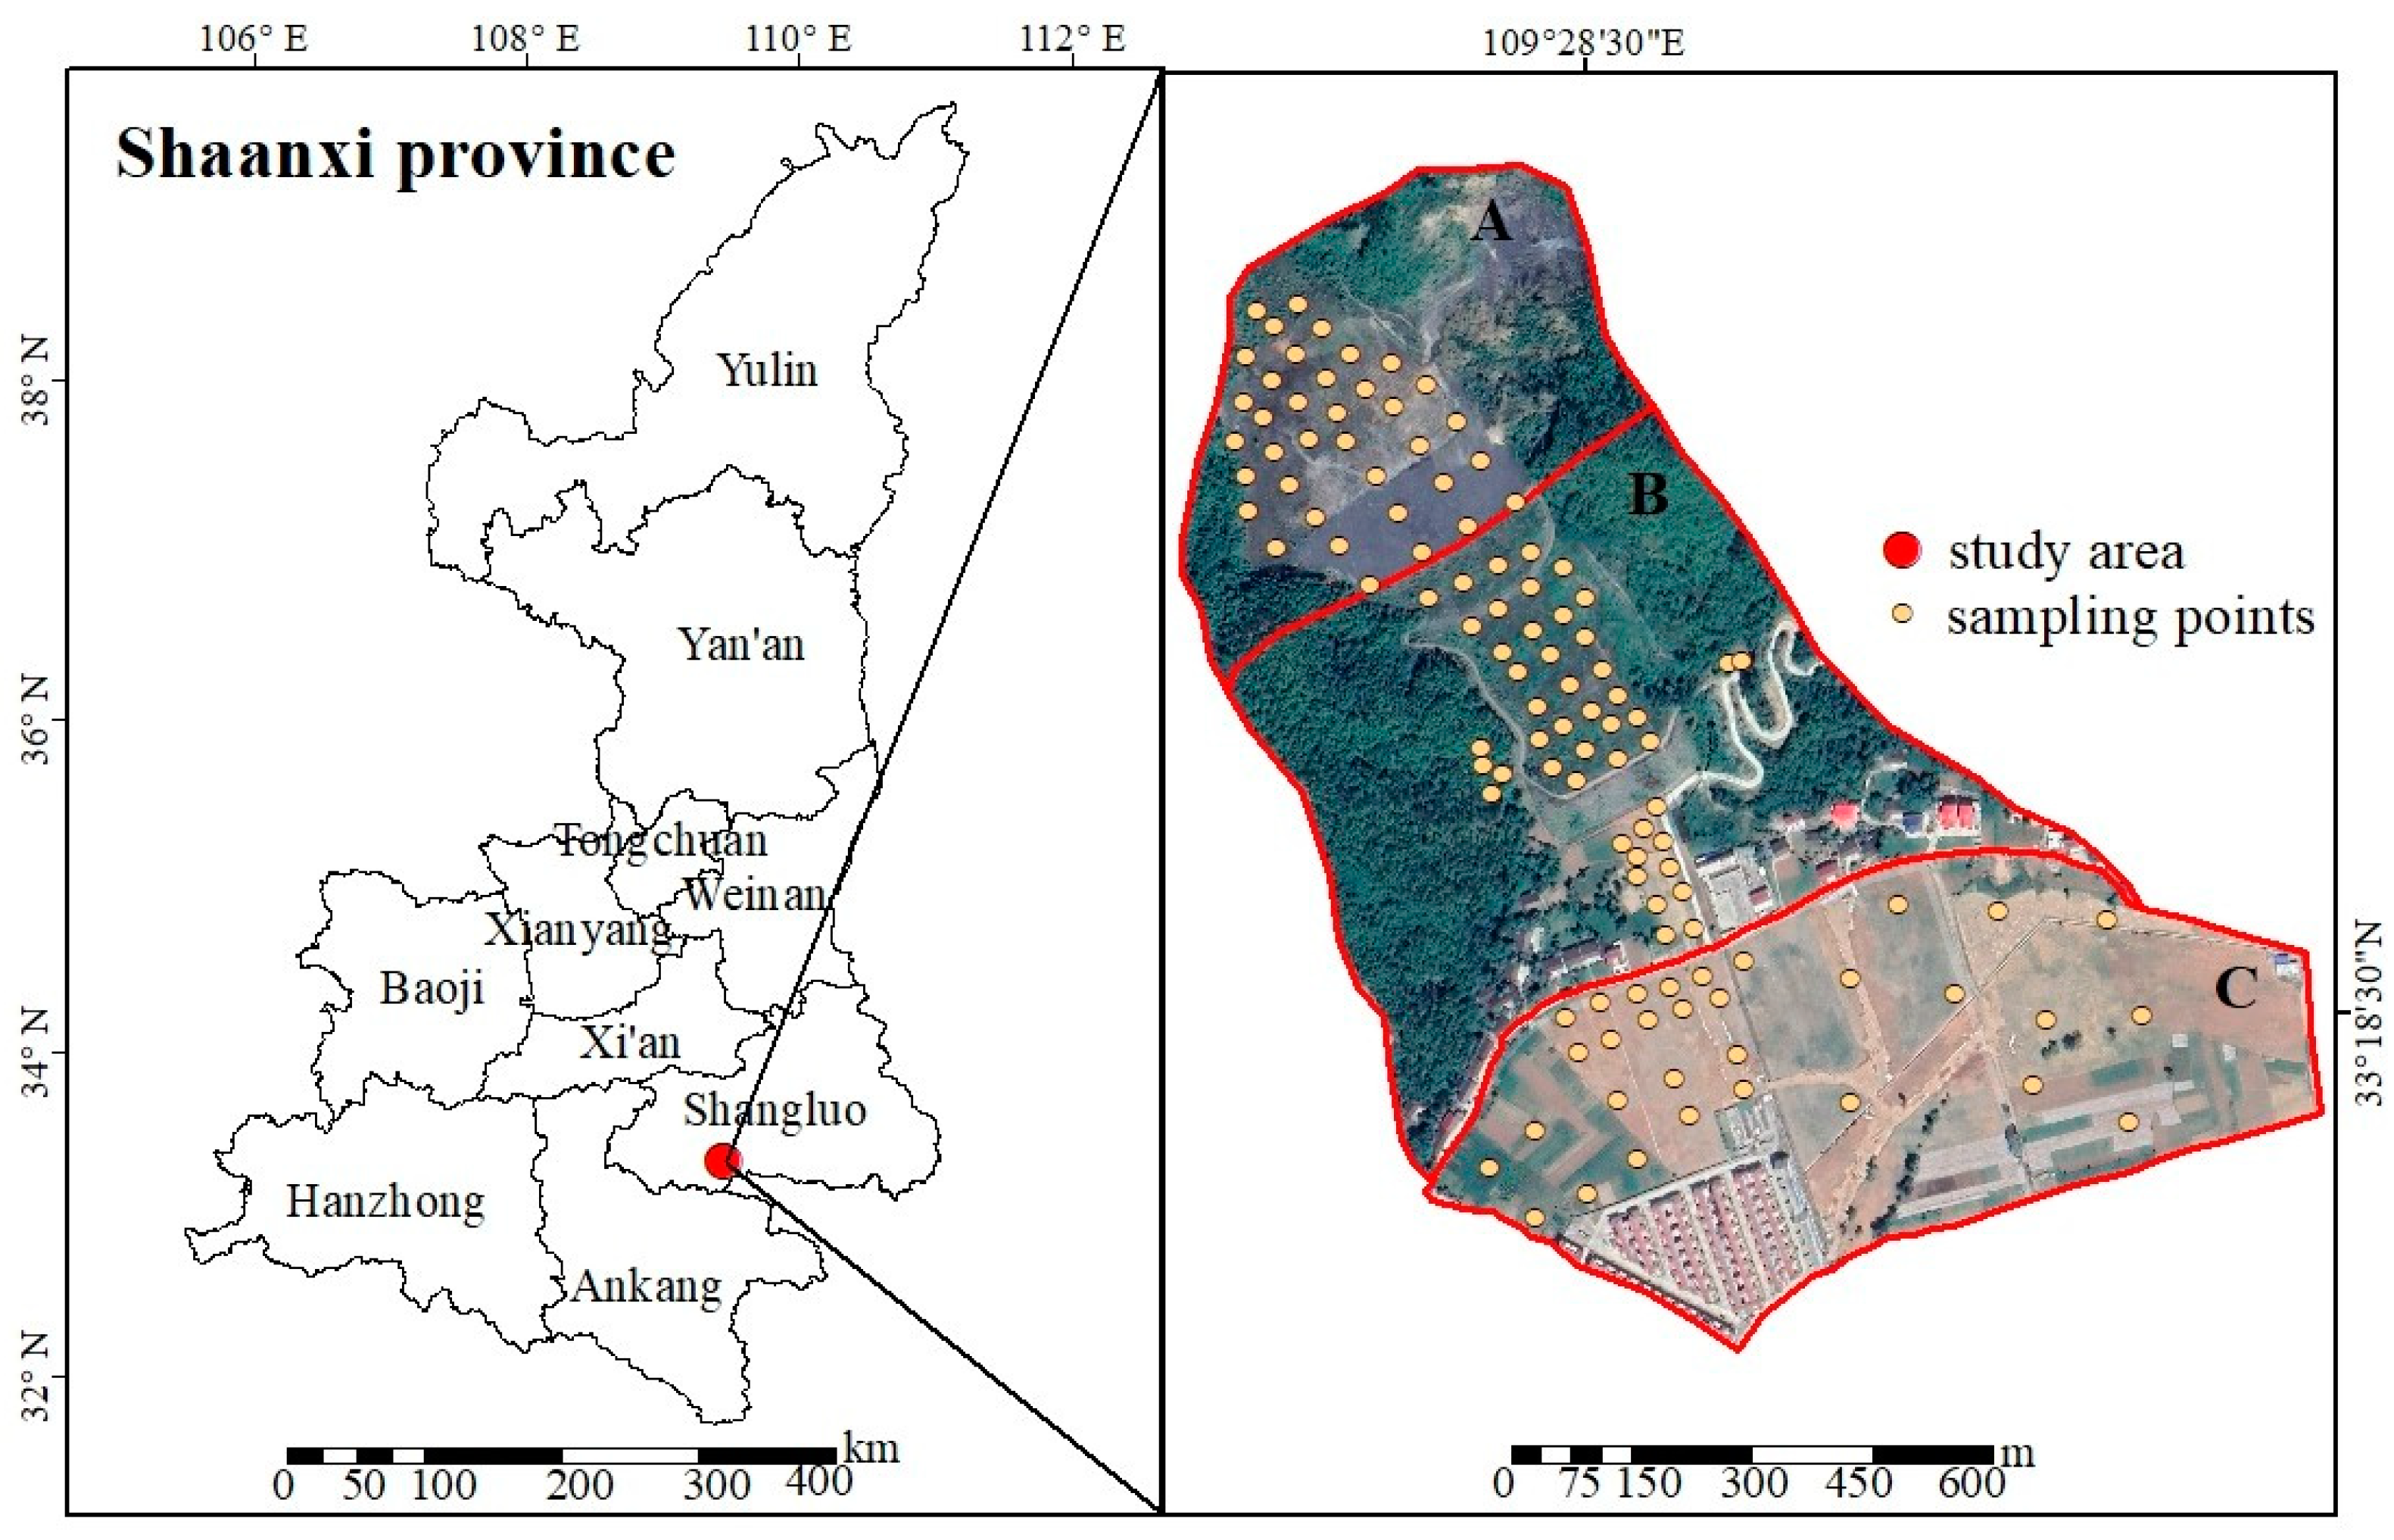
2.1. Study Area
2.2. Field Investigation Sample Collection and Measurement
2.3. Evaluation of Heavy Metal Pollution
2.3.1. Geoaccumulation Index
2.3.2. Single-Factor Pollution Index
2.3.3. Potential Ecological Risk Index
2.4. Human Health Risk Assessment
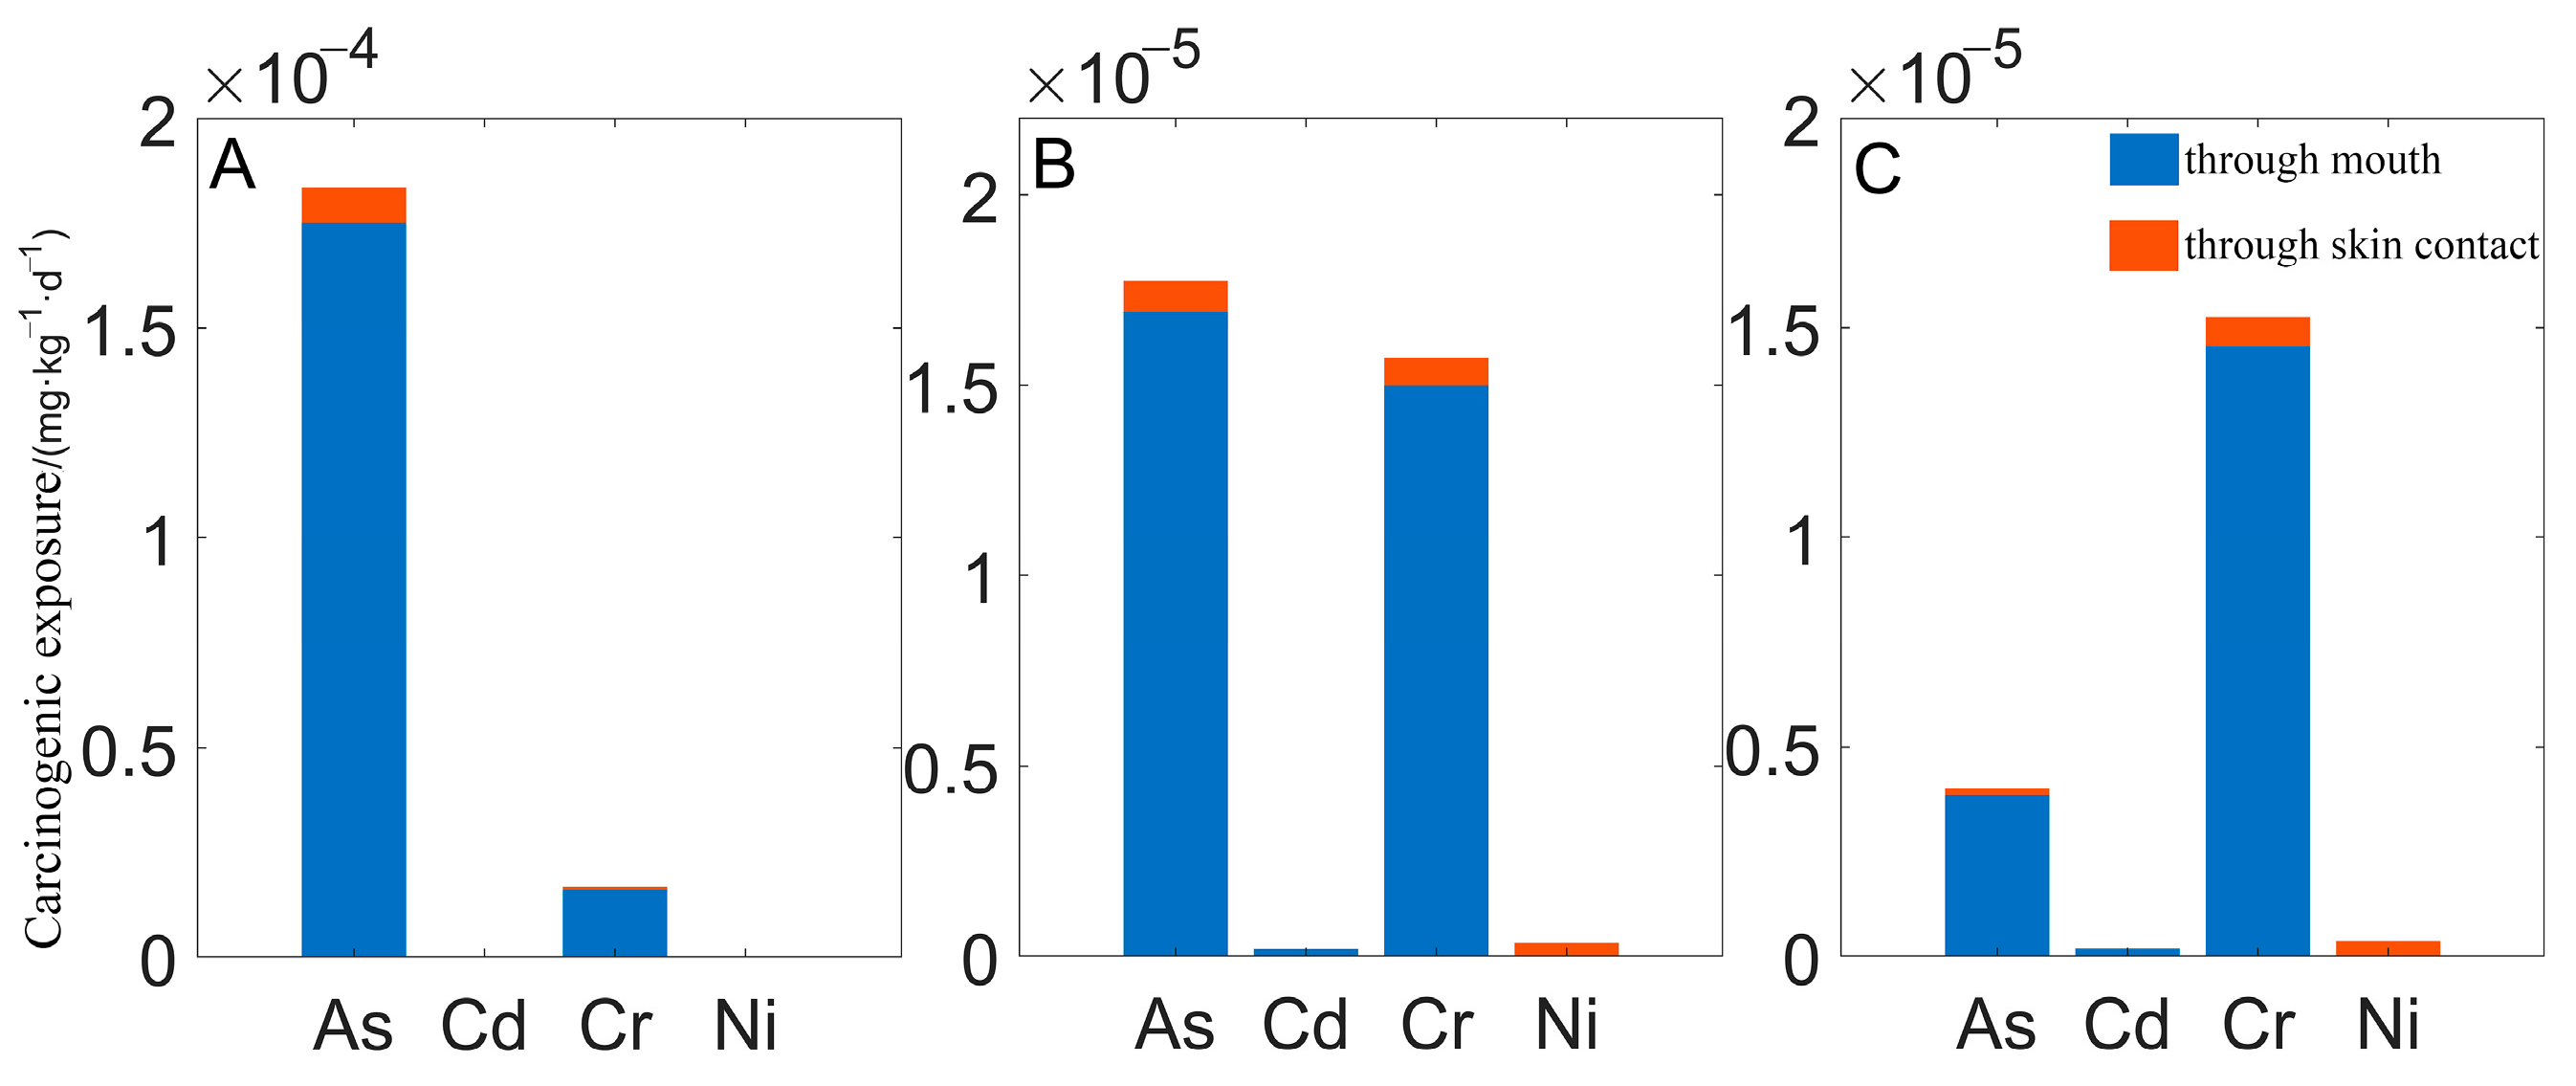
- The daily exposure of heavy metals through oral intake and skin contact is calculated as follows:where Ci (mg·kg−1) is the measured content of heavy metals in the soil, and the other parameters are shown in Table 4.
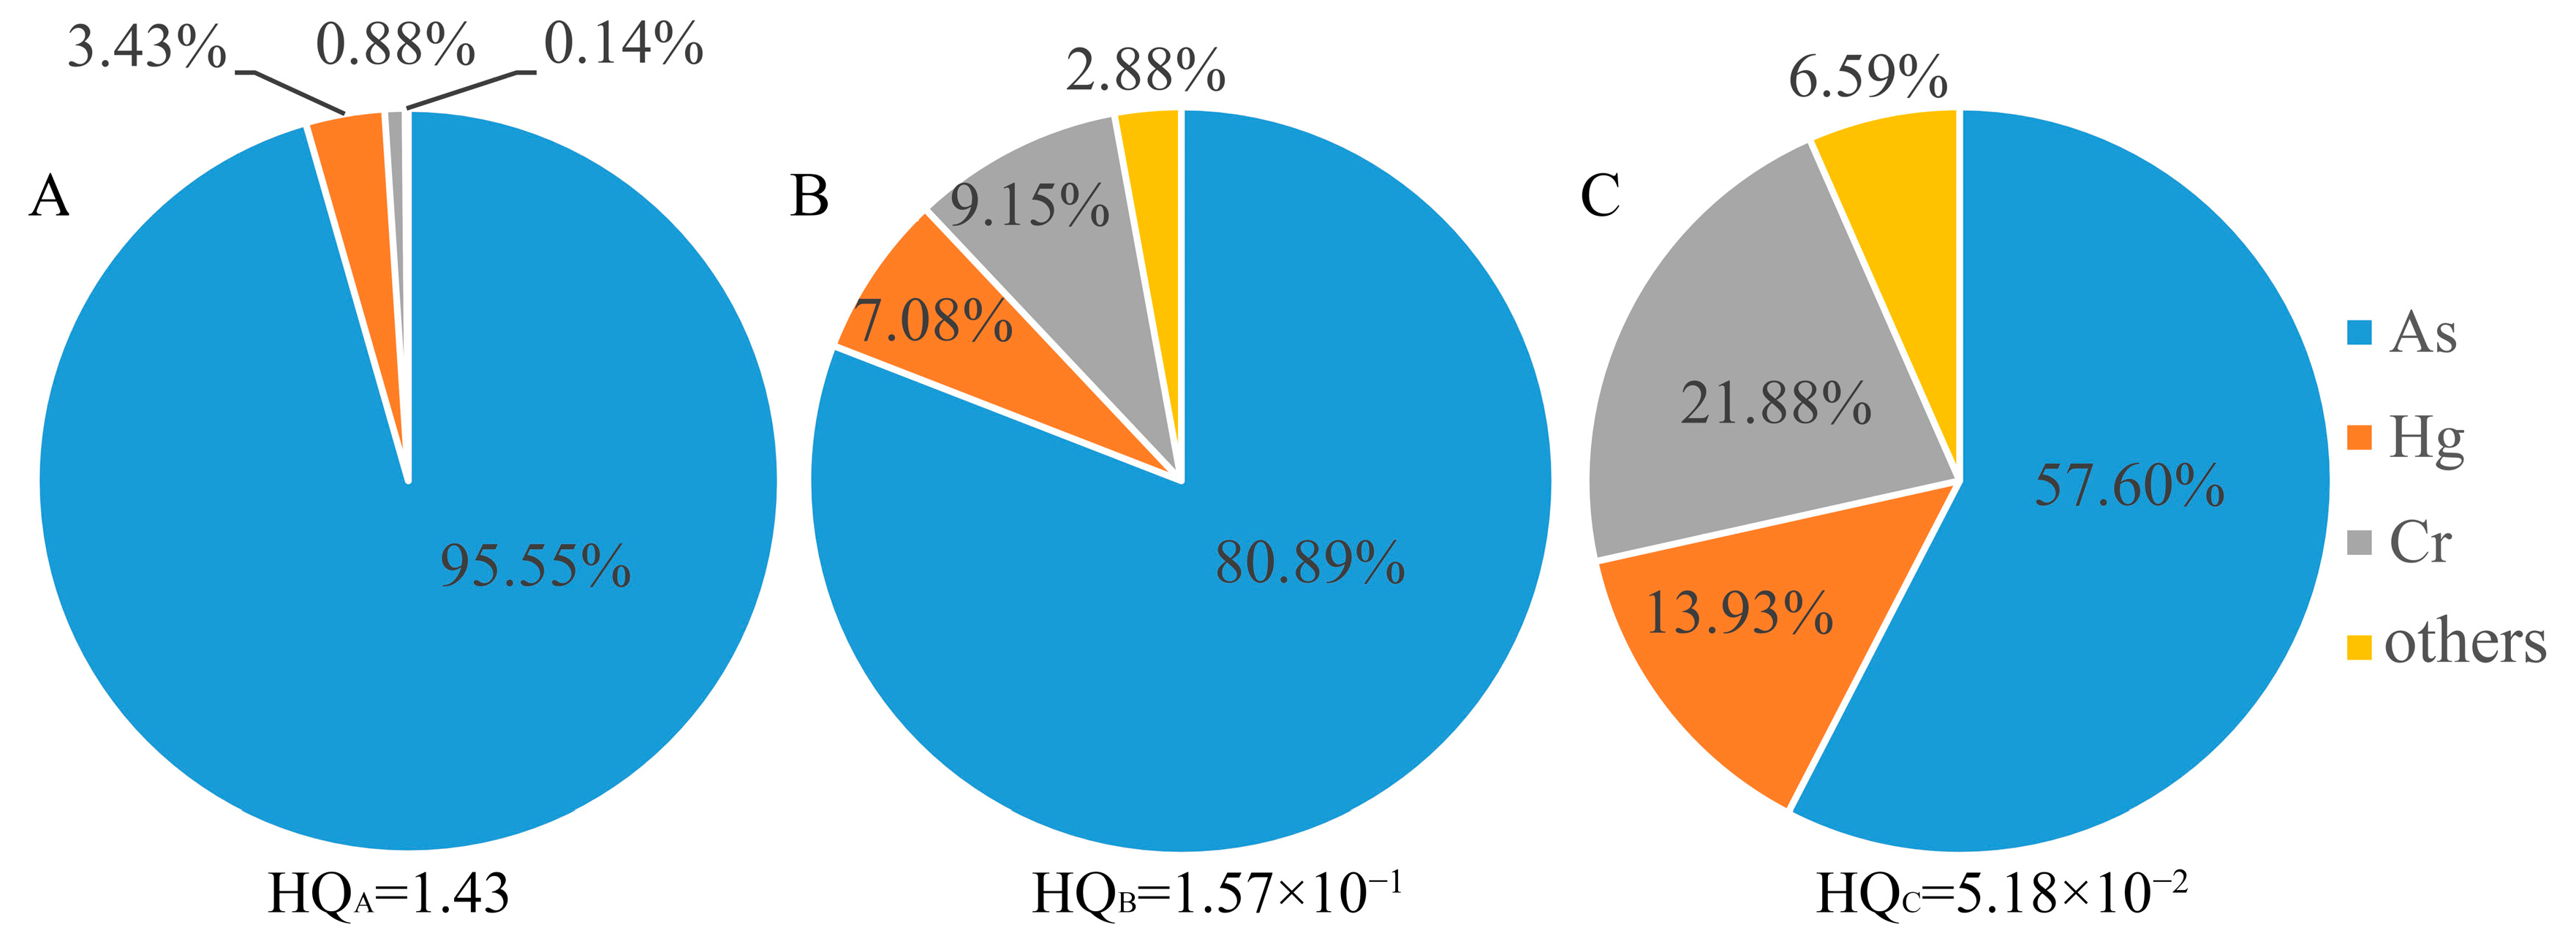
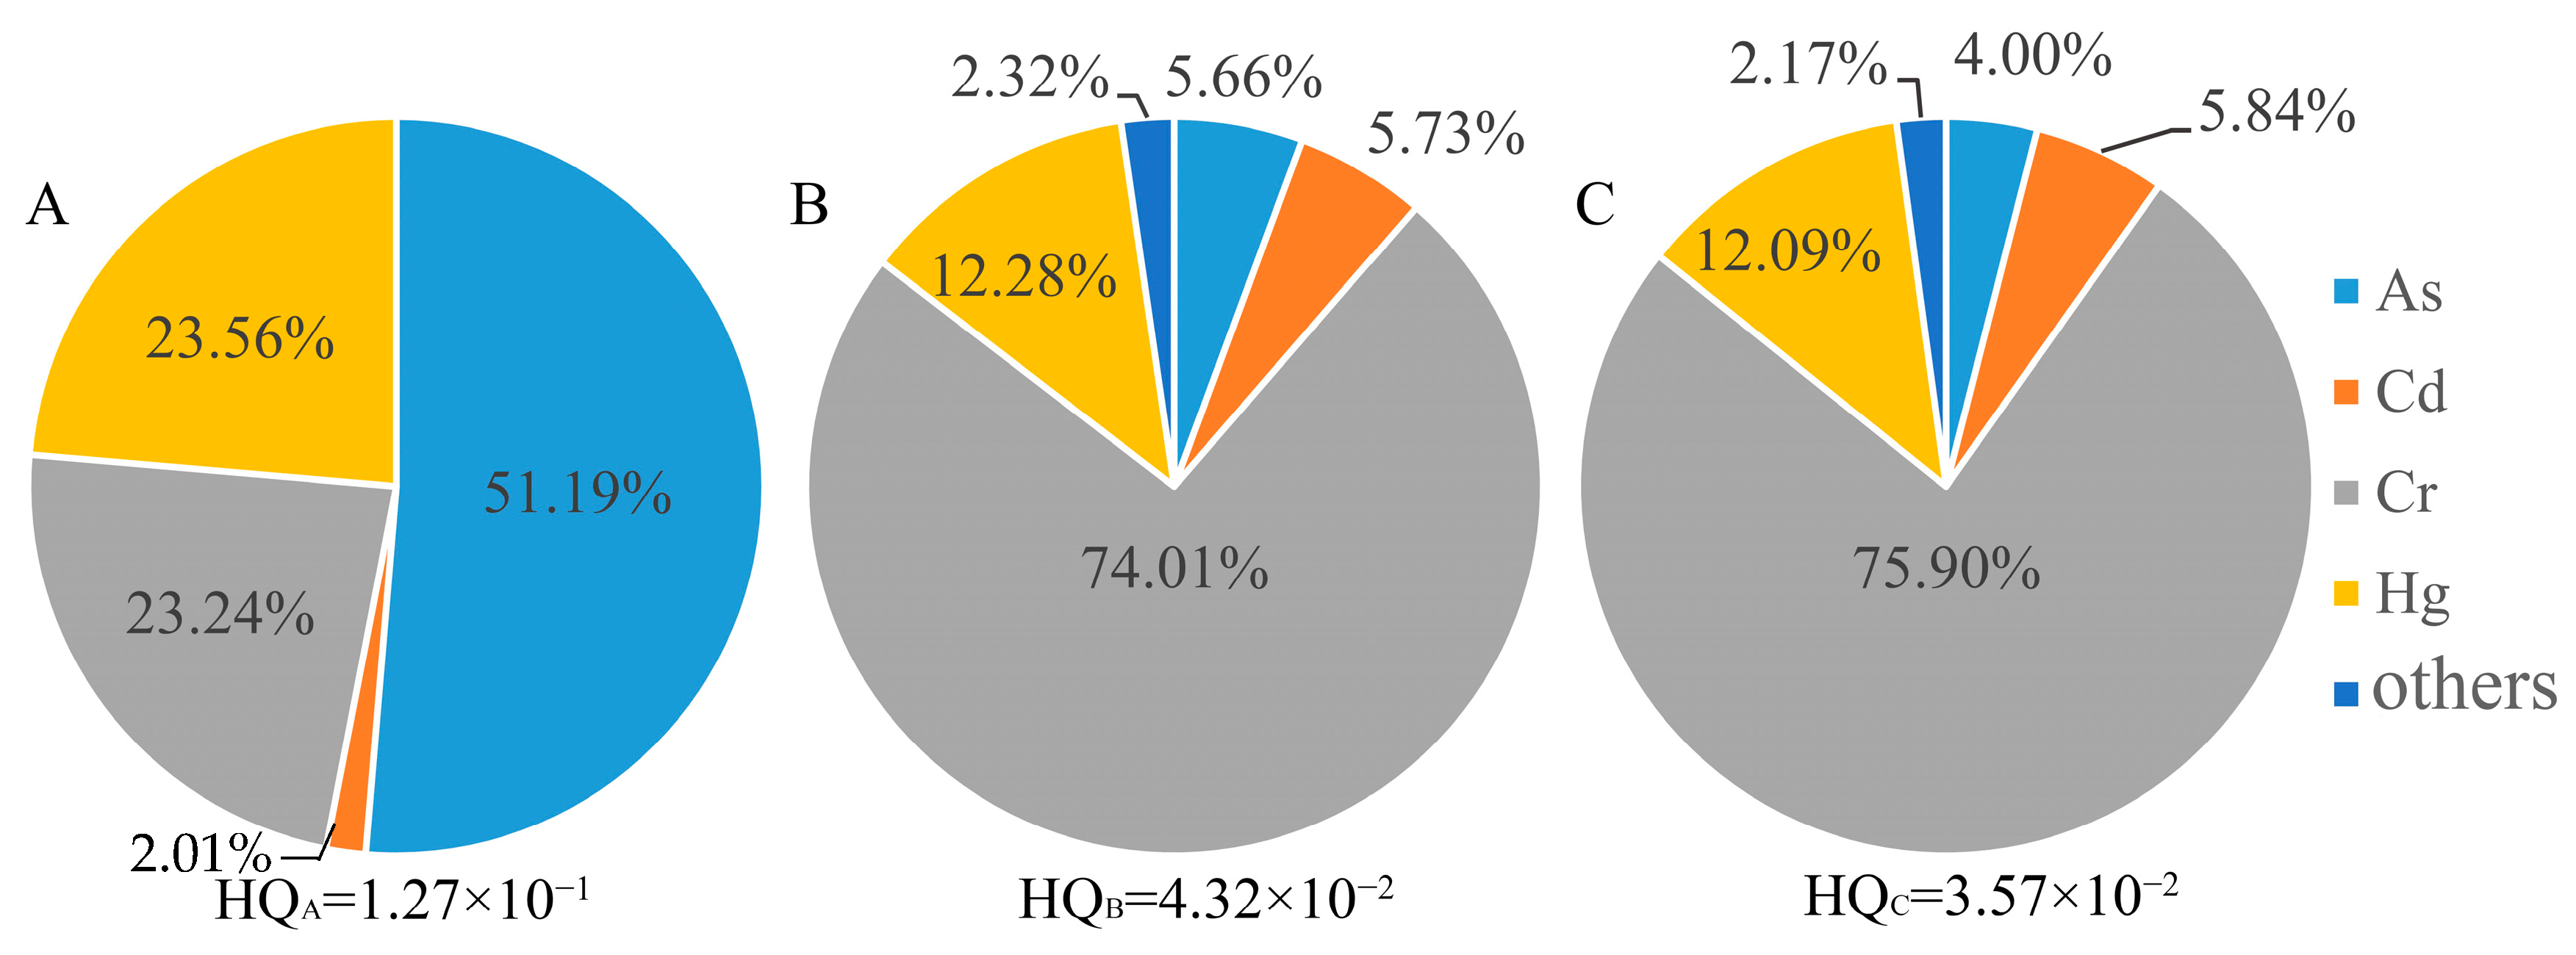
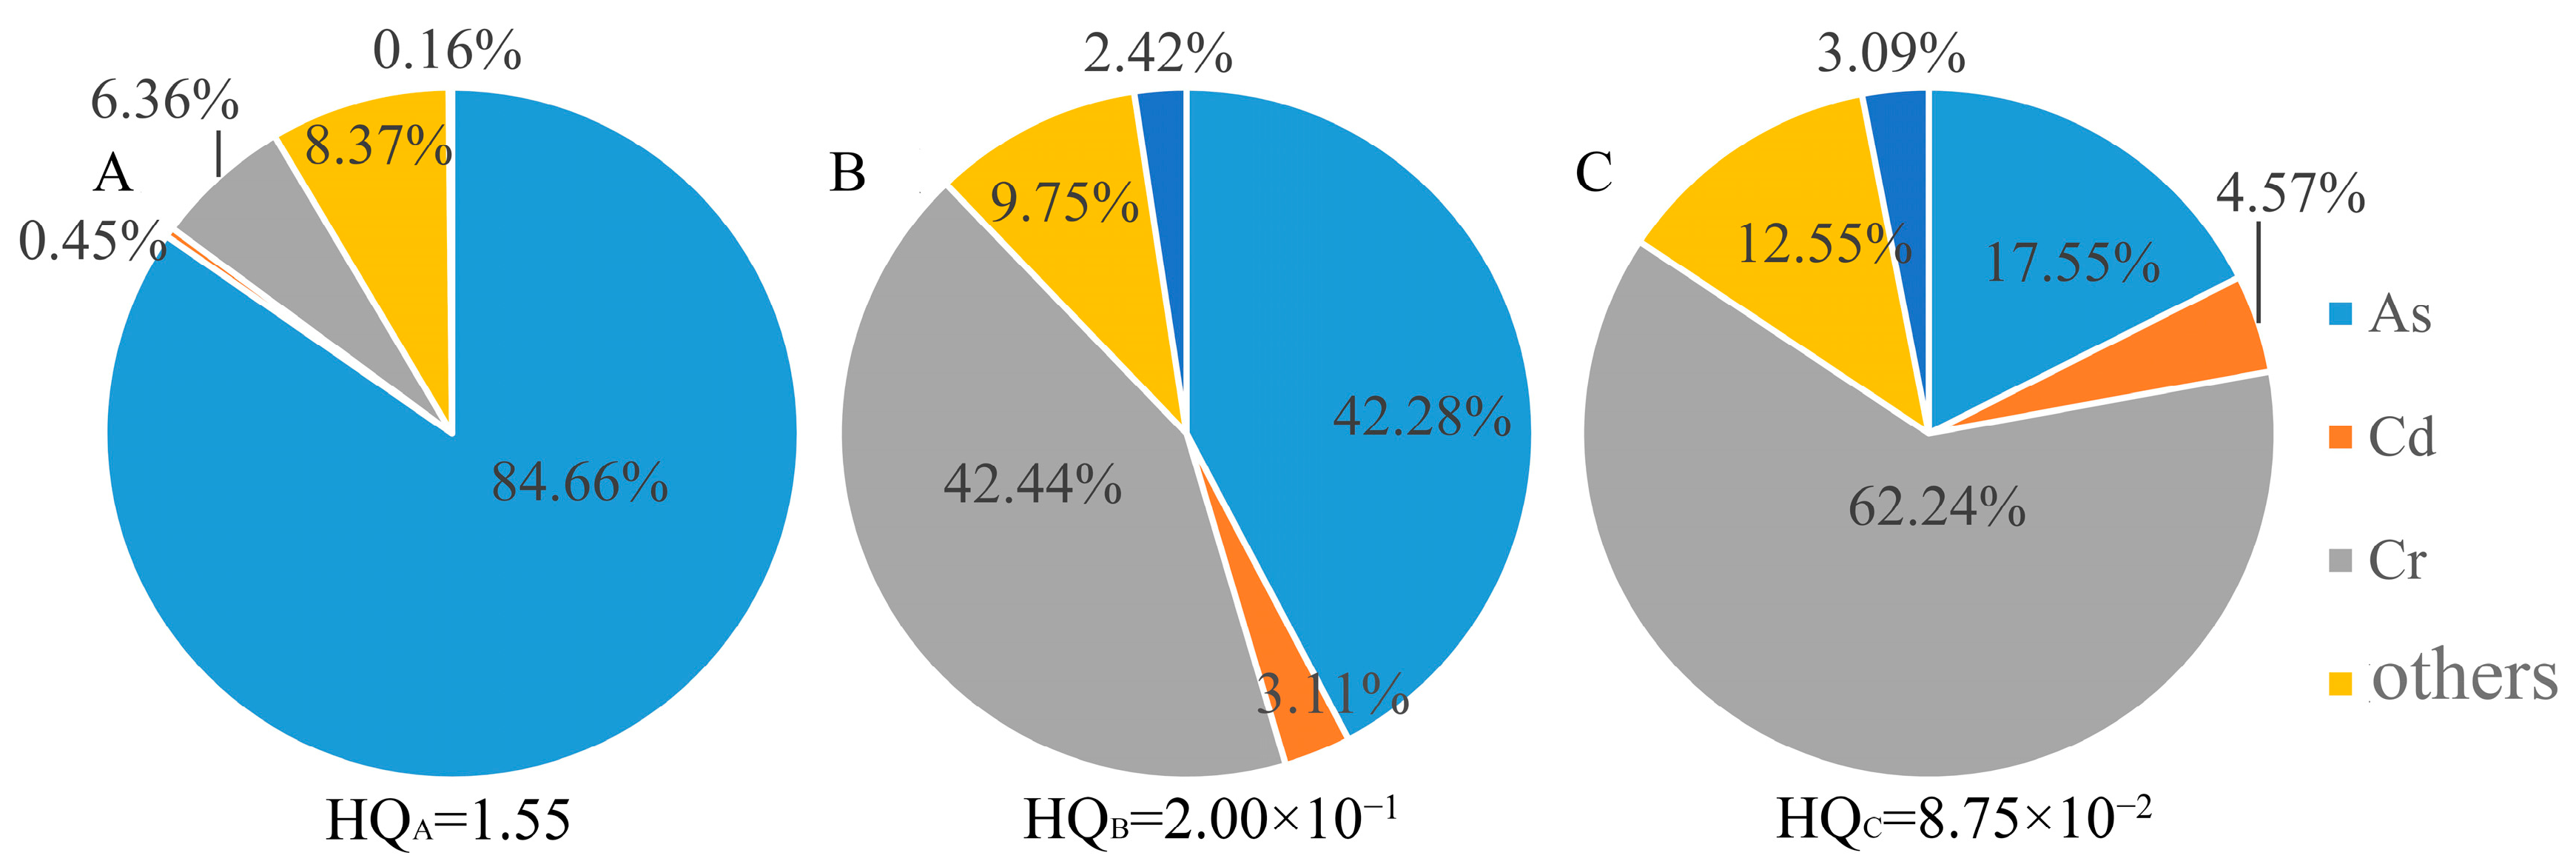
- The noncarcinogenic risk of a single pollutant is calculated as follows:where RfDij (mg·(kg·d)−1) is the reference dose of heavy metal i under exposure pathway j, and the specific parameter values are shown in Table 5. An HQ value greater than 1 indicates that the pollutant has a certain noncarcinogenic risk; when it is less than 1, the noncarcinogenic risk is small or can be ignored.
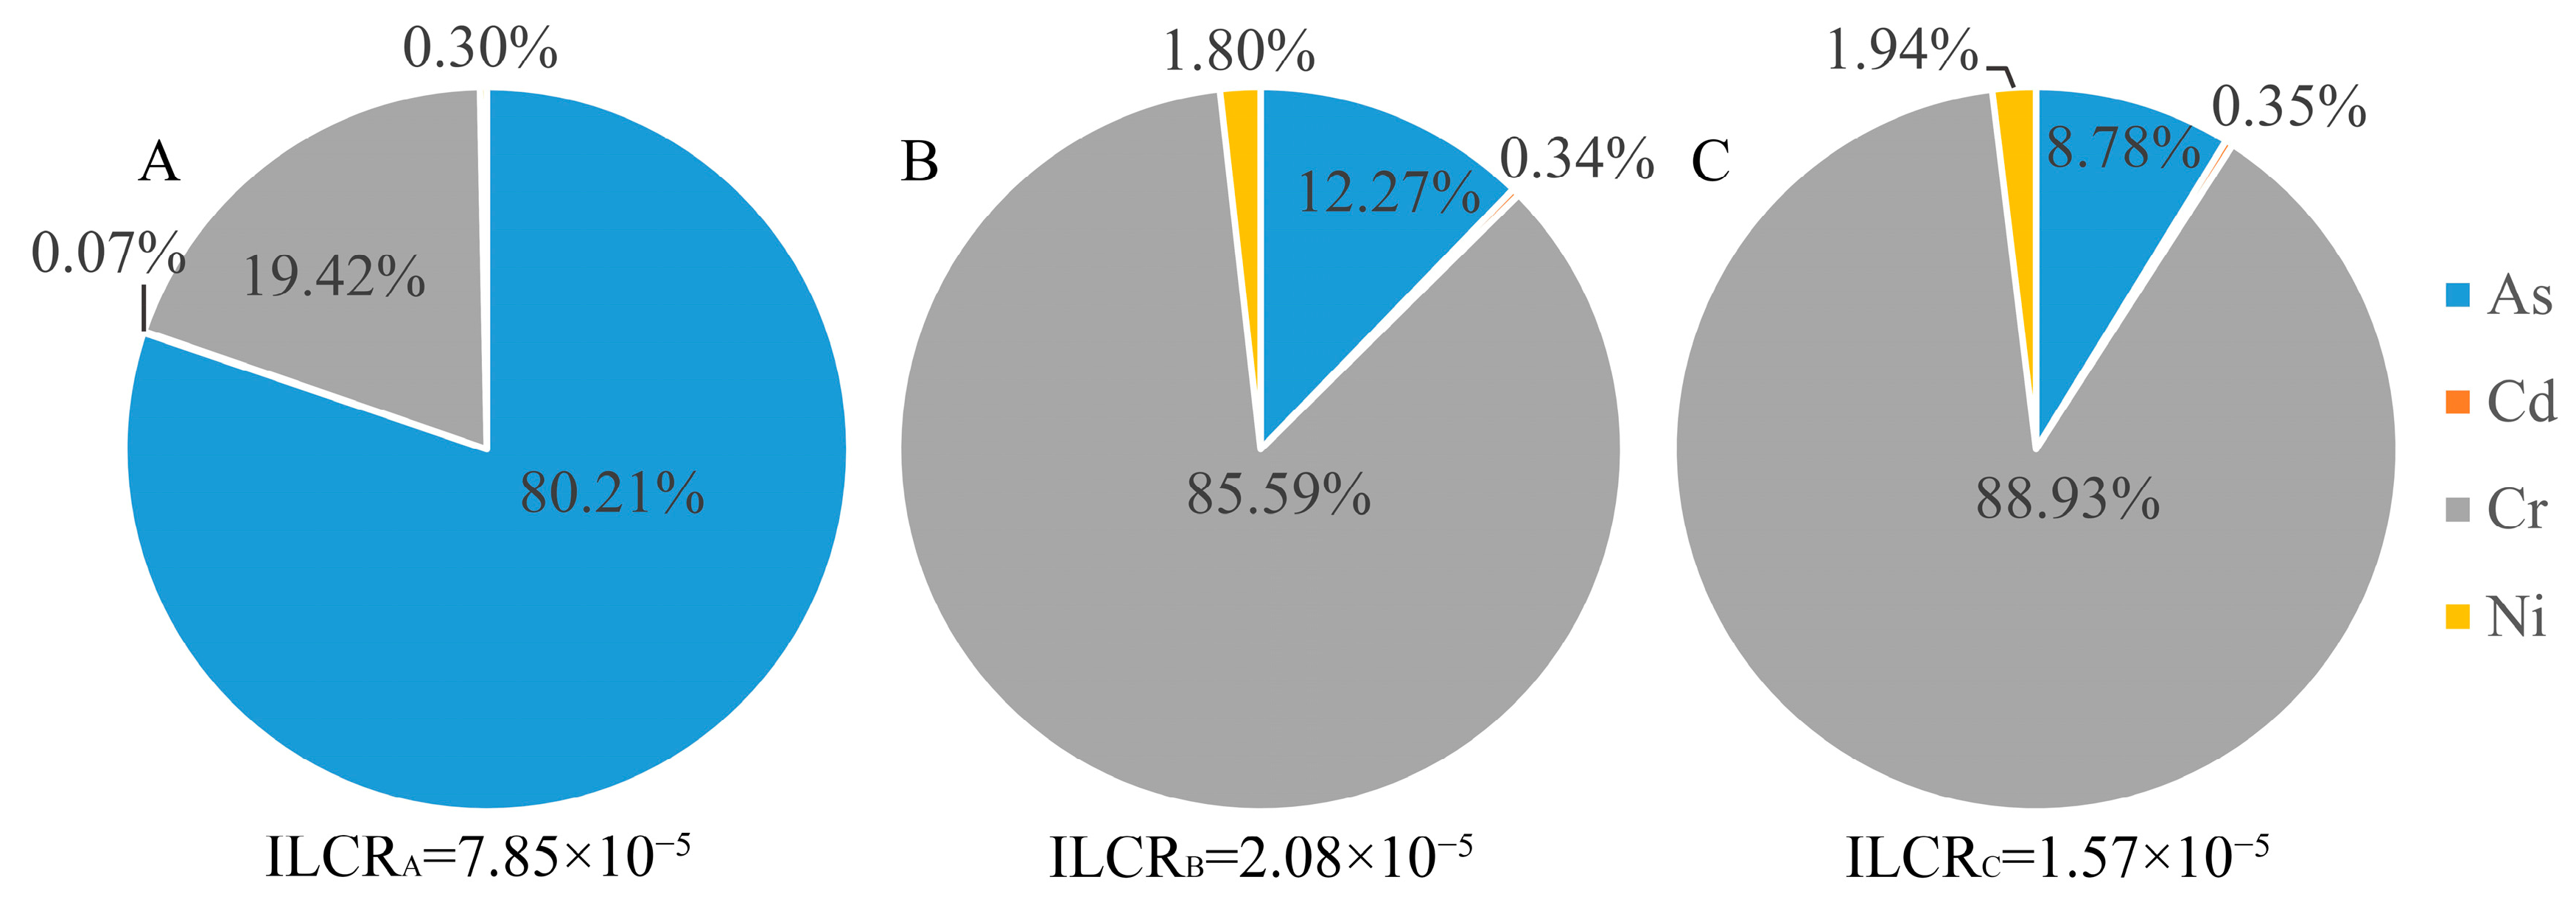
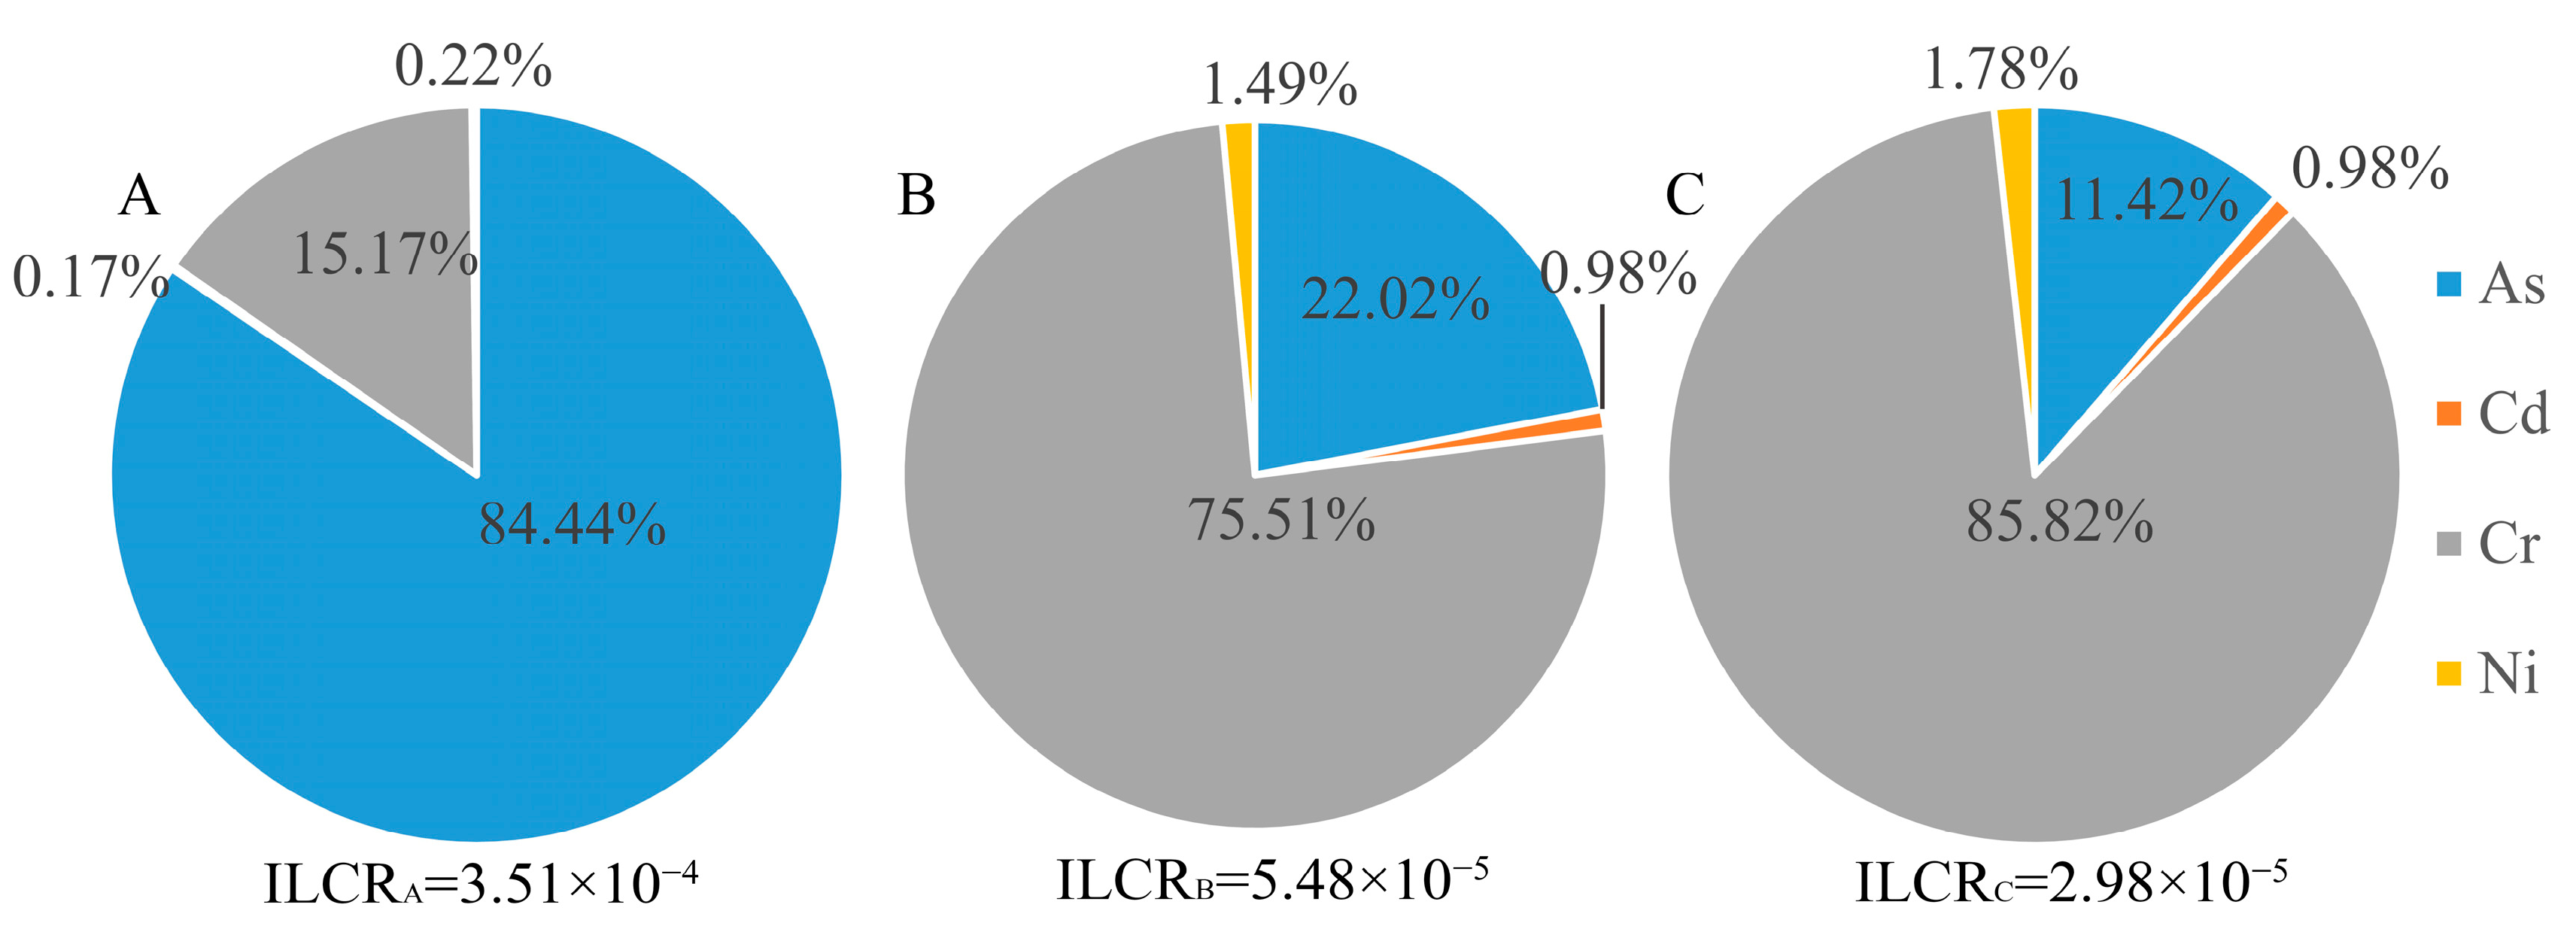
- The carcinogenic risk of a single pollutant is calculated as follows:where SFij (kg·d·mg−1) is the carcinogenic tilt factor of heavy metal element i under exposure pathway j, and the specific parameter values are shown in Table 5.
- Total noncarcinogenic risk:
- Total carcinogenic risk:
2.5. Parameter Selection
2.5.1. Background Value of the Geoaccumulation Index
2.5.2. Toxicity Coefficient of the Potential Ecological Risk Index
2.5.3. Reference Value of the Single-Factor Pollution Index and Potential Ecological Risk Index
3. Results
3.1. Descriptive Statistics of Soil-Heavy Metals
3.2. Evaluation of Heavy Metal Pollution in Soil
3.2.1. Pollution Degree Analysis
- Evaluation by the geoaccumulation pollution index
- 2.
- Evaluation by the single-factor pollution index
3.2.2. Potential Ecological Risk Assessment
3.3. Human Health Risk Assessment of Heavy Metals in Soil
3.3.1. Exposure of Soil-Heavy Metals through Mouth and Skin Contact
3.3.2. Human Health Risk Assessment Results of Soil Heavy Metals
4. Discussion
5. Conclusions
Author Contributions
Funding
Institutional Review Board Statement
Informed Consent Statement
Data Availability Statement
Acknowledgments
Conflicts of Interest
List of Abbreviations
| ABS | Dermal absorption factor |
| ADDi | The daily exposure of heavy metals through i pathway |
| AF | Skin adherence factor |
| AT | Average time |
| ave (Pi) | The average value of a single pollution index of various pollution factors |
| Bi | The background value of the element i |
| BW | Average body weight |
| Ci | The measured value of the heavy metal element i in the soil |
| ED | Exposure duration |
| EF | Exposure frequency |
| Ei | The potential ecological risk index of a single heavy metal element i |
| HQij | The carcinogenic risk of the heavy metal i under the exposure j |
| HQt | The total noncarcinogenic risk |
| Igeo | The geoaccumulation index |
| ILCRij | The carcinogenic risk of the heavy metal i under the exposure j |
| ILCRt | The total carcinogenic risk |
| IRing | Daily soil intake |
| max (Pi) | The maximum value of a single pollution index |
| NCPI, Pcom | Nemerow comprehensive pollution index |
| PERI | The potential ecological risk index |
| RfDij | The reference dose of heavy metal i under exposure pathway j |
| RI | The comprehensive potential ecological risk index of multiple heavy metals |
| SA | Exposed skin surface area |
| SFij | The carcinogenic tilt factor of heavy metal element i under exposure pathway j |
| Si | The reference value of heavy metal i |
| SPI, Pi | The single-factor pollution index |
| Ti | The toxic response factor |
| U. S. EPA | United States Environmental Protection Agency |
References
- Bourliva, A.; Papadopoulou, L.; Aidona, E.; Giouri, K.; Simeonidis, K.; Vourlias, G. Characterization and geochemistry of technogenic magnetic particles (TMPs) in contaminated industrial soils: Assessing health risk via ingestion. Geoderma 2017, 295, 86–97. [Google Scholar] [CrossRef]
- Kim, B.; Angeli, J.; Ferreira, P.; Mahiques, M.D.; Figueira, R. Critical evaluation of different methods to calculate the Geoaccumulation Index for environmental studies: A new approach for Baixada Santista–Southeastern Brazil. Mar. Pollut. Bull. 2018, 127, 548–552. [Google Scholar] [CrossRef] [PubMed]
- Maedeh, C.; Amir, H.H.; Babak, M.Z.; Dalvand, M.; Seyyed, A.A.M. Heavy metals and related properties in farming soils adjacent to a future copper mine, interpretation using GIS, and statistical methods. Arab. J. Geosci. 2021, 14, 816. [Google Scholar] [CrossRef]
- Liu, W.; Yang, J.J.; Wang, J.; Wang, G.; Cao, Y.E. Contamination assessment and sources analysis of soil heavy metals in opencast mine of east Junggar Basin in Xinjiang. Environ. Sci. 2016, 37, 1938–1945. [Google Scholar] [CrossRef]
- Wang, Y.; Liu, Y.X.; Li, D.D.; He, R.; Wang, W.; Liu, Y.X.; Lu, Z.H.; Zhang, M. Characteristics of chromium soil pollution and health risk assessment in saline alkali farmland: A case study of Bincheng district, Binzhou city, Shandong Province, China. J. Agro-Environ. Sci. 2021, 40, 2723–2732. [Google Scholar]
- Fernando, S.F.; Antonio, M.G.; Carmelo, Á.Z.; Antonio, G.S.; Pilar, A.R. Spatial Distribution of Heavy Metals and the Environmental Quality of Soil in the Northern Plateau of Spain by Geostatistical Methods. Int. J. Environ. Res. Public Health 2017, 14, 568. [Google Scholar] [CrossRef]
- Golia, E.E.; Dimirkou, A.; Floras, S.A. Spatial monitoring of arsenic and heavy metals in the Almyros area, Central Greece. A statistical approach for assessing the sources of contamination. Environ Monit Assess. 2015, 187, 399. [Google Scholar] [CrossRef]
- Jabbar, K.; Rani, S.; Pallavi, U.; Rajesh, K.Y. Geo-statistical assessment of soil quality and identification of Heavy metal contamination using Integrated GIS and Multivariate statistical analysis in Industrial region of Western India. Environ. Technol. Innov. 2022, 28, 102646. [Google Scholar] [CrossRef]
- Liu, H.; Anwar, S.; Fang, L.Q.; Chen, L.H.; Xu, W.J.; Xiao, L.L.; Zhong, B.; Liu, D. Source Apportionment of Agricultural Soil Heavy Metals Based on PMF Model and Multivariate Statistical Analysis. Environ. Forensics 2022, 23, 1–9. [Google Scholar] [CrossRef]
- Liu, K.H.; Zhang, H.C.; Liu, Y.F.; Li, Y.; Yu, F.M. Investigation of plant species and their heavy metal accumulation in manganese mine tailings in Pingle Mn mine, China. Environ. Sci. Pollut. Res 2020, 20, 19933–19945. [Google Scholar] [CrossRef]
- Han, L.; Chen, R.; Liu, Z.; Chang, S.S.; Zhao, Y.H.; Li, L.S.; Li, R.S.; Xia, L.F. Sources of and control measures for PTE pollution in soil at the urban fringe in Weinan, China. Land 2021, 10, 762. [Google Scholar] [CrossRef]
- Liu, X.Y.; Bai, Z.K.; Shi, H.D.; Zhou, W.; Liu, X.C. Heavy metal pollution of soils from coal mines in China. Nat. Hazards 2019, 99, 1163–1177. [Google Scholar] [CrossRef]
- Arab, L.H.; Boutaleb, A.; Berdous, D. Environmental assessment of heavy metal pollution in the polymetallic district of Kef Oum Teboul (El Kala, Northeast Algeria). Environ. Earth Sci. 2021, 80, 227. [Google Scholar] [CrossRef]
- Yang, P.G.; Drohan, P.J.; Yang, M.; Li, H.J. Spatial variability of heavy metal ecological risk in urban soils from Linfen, China. Catena 2020, 190, 104554. [Google Scholar] [CrossRef]
- U.S. Environmental Protection Agency (EPA). Risk Assessment Guidance for Superfund, Human Health Evaluation Manual Part A; Office of Emergency and Remedial Response: Washington, DC, USA, 1989. Available online: https://www.epa.gov/risk/risk-assessment-guidance-superfund-volume-i-human-health-evaluation-manual-supplemental (accessed on 13 October 1989).
- Mohammadi, A.A.; Zarei, A.; Esmaeilzadeh, M.; Taghavi, M.; Yousefi, M.; Yousefi, Z.; Sedighi, F.; Javan, S. Assessment of heavy metal pollution and human health risks assessment in soils around an industrial zone in Neyshabur, Iran. Biol. Trace Elem. Res. 2020, 195, 343–352. [Google Scholar] [CrossRef]
- Yang, Q.Q.; Li, Z.Y.; Lu, X.N.; Duan, Q.N.; Huang, L.; Bi, J. A review of soil heavy metal pollution from industrial and agricultural regions in China: Pollution and risk assessment. Sci. Total Environ. 2018, 642, 690–700. [Google Scholar] [CrossRef]
- Xiao, R.; Wang, S.; Li, R.H.; Wang, J.J.; Zhang, Z.Q. Soil heavy metal contamination and health risks associated with artisanal gold mining in Tongguan, Shaanxi, China. Ecotoxicol. Environ. Saf. 2017, 141, 17–24. [Google Scholar] [CrossRef]
- Gao, X.; Tian, J.P.; Huo, Z.; Wu, Y.B.; Li, C.X. Evaluation of redevelopment priority of abandoned industrial and mining land based on heavy metal pollution. PLoS ONE 2021, 16, e0255509. [Google Scholar] [CrossRef]
- Chrastný, V.; Vaněk, A.; Teper, L.; Jerzy, C.; Jan, P.; Libor, P.; Petr, D.; Vít, P.; Michael, K.; Martin, N. Geochemical position of Pb, Zn and Cd in soils near the Olkusz mine/smelter, South Poland: Effects of land use, type of contamination and distance from pollution source. Environ. Monit. Assess 2012, 184, 2517–2536. [Google Scholar] [CrossRef]
- Katarzyna, S.; Leslaw, T.; Tomasz, C.; Tomasz, H.; Michał, O.; Jan, Z. Quality of peri-urban soil developed from ore-bearing carbonates: Heavy metal levels and source apportionment assessed using pollution indices. Minerals 2020, 10, 1140. [Google Scholar] [CrossRef]
- GB 36600-2018; Soil Environmental Quality–Risk Control Standard for Soil Contamination of a Development Land. Ministry of Ecology and Environment of the People’s Republic of China: Beijing, China, 2018. Available online: http://www.mee.gov.cn/ywgz/fgbz/bz/bzwb/trhj/201807/t20180703_446027.shtml (accessed on 22 June 2018).
- GB 15618-2018; Soil Environmental Quality–Risk Control Standard for Soil Contamination of Agricultural Land. Ministry of Ecology and Environment of the People’s Republic of China: Beijing, China, 2018. Available online: http://www.mee.gov.cn/ywgz/fgbz/bz/bzwb/trhj/201807/t20180703_446029.shtml (accessed on 6 June 2018).
- HJ 766-2015; Solid Waste–Determination of Metals–Inductively Coupled Plasma Mass Spectrometry (ICP-MS). Ministry of Ecology and Environment of the People’s Republic of China: Beijing, China, 2015. Available online: https://www.mee.gov.cn/ywgz/fgbz/bz/bzwb/jcffbz/201511/t20151130_317999.shtml (accessed on 20 November 2015).
- HJ 680-2013; Soil and Sediment—Determination of Mercury, Arsenic, Selenium, Bismuth, Antimony—Microwave Dissolution/Atomic Fluorescence Spectrometry. Ministry of Ecology and Environment of the People’s Republic of China: Beijing, China, 2013. Available online: https://www.mee.gov.cn/ywgz/fgbz/bz/bzwb/jcffbz/201312/t20131203_264304.shtml (accessed on 21 November 2013).
- HJ1082-2019; Soil and Sediment—Determination of Cr(VI)—Alkaline Digestion/ Flame Atomic Absorption Spectrometry. Ministry of Ecology and Environment of the People’s Republic of China: Beijing, China, 2019. Available online: https://www.mee.gov.cn/ywgz/fgbz/bz/bzwb/jcffbz/202001/t20200102_756539.shtml (accessed on 31 December 2019).
- HJ 962-2018; Soil—Determination of pH—Potentiometry. Ministry of Ecology and Environment of the People’s Republic of China: Beijing, China, 2018. Available online: https://www.mee.gov.cn/ywgz/fgbz/bz/bzwb/jcffbz/201808/t20180815_451430.shtml (accessed on 29 July 2018).
- Olumuyiwa, O.O.; Simiso, D.; Omotayo, R.A.; Nindi, M.M. Assessing the enrichment of heavy metals in surface soil and plant (Digitaria eriantha) around coal-fired power plants in South Africa. Environ. Sci. Pollut. Res. 2014, 21, 4686–4696. [Google Scholar] [CrossRef]
- Jiang, P.H.; Huang, F.L.; Wan, Y.; Peng, K.J.; Chen, C. Heavy metal contamination and risk assessment of water, sediment, and farmland soil around a pb/zn mine area in human province, china. Fresenius Environ. Bull 2020, 29, 2250–2259. [Google Scholar]
- Nemerow, N. Scientific Stream Pollution Analysis; McGraw Hill: New York, NY, USA, 1974. [Google Scholar]
- Hakanson, L. An ecological risk index for aquatic pollution control: A sedimentological approach. Water Res. 1980, 14, 975–1001. [Google Scholar] [CrossRef]
- Chen, Z.; Xu, J.; Duan, R.; Lu, S.; Hou, Z.; Yang, F.; Peng, M.; Zong, Q.; Shi, Z.; Yu, L. Ecological health risk assessment and source identification of heavy metals in surface soil based on a high geochemical background: A Case Study in Southwest China. Toxics 2022, 10, 282. [Google Scholar] [CrossRef]
- U.S. Environmental Protection Agency (EPA). Exposure Factors Handbook: 2011 Edition; National Center for Environmental Assessment: Washington, DC, USA, 2011. Available online: http://www.epa.gov/ncea/efh (accessed on 3 October 2011).
- Ministry of Ecology and Environment of the People’s Republic of China. Exposure Factors Handbook of Chinese Population; China Environmental Press: Beijing, China, 2013; pp. 156–164. [Google Scholar]
- HJ 25.3—2019; Technical Guidelines for Risk Assessment of Soil Contamination of Land for Construction. Ministry of Ecology and Environment of the People’s Republic of China: Beijing, China, 2019. Available online: https://www.mee.gov.cn/ywgz/fgbz/bz/bzwb/trhj/201912/t20191224_749893.shtml (accessed on 2 December 2019).
- Li, Z.Y.; Ma, Z.W.; Van Der Kuijp, T.J.; Yuan, Z.W.; Huang, L. A review of soil heavy metal pollution from mines in China: Pollution and health risk assessment. Sci. Total Environ. 2014, 468, 843–853. [Google Scholar] [CrossRef]
- State Environmental Protection Administration of China. China Background Value of Soil Element; China Environmental Press: Beijing, China, 1990. [Google Scholar]
- Wang, R.; Chen, N.; Zhang, E.X. Ecological and health assessment based in the total amount and speciation of heavy metals in soils around mining areas. Environ. Sci. 2021, 40, 1–15. (In Chinese) [Google Scholar] [CrossRef]
- Pan, L.B.; Ma, J.; Hu, Y.; Su, B.Y.; Fang, G.L.; Wang, Y.; Wang, Z.S.; Wang, L.; Xiang, B. Assessments of levels, potential ecological risk, and human health risk of heavy metals in the soils from a typical county in Shanxi Province, China. Environ. Sci. Pollut. Res. 2016, 23, 19330–19340. [Google Scholar] [CrossRef]
- Nasirzadeh, N.; Mohammadian, Y.; Dehgan, G. Health risk assessment of occupational exposure to hexavalent chromium in Iranian workplaces: A meta-analysis study. Biol. Trace Elem. Res. 2021, 200, 1551–1560. [Google Scholar] [CrossRef]
- Zhu, D.W.; Wei, Y.; Zhao, Y.H.; Wang, Q.L.; Han, J.C. Heavy metal pollution and ecological risk assessment of the agriculture soil in xunyang mining Area, Shaanxi Province, northwestern China. Bull. Environ. Contam. Toxicol 2018, 101, 178–184. [Google Scholar] [CrossRef]
- Elouear, Z.; Bouhamed, F.; Boujelben, N.; Bouzid, J. Assessment of toxic metals dispersed from improperly disposed tailing, Jebel Ressas mine, NE Tunisia. Environ. Earth Sci. 2016, 75, 254. [Google Scholar] [CrossRef]
- Huang, S.H.; Yuan, C.Y.; Li, Q.; Yang, Y.; Tang, C.J.; Ouyang, K.; Wang, B. Distribution and risk assessment of heavy metals in soils from a typical Pb-Zn mining area. Pol. J. Environ. Stud. 2017, 26, 1105–1112. [Google Scholar] [CrossRef]
- Sutkowska, K.; Czech, T.; Teper, L.; Krzykawski, T. Heavy metals soil contamination induced by historical zinc smelting in Jaworzno. Ecol. Chem. Eng. A 2013, 20, 1441–1450. [Google Scholar] [CrossRef]
- Joshua, P.; John, A.; Anke, B.; Justus, P.D.; Stefan, Z. Soil heavy metal(loid) pollution and phytoremediation potential of native plants on a former gold mine in Ghana. Water Air Soil. Pollut. 2019, 230, 267. [Google Scholar] [CrossRef] [Green Version]
- Qin, G.W.; Niu, Z.D.; Yu, J.D.; Li, Z.H.; Ma, J.Y.; Xiang, P. Soil heavy metal pollution and food safety in China: Effects, sources and removing technology. Chemosphere 2021, 267, 129205. [Google Scholar] [CrossRef]
- Mahar, A.; Wang, P.; Ali, A.; Awasthi, M.K.; Lahoro, A.H.; Wang, Q.; Li, R.H.; Zhang, Z.Q. Challenges and opportunities in the phytoremediation of heavy metals contaminated soils: A review. Ecotoxicol. Environ. Saf. 2016, 126, 111–121. [Google Scholar] [CrossRef]
- Sheoran, V.; Sheoran, A.S.; Poonia, P. Phytomining: A review. Min. Eng. 2009, 22, 1007–1019. [Google Scholar] [CrossRef]
- Tang, J.Y.; Zhang, L.H.; Zhang, J.C.; Ren, L.H.; Zhou, Y.Y.; Zheng, Y.Y.; Luo, L.; Yang, Y.; Huang, H.L.; Chen, A.W. Physicochemical features, metal availability and enzyme activity in heavy metal-polluted soil remediated by biochar and compost. Sci. Total Environ. 2020, 701, 134751. [Google Scholar] [CrossRef]


| Classification | Igeo | Pollution Degree |
|---|---|---|
| 0 | Igeo < 0 | Unpolluted |
| 1 | 0 ≤ Igeo < 1 | Lightly polluted |
| 2 | 1 ≤ Igeo < 2 | Moderately polluted |
| 3 | 2 ≤ Igeo < 3 | Moderately to heavily polluted |
| 4 | 3 ≤ Igeo < 4 | Heavily polluted |
| 5 | 4 ≤ Igeo < 5 | Heavily to extremely polluted |
| 6 | Igeo ≥ 5 | Extremely polluted |
| Classification | Pi | Pollution Degree | Pcom | Pollution Assessment |
|---|---|---|---|---|
| I | Pi ≤ 1 | Clean | Pcom ≤ 0.7 | Clean (security) |
| II | 1 < Pi<2 | Slight pollution | 0.7 < Pcom ≤ 1 | Still clean (cordon) |
| III | 2 < Pi < 3 | Moderate pollution | 1 < Pcom ≤ 2 | Light pollution |
| IV | Pi ≥ 3 | Severe pollution | 2 < Pcom ≤ 3 | Moderate pollution |
| V | - | - | Pcom > 3 | Severe pollution |
| Ecological Risk | Low | Moderate | Considerate | High | Very high |
|---|---|---|---|---|---|
| Ei | <40 | 40–80 | 80–160 | 160–320 | >320 |
| RI | <150 | 150–300 | 300–600 | - | >600 |
| Symbol | Parameter Meaning | Value | Unit | References |
|---|---|---|---|---|
| IRing | Daily soil intake | 20 | mg·d−1 | [34] |
| SA | Exposed skin surface area | 4350 | cm−2 | [35] |
| AF | Skin adherence factor | 0.22 | mg·cm−2·d−1 | [34] |
| ABS | Dermal absorption factor | 0.001 | - | [35] |
| EF | Exposure frequency | 350 | d·a−1 | [34] |
| ED | Exposure duration | 30 | a | [34] |
| BW | Average body weight | 59.0 | kg | [34] |
| AT (carcinogenic) | Average time | 70 × 365 | d | [34] |
| AT (noncarcinogenic) | Average time | 30 × 365 | d | [34] |
| Item | Element | RfDij through Oral Intake | RfDij through Skin Contact | SFij through Oral Intake | SFij through Skin Contact |
|---|---|---|---|---|---|
| Carcinogenic heavy metals | As | 3 × 10⁻⁴ | 3 × 10⁻⁴ | 1.5 | 7.5 |
| Cd | 1 × 10⁻³ | 1 × 10⁻⁵ | 6.1 | 6.1 | |
| Cr | 3 × 10⁻³ | 6 × 10⁻⁵ | 0.5 | 20 | |
| Ni | 2 × 10⁻² | 5.4 × 10⁻³ | - | 0.84 | |
| Noncarcinogenic heavy metals | Cu | 4.2 × 10⁻² | 1.2 × 10⁻² | - | - |
| Hg | 3 × 10⁻⁴ | 2.4 × 10⁻⁵ | - | - | |
| Pb | 3.5 × 10⁻³ | 5.25 × 10⁻⁴ | - | - | |
| Zn | 3 × 10⁻¹ | 6 × 10⁻² | - | - |
| Farmlands | Development Lands | |||||
|---|---|---|---|---|---|---|
| Pollutant | Filter Values (mg·kg−1) | Control Values (mg·kg−1) | Filter Values (mg·kg−1) | Control Values (mg·kg−1) | ||
| Category 1 Lands | Category 2 Lands | Category 1 Lands | Category 2 Lands | |||
| As | 25 | 100 | 20 | 60 | 120 | 140 |
| Cd | 0.6 | 4 | 20 | 65 | 47 | 172 |
| Cr | 250 | 1300 | 3.0 | 5.7 | 30 | 78 |
| Cu | 100 | - | 2000 | 18,000 | 8000 | 36,000 |
| Hg | 3.4 | 6 | 8 | 38 | 33 | 82 |
| Ni | 190 | - | 150 | 900 | 600 | 2000 |
| Pb | 170 | 1000 | 400 | 800 | 800 | 2500 |
| Zn | 300 | - | - | - | - | - |
| Area | Parameter | As | Cd | Cr | Cr(VI) | Cu | Hg | Ni | Pb | Zn | pH |
|---|---|---|---|---|---|---|---|---|---|---|---|
| A | Max (mg·kg−1) | 1904.79 | 2.09 | 128.67 | 3.96 | 69.75 | 93.82 | 68.37 | 19.77 | 74.79 | 8.9 |
| Min (mg·kg−1) | 678.11 | 1.17 | 94.23 | 0.73 | 27.54 | 6.13 | 43.32 | 3.71 | 32.62 | 8.0 | |
| Mean (mg·kg−1) | 1257.39 | 1.43 | 115.21 | 2.33 | 39.96 | 45.14 | 52.15 | 20.92 | 44.37 | 8.5 | |
| Standard deviation | 234.56 | 0.13 | 7.44 | 0.21 | 9.67 | 22.87 | 4 | 53 | 9.09 | 0.43 | |
| Coefficient of variation | 1.19 | 0.09 | 0.01 | 0.02 | 0.24 | 0.51 | 0.11 | 0.14 | 0.21 | 0.16 | |
| B | Max (mg·kg−1) | 1229.13 | 2.13 | 136.52 | 2.33 | 46.35 | 38.88 | 76.37 | 35.83 | 95.80 | 8.6 |
| Min (mg·kg−1) | 12.79 | 1.15 | 86.82 | 0.57 | 24.07 | 2.77 | 44.49 | 6.38 | 51.78 | 7.7 | |
| Mean (mg·kg−1) | 81.42 | 1.39 | 107.64 | 0.86 | 33.47 | 9.23 | 54.08 | 20.95 | 74.91 | 8.2 | |
| Standard deviation | 273.59 | 0.15 | 11.09 | 0.18 | 5.02 | 8.69 | 5.94 | 5.41 | 8.87 | 0.49 | |
| Coefficient of variation | 2.25 | 0.11 | 0.10 | 0.01 | 0.15 | 0.94 | 0.11 | 0.26 | 0.12 | 0.23 | |
| C | Max (mg·kg−1) | 64.76 | 1.45 | 123.72 | - | 40.14 | 15.56 | 64.50 | 24.70 | 85.49 | 8.7 |
| Min (mg·kg−1) | 15.66 | 1.19 | 86.83 | - | 25.13 | 3.25 | 46.19 | 15.59 | 62.19 | 7.5 | |
| Mean (mg·kg−1) | 27.52 | 1.34 | 104.51 | - | 33.21 | 6.66 | 54.32 | 18.87 | 76.46 | 8.4 | |
| Standard deviation | 19.55 | 0.08 | 9.48 | - | 4.06 | 2.99 | 4.12 | 1.72 | 5.93 | 0.47 | |
| Coefficient of variation | 0.31 | 0.06 | 0.09 | - | 0.12 | 0.45 | 0.08 | 0.09 | 0.08 | 0.08 | |
| Kolmogorov–Smirnov test | 0.12 | 0.35 | 0.32 | 0.12 | 0.40 | 0.22 | 0.26 | 0.31 | 0.19 | 0.21 | |
| Item | As | Cd | Cr | Cu | Hg | Ni | Pb | Zn |
|---|---|---|---|---|---|---|---|---|
| A | 6.24 | 3.34 | 0.30 | 0.32 | 9.97 | 0.27 | −0.42 | −1.23 |
| Pollution degree | Extremely | Heavily | Lightly | Lightly | Extremely | Lightly | Unpolluted | Unpolluted |
| B | 2.29 | 3.30 | 0.21 | 0.06 | 7.68 | 0.32 | −0.62 | −0.47 |
| Pollution degree | Moderately to heavily | Heavy | Lightly | Lightly | Extremely | Lightly | Unpolluted | Unpolluted |
| C | 0.72 | 3.25 | 0.16 | 0.05 | 7.21 | 0.33 | −0.77 | −0.45 |
| Pollution degree | Lightly | Heavily | Lightly | Lightly | Extremely | Lightly | Unpolluted | Unpolluted |
| SPI | NCPI | ||||||||
|---|---|---|---|---|---|---|---|---|---|
| As | Cd | Cr/Cr (VI) | Cu | Hg | Ni | Pb | Zn | ||
| A | 20.96 | 0.02 | 0.41 | 0.00 | 1.19 | 0.06 | 0.03 | - | 15.74 Severe |
| Pollution degree | Severe | Clean | Clean | Clean | Slight | Clean | Clean | Clean | |
| B | 4.07 | 0.07 | 0.29 | 0.02 | 1.15 | 0.36 | 0.05 | - | 2.98 Light |
| Pollution degree | Severe | Clean | Clean | Clean | Slight | Clean | Clean | Clean | |
| C | 1.10 | 2.23 | 0.42 | 0.33 | 1.96 | 0.29 | 0.11 | 0.25 | 1.79 Light |
| Pollution degree | Slight | Moderate | Clean | Clean | Slight | Clean | Clean | Clean | |
| Ei | RI | ||||||||
|---|---|---|---|---|---|---|---|---|---|
| As | Cd | Cr | Cu | Hg | Ni | Pb | Zn | ||
| A | 1132.78 | 456.38 | 3.70 | 9.34 | 60,186.67 | 1.81 | 5.59 | 0.64 | 61,796.91 |
| Risk degree | Very high | Very high | Low | Low | Very high | Low | Low | Low | Very high ecological risk |
| B | 73.35 | 443.62 | 3.46 | 7.82 | 12,306.67 | 1.88 | 4.89 | 1.08 | 12,842.77 |
| Risk degree | Moderate | Very high | Low | Low | Very high | Low | Low | Low | Very high ecological risk |
| C | 24.79 | 427.66 | 3.36 | 7.76 | 8880.00 | 1.89 | 4.41 | 1.10 | 9350.97 |
| Risk degree | Low | Very high | Low | Low | Very high | Low | Low | Low | Very high ecological risk |
Publisher’s Note: MDPI stays neutral with regard to jurisdictional claims in published maps and institutional affiliations. |
© 2022 by the authors. Licensee MDPI, Basel, Switzerland. This article is an open access article distributed under the terms and conditions of the Creative Commons Attribution (CC BY) license (https://creativecommons.org/licenses/by/4.0/).
Share and Cite
Chen, R.; Han, L.; Liu, Z.; Zhao, Y.; Li, R.; Xia, L.; Fan, Y. Assessment of Soil-Heavy Metal Pollution and the Health Risks in a Mining Area from Southern Shaanxi Province, China. Toxics 2022, 10, 385. https://doi.org/10.3390/toxics10070385
Chen R, Han L, Liu Z, Zhao Y, Li R, Xia L, Fan Y. Assessment of Soil-Heavy Metal Pollution and the Health Risks in a Mining Area from Southern Shaanxi Province, China. Toxics. 2022; 10(7):385. https://doi.org/10.3390/toxics10070385
Chicago/Turabian StyleChen, Rui, Lei Han, Zhao Liu, Yonghua Zhao, Risheng Li, Longfei Xia, and Yamin Fan. 2022. "Assessment of Soil-Heavy Metal Pollution and the Health Risks in a Mining Area from Southern Shaanxi Province, China" Toxics 10, no. 7: 385. https://doi.org/10.3390/toxics10070385
APA StyleChen, R., Han, L., Liu, Z., Zhao, Y., Li, R., Xia, L., & Fan, Y. (2022). Assessment of Soil-Heavy Metal Pollution and the Health Risks in a Mining Area from Southern Shaanxi Province, China. Toxics, 10(7), 385. https://doi.org/10.3390/toxics10070385