
Indoor Air Quality Considerations for Laboratory Animals in Wildfire-Impacted Regions—A Pilot Study

 , ,
, ,  ,
, 
Abstract
:Simple Summary
Abstract
1. Introduction
2. Materials and Methods
3. Results
4. Discussion
5. Conclusions
Author Contributions
Funding
Institutional Review Board Statement
Informed Consent Statement
Data Availability Statement
Conflicts of Interest
References
- Sheehan, M.C. 2021 Climate and Health Review–Uncharted Territory: Extreme Weather Events and Morbidity. Int. J. Health Serv. Plan. Adm. Eval. 2022, 52, 189–200. [Google Scholar] [CrossRef] [PubMed]
- Senande-Rivera, M.; Insua-Costa, D.; Miguez-Macho, G. Spatial and temporal expansion of global wildland fire activity in response to climate change. Nat. Commun. 2022, 13, 1208. [Google Scholar] [CrossRef] [PubMed]
- Borchers-Arriagada, N.; Bowman, D.M.J.S.; Price, O.; Palmer, A.J.; Samson, S.; Clarke, H.; Sepulveda, G.; Johnston, F.H. Smoke health costs and the calculus for wildfires fuel management: A modelling study. Lancet Planet. Health 2021, 5, e608–e619. [Google Scholar] [CrossRef]
- Xue, T.; Geng, G.; Li, J.; Han, Y.; Guo, Q.; Kelly, F.J.; Wooster, M.J.; Wang, H.; Jiangtulu, B.; Duan, X.; et al. Associations between exposure to landscape fire smoke and child mortality in low-income and middle-income countries: A matched case-control study. Lancet Planet. Health 2021, 5, e588–e598. [Google Scholar] [CrossRef]
- Xu, J.-W.; Martin, R.V.; Evans, G.J.; Umbrio, D.; Traub, A.; Meng, J.; van Donkelaar, A.; You, H.; Kulka, R.; Burnett, R.T.; et al. Predicting Spatial Variations in Multiple Measures of Oxidative Burden for Outdoor Fine Particulate Air Pollution across Canada. Environ. Sci. Technol. 2021, 55, 9750–9760. [Google Scholar] [CrossRef]
- Hoover, K.; Hanson, L.A. Wildfire Statistics. Congressional Research Service, IF10244, October 2021. Available online: https://sgp.fas.org/crs/misc/IF10244.pdf (accessed on 4 May 2022).
- McClure, C.D.; Jaffe, D.A. US particulate matter air quality improves except in wildfire-prone areas. Proc. Natl. Acad. Sci. USA 2018, 115, 7901–7906. [Google Scholar] [CrossRef] [Green Version]
- Burke, M.; Driscoll, A.; Heft-Neal, S.; Xue, J.; Burney, J.; Wara, M. The changing risk and burden of wildfire in the United States. Proc. Natl. Acad. Sci. USA 2021, 118, e2011048118. [Google Scholar] [CrossRef]
- Ford, B.; Martin, M.V.; Zelasky, S.E.; Fischer, E.V.; Anenberg, S.C.; Heald, C.L.; Pierce, J.R. Future Fire Impacts on Smoke Concentrations, Visibility, and Health in the Contiguous United States. GeoHealth 2018, 2, 229–247. [Google Scholar] [CrossRef] [Green Version]
- Kim, Y.H.; Warren, S.H.; Krantz, Q.T.; King, C.; Jaskot, R.; Preston, W.T.; George, B.J.; Hays, M.D.; Landis, M.; Higuchi, M.; et al. Mutagenicity and Lung Toxicity of Smoldering vs. Flaming Emissions from Various Biomass Fuels: Implications for Health Effects from Wildland Fires. Environ. Health Perspect. 2018, 126, 017011. [Google Scholar] [CrossRef] [Green Version]
- Black, C.; Tesfaigzi, Y.; Bassein, J.A.; Miller, L.A. Wildfire smoke exposure and human health: Significant gaps in research for a growing public health issue. Environ. Toxicol. Pharmacol. 2017, 55, 186–195. [Google Scholar] [CrossRef]
- Liu, Y.; Austin, E.; Xiang, J.; Gould, T.; Larson, T.; Seto, E. Health Impact Assessment of the 2020 Washington State Wildfire Smoke Episode: Excess Health Burden Attributable to Increased PM2.5 Exposures and Potential Exposure Reductions. GeoHealth 2021, 5, e2020GH000359. [Google Scholar] [CrossRef] [PubMed]
- Liu, J.C.; Wilson, A.; Mickley, L.J.; Dominici, F.; Ebisu, K.; Wang, Y.; Sulprizio, M.P.; Peng, R.D.; Yue, X.; Son, J.-Y.; et al. Wildfire-specific Fine Particulate Matter and Risk of Hospital Admissions in Urban and Rural Counties. Epidemiology 2017, 28, 77–85. [Google Scholar] [CrossRef] [PubMed] [Green Version]
- Makkonen, U.; Hellén, H.; Anttila, P.; Ferm, M. Size distribution and chemical composition of airborne particles in south-eastern Finland during different seasons and wildfire episodes in 2006. Sci. Total Environ. 2010, 408, 644–651. [Google Scholar] [CrossRef] [PubMed]
- Aguilera, R.; Corringham, T.; Gershunov, A.; Benmarhnia, T. Wildfire smoke impacts respiratory health more than fine particles from other sources: Observational evidence from Southern California. Nat. Commun. 2021, 12, 1493. [Google Scholar] [CrossRef]
- Karthikeyan, S.; Balasubramanian, R.; Iouri, K. Particulate Air Pollution from Bushfires: Human Exposure and Possible Health Effects. J. Toxicol. Environ. Health Part A 2006, 69, 1895–1908. [Google Scholar] [CrossRef]
- Williams, K.M.; Franzi, L.M.; Last, J.A. Cell-specific oxidative stress and cytotoxicity after wildfire coarse particulate matter instillation into mouse lung. Toxicol. Appl. Pharmacol. 2012, 266, 48–55. [Google Scholar] [CrossRef] [Green Version]
- Rhew, S.H.; Kravchenko, J.; Lyerly, H.K. Exposure to low-dose ambient fine particulate matter PM2.5 and Alzheimer’s disease, non-Alzheimer’s dementia, and Parkinson’s disease in North Carolina. PLoS ONE 2021, 16, e0253253. [Google Scholar] [CrossRef]
- Willson, B.E.; Pinkerton, K.E.; Lasley, B.; Gee, N. Effect of wildfire smoke on pregnancy outcomes in the non-human primate. Fertil. Steril. 2019, 112, e13. [Google Scholar] [CrossRef]
- Xiang, J.; Huang, C.-H.; Shirai, J.; Liu, Y.; Carmona, N.; Zuidema, C.; Austin, E.; Gould, T.; Larson, T.; Seto, E. Field measurements of PM2.5 infiltration factor and portable air cleaner effectiveness during wildfire episodes in US residences. Sci. Total Environ. 2021, 773, 145642. [Google Scholar] [CrossRef]
- May, N.W.; Dixon, C.; Jaffe, D.A. Impact of Wildfire Smoke Events on Indoor Air Quality and Evaluation of a Low-cost Filtration Method. Aerosol Air Qual. Res. 2021, 21, 210046. [Google Scholar] [CrossRef]
- Kacergis, J.B.; Jones, R.B.; Reeb, C.K.; Turner, W.A.; Ohman, J.L.; Ardman, M.R.; Paigen, B. Air Quality in an Animal Facility: Particulates, Ammonia, and Volatile Organic Compounds. Am. Ind. Hyg. Assoc. J. 1996, 57, 634–640. [Google Scholar] [CrossRef] [PubMed]
- Hudda, N.; Durant, J.L.; Nemeth, A.; Mann, P.; Petitto, J.; Brugge, D.; Nephew, B.C. Bedding-generated particulate matter: Implications for rodent studies. Inhal. Toxicol. 2019, 31, 368–375. [Google Scholar] [CrossRef] [PubMed]
- Besch, E.L. Animal Facility Ventilation Air Quality and Quantity. AIVC, 6 July 2013. Available online: https://www.aivc.org/resource/animal-facility-ventilation-air-quality-and-quantity (accessed on 2 January 2022).
- Werth, S.; Schusterman, E.; Peterson, C.; Mitloehner, F. Air: Confined Animal Facilities and Air Quality Issues. In Reference Module in Food Science; Elsevier: Amsterdam, The Netherlands, 2017. [Google Scholar] [CrossRef]
- National Research Council (US) Committee for the Update of the Guide for the Care and Use of Laboratory Animals. Environment, Housing, and Management; National Academies Press: Washington, DC, USA, 2011. Available online: https://www.ncbi.nlm.nih.gov/books/NBK54046/ (accessed on 2 January 2022).
- Design Requirements Manual (DRM). Available online: https://orf.od.nih.gov/TechnicalResources/Pages/DesignRequirementsManual2016.aspx (accessed on 3 January 2022).
- US EPA. What Is a MERV Rating? 19 February 2019. Available online: https://www.epa.gov/indoor-air-quality-iaq/what-merv-rating (accessed on 18 April 2022).
- Sayahi, T.; Butterfield, A.; Kelly, K.E. Long-term field evaluation of the Plantower PMS low-cost particulate matter sensors. Environ. Pollut. 2019, 245, 932–940. [Google Scholar] [CrossRef]
- Tryner, J.; L’Orange, C.; Mehaffy, J.; Miller-Lionberg, D.; Hofstetter, J.C.; Wilson, A.; Volckens, J. Laboratory evaluation of low-cost PurpleAir PM monitors and in-field correction using co-located portable filter samplers. Atmos. Environ. 2019, 220, 117067. [Google Scholar] [CrossRef]
- Barkjohn, K.K.; Gantt, B.; Clements, A.L. Development and application of a United States-wide correction for PM2.5 data collected with the PurpleAir sensor. Atmos. Meas. Tech. 2021, 14, 4617–4637. [Google Scholar] [CrossRef]
- Doubleday, A.; Schulte, J.; Sheppard, L.; Kadlec, M.; Dhammapala, R.; Fox, J.; Isaksen, T.B. Mortality associated with wildfire smoke exposure in Washington state, 2006–2017: A case-crossover study. Environ. Health 2020, 19, 4. [Google Scholar] [CrossRef] [Green Version]
- Zhou, X.; Josey, K.; Kamareddine, L.; Caine, M.C.; Liu, T.; Mickley, L.J.; Cooper, M.; Dominici, F. Excess of COVID-19 cases and deaths due to fine particulate matter exposure during the 2020 wildfires in the United States. Sci. Adv. 2021, 7, eabi8789. [Google Scholar] [CrossRef]
- Allen, R.; Larson, T.; Sheppard, L.; Wallace, L.; Liu, L.-J.S. Use of Real-Time Light Scattering Data to Estimate the Contribution of Infiltrated and Indoor-Generated Particles to Indoor Air. Environ. Sci. Technol. 2003, 37, 3484–3492. [Google Scholar] [CrossRef]
- Allen, R.; Wallace, L.; Larson, T.; Sheppard, L.; Liu, L.-J.S. Evaluation of the recursive model approach for estimating particulate matter infiltration efficiencies using continuous light scattering data. J. Expo. Sci. Environ. Epidemiol. 2007, 17, 468–477. Available online: https://www.nature.com/articles/7500539 (accessed on 10 February 2022). [CrossRef]
- Semmens, E.O.; Noonan, C.W.; Allen, R.W.; Weiler, E.C.; Ward, T.J. Indoor particulate matter in rural, wood stove heated homes. Environ. Res. 2015, 138, 93–100. [Google Scholar] [CrossRef] [Green Version]
- Ott, W.; Wallace, L.; Mage, D. Predicting Particulate (PM10) Personal Exposure Distributions Using a Random Component Superposition Statistical Model. J. Air Waste Manag. Assoc. 2000, 50, 1390–1406. [Google Scholar] [CrossRef] [PubMed] [Green Version]
- Diapouli, E.; Chaloulakou, A.; Koutrakis, P. Estimating the concentration of indoor particles of outdoor origin: A review. J. Air Waste Manag. Assoc. 2013, 63, 1113–1129. [Google Scholar] [CrossRef] [PubMed]
- Barn, P.; Larson, T.I.; Noullett, M.; Kennedy, S.; Copes, R.; Brauer, M. Infiltration of forest fire and residential wood smoke: An evaluation of air cleaner effectiveness. J. Expo. Sci. Environ. Epidemiol. 2007, 18, 503–511. [Google Scholar] [CrossRef] [PubMed] [Green Version]
- Liang, Y.; Sengupta, D.; Campmier, M.J.; Lunderberg, D.M.; Apte, J.S.; Goldstein, A.H. Wildfire smoke impacts on indoor air quality assessed using crowdsourced data in California. Proc. Natl. Acad. Sci. USA 2021, 118, e2106478118. [Google Scholar] [CrossRef] [PubMed]
- Cho, C.-C.; Hsieh, W.-Y.; Tsai, C.-H.; Chen, C.-Y.; Chang, H.-F.; Lin, C.-S. In Vitro and In Vivo Experimental Studies of PM2.5 on Disease Progression. Int. J. Environ. Res. Public Health 2018, 15, 1380. [Google Scholar] [CrossRef] [PubMed] [Green Version]
- Rubin, E.S.; Parker, P.B.; Garg, B.; Wu, D.; Peregrine, J.; Lee, D.; Amato, P.; Gibbins, K.J.; Baldwin, M.K.; O’Leary, T.; et al. Wildfire Smoke Exposure Is Associated with Decreased Total Motile Sperm Count. Fertil. Steril. 2021, 116, e89. [Google Scholar] [CrossRef]
- Capitanio, J.P.; Del Rosso, L.A.; Gee, N.; Lasley, B.L. Adverse biobehavioral effects in infants resulting from pregnant rhesus macaques’ exposure to wildfire smoke. Nat. Commun. 2022, 13, 1774. [Google Scholar] [CrossRef] [PubMed]
- Sosedova, L.M.; Vokina, V.A.; Novikov, M.A.; Rukavishnikov, V.S.; Andreeva, E.S.; Zhurba, O.M.; Alekseenko, A.N. Paternal Biomass Smoke Exposure in Rats Produces Behavioral and Cognitive Alterations in the Offspring. Toxics 2020, 9, 3. [Google Scholar] [CrossRef]
- O’Dell, K.; Bilsback, K.; Ford, B.; Martenies, S.E.; Magzamen, S.; Fischer, E.V.; Pierce, J.R. Estimated Mortality and Morbidity Attributable to Smoke Plumes in the United States: Not Just a Western US Problem. GeoHealth 2021, 5, e2021GH000457. [Google Scholar] [CrossRef]
- Magzamen, S.; Gan, R.W.; Liu, J.; O’Dell, K.; Ford, B.; Berg, K.; Bol, K.; Wilson, A.; Fischer, E.V.; Pierce, J.R. Differential Cardiopulmonary Health Impacts of Local and Long-Range Transport of Wildfire Smoke. GeoHealth 2021, 5, e2020GH000330. [Google Scholar] [CrossRef]
- Lindaas, J.; Farmer, D.K.; Pollack, I.B.; Abeleira, A.; Flocke, F.; Roscioli, R.; Herndon, S.; Fischer, E.V. Changes in ozone and precursors during two aged wildfire smoke events in the Colorado Front Range in summer 2015. Atmos. Chem. Phys. 2017, 17, 10691–10707. [Google Scholar] [CrossRef] [Green Version]
- Adetona, O.; Reinhardt, T.E.; Domitrovich, J.; Broyles, G.; Adetona, A.; Kleinman, M.T.; Ottmar, R.D.; Naeher, L.P. Review of the health effects of wildland fire smoke on wildland firefighters and the public. Inhal. Toxicol. 2016, 28, 95–139. [Google Scholar] [CrossRef] [PubMed]
- Sanderfoot, O.V.; Bassing, S.B.; Brusa, J.L.; Emmet, R.L.; Gillman, S.J.; Swift, K.; Gardner, B. A review of the effects of wildfire smoke on the health and behavior of wildlife. Environ. Res. Lett. 2021, 16, 123003. [Google Scholar] [CrossRef]
- Orr, A.; Migliaccio, C.A.L.; Buford, M.; Ballou, S.; Migliaccio, C.T. Sustained Effects on Lung Function in Community Members Following Exposure to Hazardous PM2.5 Levels from Wildfire Smoke. Toxics 2020, 8, 53. [Google Scholar] [CrossRef]
- Jalava, P.I.; Salonen, R.O.; Hälinen, A.I.; Penttinen, P.; Pennanen, A.; Sillanpää, M.; Sandell, E.; Hillamo, R.; Hirvonen, M.-R. In vitro inflammatory and cytotoxic effects of size-segregated particulate samples collected during long-range transport of wildfire smoke to Helsinki. Toxicol. Appl. Pharmacol. 2006, 215, 341–353. [Google Scholar] [CrossRef]
- Ramos, C.; Cañedo-Mondragón, R.; Becerril, C.; González-Ávila, G.; Esquivel, A.L.; Torres-Machorro, A.L.; Montaño, M. Short-Term Exposure to Wood Smoke Increases the Expression of Pro-Inflammatory Cytokines, Gelatinases, and TIMPs in Guinea Pigs. Toxics 2021, 9, 227. [Google Scholar] [CrossRef]
- Black, C.; Gerriets, J.E.; Fontaine, J.H.; Harper, R.W.; Kenyon, N.J.; Tablin, F.; Schelegle, E.S.; Miller, L.A. Early Life Wildfire Smoke Exposure Is Associated with Immune Dysregulation and Lung Function Decrements in Adolescence. Am. J. Respir. Cell Mol. Biol. 2017, 56, 657–666. [Google Scholar] [CrossRef] [PubMed]
- Schuller, A.; Bellini, C.; Jenkins, T.G.; Eden, M.; Matz, J.; Oakes, J.; Montrose, L. Simulated Wildfire Smoke Significantly Alters Sperm DNA Methylation Patterns in a Murine Model. Toxics 2021, 9, 199. [Google Scholar] [CrossRef]
- Legoff, L.; D’Cruz, S.C.; Tevosian, S.; Primig, M.; Smagulova, F. Transgenerational Inheritance of Environmentally Induced Epigenetic Alterations during Mammalian Development. Cells 2019, 8, 1559. [Google Scholar] [CrossRef] [Green Version]
- Wildfire Smoke/Air Quality|University Health Services. Available online: https://uhs.berkeley.edu/health-topics/wildfire-smoke-air-quality (accessed on 3 January 2022).
- US EPA. Guidance Available to Prepare Schools, Commercial and Public Buildings for Wildfire Smoke. 15 June 2021. Available online: https://www.epa.gov/sciencematters/guidance-available-prepare-schools-commercial-and-public-buildings-wildfire-smoke (accessed on 4 January 2022).
- Besch, E.L. Definition of Laboratory Animal Environmental Conditions. In Animal Stress; Moberg, G.P., Ed.; Springer: New York, NY, USA, 1985; pp. 297–315. [Google Scholar] [CrossRef]
- National Research Council (US) Institute for Laboratory Animal Research. Environmental Controls (US Guidance); National Academies Press: Washington, DC, USA, 2004. Available online: https://www.ncbi.nlm.nih.gov/books/NBK25409/ (accessed on 4 January 2022).
- Canadian Council on Animal Care. Heating, Ventilation, and Air Conditioning: Addendum to the CCAC Guidelines on Laboratory Animal Facilities–Characteristics, Design and Development. 2019. Available online: http://www.aircuity.com/wp-content/uploads/CCAC-Documents-Combined.pdf (accessed on 2 May 2022).
- Cheek, E.; Guercio, V.; Shrubsole, C.; Dimitroulopoulou, S. Portable air purification: Review of impacts on indoor air quality and health. Sci. Total Environ. 2020, 766, 142585. [Google Scholar] [CrossRef]


| Outdoor PM2.5 (µg/m3) | Indoor PM2.5 (µg/m3) | HEPA Cage PM2.5 (µg/m3) | ||
|---|---|---|---|---|
| Sampling Days | Mean (sd) Min, Median, Max | Mean (sd) Min, Median, Max | Mean (sd) Min, Median, Max | |
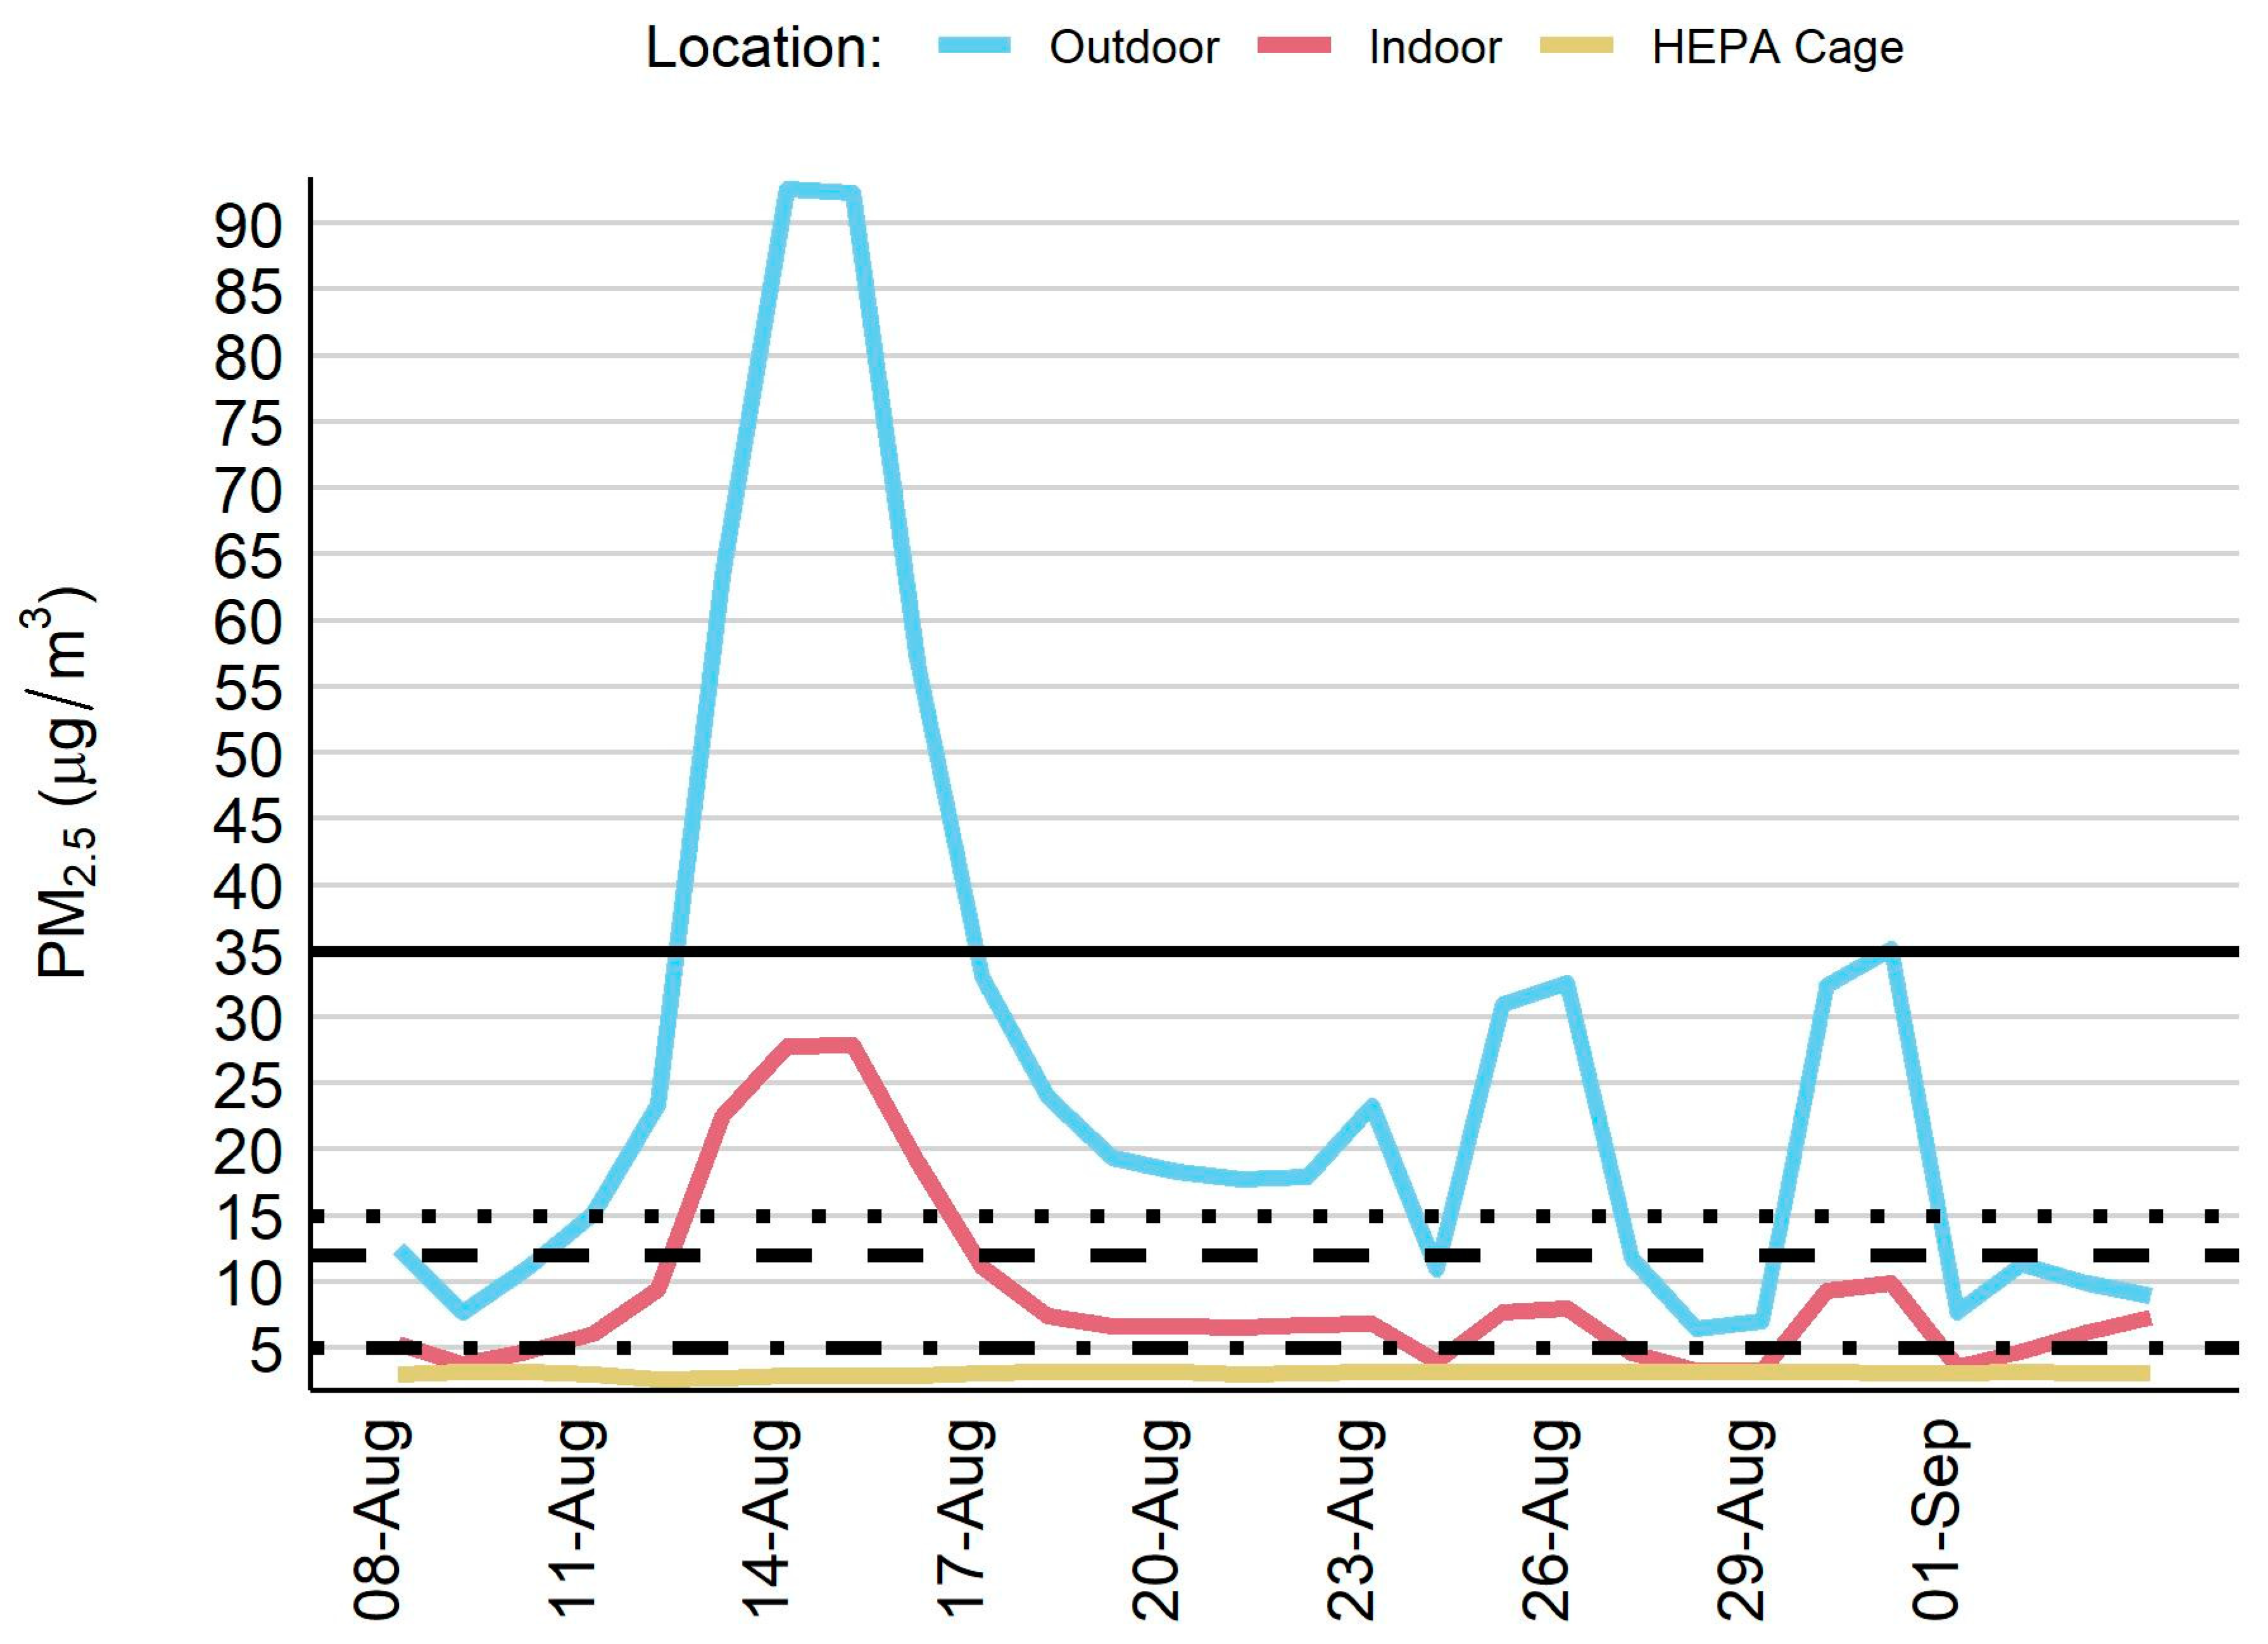
| All Study Days | 28 | 26.2 (23.4) 6.4, 18.1, 92.6 | 8.9 (6.9) 3.3, 6.7, 27.9 | 3.1 (0.1) 2.6, 3.1, 3.2 |
| Wildfire Day | 12 | 45.0 (25.4) 23.3, 32.8, 92.6 | 13.9 (8.1) 7.9, 9.7, 27.9 | 3.0 (0.2) 2.6, 3.1, 3.2 |
| Non-Wildfire Day | 16 | 12.1 (4.3) 6.4, 11.2, 19.4 | 5.2 (1.4) 3.3, 5.0, 7.3 | 3.1 (0.1) 3.0, 3.1, 3.2 |
| Sampling Days | Outdoor–Indoor PM2.5 Difference (µg/m3) | Indoor/ Outdoor PM2.5 Ratio | Infiltration Efficiency (95% CI) | Outdoor-Generated Indoor PM2.5 (µg/m3) | Percent (%) Indoor PM2.5 Generated Outdoors | |
|---|---|---|---|---|---|---|
| Mean (sd) Min, Median, Max | Mean (sd) Min, Median, Max | Mean (sd) Min, Median, Max | ||||
| All Study Days | ||||||
| Indoor location | 28 | 17.3 (16.8) 1.6, 11.4, 64.8 | 0.34 | 0.30 (0.21, 0.43) | 7.7 (7.0) 1.9, 5.4, 27.8 | 80 (17) 37, 82, 100 |
| HEPA cage location | 28 | 23.1 (23.5) 3.2, 14.9, 89.7 | 0.12 | NA* | NA* | NA* |
| Wildfire Day | ||||||
| Indoor location | 12 | 31.1 (17.6) 14.0, 24.0, 64.8 | 0.31 | 0.30 (0.17, 0.50) | 13.1 (7.9) 6.8, 9.6, 27.8 | 94 (8) 74, 100, 100 |
| HEPA cage location | 12 | 42.0 (25.5) 20.1, 29.7, 89.7 | 0.07 | NA* | NA* | NA* |
| Non-Wildfire Day | ||||||
| Indoor location | 16 | 6.9 (3.4) 1.6, 6.8, 12.8 | 0.43 | 0.40 (0.29, 0.54) | 3.6 (1.3) 1.9, 3.4, 5.8 | 70 (14) 37, 72, 88 |
| HEPA cage location | 16 | 9.0 (4.3) 3.2, 8.0, 16.2 | 026 | NA* | NA* | NA* |
| Outdoor PM2.5 (µg/m3) | Indoor PM2.5 (µg/m3) | HEPA Cage PM2.5 (µg/m3) | |
|---|---|---|---|
| Sampling Days, n | 28 | 28 | 28 |
| Days with PM2.5 > 35 µg/m3, n (%) a | 5 (18) | 0 (0) | 0 (0) |
| Days with PM2.5 > 12 µg/m3, n (%) a | 18 (64) | 4 (14) | 0 (0) |
| Days with PM2.5 > 15 µg/m3, n (%) b | 17 (61) | 4 (14) | 0 (0) |
| Days with PM2.5 > 5 µg/m3, n (%) b | 28 (100) | 20 (71) | 0 (0) |
Publisher’s Note: MDPI stays neutral with regard to jurisdictional claims in published maps and institutional affiliations. |
© 2022 by the authors. Licensee MDPI, Basel, Switzerland. This article is an open access article distributed under the terms and conditions of the Creative Commons Attribution (CC BY) license (https://creativecommons.org/licenses/by/4.0/).
Share and Cite
Schuller, A.; Walker, E.S.; Goodrich, J.M.; Lundgren, M.; Montrose, L. Indoor Air Quality Considerations for Laboratory Animals in Wildfire-Impacted Regions—A Pilot Study. Toxics 2022, 10, 387. https://doi.org/10.3390/toxics10070387
Schuller A, Walker ES, Goodrich JM, Lundgren M, Montrose L. Indoor Air Quality Considerations for Laboratory Animals in Wildfire-Impacted Regions—A Pilot Study. Toxics. 2022; 10(7):387. https://doi.org/10.3390/toxics10070387
Chicago/Turabian StyleSchuller, Adam, Ethan S. Walker, Jaclyn M. Goodrich, Matthew Lundgren, and Luke Montrose. 2022. "Indoor Air Quality Considerations for Laboratory Animals in Wildfire-Impacted Regions—A Pilot Study" Toxics 10, no. 7: 387. https://doi.org/10.3390/toxics10070387
APA StyleSchuller, A., Walker, E. S., Goodrich, J. M., Lundgren, M., & Montrose, L. (2022). Indoor Air Quality Considerations for Laboratory Animals in Wildfire-Impacted Regions—A Pilot Study. Toxics, 10(7), 387. https://doi.org/10.3390/toxics10070387