2. Literature Review and Research Gap
Despite the substantial development of green logistics research, the literature remains fragmented across several partially connected streams. Existing studies have generated important insights into emission-aware routing, predictive logistics planning, collaborative transportation, and digital traceability; however, these contributions are still predominantly developed in isolation rather than within a shared decision-support architecture.
First, a large body of work addresses green vehicle routing and multi-objective logistics optimization by balancing cost, emissions, and service performance. While these studies provide valuable algorithmic and modeling advances, they generally focus on the prescriptive routing problem itself, with only limited attention given to how such optimization models can be continuously updated through predictive operational inputs in dynamic environments. As a result, the integration of multi-objective routing with adaptive parameter updating remains only partially addressed in the literature.
Second, predictive and data-driven logistics studies increasingly incorporate machine learning, rolling-horizon control, and time-dependent parameter estimation to improve responsiveness under congestion, demand volatility, and other non-stationary conditions. However, this stream typically emphasizes forecasting accuracy or adaptive re-optimization without linking these mechanisms to broader questions of stakeholder coordination, allocation stability, or auditable sustainability governance. Thus, predictive updating is often treated as an operational enhancement rather than as one component of a broader integrated sustainability-oriented decision framework.
Third, collaborative logistics and cooperative allocation studies have shown that joint planning may improve utilization, reduce costs, and support more efficient resource sharing across multiple actors. Nevertheless, these studies are usually developed separately from dynamic predictive routing and from formalized emissions-governance mechanisms. In particular, the literature provides limited evidence on how cooperative allocation principles can be connected to sustainability-oriented routing outcomes and embedded in a framework that simultaneously considers environmental performance, operational feasibility, and multi-actor incentive alignment.
Fourth, traceability- and blockchain-oriented studies contribute to transparency, data integrity, and sustainability reporting, but they commonly emphasize governance, information sharing, or supply-chain visibility without being tightly linked to the operational decision logic of routing and scheduling. Moreover, although emissions reporting and auditability are gaining strategic relevance, explicit alignment with ISO 14083-type accounting structures is still rarely incorporated into integrated logistics decision-support models. In many studies, environmental reporting remains an ex post documentation layer rather than a component that is structurally linked to operational data generation and execution records.
Fifth, the validation logic of the existing literature also remains uneven. Some studies demonstrate optimization performance on benchmark instances, while others focus on predictive accuracy, conceptual governance architectures, or collaborative principles. However, prior studies rarely evaluate whether rolling-horizon re-optimization, cooperative allocation, and audit logging jointly affect system-level performance under dynamic travel-time uncertainty, compared with configurations in which these layers are removed or treated separately. This motivates the component-level and scenario-based simulation design adopted in this study.
Consequently, the literature still offers limited simulation-based evidence on the combined behavior of optimization, predictive updating, cooperative allocation, and auditable emissions logging within one coherent framework.
Taken together, the principal gap is not the absence of individual methods for optimization, machine learning-based prediction, cooperation, or digital traceability. Rather, the unresolved limitation lies in their limited integration within a common green logistics decision-support architecture. The present study addresses this narrower gap by developing and evaluating a modular simulation-based framework that combines multi-objective MILP routing, predictive travel-time updating, cooperative allocation, and auditable emissions governance aligned with ISO 14083. In this sense, the contribution of the study lies primarily in integration and computational evaluation rather than in claiming a fundamentally new standalone optimization, machine learning, or blockchain method.
Several recent studies represent partial steps toward integration. Predictive and AI-based logistics studies connect data-driven estimation with supply-chain planning, but they typically do not incorporate cooperative allocation or ISO-aligned emissions auditability. Digital supply chain twin approaches support disruption management and resilience, yet they are not specifically designed to link green routing outputs with cooperative game-theoretic allocation and emissions ledger logging. Similarly, blockchain- and emissions-accounting-oriented studies strengthen traceability and reporting, but they generally remain downstream governance mechanisms rather than being embedded in a predictive–prescriptive routing workflow. These near-misses confirm that the research gap lies not in the absence of individual components, but in their joint operational integration.
Table 1 provides a focused comparative overview of key methodological dimensions across representative green logistics studies. Rather than aiming at exhaustive bibliometric coverage or a systematic review of the full field, the table is intended to position the present study relative to the main analytical strands most relevant to its contribution. The included studies were selected as representative examples of green routing optimization, collaborative transportation and cost allocation, and blockchain-oriented transparency and traceability research. The comparison dimensions were defined to indicate whether these studies incorporate operational optimization, predictive updating, cooperative coordination, or audit-oriented traceability within their analytical scope.
Earlier research has primarily investigated optimization-based routing models [
1,
2,
3,
10], predictive–prescriptive integration [
6,
11,
12] or blockchain-enabled logistics transparency [
13,
14] as largely independent methodological strands. For example, green vehicle routing models typically focus on emission-aware optimization without incorporating predictive parameter adaptation or cooperative incentive mechanisms. Similarly, blockchain-based studies emphasize transparency and traceability but rarely integrate operational decision models.
In contrast, the framework proposed in this study combines these methodological dimensions within a shared simulation-based decision-support architecture. This integration enables the simultaneous consideration of operational efficiency, data-driven adaptability, incentive-compatible collaboration, and auditable emissions governance aligned with ISO 14083:2023.
In the context studied here, these four methodological layers are not treated as equally central in operational terms. Multi-objective routing remains the prescriptive core of the framework, predictive updating improves the quality of time-dependent inputs, cooperative allocation provides a coordination mechanism for multi-actor implementation, and blockchain-based logging supports auditability and traceability. The rationale for combining these layers is therefore one of functional complementarity rather than a claim that all components contribute equally to routing efficiency. This distinction helps position the framework as an integration-oriented decision-support architecture rather than as a single monolithic optimization model.
3. Conceptual Framework and Integrated Architecture
This section clarifies the conceptual architecture of the proposed framework rather than developing a standalone causal theory of logistics behavior. Its aim is to explain how the main functional layers of the framework are conceptually related within a simulation-based decision-support setting for sustainable logistics planning. Rather than treating optimization, predictive updating, cooperative coordination, and emissions auditing as isolated modules, the framework organizes them into a common workflow designed to support operational, environmental, and governance-related decision needs.
Conceptually, the framework is informed by four complementary logics. First, sustainable logistics planning is approached through multi-objective trade-off logic, according to which economic cost, environmental performance, and service reliability must be considered jointly rather than in isolation [
1,
2,
3]. Second, the framework reflects a socio-technical coordination perspective. In this study, this refers to the joint coordination of technical elements, such as data flows, predictive inputs, optimization outputs, and emissions records, with social or organizational elements, such as stakeholder incentives, allocation rules, and shared audit responsibilities. Third, the cooperative allocation layer draws on game-theoretic coordination logic by representing how system-level gains may be distributed across actors under modeled rationality assumptions [
4,
15]. Fourth, the governance layer reflects the increasing importance of traceability, verification, and auditability in regulation-sensitive logistics environments [
8,
13,
14,
16].
Within this study, sustainable logistics decision-making refers to the joint consideration of economic cost, transport-related emissions, and service-level performance under operational and regulatory constraints. Cooperative stability refers to the modeled feasibility of stakeholder-level allocation outcomes under core-feasibility and individual-rationality conditions, rather than to empirically verified inter-organizational behavior. Adaptive parameter dynamics refers to the periodic updating of time-dependent operational inputs, such as travel times and related routing parameters, within the rolling-horizon workflow. Auditable emissions governance refers to the traceable and verifiable recording of emissions-related operational events in a form consistent with ISO 14083:2023-aligned reporting logic.
Sustainable logistics planning requires the simultaneous consideration of economic performance, environmental impact, and service quality under dynamic operating conditions [
1,
2,
3]. In addition, real logistics systems increasingly operate in settings where decision support must extend beyond routing efficiency alone to address coordination among multiple actors, traceable environmental reporting, and regulatory consistency. In response to these requirements, the proposed framework combines four functionally connected layers: (i) multi-objective prescriptive optimization, (ii) cooperative allocation and coordination, (iii) learning-based parameter updating, and (iv) auditable emissions governance aligned with ISO 14083:2023 [
8].
The framework is conceptualized as a modular but connected architecture. Its purpose is not to claim that each component is individually novel, but to provide a structured way of combining them within a shared simulation-based decision-support environment. The framework should therefore be interpreted as a conceptual integration of functionally distinct but connected layers rather than as a single unified causal theory. The routing layer serves as the operational core, the predictive layer updates time-dependent inputs, the cooperative layer provides a coordination mechanism for multi-actor implementation, and the governance layer supports downstream traceability and auditability. This scope definition also implies that the present framework is bounded by modeled assumptions regarding data availability, rolling-horizon observability, stakeholder rationality, and medium-scale computational tractability.
The following subsections outline the role of each layer and clarify how these elements contribute to the overall architecture.
3.1. Multi-Objective Routing as the Operational Core
At the center of the framework is a multi-objective routing layer that represents the operational core of the system. Logistics decisions in sustainability-oriented environments must typically balance at least three dimensions: operational cost, environmental burden, and service performance [
1,
2,
3]. These dimensions are inherently interdependent, as improvements in one objective may generate trade-offs in another.
To represent these trade-offs explicitly, the framework adopts a multi-objective optimization perspective in which routing and scheduling decisions are evaluated jointly with respect to cost, CO
2 emissions, and service reliability. Mixed-integer linear programming (MILP) provides the formal modeling backbone because it allows the explicit representation of routing choices, vehicle capacities, time windows, heterogeneous fleets, intermodal constraints, and policy-sensitive restrictions within a unified decision model [
2,
3]. Within the overall architecture, this optimization layer serves as the main prescriptive engine that generates feasible operational decisions.
3.2. Cooperative Allocation and Stakeholder Coordination
Sustainable logistics initiatives often involve multiple actors, including carriers, shippers, and distribution partners. Even if joint optimization improves system-level performance, implementation may remain difficult unless the resulting benefits and burdens can be allocated in a way that is acceptable to participating stakeholders [
3,
4].
For this reason, the framework includes a cooperative allocation layer that links optimized logistics outcomes to stakeholder-level distribution logic. Coalition values are derived from the operational results of the routing layer, and the allocation mechanism is used to distribute joint gains according to modeled marginal contributions [
15]. In this way, the framework extends beyond route generation and also addresses whether a coordinated solution can remain acceptable under multi-actor participation.
The role of this layer is therefore not to replace operational optimization, but to complement it by introducing a coordination perspective. In the present study, cooperative stability is treated as a modeled property of the allocation mechanism under the stated assumptions, rather than as a fully behaviorally validated inter-organizational outcome.
3.3. Predictive Updating Under Dynamic Conditions
Logistics operations are subject to time-varying and non-stationary conditions, such as congestion, demand fluctuations, weather disruptions, and policy-induced changes in network accessibility [
11,
12]. Under such conditions, static routing parameters may reduce the relevance and feasibility of optimization outputs over time.
To address this limitation, the framework incorporates a predictive updating layer based on supervised learning within a rolling-horizon decision process. Time-dependent inputs, such as expected travel times and other operational parameters, are periodically updated using observed and historically generated data [
6,
9]. These updated estimates are then passed to the routing model before re-optimization.
This layer does not alter the structural logic of the optimization model itself. Instead, it improves the quality and timeliness of the inputs used by the operational core. As a result, the framework combines prescriptive optimization with data-driven adaptivity, allowing the routing layer to respond more effectively to evolving operating conditions while remaining computationally structured.
3.4. Auditable Emissions Governance and Traceability
Environmental improvement in logistics increasingly requires not only better decisions, but also more transparent and verifiable reporting of emissions-related outcomes. To address this requirement, the framework includes an auditable governance layer aligned with ISO 14083:2023 [
8]. In the proposed architecture, segment-level emissions are linked to operational execution records so that environmental reporting remains consistent with the routing and allocation logic of the system.
A permissioned ledger-based mechanism is used to record emissions-relevant metadata and deviation events in a traceable and tamper-resistant form [
13,
14,
16]. Importantly, this layer is not modeled as a direct routing optimizer. Its role is governance-oriented: it supports traceability, auditability, and reporting integrity without interfering directly with the prescriptive optimization engine. This distinction is important because the contribution of the governance layer lies primarily in verification and transparency, rather than in direct route-efficiency improvement.
3.5. Integrated System Logic
The integrated system logic is based on sequential dependency between the four functional layers. The predictive layer first updates time-dependent operational inputs, such as travel-time estimates, before the optimization layer generates sustainability-aware routing and scheduling decisions. The cooperative allocation layer then uses the resulting system-level optimization outputs to derive stakeholder-level allocations, while the governance layer records the relevant emissions, routing, and allocation events after the operational decision has been generated.
This ordering is important because each layer depends on the output of the preceding stage. Predictive updating provides the input conditions for optimization; optimization produces the routes and performance outcomes required for cooperative allocation; and the governance layer creates the audit trail after the operational and allocation decisions are available. The framework should therefore be understood as an integrated workflow rather than as a single monolithic model.
The scope of the framework is bounded by modeled assumptions regarding data availability, rolling-horizon observability, stakeholder rationality, and medium-scale computational tractability. In the present study, the main simulation experiments focus on medium-scale urban and peri-urban freight distribution settings, while the scalability tests cover instances up to 75 customers and 15 vehicles under the stated solver settings. Accordingly, the framework should be interpreted as a simulation-based proof of concept rather than as evidence of unrestricted industrial-scale deployability.
4. Methodology
This section formalizes the integrated hybrid decision-support architecture introduced in
Section 3. The methodology operationalizes the theoretical pillars—multi-objective optimization, incentive-compatible cooperation, adaptive parameter learning, and auditable emissions governance—within a unified computational framework.
The architecture is designed to satisfy four simultaneous requirements:
Operational feasibility under realistic routing constraints [
1,
2,
3];
Adaptive responsiveness under non-stationary conditions [
7,
15];
Incentive stability in multi-actor environments [
4,
5,
17];
Regulatory auditability aligned with ISO 14083:2023 [
8,
11,
12,
16].
These requirements are reconciled within a rolling-horizon hybrid optimization loop.
4.1. Integrated Hybrid Framework Architecture
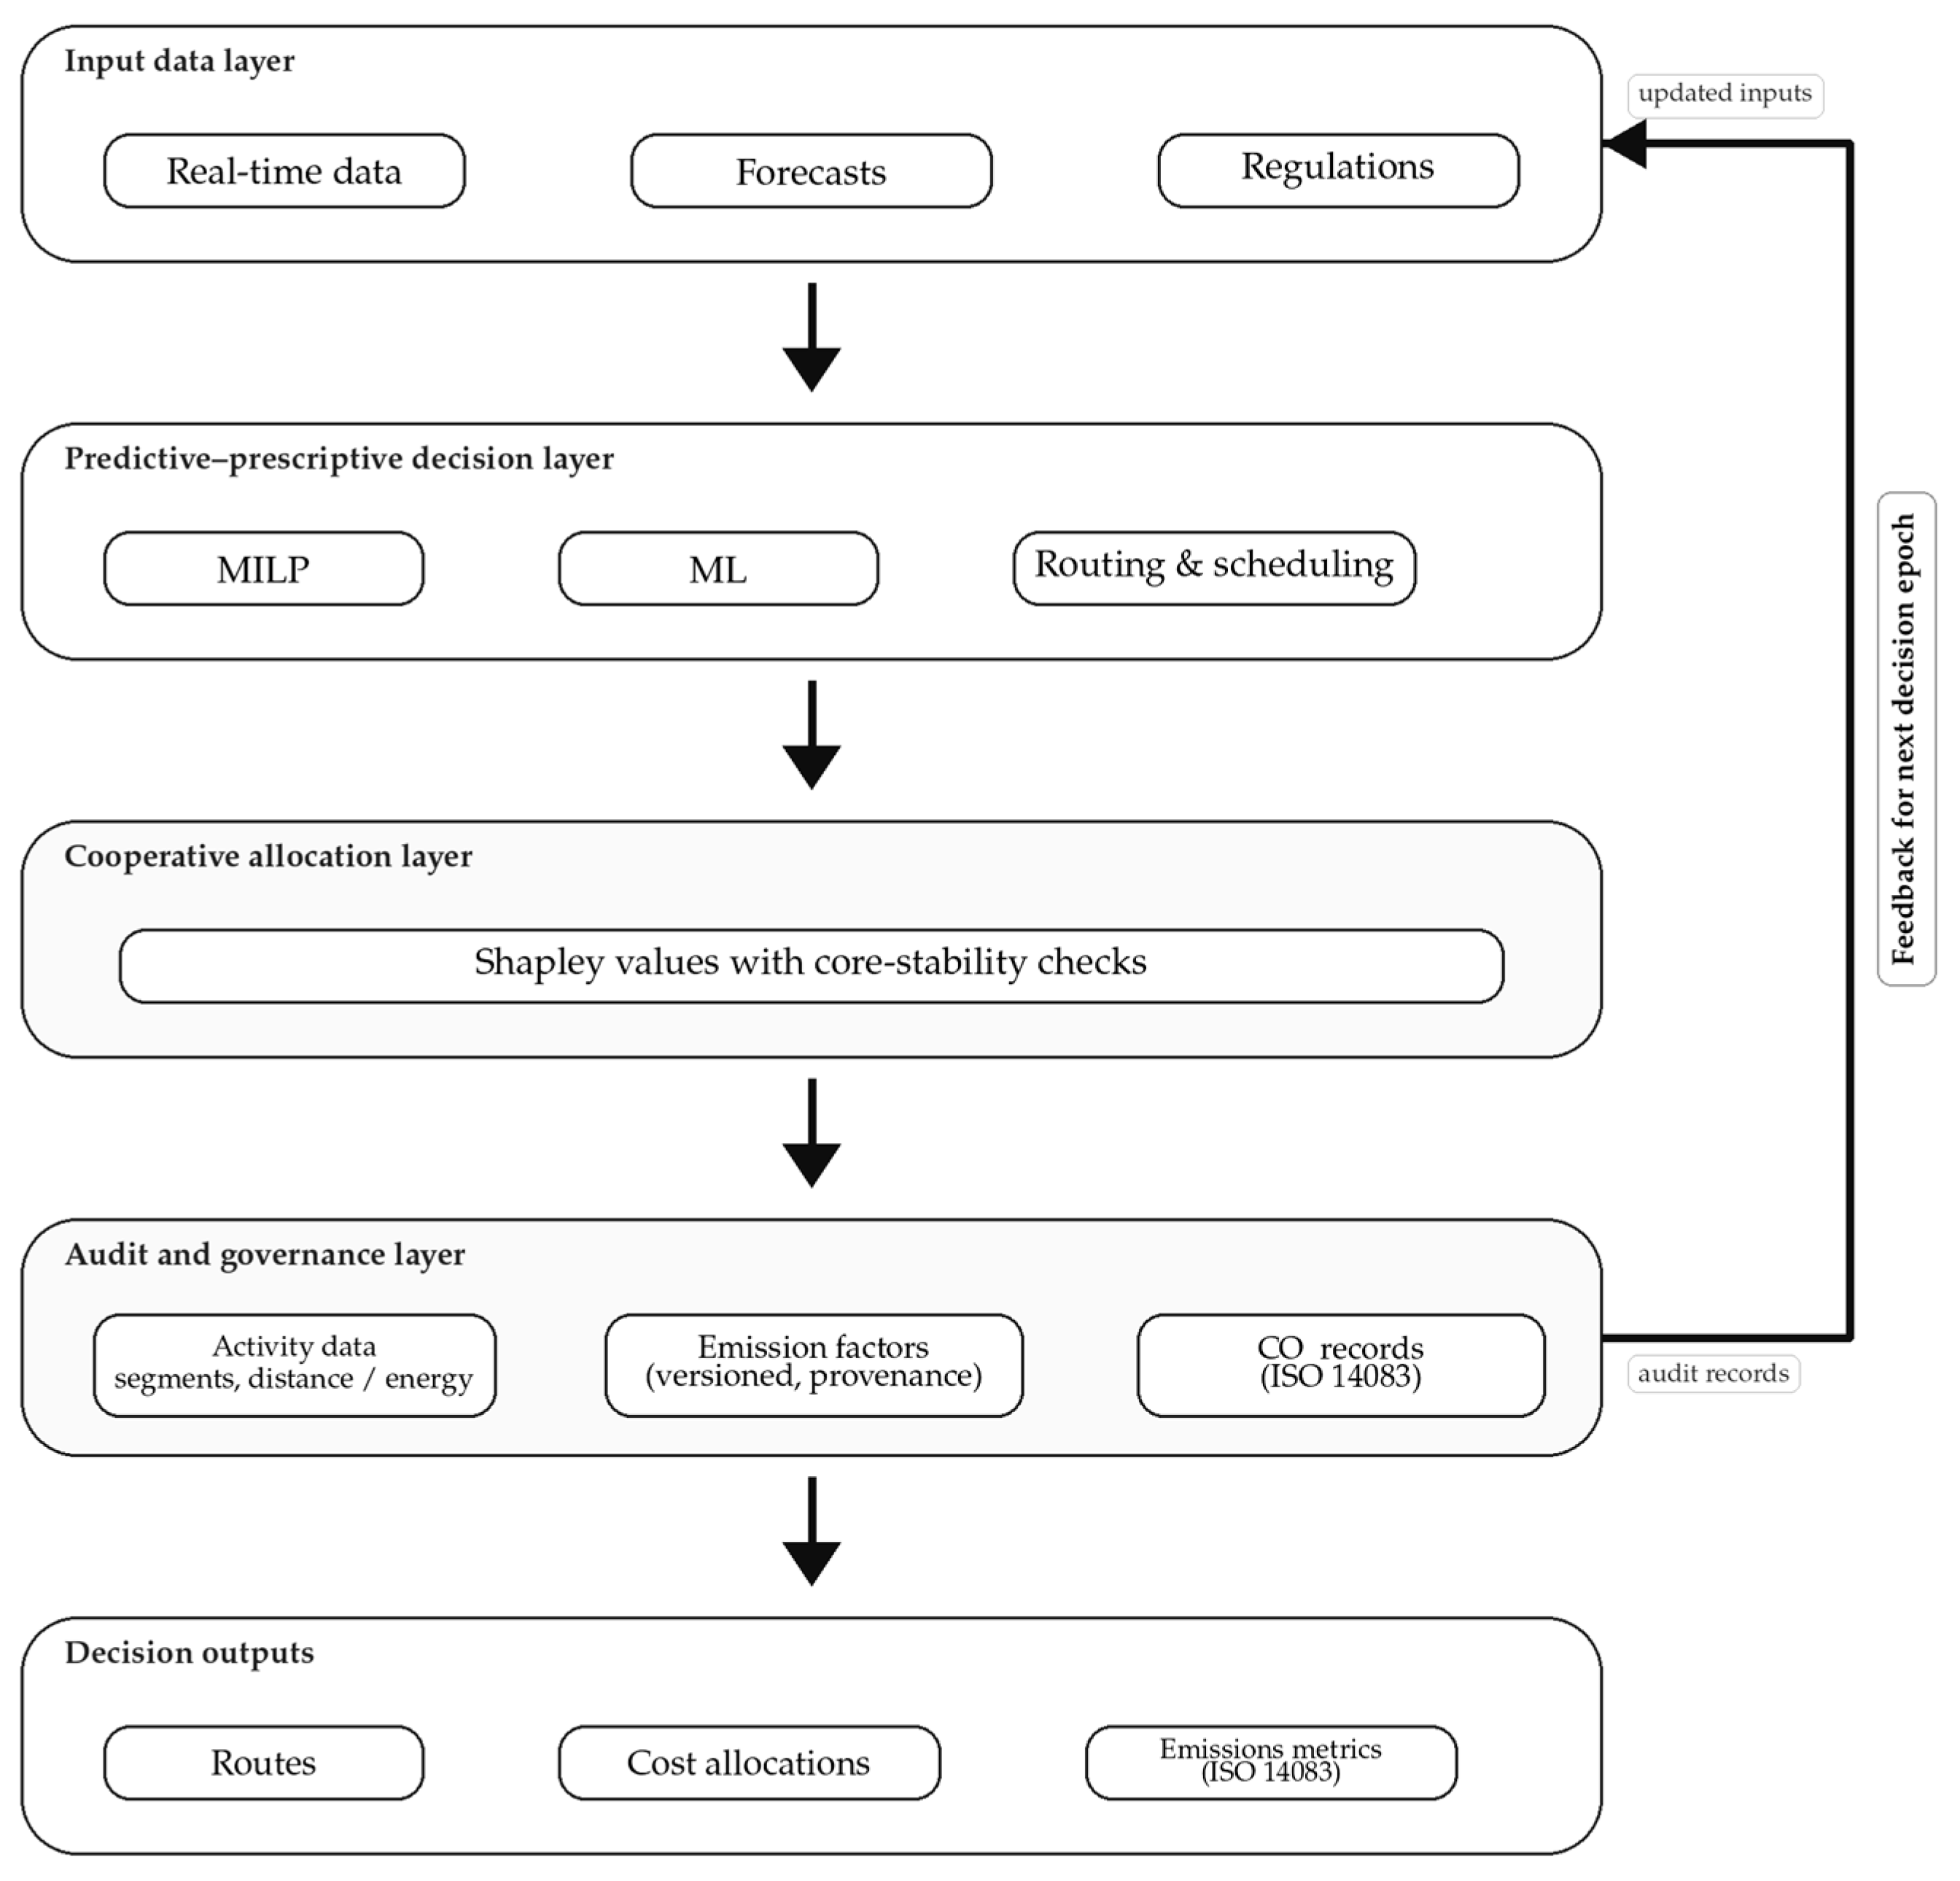
The system follows a layered yet functionally connected decision-support structure (
Figure 1). Each decision epoch consists of parameter updating, prescriptive optimization, cooperative allocation, and governance validation.
The architecture comprises four interdependent components:
Prescriptive optimization core generating routing and scheduling decisions [
1,
3];
Predictive parameter layer dynamically updating time-dependent inputs [
6,
13];
Cooperative allocation mechanism ensuring incentive compatibility among stakeholders [
7];
Auditable governance layer providing traceable and ISO-aligned emissions accounting [
16,
17,
18,
19].
Operational decisions are generated within a rolling-horizon control scheme. At predefined decision epochs, updated parameters are injected into the optimization model, which is subsequently re-solved. The auditing component records emissions-relevant events but does not modify routing decisions, preserving computational tractability [
18].
This separation of decision logic and governance validation ensures both optimization efficiency and regulatory transparency.
Figure 1 presents the layered methodological framework of the proposed approach and the information flow among its main modules.
Real-time, forecast, and regulatory inputs are harmonized and transformed into model parameters. These are updated through the predictive layer and passed to the optimization layer, where MILP and routing/scheduling generate the operational plan. The solution is then processed by the cooperative allocation module using Shapley values with core-stability checks, while the audit and governance layer records activity, emissions, allocation, and ISO 14083-aligned traceability information. The process is repeated at each decision epoch as new information becomes available.
As shown in
Figure 1, the framework operates sequentially at each decision epoch. First, real-time operational data, forecast information, and regulatory constraints are collected and converted into model-ready parameters. These parameters are then updated through ML-based predictive modules in order to reflect the most recent operating conditions and anticipated changes in demand, travel conditions, or compliance requirements. The revised parameters are subsequently passed to the optimization layer, where the MILP core and the routing/scheduling module jointly generate the operational plan for the current planning horizon.
Once a feasible system-level solution has been obtained, the cooperative allocation layer is activated. At this stage, Shapley value-based allocation with core-stability checks is used to distribute joint costs, benefits, or emission responsibilities among the participating actors. This step is therefore implemented as a post-optimization coordination mechanism based on the optimization outputs, rather than as part of the primary optimization solve itself.
Finally, the audit and governance layer records the relevant decision outputs and supporting evidence, including activity data, emission-factor provenance, CO2 documentation, route outputs, allocation results, and emission metrics, in order to ensure traceability, verification, and compliance. The entire workflow is repeated iteratively whenever new information becomes available, thereby linking predictive updating, optimization, cooperative allocation, and audit logging in a closed decision-support loop.
The framework should therefore be understood as integrated primarily at the level of workflow and data exchange, while the governance layer remains operationally downstream from the optimization solution.
4.2. Modeling and Framework Assumptions
The proposed framework is developed under a set of structural modeling assumptions intended to ensure internal consistency across the optimization, prediction, allocation, and governance layers. First, customer demand is assumed to be observable or estimable at each decision epoch for the current planning window, while future demand conditions may be updated through the rolling-horizon mechanism. Demand uncertainty is therefore represented through periodic re-estimation rather than through a fully stochastic programming structure.
Second, the fleet is assumed to be heterogeneous, consisting of vehicles that may differ in capacity, operating cost, transport mode, and emission characteristics. Vehicle availability is assumed to be known at the beginning of each decision epoch. Mode- and vehicle-specific compatibility restrictions may apply on selected arcs, reflecting operational and regulatory limitations.
Third, customer service is assumed to be subject to predefined time windows and service durations. Time-window violations are permitted only through an explicit penalty structure, allowing service unreliability to be represented within the optimization framework rather than treated as an external performance indicator.
Fourth, the transport network is represented as a directed graph in which nodes denote depots, transfer points, and customer locations, while arcs denote feasible transport connections. Arc-level costs, distances, and emission coefficients are assumed to be measurable or estimable for each relevant transport mode. Travel times are time-dependent and may be revised through the machine learning-based prediction layer at each decision epoch.
Fifth, the framework operates in a rolling-horizon setting in which decisions are periodically re-optimized as new operational information becomes available. The duration of the decision epoch and the planning horizon are assumed to be fixed within a given simulation experiment.
Sixth, the cooperative allocation layer assumes that coalition values can be derived from optimized operational outcomes under comparable conditions. The Shapley-based allocation is therefore interpreted as a post-optimization coordination mechanism under modeled rationality and information assumptions, rather than as a fully behaviorally validated representation of stakeholder negotiation.
Finally, the governance layer is assumed to operate independently from the optimization engine. Emissions-related events, activity records, and compliance-relevant metadata are logged after operational decisions are generated, ensuring that auditability and traceability are enhanced without directly altering the optimization logic.
These assumptions define the analytical scope of the framework and support a transparent interpretation of the subsequent methodological formulation and simulation-based evaluation.
To improve transparency regarding data provenance and scenario construction,
Table 2 summarizes the main model and experimental parameters, their values or ranges, and the basis on which they were specified. The table also distinguishes whether each parameter is based on secondary-data calibration, methodological assumption, benchmark convention, solver configuration, or scenario design.
4.3. Multi-Objective MILP Formulation
The operational planning problem is formulated as a multi-objective mixed-integer linear programming (MILP) model defined on a directed graph
, where
denotes the set of nodes and
represents the set of feasible transport arcs. Let
denote the set of vehicles,
the set of transport modes, and
the set of decision epochs in the rolling-horizon framework. Nodes represent depots, transfer points, and customers, while arcs represent feasible transport connections between nodes. The formulation captures routing decisions under heterogeneous fleet composition, service time windows, and transport mode-specific emission factors, consistent with sustainable vehicle routing models discussed in the literature [
1,
2,
3,
20].
Let
denote nodes,
vehicles,
transport modes, and
decision epochs. The subset
represents customer nodes requiring service. Each arc
is associated with distance
, operational cost
, and emission coefficient
, derived from activity-based emission accounting in accordance with ISO 14083:2023 [
8]. Additional parameters include predicted travel time
, customer demand
, vehicle capacity
, service time windows
, and service duration
.
Binary decision variables indicate whether vehicle traverses arc using transport mode during decision epoch . Continuous variables represent service start times, while denotes vehicle load after servicing node . Auxiliary ordering variables are introduced for subtour elimination.
The model considers three objective components: economic cost, transport-related emissions, and service unreliability. These objectives are defined separately because they capture different dimensions of logistics performance and are expressed in different units.
The novelty of the MILP component does not lie in introducing fundamentally new routing constraints, but in embedding cost, emissions, and service unreliability objectives within a broader architecture that is subsequently linked to predictive updating, stakeholder-level allocation, and auditable emissions governance.
For clarity, the main sets, indices, parameters, and decision variables used in the MILP formulation are summarized in
Table 3.
For additional clarity,
Table 4. summarizes the main classes of constraints included in the MILP formulation and their functional roles within the model. This compact overview is intended to complement the notation table and to guide the interpretation of the detailed mathematical constraints presented below.
The detailed mathematical expressions corresponding to these constraint groups are presented in the following equations.
The economic objective is defined as the minimization of total routing and operating cost (1):
The environmental objective is defined as the minimization of transport-related emissions (2):
The service-related objective is defined as the minimization of service unreliability penalties (3):
where
denotes the penalty associated with time-window violation or service delay for customer
at decision epoch
.
These three objective components form the basis of the multi-objective model. Their normalization and scalarization are introduced in
Section 4.3 in order to avoid direct aggregation of heterogeneous units.
The routing structure ensures that each customer is visited exactly once (4):
Flow conservation constraints maintain route continuity across the transport network (5):
Vehicle capacity feasibility is enforced through load propagation constraints (6) (7):
Service time windows are represented by (8)
while temporal consistency between consecutive node visits is guaranteed by (9)
Subtour elimination is implemented using Miller–Tucker–Zemlin constraints, which are commonly used in vehicle routing formulations [
1] (10) and (11):
To account for regulatory and technological constraints, intermodal compatibility restrictions are imposed (12):
where
indicates whether vehicle
is permitted to operate using transport mode
on arc
.
Finally, policy-driven environmental constraints, such as carbon caps or access restrictions in low-emission zones, can be represented as (13)
The decision-variable domains are defined as follows: are binary variables for all and , while and are nonnegative continuous variables over their corresponding index sets.
The present formulation is intended to provide a transparent and computationally manageable routing core for the medium-scale synthetic scenarios studied in this paper. In this context, the big- terms used in the temporal consistency constraints were selected as sufficiently large upper bounds relative to the planning horizon and service-time structure in order to avoid infeasible temporal linkages while preserving model solvability under the tested instances. The resulting formulation should therefore be interpreted as a practical implementation choice for the present experimental setting rather than as a claim of polyhedrally strongest possible routing formulation.
Similarly, Miller–Tucker–Zemlin (MTZ) subtour-elimination constraints were retained because they provide a compact and transparent formulation suitable for the medium-scale instances considered here. Although stronger flow-based or cut-based subtour formulations may be preferable for larger-scale industrial instances, the present study prioritizes formulation transparency and integration with the broader predictive, cooperative, and governance layers within the tested problem range. The service-time and time-window constraints are also interpreted jointly with the routing variables and customer-visit constraints. Accordingly, the timing relations are enforced only in connection with activated routing decisions, while customer service feasibility is ensured through the combined effect of the visit, sequencing, and temporal consistency constraints rather than by any single timing bound in isolation.
The above formulation constitutes the prescriptive core of the hybrid decision-support architecture. The individual objective functions are defined separately in this section, while their normalization and weighted scalarization are introduced in
Section 4.3. Time-dependent travel times are periodically updated through the machine learning prediction module described in
Section 4.5, while emission coefficients are derived according to ISO 14083:2023 emission accounting methodology [
8]. This integration ensures that environmental performance is embedded directly into operational routing decisions rather than evaluated solely as a post hoc indicator.
4.4. Computational Characteristics and Scalability
The computational performance of the proposed multi-objective MILP model was evaluated across instances of increasing size in order to assess its behavior under the tested experimental conditions [
10,
21]. All instances were solved using Gurobi 11.0 with a 1% optimality gap and a 3600 s time limit per instance. Experiments were conducted on a workstation equipped with an Intel i7 processor (3.4 GHz; Intel Corporation, Santa Clara, CA, USA) and 32 GB RAM.
Table 5 summarizes the computational results across representative problem sizes. The number of customers and vehicles was proportionally increased while maintaining identical constraint structures and parameter distributions.
Preliminary tests on 100-customer instances indicate increasing runtime with problem size, suggesting that larger instances may require decomposition or metaheuristic hybridization. The current evidence supports tractability for medium-scale synthetic scenarios under the tested solver settings. These results should not be interpreted as evidence of industrial-scale deployability without further large-instance testing and decomposition-based extensions.
Results are averaged over 50 simulation runs per instance size. Warm-start initialization within the rolling-horizon framework reduces re-optimization time by approximately 31% compared to cold-start execution. Observed runtime increases with problem size in a manner consistent with the combinatorial complexity of vehicle-routing formulations [
1,
3]. Because the underlying routing problem remains combinatorial and NP-hard, the reported runtime behavior should be interpreted empirically within the tested instance range rather than as evidence of a general asymptotic scaling law. Under the tested solver settings, the model remains solvable for the medium-scale synthetic instances considered in this study, while maintaining optimality gaps below 1%. These findings support computational feasibility within the experimental setting, but they should not be interpreted as evidence of practical deployability at larger industrial scales without further computational extensions and external validation.
4.5. Scalarization Strategy and Composite Performance Index
Because the three objective functions introduced in
Section 4.2 are expressed in heterogeneous units, they cannot be aggregated directly without creating methodological distortion. To address this issue, the objective components are first transformed into dimensionless normalized values, after which weighted scalarization is applied. This ensures that economic, environmental, and service-related criteria are combined in a consistent and interpretable manner.
For each objective function
, the normalized form is defined as (14)
where
and
denote the lower and upper reference bounds of objective
, respectively.
After normalization, the main weighted-sum scalarization used in the optimization model is formulated as [
11] (15)
subject to (16)
where
represents the relative importance assigned to the economic, environmental, and service-related objective components within a given scenario setting. The weighted-sum formulation is adopted as the primary optimization strategy because it remains computationally efficient and is therefore well suited for repeated rolling-horizon re-optimization [
11].
In the baseline setting, the scalar weights were selected as scenario-level preference parameters representing the relative emphasis placed on economic, environmental, and service-related performance, rather than as empirically estimated behavioral coefficients. Accordingly, the weighted-sum formulation serves as the default optimization setting throughout the main simulation experiments, whereas the -constraint formulation is retained as a complementary tool for auxiliary trade-off exploration.
In the
-constraint formulation, one objective is optimized while the remaining objective functions are bounded (17):
where
denotes the primary objective and
represents the admissible upper bound imposed on the remaining objective functions. This complementary formulation is used for trade-off analysis and robustness checks rather than as the default optimization setting.
4.6. Composite Performance Index for Scenario Comparison
For comparative evaluation across experimental scenarios, performance indicators are additionally normalized using min–max scaling. This normalization is applied at the reporting stage and is distinct from the normalized scalarization used within the optimization model.
The normalized performance indicator for criterion
is defined as (18) [
22]
where
denotes the observed value of performance criterion
, while
and
represent the corresponding lower and upper reference values across the evaluated scenarios.
A composite performance index is then computed as (19)
This composite index is used only for cross-scenario performance comparison in the results section and should not be confused with the normalized weighted scalarization applied within the optimization model. In this way, the manuscript distinguishes clearly between the optimization-stage handling of multiple objectives and the reporting-stage synthesis of scenario-level performance indicators. Accordingly, the normalized weighted sum is used as the primary optimization device, the -constraint formulation is retained only for supplementary trade-off exploration, and the composite performance index is used exclusively for scenario-level reporting.
4.7. Cooperative Cost Allocation Model
To support coordinated green logistics initiatives, a cooperative game
is defined over the set of stakeholders
[
2,
7]. The coalition value
for any
is derived from optimized logistics outcomes under identical operational constraints.
Fair allocation of the grand coalition value is achieved using the Shapley value (20) [
6,
7]:
Stability is assessed by checking core feasibility and individual rationality under the modeled allocation setting. When economic and environmental outcomes are combined, emissions may be converted using a shadow carbon price or reported separately in order to preserve transparency. Exact Shapley computation becomes computationally expensive for coalition sizes above six actors; therefore, Monte Carlo sampling (10,000 permutations) was applied to approximate marginal contributions in larger instances. Approximation error was monitored by repeated sampling convergence checks to ensure that the estimated allocations remained stable across repeated runs.
Coalition stability is therefore assessed mathematically under the stated modeling assumptions and should not be interpreted as behavioral proof of stakeholder acceptance in real implementation contexts. The allocation layer is intended to represent a coordination logic for multi-actor settings rather than an empirically validated bargaining process.
To illustrate the interpretation of the allocation mechanism, consider a simple three-stakeholder setting with actors , , and . Suppose that the stand-alone coalition values are , , and , while the pairwise coalition values are , , and , and the grand-coalition value is . Under these modeled values, the Shapley allocation distributes the grand-coalition benefit according to the average marginal contribution of each stakeholder across all coalition formation orders. This illustrative example is included only to clarify the logic of the allocation mechanism and should not be understood as evidence of observed stakeholder negotiation behavior.
4.8. Machine Learning-Based Dynamic Parameter Updating
Logistics operations are inherently affected by non-stationary conditions such as traffic congestion, demand variability, weather disruptions, and regulatory changes. Static travel-time parameters may therefore lead to routing decisions that gradually diverge from actual operating conditions. To address this limitation, the proposed framework incorporates supervised machine learning models that dynamically estimate time-dependent operational parameters used in the optimization model [
6,
9,
13]. Within the present study, this machine learning component should be interpreted as a simulation-based proof of concept for predictive parameter updating under controlled synthetic conditions rather than as a deployment-validated forecasting system.
Let
denote the predicted travel time on arc
at decision epoch
. Travel time predictions are obtained through supervised regression models that map operational features
to predicted travel times (21):
where
represents the predictive model and
denotes the learned model parameters.
The feature vector
incorporates both static and time-dependent explanatory variables. These include historical average travel times, congestion indicators derived from telematics data, precipitation and weather conditions, time-of-day and weekday indicators, vehicle characteristics, vehicle load factors, and calendar-based demand signals. Similar feature structures have been used in predictive logistics and intelligent transportation research [
9,
13].
Two ensemble learning models were considered due to their strong performance on structured tabular data: Random Forest regression and Gradient Boosting Regression Trees (GBRT). Both approaches are widely used in predictive logistics applications because they can capture nonlinear relationships between explanatory variables and travel times while remaining robust to noise and multicollinearity [
13].
To ensure methodological rigor and avoid temporal leakage, predictive models were trained and evaluated using a rolling-origin evaluation scheme [
9]. Historical operational data were synthetically generated to represent realistic urban freight dynamics over a 180-day horizon. Accordingly, the reported predictive performance should be interpreted as internal evidence within the simulation environment rather than as external validation on proprietary real-world logistics data. Each evaluation window consisted of a 120-day training period, a 30-day validation period for hyperparameter tuning, and a 30-day out-of-sample test period. The window was then shifted forward in time to simulate real-time forecasting conditions.
Model hyperparameters were selected using grid search on the validation set. For Random Forest models, the number of trees, maximum tree depth, and minimum split size were tuned. For GBRT models, learning rate, tree depth, and ensemble size were optimized. Performance was evaluated using root mean squared error (RMSE), mean absolute error (MAE), mean absolute percentage error (MAPE), and coefficient of determination (
), which are commonly used metrics in predictive transportation analytics [
9].
Results indicate that ensemble learning methods substantially outperform a static historical-average baseline. This baseline is intentionally simple and is used primarily as a transparent reference point rather than as a strong competitive benchmark against state-of-the-art predictive models. In particular, the GBRT model achieved the best predictive performance, reducing prediction error by approximately 23% in RMSE and 25% in MAPE relative to the baseline model. Improved prediction quality is consistent with the observed reduction in time-window violations and the improvement of routing feasibility within the simulation framework, although the present study does not claim strict causal identification beyond the modeled setting.
Predicted travel times are incorporated into the routing model through the rolling-horizon decision process. At each decision epoch
, the machine learning module produces updated parameter estimates
, which replace nominal travel-time values in the MILP formulation presented in
Section 4.2. The optimization model is then re-solved using these updated parameters, enabling routing decisions to adapt to evolving operational conditions.
To maintain predictive reliability over time, model performance is continuously monitored through residual analysis. Prediction errors are evaluated against predefined thresholds, and periodic retraining is triggered when model drift is detected. This monitoring mechanism ensures that predictive accuracy remains stable under evolving traffic patterns and seasonal demand fluctuations.
Through this predict–optimize feedback loop, the framework combines data-driven parameter estimation with prescriptive optimization. The machine learning layer improves the accuracy of operational inputs, while the MILP model ensures globally consistent routing decisions under economic, environmental, and service constraints. Similar predictive–prescriptive integration strategies have been shown to significantly enhance the robustness and responsiveness of logistics decision-support systems [
6,
9,
17].
4.9. Predictive Model Training and Performance Evaluation
To evaluate the predictive performance of the machine learning models described in
Section 4.5, a rolling-origin evaluation framework was implemented to mimic realistic forecasting conditions and avoid temporal leakage [
9]. Historical operational data were synthetically generated to represent realistic traffic dynamics over a 180-day horizon with daily arc-level observations.
Each rolling window consisted of a 120-day training period, a 30-day validation period used for hyperparameter tuning, and a 30-day out-of-sample test period. The evaluation window was then shifted forward in time to simulate continuous model updating in an operational environment.
Feature engineering incorporated both static and time-dependent predictors relevant to urban freight transport. These included historical average travel times, congestion indices, precipitation levels, weekday and holiday indicators, vehicle load factors, vehicle type (diesel or electric), and time-of-day categorical variables. All numerical features were standardized prior to model training.
Two ensemble regression models were evaluated: Random Forest (RF) and Gradient Boosting Regression Trees (GBRT). Hyperparameters were selected through grid-search optimization on the validation set. Predictive performance was assessed using root mean squared error (RMSE), mean absolute error (MAE), mean absolute percentage error (MAPE), and coefficient of determination (
) (
Table 6).
Relative to the historical-average baseline, the GBRT model achieves the best predictive performance, reducing prediction error by approximately 23% in RMSE and 25% in MAPE. These improvements directly contribute to more accurate travel-time estimates and reduce time-window violations within the rolling-horizon optimization framework.
The predicted travel-time parameters produced by the selected model are subsequently integrated into the MILP routing formulation described in
Section 4.2, allowing the optimization model to adapt routing decisions to dynamically evolving traffic conditions [
6,
9].
4.10. Blockchain-Enabled Emissions Auditing
The governance layer was implemented using Hyperledger Fabric (v2.5) deployed in a Docker (v24.0)-based local cluster consisting of four peer nodes and one ordering service (Raft consensus). Smart contracts (chaincode) were written in Go (v1.21) and handle segment-level emissions registration, deviation logging, and validation of carbon-offset claims [
11,
12,
16,
19,
23]. Only hashed metadata (segment ID, timestamp, emission value, mode) are stored on-chain, while detailed operational data remain off-chain in a secured relational database.
Emission calculations follow ISO 14083:2023 methodology, incorporating both tank-to-wheel and well-to-tank factors using activity-based distance and load adjustments consistent with Annex A of the standard. ISO 14083:2023 (International Organization for Standardization, 2023) standardizes greenhouse gas quantification across multimodal transport chains. While academic routing models typically adopt generic emission factors [
3], ISO 14083 formalizes activity-based accounting and reporting requirements, thereby enabling regulatory alignment [
8]. Blockchain technologies have also been increasingly explored as mechanisms for improving transparency, traceability, and data integrity in supply chain management systems [
24,
25].
The rationale for using a permissioned blockchain rather than a conventional centralized database lies primarily in the multi-actor audit context of the framework. In such settings, emissions-related records may need to be shared across organizational boundaries, and a tamper-resistant shared audit trail can be preferable to a single-party-controlled repository. The blockchain layer is therefore introduced not as a claim of universal technical superiority over centralized databases, but as a governance-oriented design choice for settings where traceability, shared verification, and limited trust among participating actors are relevant.
For each activated transport segment, emissions are recorded as follows (22):
Emissions are computed in accordance with ISO 14083:2023, including tank-to-wheel and well-to-tank components. Smart contracts enforce recording of verified emissions, logging of route deviations, and validation of offset claims.
Sensitive operational data remain off-chain, while the ledger stores cryptographic hashes and minimal metadata. Governance relies on organization-scoped identities, private channels, and consensus mechanisms optimized for throughput and auditability [
11,
12,
19].
In the present framework, the value of the blockchain layer is most relevant in a multi-actor logistics setting, where no single stakeholder may be assumed to exercise neutral control over all emissions-related records. Under these conditions, a permissioned ledger can support distributed verification, role-based access control, and a shared record of emissions-relevant events across participating organizations. The intended contribution of this layer is therefore institutional and audit-related rather than direct routing improvement.
The governance architecture separates optimization and verification layers to avoid computational interference with routing decisions. The optimization engine produces operational decisions off-chain, while the blockchain layer functions as a verification and audit mechanism that records emissions-relevant events after execution. This architectural separation ensures that distributed ledger operations do not introduce latency into the prescriptive optimization loop while still enabling transparent and tamper-resistant environmental reporting.
From a governance perspective, the permissioned blockchain network operates under a consortium-based trust model in which participating logistics stakeholders act as authorized validating nodes. Access control is enforced through organization-scoped identities and membership services provided by Hyperledger Fabric, ensuring that only verified participants can submit or validate transactions.
Security and fault tolerance are achieved through the Raft consensus mechanism, which tolerates node failures and ensures ledger consistency as long as a majority of ordering nodes remain operational. Because the network is permissioned and identity-managed, the risk of common public-blockchain attacks such as Sybil attacks or malicious mining behavior is substantially reduced.
Furthermore, sensitive operational data are not stored directly on-chain but are maintained in off-chain databases, while the blockchain stores only cryptographic hashes and minimal metadata. This hybrid storage architecture preserves data confidentiality while ensuring tamper-resistant auditability of emissions-related records.
At the same time, the adoption of blockchain-based emissions auditing involves practical and institutional limitations. Effective use in real-world settings would require governance agreements among participating organizations, clear rules on data ownership and access rights, acceptance of audit procedures by relevant stakeholders, and willingness to bear onboarding and maintenance costs. Moreover, regulatory acceptance is not automatic: while blockchain-based logging can support auditability and traceability, formal acceptance of such records ultimately depends on institutional, legal, and procedural processes beyond the technical design of the framework.
4.11. Governance Layer Performance Characteristics
The permissioned blockchain architecture was evaluated under simulated operational loads corresponding to 2500 transport segments per day. Average transaction confirmation time was 420 milliseconds, with throughput of approximately 6 transactions per second. Each recorded segment required 1.4 kB of hashed metadata storage.
The governance layer increases total computational overhead by less than 3% relative to optimization runtime and does not interfere with prescriptive decision-making. Off-chain storage is used for sensitive operational details, while on-chain records store cryptographic hashes and minimal compliance metadata to ensure traceability and audit integrity.
4.12. Hybrid Algorithmic Workflow
At each decision epoch, the hybrid decision-support system executes a sequence of coordinated computational steps. First, telematics data and relevant regulatory information are ingested from operational data sources. Based on these inputs, the machine learning module generates updated predictions for time-dependent parameters such as travel times and congestion indicators. These predicted values are then used to update the parameters of the MILP optimization model.
The optimization module subsequently solves the scalarized multi-objective routing problem to obtain operationally feasible routing decisions. Following the optimization step, cooperative cost allocations among participating stakeholders are computed using the Shapley value-based allocation mechanism. Finally, emissions-related events and segment-level environmental data are recorded in the blockchain-based governance layer to ensure traceability and auditability.
For clarity, Algorithm 1 summarizes the main steps of the hybrid rolling-horizon decision-support workflow.
| Algorithm 1. Hybrid rolling-horizon decision-support workflow |
Initialize network, fleet, customer, emissions, and regulatory data. : Ingest updated operational and regulatory input data. Predict time-dependent travel times and other dynamic parameters using the machine-learning module. Update the MILP model parameters for the current planning horizon. Solve the normalized weighted multi-objective MILP formulation. Extract feasible routing and scheduling decisions. Compute stakeholder-level cooperative allocations using the Shapley-based allocation mechanism. Record emissions-related events, compliance metadata, and route-execution information in the governance layer.
|
Output: Routing plan, service schedule, cooperative allocation outcomes, and auditable emissions records. |
This closed-loop decision process integrates prescriptive optimization, predictive adaptation, cooperative coordination, and digital governance within a single simulation-based logistics decision-support workflow [
1,
2,
3,
7,
9,
11,
12,
16,
17,
18,
19,
26,
27].
5. Results
The operational performance and robustness of the proposed hybrid framework were evaluated through a structured experimental campaign based on calibrated logistics instances. The experiments assessed environmental, economic, service-level, cooperative, and audit-related performance under realistic routing, fleet, and regulatory constraints. Environmentally aware vehicle routing formulations have become a central research direction in green logistics, aiming to simultaneously reduce operational costs and environmental impacts [
28].
5.1. Experimental Setup and Scenario Configuration
The evaluation was conducted on synthetic yet industry-calibrated logistics datasets representing multinational FMCG and automotive supply chains. Instance structures and parameter distributions were derived from benchmark routing studies, European freight outlook reports, and publicly available urban freight datasets [
1,
2,
3]. Although no proprietary corporate data were used, the generated instances were designed to reflect routing topologies, heterogeneous fleet compositions, vehicle-capacity constraints, and regulatory environments consistent with ISO 14083:2023 emission accounting principles [
10]. Customer demand volumes were sampled from a lognormal distribution calibrated to European FMCG freight statistics (
,
), while delivery time-window widths followed a truncated normal distribution with a mean of 120 min and a standard deviation of 35 min. Arc distances were calculated using Euclidean metrics adjusted by a detour factor of 1.18 to approximate urban road-network conditions.
More specifically, the calibrated synthetic setting is intended to approximate medium-scale European freight distribution systems operating in urban and peri-urban environments, where heterogeneous fleets, delivery time windows, carbon-related regulation, and multi-actor coordination are practically relevant. The experimental design should therefore be interpreted as a stylized but context-informed representation of this logistics domain rather than as a generic or universally representative supply-chain setting.
The fleet composition in the base configuration consisted of 70% diesel and 30% electric vehicles, reflecting current EU urban freight adoption levels. Emission factors were computed using ISO 14083:2023-compliant tank-to-wheel and well-to-tank coefficients [
10]. The optimization framework was implemented in a discrete-time rolling-horizon environment over a 30-day planning horizon. The MILP model was solved using a commercial solver (v11.0, Gurobi Optimization, LLC, Beaverton, OR, USA) with a 1% MIP optimality gap and a 3600 s time limit per instance. Rolling-horizon re-optimization applied warm-start procedures to reduce computational variability and support solution consistency across repeated runs [
7].
The parameter choices reported above should be interpreted as context-informed scenario assumptions rather than as universally valid logistics benchmarks. The lognormal demand specification was selected because it provides a practical representation of right-skewed freight demand patterns commonly observed in distribution settings, while still allowing controlled scenario generation. The detour factor of 1.18 was used as an urban-network approximation to translate Euclidean separation into more realistic routed travel distances within the calibrated synthetic environment. Similarly, the 70% diesel and 30% electric fleet composition was adopted as an EU-informed base-case assumption intended to reflect a plausible transitional fleet structure in regulation-sensitive urban freight systems, rather than a fixed industry-wide standard. These choices were therefore made to support reproducible and context-relevant experimentation within the present study, while recognizing that alternative regions, sectors, and fleet structures may require different parameterizations.
Three configurations were evaluated: S0 (baseline cost-oriented routing without sustainability integration), S1 (multi-objective MILP combined with ML-based dynamic travel-time updates), and S2 (S1 extended with Shapley value cooperative allocation and blockchain-based emissions auditing). Each configuration was executed over 50 independent simulation runs to support statistical robustness within the experimental setting. Each run represents an independent 30-day simulation replication generated with a distinct random seed for demand, travel-time, and perturbation realizations. Rolling-horizon re-optimization was performed within each run, while warm starts were used only to initialize subsequent solves inside the same replication and did not link different runs. Therefore, the standard deviations reported in
Table 7 describe variation across independent 30-day replications. Exogenous parameters were varied within ranges designed to reflect current EU regulatory and market conditions, including fuel-price variability (
), demand shocks (
), carbon-price levels, and urban access restrictions. Fuel-price and demand fluctuations were sampled from uniform distributions within the specified intervals. The random-seed structure was controlled to support reproducibility and comparability across experimental scenarios while preserving independence between simulation replications.
In practical terms, the generated scenarios are calibrated to reflect regulation-sensitive European distribution contexts, with particular relevance to FMCG and automotive freight systems in which routing efficiency, emissions accounting, and delivery reliability interact under urban operating constraints. Although the experimental evaluation relies on industry-calibrated synthetic datasets rather than proprietary operational data, the parameter distributions and routing structures were informed by publicly available freight statistics and established vehicle-routing benchmarks. This approach supports reproducibility and controlled scenario-based experimentation while approximating important structural features of logistics operations.
To strengthen the interpretability of the calibrated synthetic setting, the parameter distributions used in the synthetic instance generator were informed by publicly available European freight statistics, urban traffic indicators, and vehicle-routing benchmark structures. The resulting datasets reproduce selected structural characteristics of logistics networks, including heterogeneous fleets, stochastic demand patterns, and time-window constraints. While the controlled experimental design supports reproducibility and systematic sensitivity analysis within the simulation framework, it should not be interpreted as external proof of operational validity. Future work will therefore focus on evaluation using proprietary industrial datasets and broader real-world implementation contexts.
5.2. External Benchmark Validation
To strengthen external validity, the proposed MILP formulation was additionally tested on standard Solomon R101 and C101 benchmark instances (100 customers) [
1,
2]. Emission factors were incorporated using distance-proportional ISO 14083 coefficients [
10]. The optimized routing cost remained within 1.8–2.4% of published best-known solutions when emissions were excluded from the objective. When emissions were activated as a second objective, cost increased by 3.1% while CO
2 intensity decreased by 21.7%.
These results confirm that the environmental extension does not structurally distort routing feasibility relative to benchmark standards. The benchmark validation focuses on structural consistency rather than direct performance dominance, as the objective structure differs from purely cost-based formulations.
5.3. Evaluation Metrics
Performance was assessed using ISO-aligned key performance indicators (KPIs) [
10]:
All KPIs are reported as mean ± standard deviation over 50 runs.
5.4. Comparative Performance Analysis
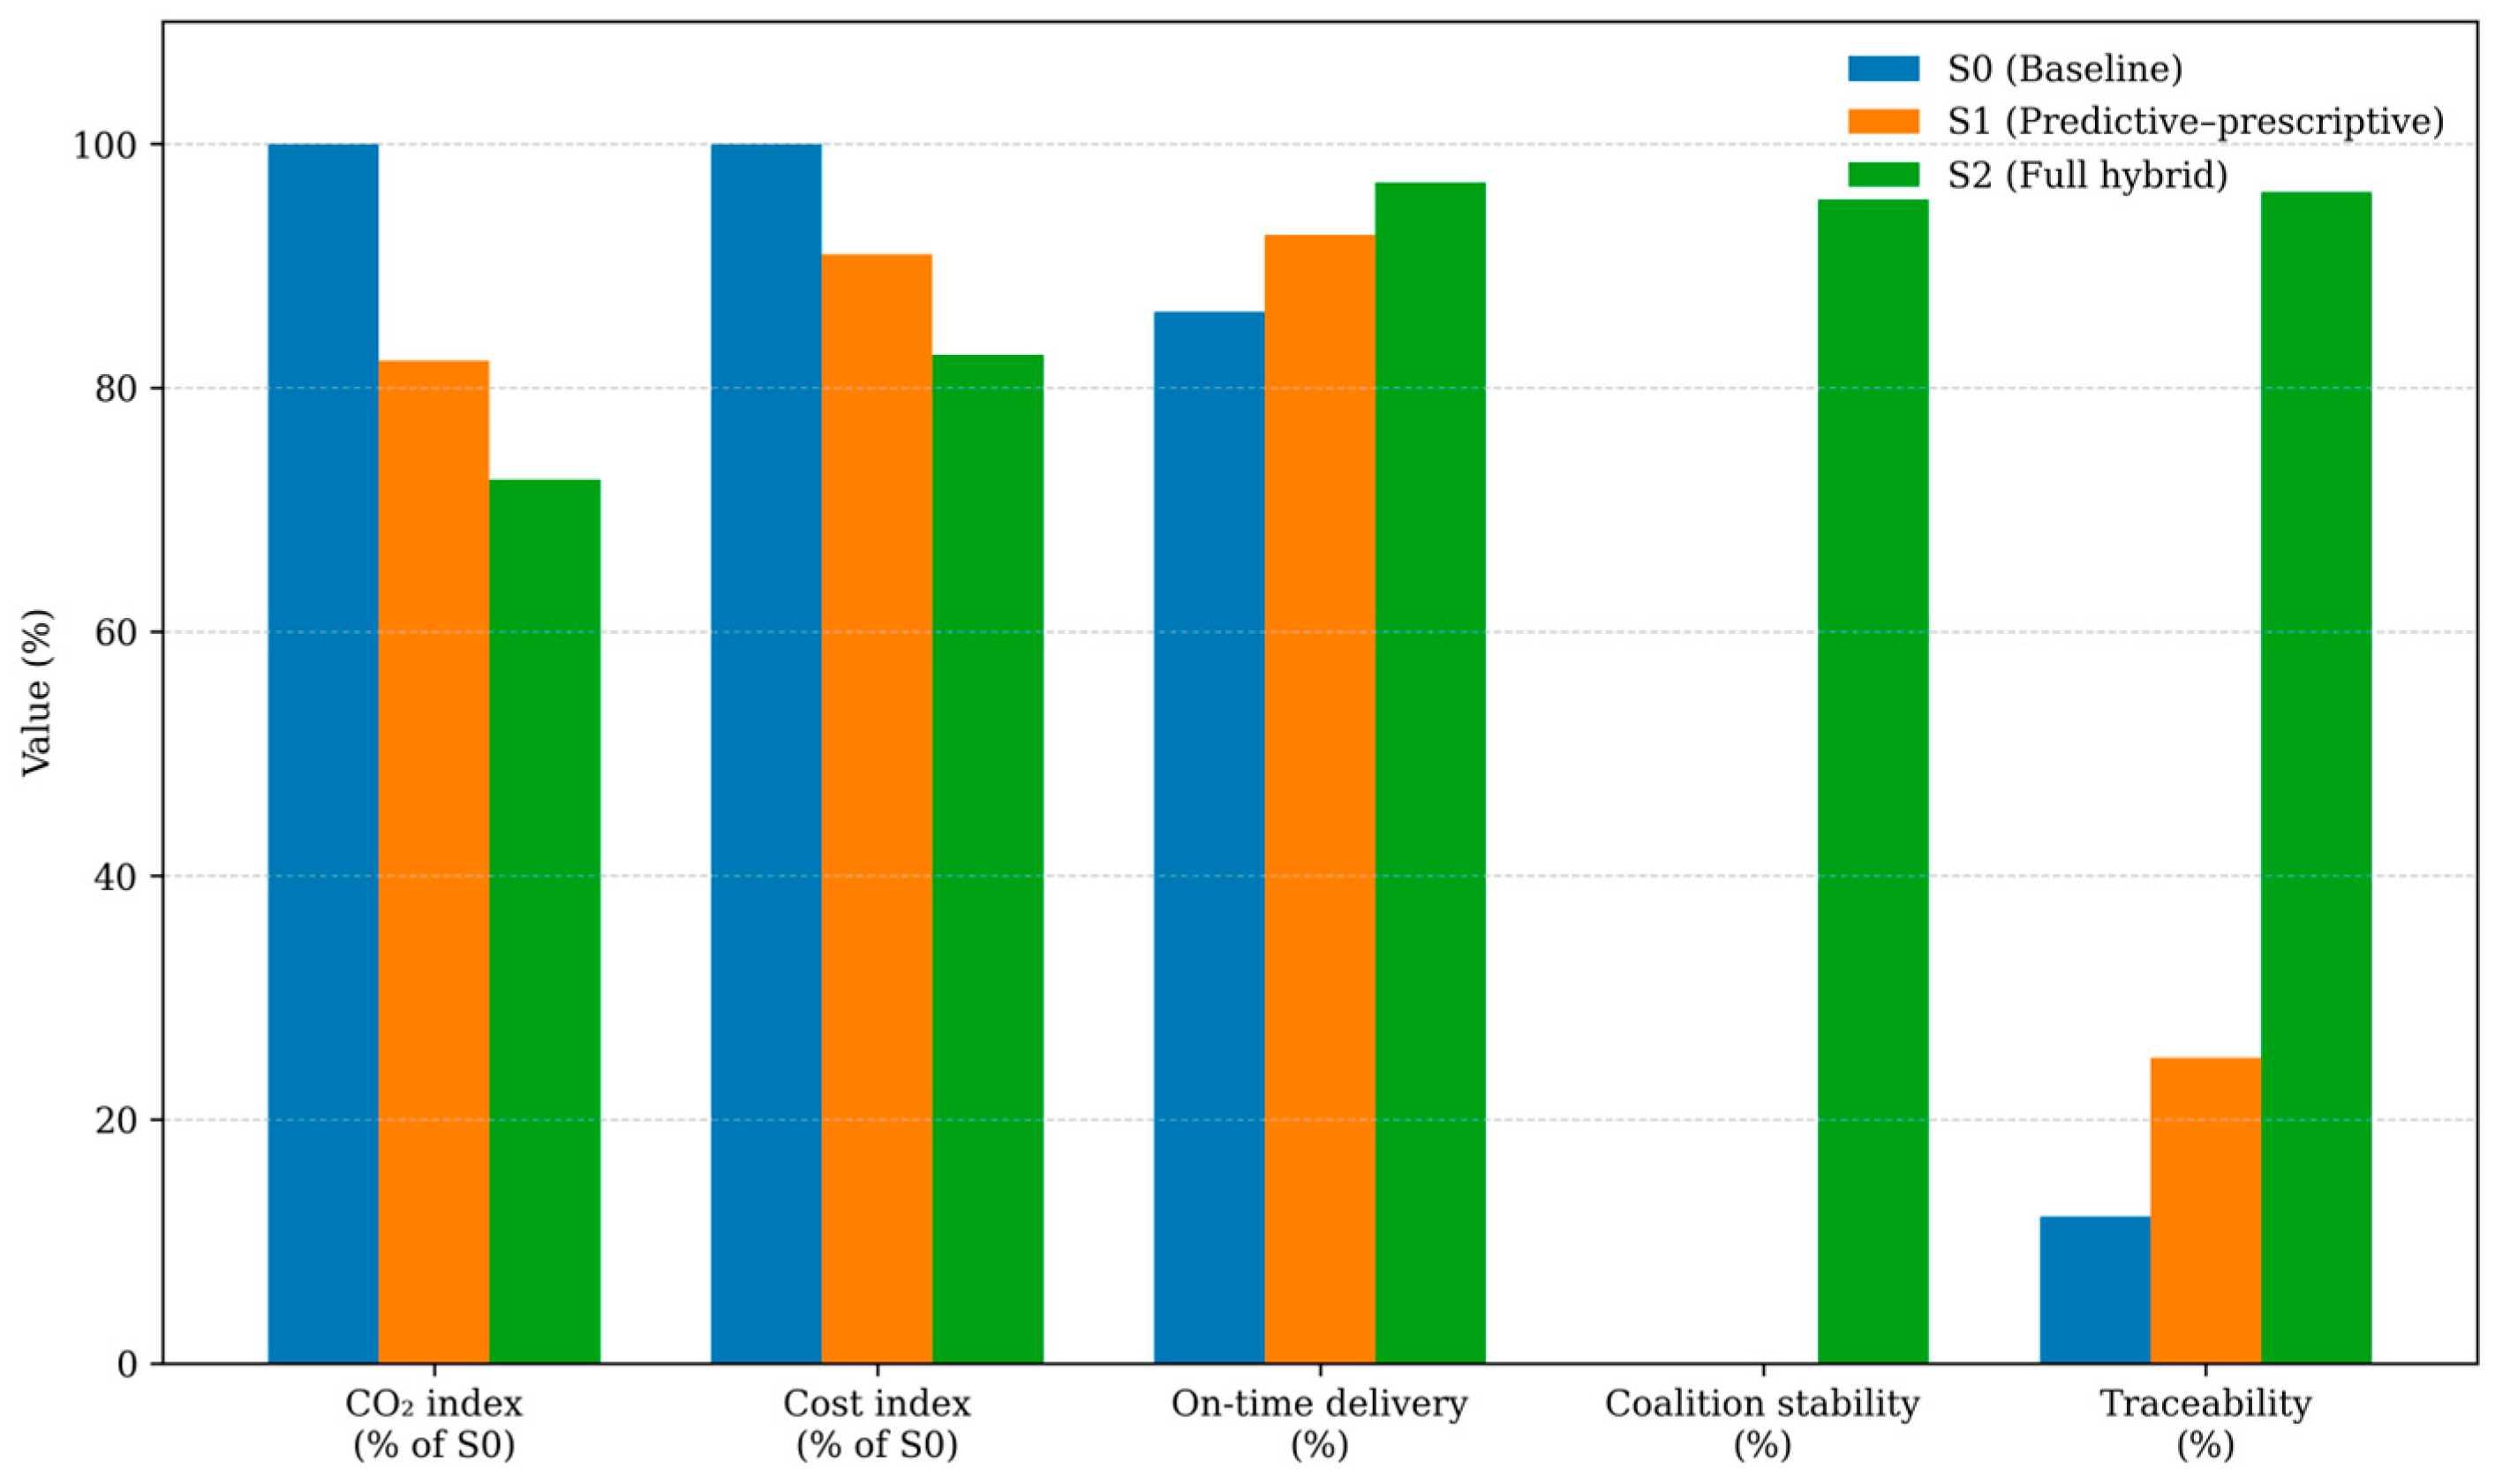
Table 7 summarizes the comparative KPI results across the three experimental configurations. The full hybrid configuration (S2) achieves the best performance across all reported indicators. Relative to the baseline configuration (S0), CO
2 emissions per route decrease by 27.6%, the operational cost index improves by 17.3%, and time-window compliance increases to 96.8%. Coalition stability and traceability are also substantially higher in S2, reflecting the added role of the cooperative allocation and audit layers [
1,
2,
3,
11,
12,
16,
17].
All KPIs are reported as mean ± standard deviation over 50 simulation runs. Pairwise Welch’s tests indicate statistically significant differences between the configurations (p < 0.05). Cohen’s d values and bootstrap confidence intervals further support the stability of the observed differences within the simulated scenario space. These results should therefore be interpreted as internal comparative evidence under the calibrated simulation design rather than as external population-level validation.
Figure 2 illustrates the grouped comparison across scenarios. The results show that S2 outperforms both S0 and S1 across the reported KPIs, indicating the potential value of combining MILP optimization, machine learning-based updating, cooperative allocation, and blockchain-supported auditing within a shared decision-support workflow [
1,
2,
3,
11,
12,
16,
17].
The performance differences suggest that the interaction between predictive travel-time updating and prescriptive optimization is the main contributor to the observed emission, cost, and service-level improvements. The cooperative allocation layer mainly supports stakeholder-level stability, while the blockchain layer primarily improves traceability and auditability rather than routing optimality. Overall, the results demonstrate the internal comparative performance of the proposed framework under controlled and context-informed simulation conditions.
5.5. Robustness and Sensitivity Analysis
To assess robustness within the simulation environment, the model was evaluated under controlled exogenous perturbations designed to reflect economic and regulatory variability in a scenario-based manner. Three classes of shocks were considered (
Table 8):
Fuel-price fluctuations: ±30% relative to nominal levels.
Demand variability: ±20% across customer nodes.
Policy shifts: modifications in carbon-price levels and low-emission zone access rules.
Table 8.
Summary of robustness and sensitivity results across perturbation scenarios.
Table 8.
Summary of robustness and sensitivity results across perturbation scenarios.
| Perturbation Type | Range/Setting | Main Affected Dimensions | Summary Result for S2 | Interpretation |
|---|
| Fuel-price fluctuation | ±30% relative to nominal level | Operational cost, routing efficiency, emissions trade-off | Average KPI deviation remained below 5% relative to the nominal case | The integrated framework remains economically stable under fuel-price volatility |
| Demand variability | ±20% across customer nodes | Time-window compliance, route structure, capacity utilization | Average KPI deviation remained below 5% relative to the nominal case | The rolling-horizon predictive–prescriptive structure maintains service feasibility under fluctuating demand |
| Policy shifts | Changes in carbon-price level and low-emission-zone access rules | Fleet utilization, emissions performance, routing feasibility | Average KPI deviation remained below 5% relative to the nominal case | The framework remains robust under regulatory and environmental policy perturbations |
| Carbon-price sweep | 0–200 EUR/tCO2 | Cost–emission trade-off, fleet composition | Structural transition observed around 85 EUR/tCO2; electric vehicle use increased and emissions declined non-linearly | The model is responsive to policy intensity and captures meaningful decarbonization thresholds |
Across these perturbations, the full hybrid configuration (S2) maintained average KPI deviations below 5% relative to the nominal case. In contrast, configurations lacking predictive updates exhibited larger performance degradation under the tested variability settings, particularly in time-window compliance and emissions efficiency.
Across fuel-price, demand, and policy perturbations, S2 maintained average KPI deviations below 5% relative to the nominal case. This indicates that the integrated predictive–prescriptive structure remains stable under the tested scenario variations. In the carbon-price sweep, a structural transition was observed around 85 EUR/tCO
2, beyond which electric vehicle use increased and emissions declined non-linearly. This simulated threshold falls within the broad range of carbon-price levels recently observed or discussed in European carbon-pricing contexts, including EU ETS-related market levels; however, it should still be interpreted as scenario-specific evidence rather than as a transferable policy benchmark. Overall, this robustness is internal to the calibrated simulation design and should not be generalized without real-world validation [
11,
12,
16].
5.6. Ablation Analysis and Component Decomposition
To examine the relative contribution of each methodological layer within the full hybrid configuration (S2), an ablation study was conducted. In this procedure, individual components—namely the machine learning (ML) prediction layer, the cooperative allocation mechanism, and the blockchain-based auditing module—were sequentially removed while preserving the remaining system architecture. This approach supports an interpretable comparison of performance changes associated with the inclusion or removal of individual components [
1,
2,
3,
9,
11,
12,
16,
17,
18].
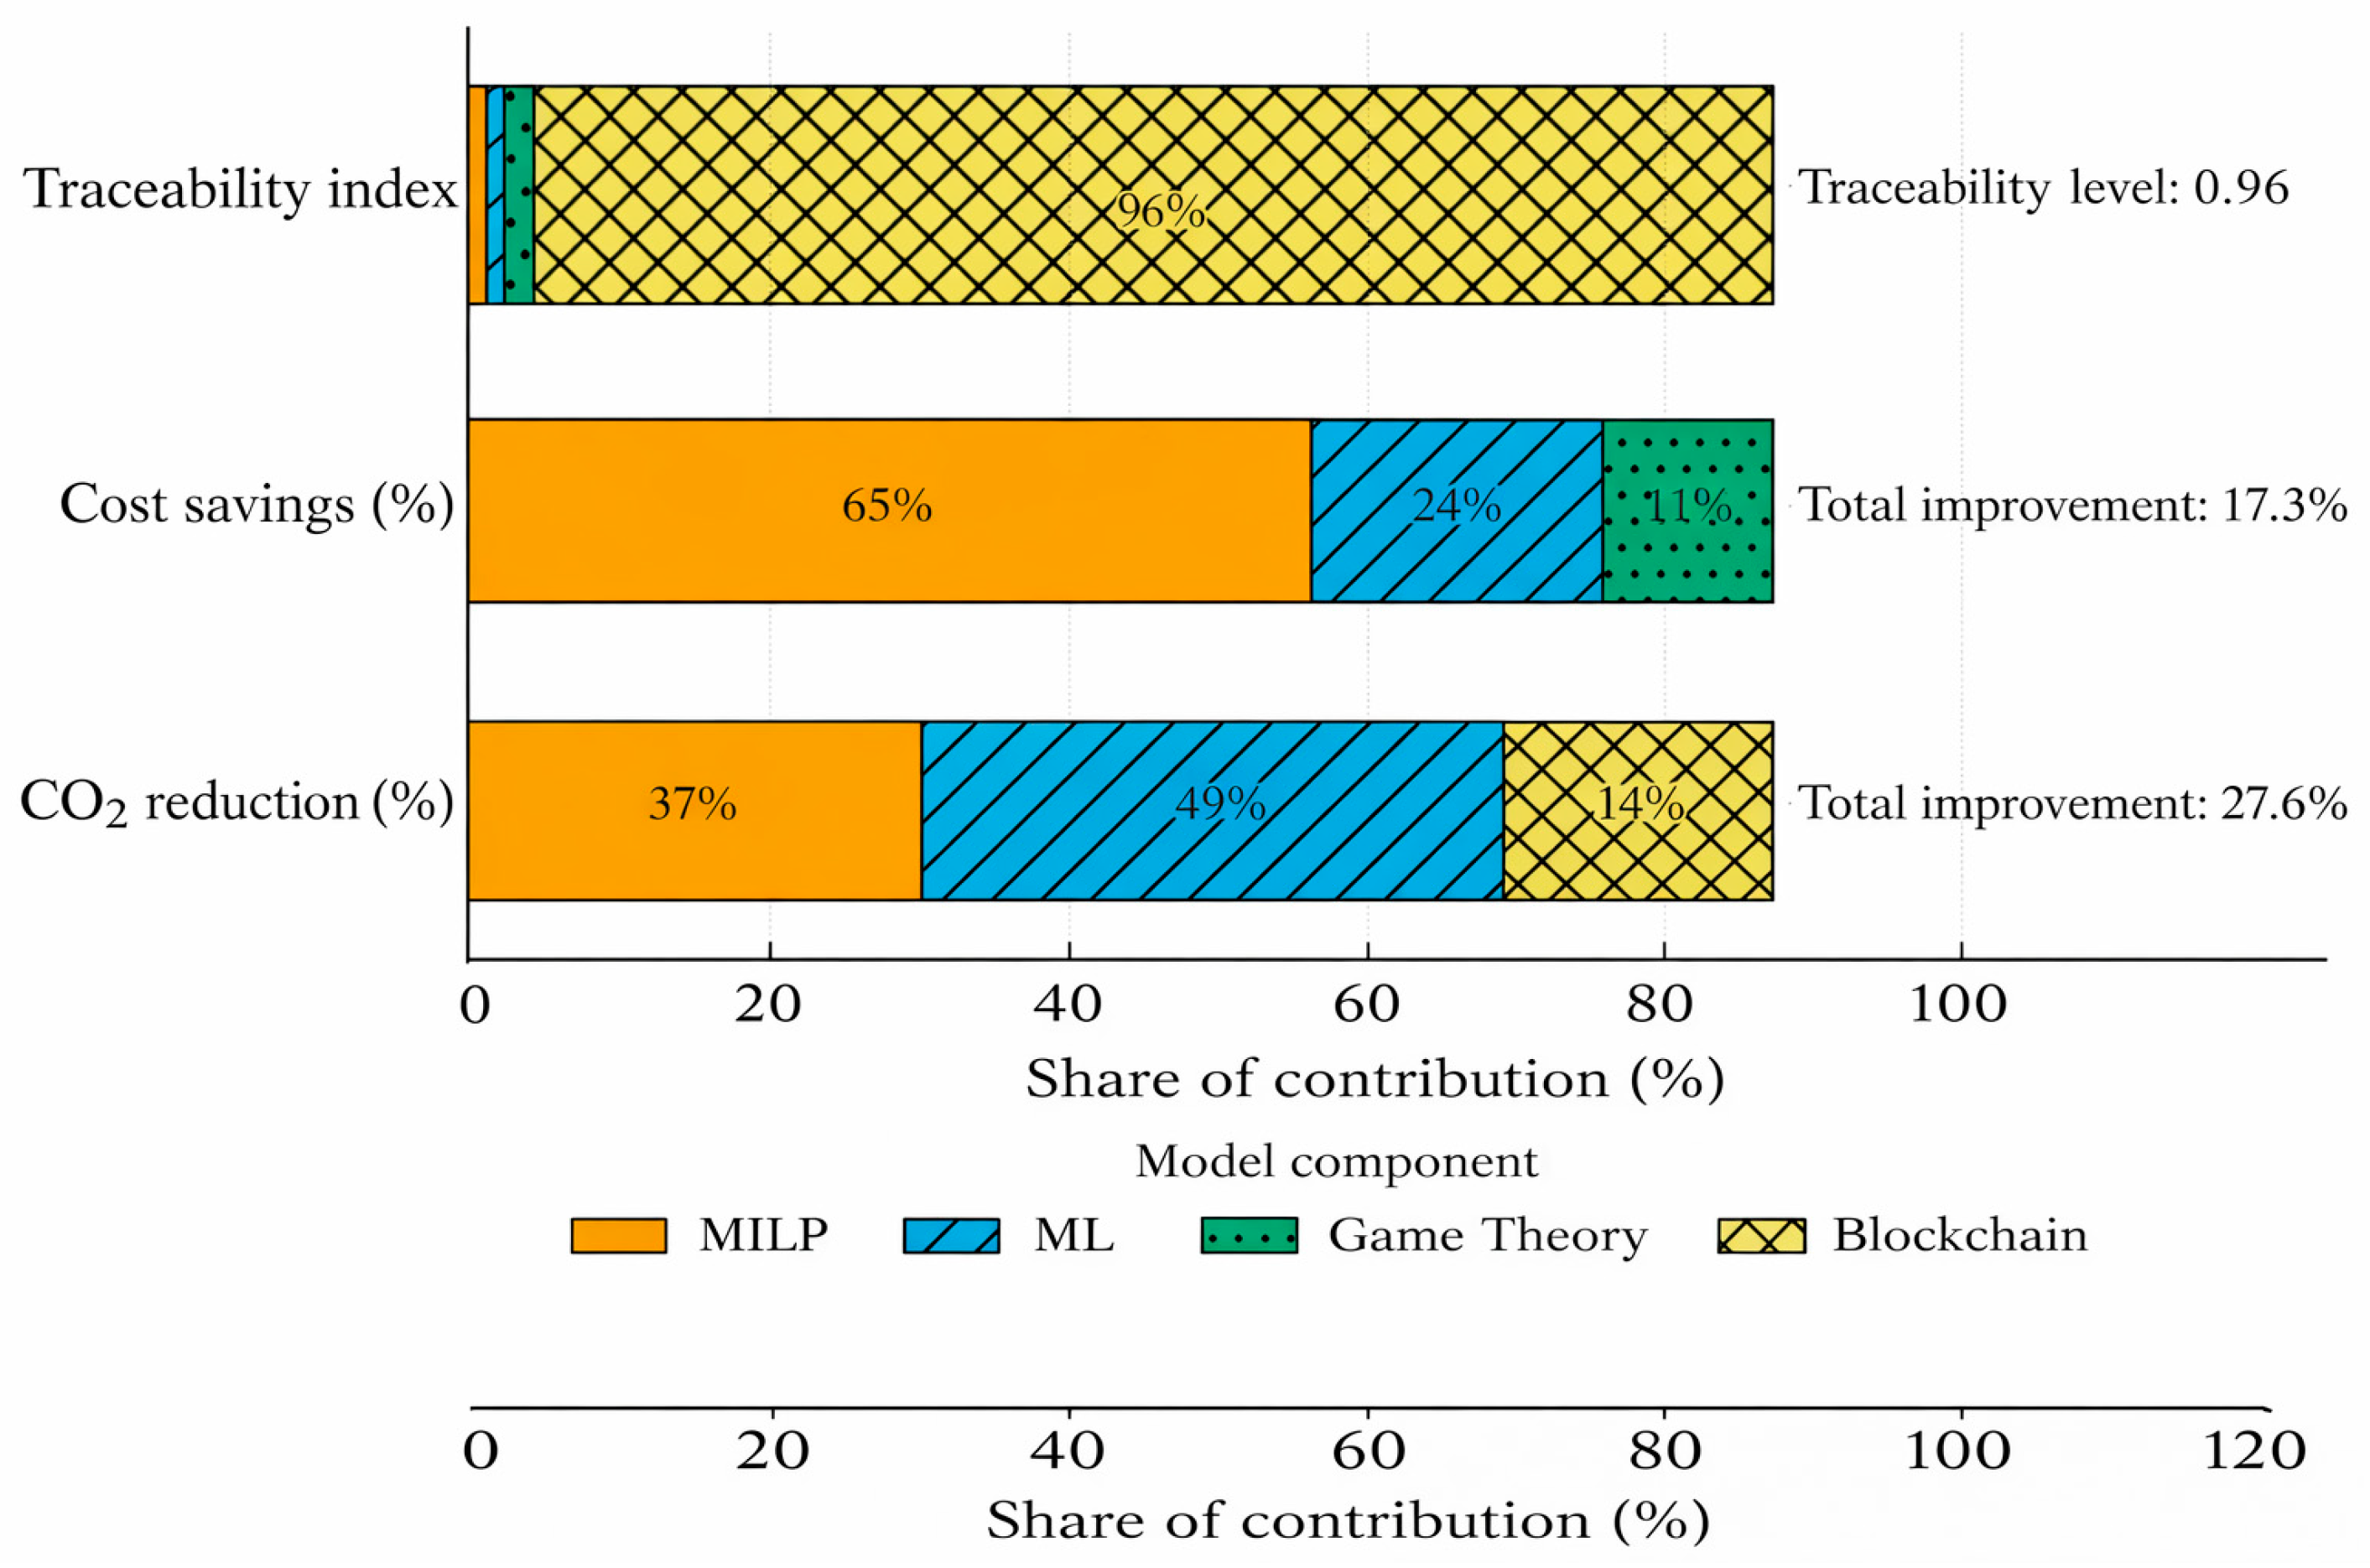
Figure 3 presents an indicative decomposition of KPI improvements relative to the baseline configuration (S0). The reported ablation percentages represent indicative shares of the total observed improvement relative to S0 and should not be interpreted as independent causal effect sizes. The results suggest that emission and cost improvements are mainly associated with the interaction between MILP optimization and ML-based travel-time updating. The MILP layer contributes primarily to structural routing efficiency, while the ML layer improves adaptability under time-dependent operating conditions [
1,
2,
3,
9,
18].
A separate direct emission-reduction percentage is not reported for cooperative allocation because this layer is applied after optimization and does not directly modify route choices in the present architecture. Its contribution is therefore interpreted as indirect, through stakeholder-level coordination logic. The cooperative allocation layer mainly supports stakeholder-level distribution logic, whereas the blockchain-enabled audit layer contributes primarily to traceability and emissions verification [
11,
12,
16,
17]. In particular, traceability improvements are largely attributable to the blockchain component, while this layer does not directly improve routing optimality.
Overall, the ablation analysis indicates that the four methodological components perform complementary rather than interchangeable functions. The decomposition results should therefore be interpreted as indicative evidence within the simulation design, not as exact causal attribution across components [
1,
2,
3,
9,
11,
12,
16,
17].
6. Discussion
6.1. Implications for Theory
The findings contribute to green logistics decision-support theory by framing sustainability-oriented logistics planning as more than a routing optimization problem. The results suggest that operational efficiency, adaptive responsiveness, stakeholder coordination, and emissions auditability can be organized as complementary layers within a shared simulation-based architecture. In this sense, the study extends prior work by integrating multi-objective routing, predictive updating, cooperative allocation, and auditable emissions governance in one modular workflow.
The contribution is primarily integrative rather than method-specific. The study does not propose a fundamentally new standalone MILP formulation, machine learning algorithm, allocation rule, or blockchain mechanism. Instead, it clarifies how these components can be linked in a decision-support structure in which MILP provides the prescriptive core, ML-based updating improves time-dependent inputs, cooperative allocation supports multi-actor coordination, and blockchain-based logging strengthens traceability and auditability.
Compared with prior integrative approaches that typically combine optimization with simulation, prediction, or multi-actor coordination in pairs, the present framework connects four functionally distinct layers in sequence: predictive updating, multi-objective MILP routing, post-optimization Shapley-based allocation, and ISO 14083:2023-aligned ledger-supported emissions logging. The novelty therefore lies in the workflow-level integration of these layers rather than in the individual methods themselves.
Within the calibrated synthetic simulation setting, the results indicate that the main operational gains are associated with the interaction between predictive updating and prescriptive optimization, while the cooperative and governance layers mainly extend coordination and audit functions.
These theoretical implications should be interpreted within the calibrated synthetic simulation setting used in this study and should not be generalized to field-level logistics operations without further empirical validation.
6.2. Implications for Practice and Policy
Within the tested calibrated scenario setting, the framework offers practical implications for logistics managers and policymakers. The MILP–ML core may support operational improvements under dynamic conditions by combining optimization with rolling-horizon parameter updates [
1,
2,
3,
9,
18]. This can be relevant for firms operating under service-level, cost, and emissions constraints, although the evidence remains computational and scenario-based.
The cooperative allocation layer may be useful in multi-actor logistics networks where shared investments, electrification, intermodal solutions, or joint infrastructure require transparent distribution of modeled benefits. The Shapley-based mechanism is therefore interpreted as a coordination tool under stated assumptions, not as behavioral evidence of stakeholder acceptance [
17].
The blockchain-based audit layer may support ISO 14083:2023-aligned emissions reporting by linking operational records with traceable and tamper-resistant emissions documentation [
10,
11,
12,
16]. This function is especially relevant under ESG, carbon-reporting, and low-emission policy requirements, although formal regulatory acceptance would depend on institutional and legal conditions beyond the scope of this study [
11,
12,
16,
19,
23].
From an implementation perspective, the modular structure allows gradual adoption. Firms may first implement the MILP–ML core to improve routing and responsiveness, and later add cooperative allocation and audit layers as organizational readiness, data availability, and governance capacity mature. However, practical deployment would require addressing data ownership, stakeholder trust, integration costs, legal responsibilities, and differences in digital maturity across logistics actors.
From a policy perspective, the results indicate potential alignment with carbon-pricing and low-emission policy mechanisms under the modeled assumptions, but they should not be interpreted as empirical evidence of policy effectiveness in real logistics systems.
6.3. Limitations of the Study and Future Research Directions
Several limitations should be acknowledged. First, the evaluation relies on industry-calibrated synthetic datasets rather than proprietary operational data. Although the scenarios approximate medium-scale European urban and peri-urban freight distribution settings, the results should be interpreted as internal computational evidence rather than external proof of real-world operational performance.
Second, the analysis is limited to medium-scale instances under the tested solver settings. While the results indicate tractability in this range, larger industrial applications would require further testing, decomposition-based extensions, or hybrid metaheuristic approaches.
Third, the machine learning layer is evaluated as a simulation-based proof of concept using synthetically generated historical data. Future studies should test stronger forecasting benchmarks, real telematics data, and broader predictive-model comparisons.
Fourth, the cooperative allocation layer is assessed mathematically under modeled assumptions, while the blockchain governance layer is evaluated technically rather than through field-level institutional adoption. Future research should therefore examine stakeholder acceptance, governance design, legal feasibility, and implementation barriers in real multi-actor logistics environments.
Finally, the proposed framework requires empirical validation before deployment-level conclusions can be drawn. Future work should test the architecture using proprietary logistics datasets, larger and more heterogeneous transport networks, and real-world implementation cases.