Article

Prebiotic Properties of Non-Fructosylated α-Galactooligosaccharides from PEA (Pisum sativum L.) Using Infant Fecal Slurries

by
María del Carmen Marín-Manzano
1,
Oswaldo Hernandez-Hernandez
2,
Marina Diez-Municio
2,
Cristina Delgado-Andrade
1,
Francisco Javier Moreno
2 and
Alfonso Clemente
1,*
1
Estación Experimental del Zaidín (CSIC), Consejo Superior de Investigaciones Científicas (CSIC), 18008 Granada, Spain
2
Institute of Food Science Research (CIAL, CSIC-UAM), 28049 Madrid, Spain
*
Author to whom correspondence should be addressed.
Foods 2020, 9(7), 921; https://doi.org/10.3390/foods9070921
Submission received: 26 April 2020 / Revised: 5 June 2020 / Accepted: 8 June 2020 / Published: 13 July 2020

Abstract

:
The interest for naturally-occurring oligosaccharides from plant origin having prebiotic properties is growing, with special focus being paid to supplemented products for infants. Currently, non-fructosylated α-galactooligosaccharides (α-GOS) from peas have peaked interest as a result of their prebiotic activity in adults and their mitigated side-effects on gas production from colonic bacterial fermentation. In this study, commercially available non-fructosylated α-GOS from peas and β-galactooligosaccharides (β-GOS) derived from lactose were fermented using fecal slurries from children aged 11 to 24 months old during 6 and 24 h. The modulatory effect of both GOS on different bacterial groups and bifidobacteria species was assessed; non-fructosylated α-GOS consumption was monitored throughout the fermentation process and the amounts of lactic acid and short-chain fatty acids (SCFA) generated were analyzed. Non-fructosylated α-GOS, composed mainly of manninotriose and verbascotetraose and small amounts of melibiose, were fully metabolized and presented remarkable bifidogenic activity, similar to that obtained with β-GOS. Furthermore, non-fructosylated α-GOS selectively caused an increase on the population of Bifidobacterium longum subsp. longum and Bifidobacterium catenulatum/pseudo-catenulatum. In conclusion, non-fructosylated α-GOS could be used as potential ingredient in infant formula supplemented with prebiotic oligosaccharides.

1. Introduction

The colonisation of the gastrointestinal tract (GIT) by microorganisms is an essential process in our life cycle and starts during the gestation period [1,2]. Evidence shows that the GIT colonisation rapidly increases after birth by aerobic microorganisms that decrease the concentration of oxygen. This lowering of redox potentially allows the colonisation of anaerobic bacteria [3]. The continued succession of microorganisms during the first years of life has an important effect on the long-term maturity of the GIT microbiota, which is affected by diet, mode of delivery, antibiotic treatments, genetics, intestinal mucin glycosylation and other factors [4].
Non-digestible dietary ingredients are capable of modulating composition and metabolic function of gut microbiota. In this context, the prebiotic concept was recently defined by the International Scientific Association for Probiotics and Prebiotics (ISAPP) as “a substrate that is selectively utilized by host microorganisms conferring a health benefit” [5]. It is now recognized that the prebiotic effect extends beyond bifidobacteria and lactobacilli and includes other genera such as Akkermansia and Faecalibacterium. These bacterial groups, among others, are involved in the production of lactic acid and short-chain fatty acids (SCFA), which perform crucial physiological functions as metabolic regulators and immunomodulators, decreasing the growth of potential intestinal pathogens. The SCFA are responsible for the decrease of pH in the intestinal lumen, an increase of calcium absorption and shortening of gastrointestinal transit time. Besides, SCFA play an important role in cross-feeding processes and are major sources of energy for colonic epithelial cells and other cell types located in peripheral tissues [4,6].
The human-milk oligosaccharides (HMOs) are one of the most important dietary ingredients modulating the infant microbiome. Only certain bifidobacterial species, such as Bifidobacterium longum subsp. infantis, are able to utilize HMOs as metabolic substrates [7] with specific preferences depending on the Bifidobacterium strain and the HMOs structure [8,9]. Due to different clinical and social conditions, human milk is not a realistic choice for some infants and, in such cases, infant formulas are the most suitable alternative. However, access to HMOs for infant formula is extremely limited [10]. As a result, different oligosaccharides have been utilised to mimic the function of HMOs, such as fructooligosaccharides (FOS) and β-galactooligosaccharides (β-GOS). Other natural sources have also been utilised to obtain carbohydrates for infant formulas with well reported prebiotic activities such as inulin [11], pectin-oligomers [6], raffinose [12] and resistant starch [13]. For infant formulas, research has mainly focused on inulin, fructooligosaccharides (FOS) and β-galactooligosaccharides (GOS); indeed, there is still a wide range of oligosaccharides that could mimic, at least to some extent, the functional properties of HMOs.
Plant-based GOS, with α-galactosidic linkages instead of β-linkages, are water soluble carbohydrates and are particularly abundant in legume seeds as soybean, chickpea, lentil, faba bean and pea. They are commonly named raffinose family oligosaccharides (RFOS) and show a terminal sucrose unit linked by the glucose monomer to galactoses via α-(1→6) linkages. Like β-GOS, α-GOS are not hydrolysed in the upper gastrointestinal tract due to the absence of the enzyme α-galactosidase expressed by somatic cells in the mammalian GIT [14]. As a result, they reach the large intestine where are fermented by gut microbiota and can exert prebiotic properties [15]. However, it is well-known that RFOS cause discomfort, bloating and flatulence to consumers due to the presence of the ending fructose monomer [16,17].
Non-fructosylated α-GOS include melibiose (CAS 585-99-9), manninotriose (CAS 13382-86-0) and verbascotetraose (CAS 1111-08-6), which are essentially raffinose, stachyose and verbascose without the ending fructose units. Non-fructosylated α-GOS from peas is produced by the activity of β-fructosidases which are able to split sucrose from the α-GOS chain into glucose and fructose, being commercially available as AlphaGOS®. This particular α-GOS mixture has claimed to reduce the post-prandial glycaemic responses, being recently approved by the European Food Safety Agency (EFSA) [18], and exert prebiotic activity in adult faecal inoculum [19]. Available scientific data suggest that the administration of prebiotic oligosaccharides to healthy infants does not raise safety concerns with regards to adverse effects. In this sense, non-fructosylated α-GOS has been proven safe in infant formula in a concentration up to 8 mg/mL after preclinical evaluation in neonatal piglets [20].
Despite the various scientific evidence available regarding non-fructosylated α-GOS derived from peas, no reports have been published so far regarding the effect of these plant oligosaccharides on infant microbiota either in vitro or in vivo. Taking into account the published data reporting the bifidogenic properties of non-fructosylated α-GOS in adults, and its safety in infant formula, we hypothesized that a similar effect could be also found in infants, despite the differences between GIT microbiota in adults and in infants. Such increase in the number of bifidobacteria might be considered a major shift in the gut microbiota towards a potentially healthier composition. Important functions have been attributed to bifidobacteria including a protective role against pathogens, promote gut epithelium integrity and modulate the host immune system. Therefore, the main aim of the study was to evaluate the effect of non-fructosylated α-GOS in the microbiota present in infant faecal samples with particular attention paid to their bifidogenic properties.

2. Material and Methods

2.1. Chemicals

MTBSTFA (N-terbutil-dimetil-silil-N-metil-trifluoroacetamid) was purchased by Fluka Chemie AG (Buchs, Switzerland). Short chain fatty acids (SCFA) and organic acids were obtained from Sigma-Aldrich. All other chemicals were of analytical grade.

2.2. Non-Fructosylated α-GOS and β-Galactooligosacharides (GOS) Characterization

Non-fructosylated α-galactooligosaccharides (α-GOS, commercial brand AlphaGOS®) derived from pea seeds were kindly provided by Olygose (Venette, France). The chemical composition of α-GOS is detailed in Table 1 and shows as major components mannitriose and verbascotetraose with degree of polymerization of three (DP3) and four (DP4), respectively.
An industrially available galacto-oligosaccharide mixture derived from lactose (β-GOS) was used in this study for comparative purposes as prebiotic reference. This mixture was initially composed by galactose (1%), glucose (21%), DP2 (37%), DP3 (22%), DP4 (11%), >DP4 (8%). Gel filtration chromatography was carried out for the removal of mono- and disaccharides due to the presence of high levels of digestible carbohydrates including lactose; the DP of collected fractions was determined by electrospray ionization mass spectrometry (ESI-MS). The purified β-GOS mixture consisted in a complex mixture of oligosaccharides from DP3 to DP6 and fully free of mono- and disaccharides. The trisaccharide fraction of β-GOS (35.2% of total carbohydrates) contained mainly 4′-galactosyl-lactose (15.8%), 6′-galactosyl-lactose (5.3%), as well as other minor galactobioses linked to the reducing glucose unit by β-(1→2) and β-(1→6) glycosidic linkages (Supplementary Materials Table S1) [21].

2.3. Infant Faecal Samples

Parents/guardians of children of the Los Angeles Nursery (Granada, Spain) were invited to attend a meeting where the nature of the study was explained and those who agreed to participate signed the informed consent. Parents/guardians were given a small survey to learn about the overall health and eating habits of donors. The participants fed on solid food and none of them had taken probiotics, fermented foods, antibiotics or received medical treatment that could affect the intestinal microbiota at least a month before the stool samples were collected. The study protocol was conducted in accordance with the ethical recommendations of the Declaration of Helsinki.
Stool samples were collected from eight children in the age range between 11–24 months. They were taken by our laboratory staff after deposition in nappies, avoiding the edges and the area in contact with the nappy and also avoiding urine that was absorbed in the cellulose. Immediately after deposition, fecal samples were housed in closed jars containing Anaerocult A tablets (Anaerocult®, Darmstad, Germany) in order to maintain anaerobic conditions during the transport to the laboratory. The fecal samples (~5 g), within 2 h after collection, were homogenized in a stomacher by dilution 1/10 (w/v) with anaerobic 0.1 M sodium phosphate buffer, pH 6.8, by using sterile plastic filter bags, and filtrated through Miracloth (Calbiochem, Darmstad, Germany) to remove solid residues.

2.4. In Vitro Faecal Fermentation

Faecal homogenates were transferred into sterile Hungate tubes containing a specific basal medium for cultivation of infant faeces (BMIF) by dilution 1/10 (v/v) [22] and were stabilized overnight under anaerobic conditions at 37 °C. After that, 0.3% (w/v) of specific substrate (non-fructosylated α-GOS and β-GOS) was added to stabilized faecal mixtures. Fermentation experiment for the fecal sample of each subject was carried out once for each GOS-type. An additional tube was kept without inoculum and without GOS as a negative control and the positive control contained inoculum but not GOS. In addition, the medium was supplemented with 1/1000 (w:v) of resazurine to control the strict anaerobiosis conditions. Fermentations were carried out in anaerobic chambers at 37 °C and samples were taken at time 0, 6 and 24 h. One mL of culture was centrifuged (12,000× g for 15 min). The pellet was frozen at −80 °C and freeze-dried for the study of bacterial populations; the supernatant was used for direct determination of pH at the different collection times (Crison Instruments S.A., Barcelona, Spain) and in order to quantify lactic acid and SCFA.

2.5. DNA Extraction

DNA was extracted from pellets of fecal batch cultures using FavorPrep™ Stool DNA Isolation Mini Kit (Favorgene Biotech Corp, Shuttleworthstraße, Vienna, Austria). A NanoDrop ND-100 spectrophotometer (NanoDrop Technologies, Wilmington, DE, USA) was used for DNA quantification; purified DNA samples were stored at −80 °C.

2.6. Microbial Faecal Populations Determined by Quantitative PCR (qPCR) Analysis

Quantitative PCR was used to evaluate the effect of non fructosylated α-GOS and β-GOS on microbial composition in fecal homogenates after 6 and 24 h of in vitro fermentation in comparison with the control group (absence of oligosaccharides). Different microbial groups including total bacteria, Bacteroides, lactobacilli, bifidobacteria, Eubacterium rectale/Clostridium coccoides, Clostridium leptum, enterobacteria and Faecalibacterium prausnitzii were distinguished and quantified using qPCR. The 16S rRNA gene-targeted group-specific primers used in this study are listed in Supplementary Materials Table S2. qPCR conditions used in this study were as previously reported [23]. For quantitative analysis of the different bifidobacteria species (B. adolescentis, B. bifidum, B. catenulatum/pseudo-catenulatum, B. breve, B. longum subsp. infantis and B. longum subsp. longum), the PCR conditions were one cycle of 94 °C for 5 min, then 40 cycles of 94 °C for 20 s, 55 °C for 20 s, and 72 °C for 1 min. The species-specific primer pair for bifidobacteria is listed in Supplementary Materials Table S3. In the case of Eubacterium rectale/Clostridium coccoides and Clostridium leptum groups, PCR conditions were an initial denaturation step at 94 °C for 5 min followed by 40 cycles at 94 °C for 20 s, 50 °C for 20 s and 72 °C for 1 min for primer annealing and product elongation [23]. The fluorescent product was detected in the last step of each cycle. Following amplification, melting temperature analysis of PCR products was performed to determine the specificity of the PCR. The melting curves were obtained by slow heating at 0.5 °C increments from 55 to 95 °C, with continuous fluorescence collection. A plasmid standard containing the target region was generated for each specific primer set using DNA extracted from fecal homogenates. The amplified products were cloned using the TOPO TA cloning kit for Sequencing (Invitrogen, Barcelona, Spain) and transformed into E. coli One Shot Top 10 cells (Invitrogen). Sequences were submitted to the ribosomal RNA database to confirm the specificity of the primers. For quantification of target DNA copy number, standard curves were generated using serial 10-fold dilutions of the extracted products by using at least six non-zero standard concentrations per assay. The bacterial concentration in each sample was measured as log10 copy number by the interpolation of the Ct values obtained by the fecal homogenates samples and the standard calibration curves. Each plate included triplicate reactions per DNA sample and the appropriate set of standards.

2.7. Short-Chain Fatty Acids (SCFA) and Lactic Acid Analysis

SCFA and lactic acid were analyzed as described previously by Tabasco et al. [24], with some modifications. For quantitative analysis, 55 μL of a 100 mM 2-ethylbutyric acid in distilled water was added as internal standard to 550 μL of bacterial supernatant after in vitro fermentation. SCFA and organic acids were extracted by the addition of 275 μL concentrated HCl and 1 mL diethyl ether followed by vortexing 1 min. Then, samples were centrifuged at 3000× g for 10 min and 50 μL of the ether layer was transferred to a GC-microvial to minimize ether evaporation, adding 10 μL of the derivatization agent MTBSTFA. Hermetically stoppered microvials were heated at 80 °C for 20 min, afterwards the reaction mixture was kept for 24 or 48 h at room temperature to ensure total derivatization. An external calibration curve was built using a standard solution mixture made from pure compounds (formate 10 mM, acetate 60 mM, propionate 20 mM, butyrate 20 mM, iso-butyrate 5 mM, valerate 5 mM, iso-valerate 5 mM, lactate 17 mM, succinate 17 mM) and derivatized as described for samples. A gas chromatograph Thermo Scientific (Trace GC Ultra, Rodena, Italy) equipment was used, with a mass detector ion trap (Thermo Scientific ITQ 900, Rodena, Italy) and with an automatic sampling system (Triplus). The chromatograph was equipped with a Thermo Scientific column (TR-5MS 30 m × 0.25 mm × 0.25 μm) and a 2.5 m × 1 μm 0.32 ID pre-column (Teknokroma, Guard Column TR30005, San Cugat del Vallés, Spain). The samples were introduced via split (ratio 50:1) injection with the port heated to 275 °C. Helium was used as the carrier gas at a flow rate of 1.0 mL/min. The oven temperature was initially held at 63 °C for 3 min, increased to 190 °C with a 20 °C per min rate, held at 190 °C for 6 min, then raised to 230 °C with a 40 °C per min rate, where it was held for 1 min. The mass spectrometer interface temperature was set to 250 °C. For monitoring and confirmation analysis, the electronic impact (EI, 70 eV) mode was used. For the MS/MS experiments, the adequate ion precursor and a collision energy was selected for each compound, in order to perform the quantification. Identification and quantification of SCFA and organic acids was based on the use of the relative response factors calculated for the target compounds in the standard solutions at different concentrations against the IS. Measurements were conducted at least twice.

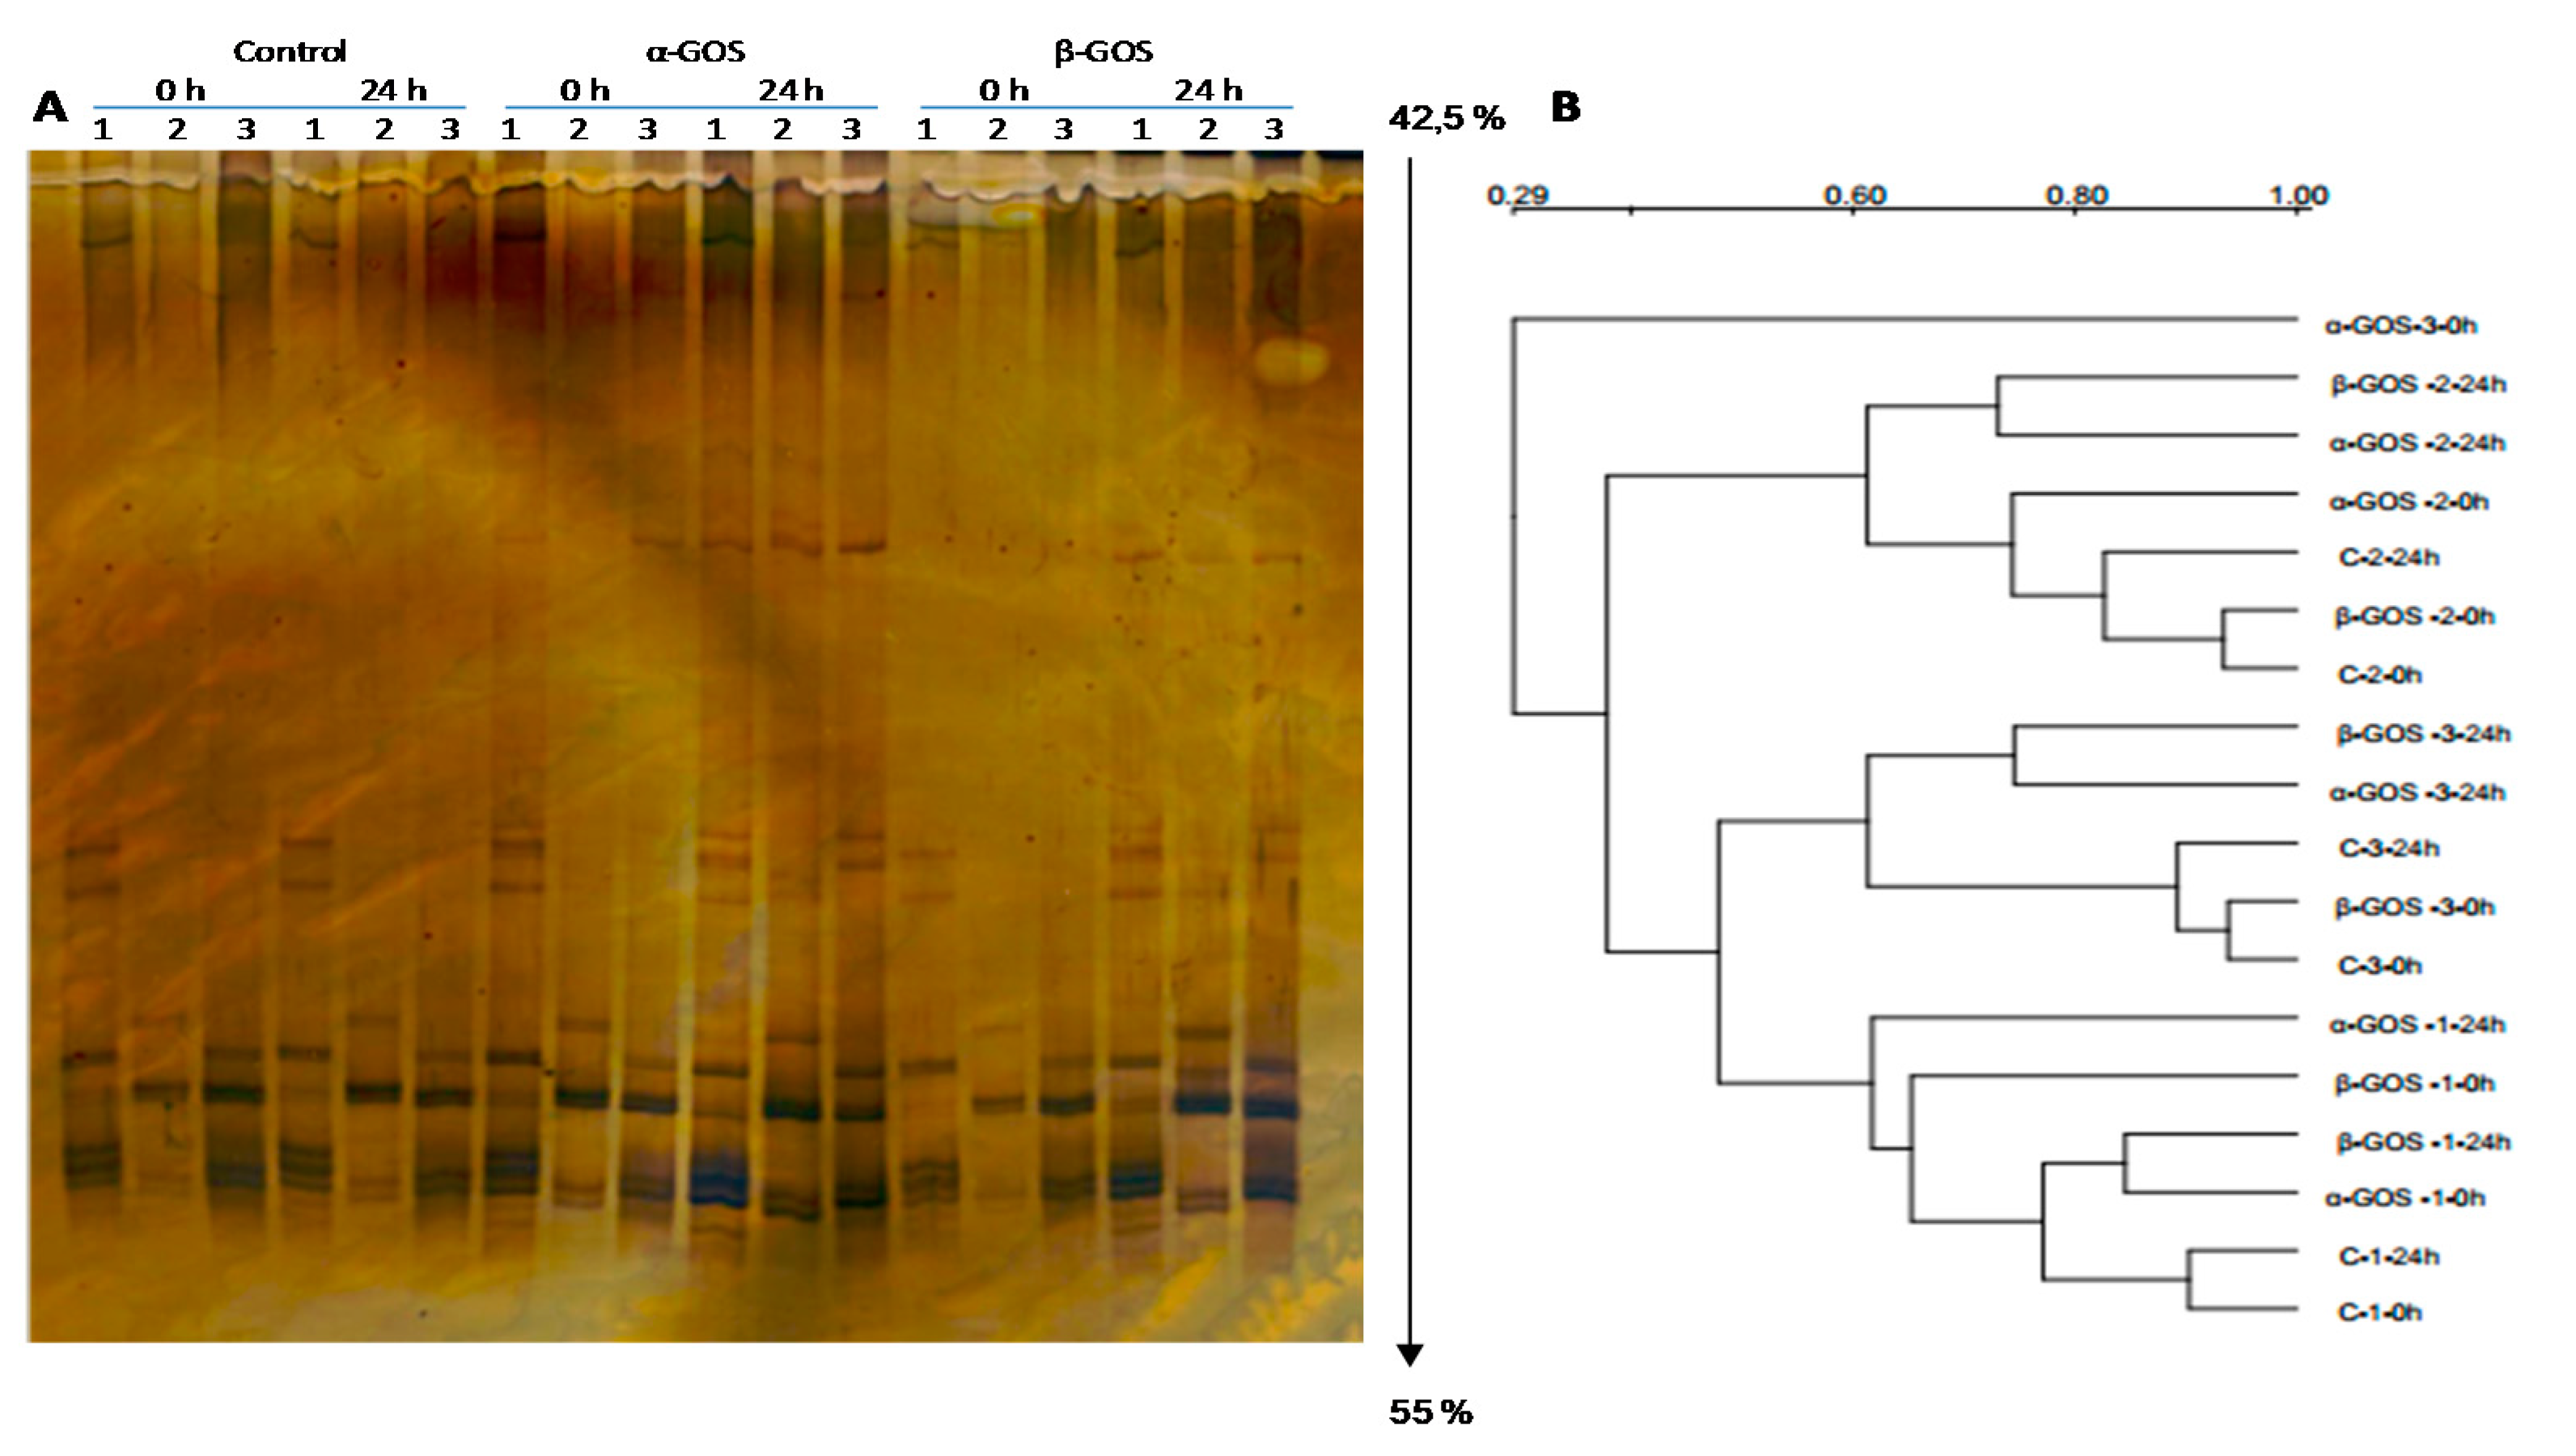
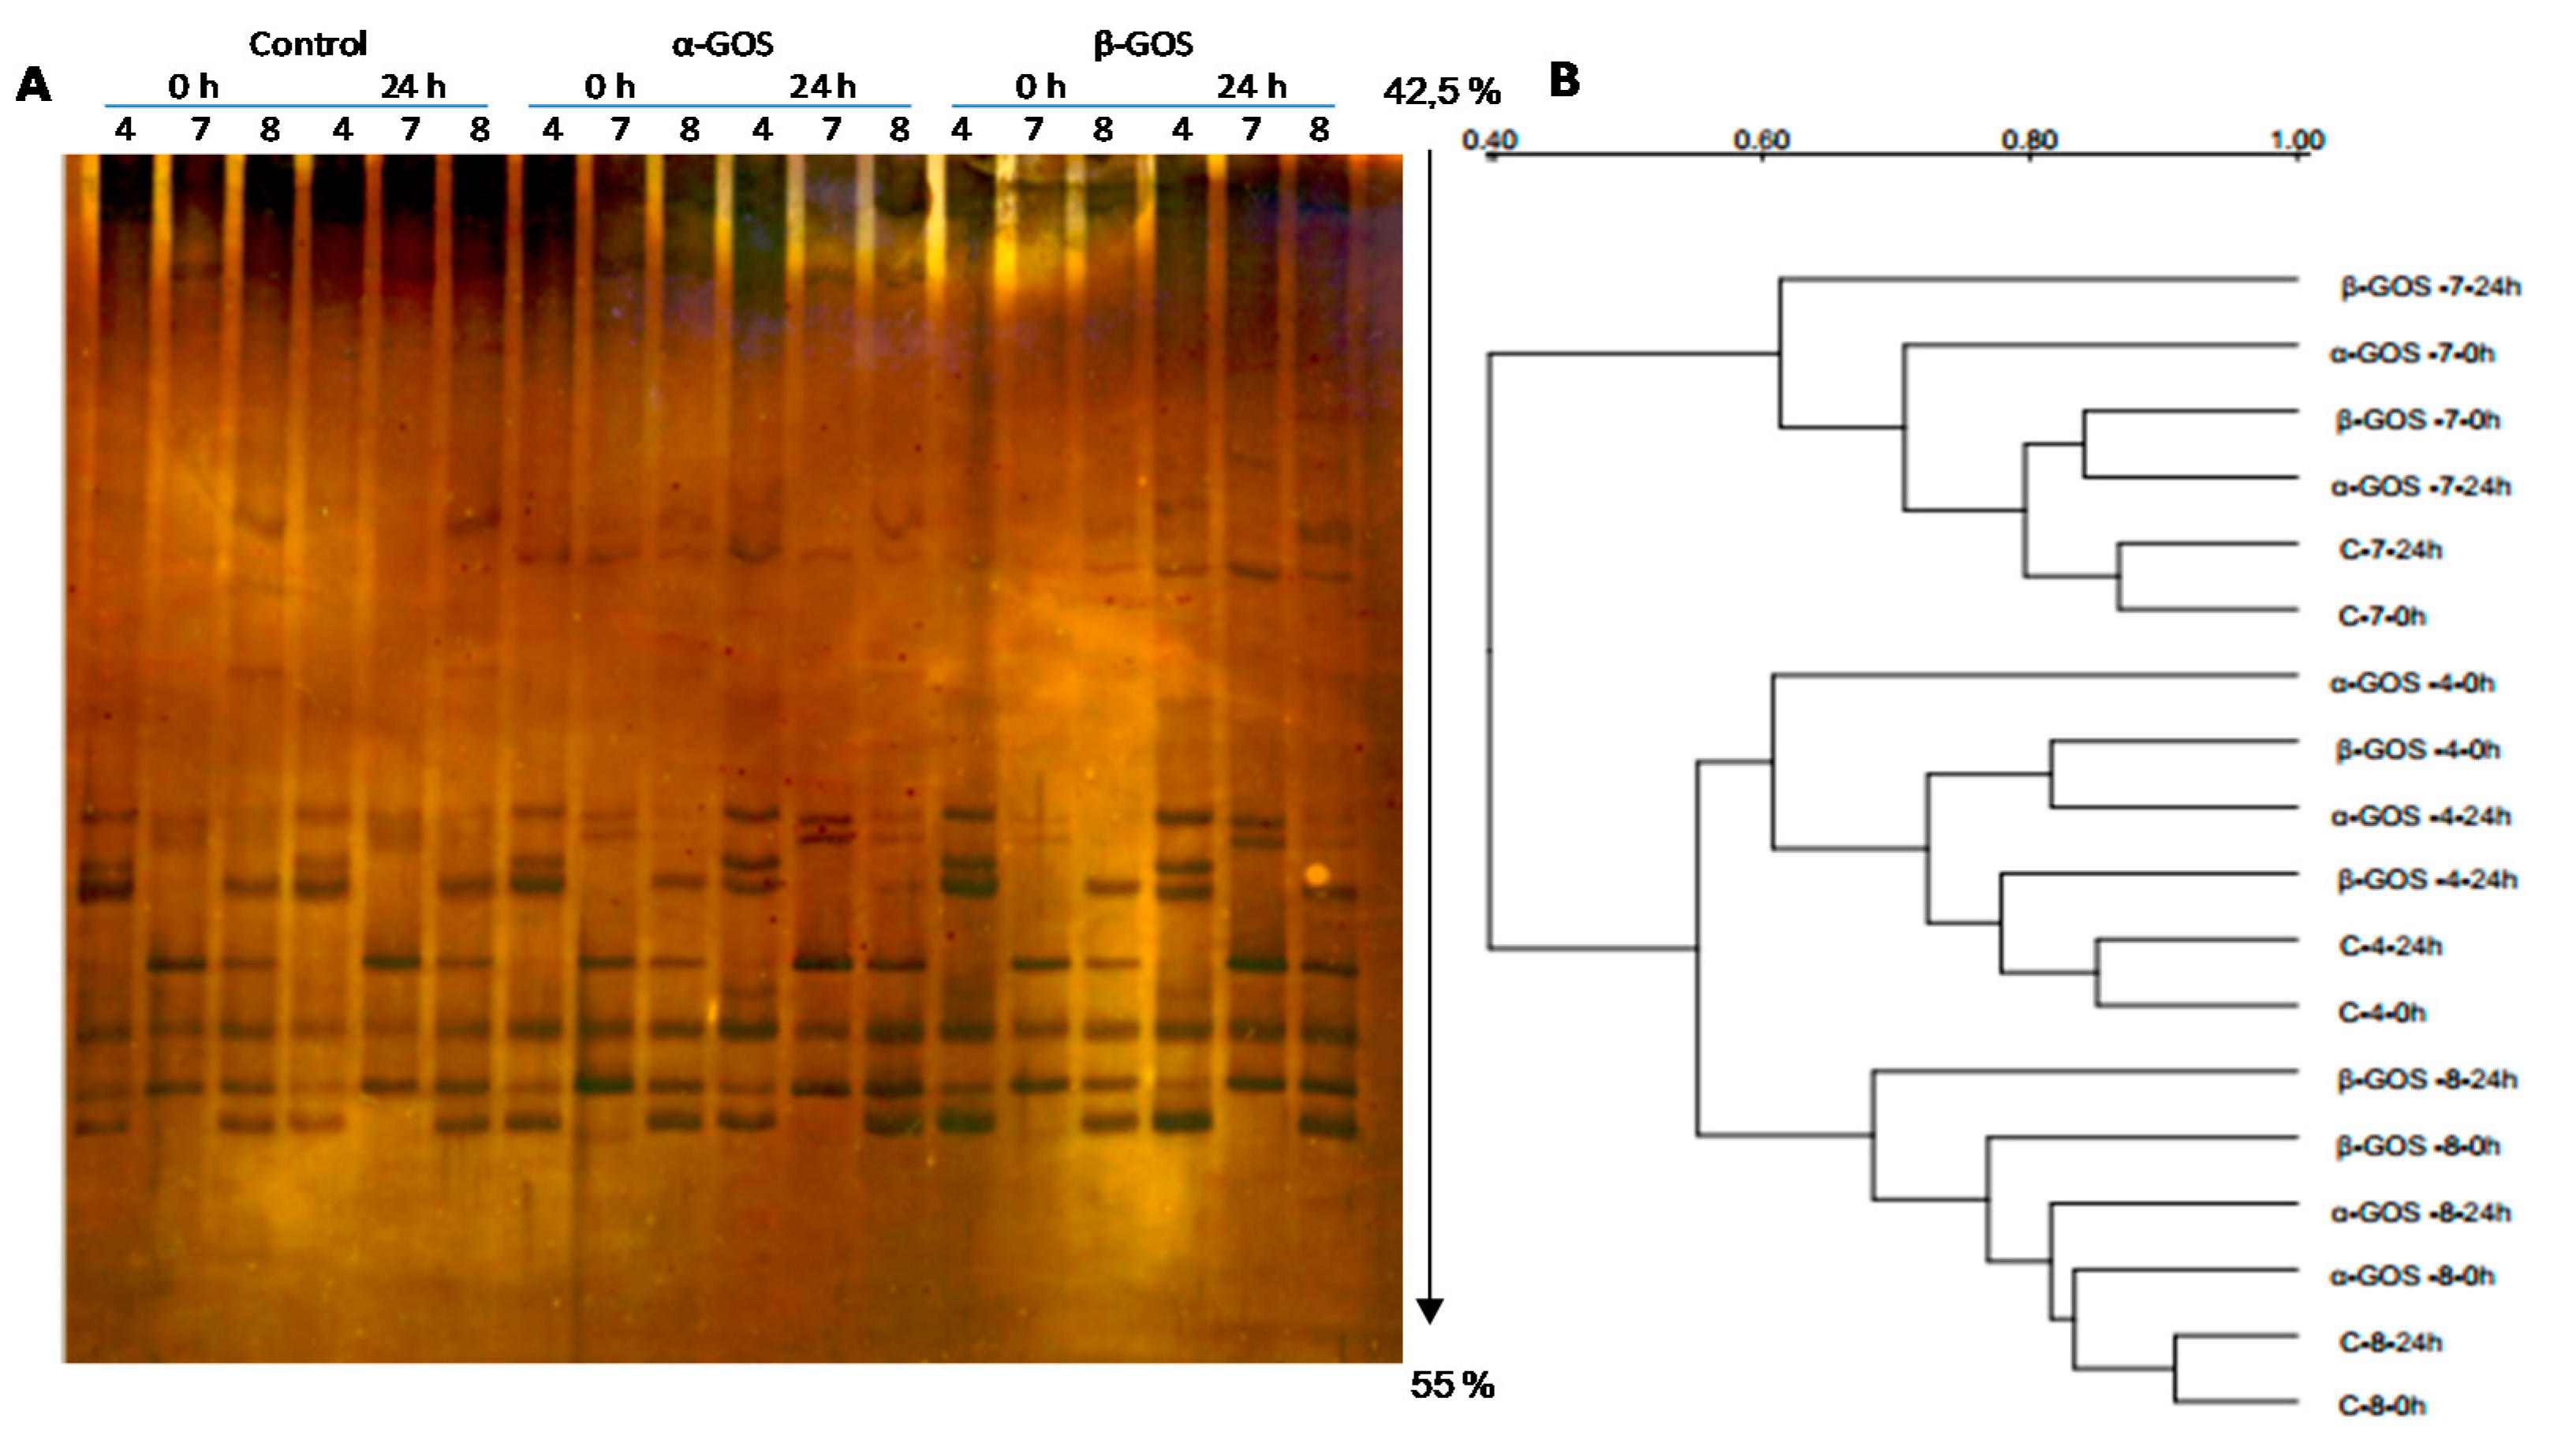
2.8. PCR-Denaturing Gradient Gel Electrophoresis (DGGE) Analysis of Bifidobacteria

The 16S rRNA genes were amplified by PCR from extracted DNA of pellets from fecal batch cultures of infants. The Bifidobacterium genus-specific primers (Bif164-F and Bif662-GC-R) and PCR amplification conditions were as previously reported [23]. PCR fragments were separated by DGGE by using a denaturing gradient of 40 to 65%. The gels were visualized by silver-staining, dried at 37 °C and scanned. The total number and dendogram of similarity cluster analysis of DGGE bands were determined by Quantity One analysis software (BioRad). DGGE profiles were determined by cluster analysis using the Dice similarity coefficient and the unweighted-pair group method by means of arithmetic average clustering algorithm (UPGMA). The richness (S) of the bifidobacterial community was established from the number of electrophoretic bands in individual samples. Shannon index (H), was calculated as reported by Magurran [25] as: H = −∑ (pi · lnpi), where pi is the abundance of every species. The evenness (E) of the bacterial community was further estimated as E = H/lnS [26].

2.9. Excision and Sequencing of DGGE Bands

The DGGE bands were excised and eluted by using sterilised distilled water at 4 °C. The primers Bif164-F and Bif662-R were used to amplify the bands of interest as previously described [23]. PCR products were purified and then cloned using the TOPO TA Cloning kit for Sequencing (Invitrogen). Plasmids DNA were isolated from selected transformants with the GenElute Plasmid Miniprep kit (Sigma-Aldrich, St. Louis, USA), being inserts sequenced. Searches for sequence similarity were carried out using the BLAST algorithm [27] of the GenBank database Release 232.0 (www.ncbi.nlm.nih.gov) for identification of the nearest relatives of the partial 16S rRNA sequences. A sequence similarity ≥98% of the 16S rRNA gene was used as the criterion for identification of bifidobacterial species.

2.10. Carbohydrate Quantification by Gas Chromatography Coupled to Flame-Ionization Detector (GC-FID)

The carbohydrate concentration before and after in vitro fecal fermentation was analysed by GC-FID. The carbohydrate fraction was derivatized to their corresponding trimethylsilyl oximes (TMSO) following the method of Brobst and Lott [28]. The samples were dried and the oximes were formed by adding 350 μL of hydroxylamine chloride in pyridine (2.5% w/v) at 70 °C for 30 min. The resulting oximes were silylated with hexamethyldisilazane (350 μL) and trifluoroacetic acid (35 μL) at 50 °C for 30 min. The mixtures were centrifuged at 7000× g for 4 min. The supernatants were stored at a temperature of 4 °C prior to analysis. The chromatography separation was carried out in an Agilent Technologies gas chromatograph (Mod 7890A, Santa Clara, USA) with a fused silica capillary column DB-5HT (5%-phenyl-methylpolysiloxane; 30 m × 0.25 mm × 0.10 µm) (Agilent). The oven temperature was set to 150 °C and then increased to 380 °C at a rate of 3 °C/min. The injector and detector temperatures were set to 280 °C and 385 °C, respectively. One mL/min of nitrogen was used as carrier gas and the injections were performed in split mode (1:20). Data acquisition and integration were performed using the Agilent ChemStation software.

2.11. Statistical Analysis

The effect of non-fructosylated α-GOS and β-GOS on microbiota composition and SCFA amounts of fecal contents was analyzed using a linear mixed model: repeat measure (SPSS Statistics version 22.0, Madrid, Spain). The Bonferroni method with a p value ≤ 0.05 was used for adjustments for major effects and the time 0 h was used like a covariate.

3. Results and Discussion

3.1. Microbiota Composition after In Vitro Fermentation of Non-Fructosylated α-GOS and β-GOS with Infant Fecal Samples

Using infant fecal slurries, all bacteria and up to seven different bacterial groups were analysed before and after 6 and 24 h of the in vitro fermentation of non-fructosylated α-GOS and β-GOS. Table 2 shows the population of these bacterial groups, which is the average of data resulting from eight infant donors. During treatment, the control samples (in the absence of oligosaccharides) did not show significant differences, with the exception of bifidobacteria and enterobacteria that slightly increased after 6 and 24 h. Bifidobacterium spp. increased significantly in non-fructosylated α-GOS and β-GOS groups but no differences were observed between 6 and 24 h treatment. Indeed, the bifidogenic effect in non-fructosylated α-GOS and β-GOS groups was significantly greater than that found in control samples. To the best of our knowledge, no data has been previously reported regarding the effect of non-fructosylated α-GOS in the modulation of infants’ microbiota, using either in vivo or in vitro systems. On the contrary, the bifidogenic properties of β-GOS in infants’ microbiota is well documented. Thus, the bifidogenic activity of β-GOS using infant fecal slurries in a three-stage in vitro culture method that mimics the proximal, transversal and distal colon has been reported [29]. A strong bifidogenic activity in an in vivo intervention study in infants by using a formula-fed containing β-GOS was also reported [30]. A significant decrease in enterobacteria was observed in non-fructosylated α-GOS and β-GOS samples, while a slight increase was found in the control group. C. coccoides/E. rectale group, Lactobacillus spp., C. leptum group, F. praustnizii, Bacteroides and total bacteria did not show significant differences in both non fructosylated α-GOS and β-GOS treatments (Table 2).
Analysis of different bacterial groups after in vitro fermentation of non-fructosylated α-GOS and β-GOS suggest that these oligosaccharides are preferentially metabolized by bifidobacteria. Although this study is mainly focused in the bifidogenic properties of both GOS types, prebiotic targets extend beyond stimulation of bifidobacterial and lactobacilli, and recognizes that health benefits can derive from effects on other beneficial taxa. Such is the case of F. praustnizzii and the Clostridium coccoides/Eubacterium rectale bacterial group that includes species that are known butyrate-producers, thereby contributing to important processes linked to colonic health, including the protection against inflammatory bowel diseases. As reported in Table 2, in vitro fermentation of non-fructosylated α-GOS and β-GOS did not affect the growth of these butyrate-producers whilst enterobacteria numbers significantly decreased. In this sense, further studies are planned to determine the preventive role of non-fructosylated α-GOS in the colonization of pathogenic enterobacteria.
The modulation of gut microbiota by RFOS has been previously evaluated using in vitro fermentation batch cultures, inoculated with a standardised human adult faecal sample; a higher increase of Bifidobacterium spp. using RFOS when compared with FOS and β-GOS was observed, being the bifidogenic effect dose-dependent [19]. However, to the best of our knowledge, there is not specific information regarding the potential prebiotic properties of non-fructosylated α-GOS. Recently, the prebiotic potential of melibiose-derived gluco-oligosaccharides linked by α-(1→3) and α-(1→6) glycosidic bonds as unique carbon source has been evaluated by testing the growth of bifidobacteria (B. breve, B. longum subsp. longum, B. animalis) and lactobacilli (L. reutieri, L. plantarum and L. rhamnosus) [31]. In agreement with our data, lactobacilli were unable to metabolize melibiose-derived oligosaccharides whereas bifidobacteria were able to utilize them.
Although no data regarding the modulatory effect of non-fructosylated α–GOS in infant fecal microbiota has been previously reported, it has been suggested they could be safely used in infant formulas. In a study carried out with neonatal piglets to mimic infancy conditions, an intervention during three weeks having a daily consumption of 3.6–3.9 g non-fructosylated GOS/kg body weight demonstrated to be well tolerated with no adverse effects in terms of clinical signs, body weight, feed consumption, haematology, organ weight and histopathology [20].

3.2. Effect of Non-Fructosylated α-GOS on Bifidobacterial Composition

As previously pointed out, non-fructosylated α-GOS and β-GOS had a strong bifidogenic effect in infant inoculum after 6 h of fermentation and was kept at 24 h of treatment. To obtain a more comprehensive assessment of the impact of both GOS on the population structure of bifidobacteria in children’s faecal samples, 16S rRNA gene profiles were generated by means of genus-specific primers PCR-DGGE. Control samples reflected an inter-individual variation in faecal bifidobacterial community being grouped in two cladograms with electrophoretic bands differing from 3 up to 11 (Supplementary Materials Figure S1). Dendrogram analysis indicated a grouping of the samples by children but they were not clustered after non-fructosylated α-GOS and β-GOS treatment (Figure 1). The electrophoretic bands were excised for sequencing and bifidobacterial species identified. Sequencing allowed us to identify B. catenulatum/pseudocatelunatum, B. longum subsp. longum and B. longum subsp. infantis as the most frequently present bifidobacterial species in infants. Whereas B. longum subsp. infantis was clearly identified, B. longum subsp. longum did not achieved such level of recognition at subspecies level and might be an experimental limitation that needs to be considered. The presence of B. adolescentis and B. bifidum was identified in only one of the infants. These species have been reported in many studies as the dominant bifidobacteria in infant faecal samples. Significant differences in bifidobacteria communities display differential metabolic features and have strong implications in infant physiology state and health [32,33,34]. Delivery mode (vaginal birth or assisted delivery) and feeding modes (breastfeeding, milk formula and mix-fed) have influences on bifidobacterial composition at species level [32]. Significant changes in the gut microbiota of infants occur when cessation of breastfeeding and introduction of solid foods cause an important shift in gut microbiota composition and begins to resemble a stable adult-like microbiome [35]. Under these circumstances, the supplementation of infant formulae with prebiotic oligosaccharides (GOS/FOS) results in significantly higher stool colony counts of bifidobacterial; it has also been associated to clinical effects such as increased stool frequency and stool softening [36].
To provide an interpretation of the DGGE pattern, three diversity indices of DGGE profiles were calculated (Table 3). The number of bands or richness was significantly higher (p < 0.05) in β-GOS after 24 h of fermentation compared to control and non-fructosylated α-GOS that only demonstrated a trend. Shannon and Evenness indices followed the same pattern for each GOS treatment.

3.3. Modulation in Bifidobacteria Species Population by Non-Fructosylated α-GOS and β-GOS

In this study, five different bifidobacterial species were quantified at 0 and 24 h after fermentation of non-fructosylated α-GOS and β-GOS with fecal slurries of eight infants (Table 4). The highest level of bifidobacterial species in fecal samples corresponded to B. longum subsp- longum and B. catenulatum/pseudocatenulatum. It is well-known that bifidobacterial species show differential ability for breakdown, uptake and utilization of carbohydrates. In particular, non-fructosylated α-GOS and β-GOS significantly stimulated the selective growth of B. longum subsp. longum after 24 h fermentation whereas B. adolescentis and B. longum subsp. infantis were not affected. A significant (p < 0.05) growth of B. catenulatum/pseudocatenulatum after 24 h fermentation of non-fructosylated α-GOS was observed. Although B. breve is a common intestinal bacteria in children’s microbiota, mainly in those fed breast milk, attempts to quantify B. breve by qPCR was unsuccessful, likely due to their low levels in fecal samples of children. No match for B. breve was found when the faecal bifidobacterial community of children was analyzed by DGGE. In both GOS groups, a significant (p < 0.05) decrease in B. bifidum population compared to controls was shown. The requirement of prebiotic specificity has recently been questioned by several authors [35,36]. Such controversy is likely to affect to more complex dietary carbohydrates that need bacteria consortium for their degradation instead of GOS compounds that have demonstrated to be selectively bifidogenic [37,38]. Sequencing analysis of fecal samples from healthy human volunteers consuming GOS revealed an increase of bifidobacterial populations [39]. Access to genome sequences of several bifidobacterial strains from infant fecal isolates such as B. bifidum PRL2010, B. breve UCC2003 and B. longum subsp. infantis ATCC15697 has increased our knowledge of the metabolic machinery within the genus Bifidobacterium. Bifidobacteria contains a high number of glycosyl hydrolases-encoding genes with ability to hydrolyze a wide range of complex carbohydrates (e.g., amylose, amylopectin, maltodextrin) as well as stachyose, raffinose and melibiose, which represent carbohydrates widely present in the human diet [40,41]. Further studies regarding the bifidobacterial enzymes involved in the selective degradation of non-fructosylated α-GOS will allow us to understand their potential as prebiotic ingredient in infant formula.

3.4. Lactate and Short-Chain Fatty Acid (SCFA) Concentration

Under anaerobic conditions, non-digestible dietary carbohydrates including GOS are fermented by gut microbiota and thereby producing SCFA that contributes to metabolic regulation and control of energetic metabolism of the host [42]. In our study, lactate and SCFAs were quantified after fermentation of non-fructosylated α-GOS and β-GOS (Table 5). Acetate was the most abundant SCFA, showing a significant (p < 0.05) increase after both GOS treatments. In the case of non-fructosylated α-GOS, the levels of acetate increased up to four times compared to baseline. The highest amount of lactate in infant fecal cultures was reported after 6 h in both GOS fermentations, being observed a decrease at 24 h likely due that normally lactate behave as intermediate in microbial metabolism because of onward conversion [43]. Similar to acetate, lactate concentration was higher in non-fructosylated α-GOS compared to β-GOS. Lactate and acetate are main fermentation products of bifidobacteria and are used by other bacteria species to produce butyrate and propionate. In our study, the amounts of propionate and butyrate were not affected after GOS treatment. In agreement with previous studies, GOS are highly selective for Bifidobacterium spp. and stimulated acetate production but not the production of propionate and butyrate [44]. Formate amounts were increased due to GOS fermentation, being formate levels after non-fructosylated α-GOS fermentation much higher compared to β-GOS, tripling its value after 24 h (Table 5). Other metabolic indicators such as iso-butyrate, valerate, iso-valerate and succinate were also quantified in this study but no significant changes were observed. The production of SCFA caused a significant drop of pH (0.8 and 1.0 units after 24 h treatment of β-GOS and non-fructosylated α-GOS, respectively) in fecal cultures. Such decrease in luminal pH has been associated to beneficial effects including a decrease in the growth of potential intestinal pathogens sensitive to pH, like some enterobacteria, as well as an increase in the mineral absorption of calcium, magnesium and likely iron [45].

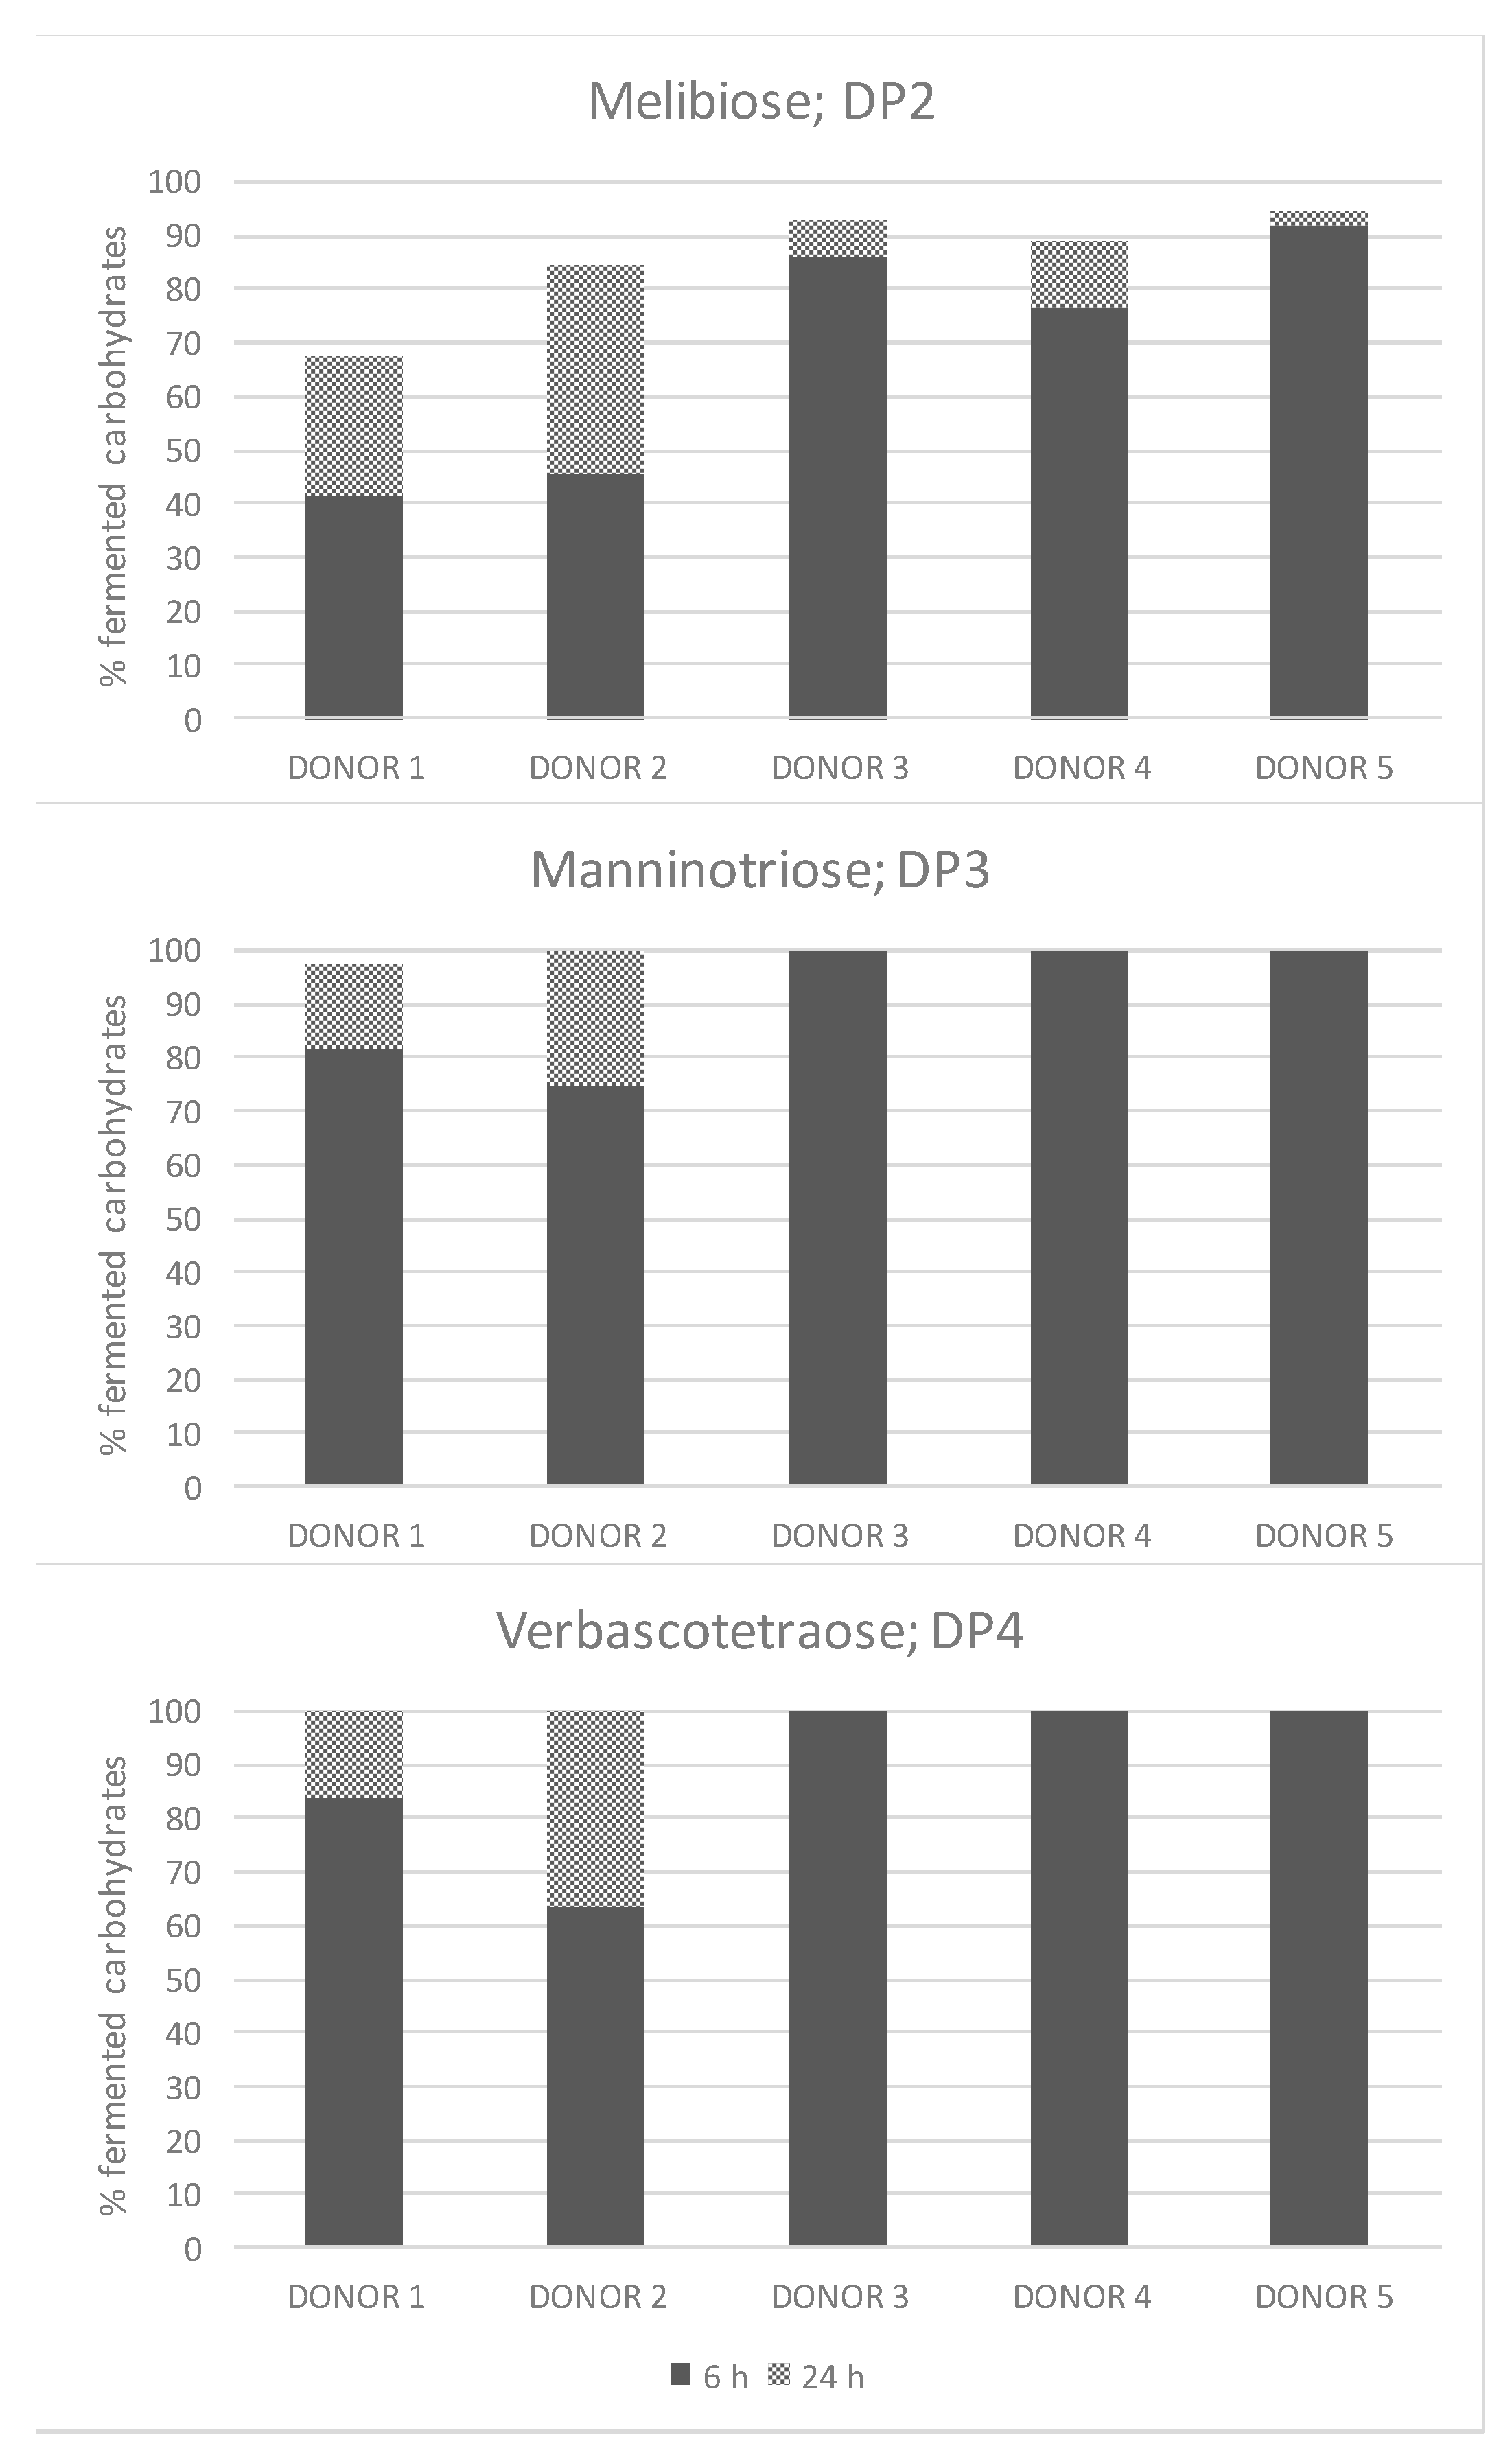
3.5. Consumption of Non-Fructosylated α-GOS Per Donor and Degree of Polymerization

The genome sequences of bifidobacteria display a remarkable enrichment in genes involved in breakdown, uptake, and utilization of a wide variety of resistant carbohydrates to digestion, playing an important role in the healthy infant gut. In this study, manninotriose (DP3) and verbascotetraose (DP4), accounting for more than 92% of total carbohydrates, were completely and readily fermented by the studied donors (Figure 2). This trend was not observed for the disaccharide melibiose, where the fermentation rate ranged between 67% and 95%. Regarding consumption of total non-fructosylated α-GOS, the observed values ranged from 97.6% (donor 1) to 99.9% (donor 5) after 24 h fermentation.
Bifidobacteria can utilize a diverse range of carbohydrates that escape degradation in the upper part of the GIT, as evidenced by the clear enrichment for genes encoding carbohydrate-active enzymes [41]. Bifidobacteria have different specialized oligosaccharide transport systems, since most of their saccharolytic enzymes are intracellular [43]. The fermentation of non-fructosylated α-GOS, as shown in Table 4, significantly increased the growth of B. longum subsp. longum and B. catenulatum/pseudocatenulatum and decreased that of B. bifidum. The uptake of α-(1→6)-linked dietary oligosaccharides (ie., raffinose and a mixture of isomaltooligosaccharides) by several Bifidobacterium strains, that included B. longum subsp. longum ICM1217 and B. longum subsp. infantis ATCC15697 among others, was reported to be mediated by the solute binding protein (B1G16BP) associated with an ATP binding cassette (ABC) transporter [46]. Interestingly, B. bifidum, which lacks the genes encoding the B1G16BP ABC transporter, was the only one that did not grow on raffinose and isomaltooligosaccharides, which is in line with our findings. The ABC transporter uses energy produced by the ATP hydrolysis to carry out the oligosaccharides transportation to the intracellular compartment. Once internalized, these oligosaccharides are metabolized by glycosyl hydrolases (GHs) which hydrolyze the glycosidic bond between two or more carbohydrates. Melibiose and raffinose has been reported to be hydrolyzed by B. longum subsp. longum NCC2705 [40]. According to our results, the lower consumption of melibiose over manninotriose and verbascotetraose could be due to the higher preference of α-galactosides for Gal-(1→6)-Gal-linkages over Gal-(1→6)-Glc, and likely to potential preference for higher DPs. In addition, ligand preference of B1G16BP was ~35 fold lower for melibiose compared with raffinose, which might be explained by its high binding affinity for the non-reducing α-(1→6)-diglycoside, an structural motif present in manninotriose and verbascotetraose but not in melibiose [46]. Although it is clear major metabolic differences might occur at species level, such metabolic abilities might differ considerably between bifidobacterial strains. Thus, it has been reported that β-GOS fermentation is strain-dependent based on their DP and glycosidic linkages [47].
Outcomes were analyzed using a linear mixed model: repeat measure. A Bonferroni method was used for adjustments for major effects (time of treatment and type of GOS). a, b Mean value with different letters means that differences among treatments was significantly different at p-value < 0.05. Unadjusted mean values n = 8. Bs: Baseline like covariate. *Interaction among major effects.

4. Conclusions

The in vitro fermentation profile of non-fructosylated α-GOS by using infant fecal slurries has been investigated. Remarkable bifidogenic activity of non-fructosylated α-GOS was observed, similar to that obtained using commercial β-GOS, as well as a significant decrease of enterobacteria. A selective and significant increase in B. longum subsp. longum and B. catenulatum/psudo-catelunatum was observed. Therefore, we conclude that these plant-derived GOSs could be used as a prebiotic in infant formula.

Supplementary Materials

The following are available online at https://www.mdpi.com/2304-8158/9/7/921/s1, Figure S1: (A) DGGE profiles and (B) dendogram of the Bifidobacterium population from faecal samples of infants, Table S1: β-GOS composition after purification by size-exclusion chromatography, Table S2: PCR primers based on 16S rRNA sequences used for quantitative PCR for bacterial groups, Table S3: PCR primers based on 16S rRNA sequences used for quantitative PCR for Bifidobacteria species.

Author Contributions

Conceptualization, A.C., F.J.M.; methodology, A.C., F.J.M., M.d.C.M.-M., M.D.-M.; software, M.d.C.M.-M.; formal analysis, M.d.C.M.-M., M.D.-M., C.D.-A.; investigation, A.C., F.J.M.; resources, A.C.; writing—original draft preparation, A.C., O.H.-H.; writing-review and editing, A.C., O.H.-H., M.d.C.M.-M., F.J.M.; supervision, A.C., F.J.M.; project administration, A.C.; funding acquisition, A.C., F.J.M., O.H.-H. All authors have read and agreed to the published version of the manuscript.

Funding

This research was funded by the Spanish Ministry of Economy, Industry and Competitiveness, grant numbers AGL2017-83772-R and AGL2017-84614-C2-1-R (AEI/FEDER,UE); the Spanish Ministry of Science, Innovation and Universities grant number RTI2018-101273-J-I00 (JIN Program) and AGR2011-7626 from Junta de Andalucía.

Conflicts of Interest

The authors declare no conflict of interest.

References

  1. Collado, M.C.; Derrien, M.; Isolauri, E.; De Vos, W.M.; Salminen, S. Intestinal integrity and Akkermansia muciniphila, a mucin-degrading member of the intestinal microbiota present in infants, adults, and the elderly. Appl. Environ. Microbiol. 2007, 73, 7767–7770. [Google Scholar] [CrossRef] [PubMed] [Green Version]
  2. Rodriguez, M.A.; Murphy, K.; Stanton, C.; Ross, R.P.; Kober, O.I.; Juge, N.; Avershina, E.; Rudi, K.; Narbad, A.; Jenmalm, M.C.; et al. The composition of the gut microbiota throught life, with emphasis on early life. Microb. Ecol. Health Dis. 2015, 26, 26050. [Google Scholar] [PubMed]
  3. Houghteling, P.D.; Walker, W.A. Mucosal why is initial bacterial colonization of the intestine important to the infant’s and child’s health? J. Pediatr. Gastroenterol. Nutr. 2008, 6, 2166–2171. [Google Scholar]
  4. Verkhnyatskaya, S.; Ferrari, M.; De Vos, P.; Walvoort, M.T.C. Shaping the infant microbiome with non-digestible carbohydrates. Front. Microbiol. Res. Top. 2019, 10, 1–8. [Google Scholar] [CrossRef] [Green Version]
  5. Gibson, G.R.; Hutkins, R.; Sanders, M.E.; Prescott, S.L.; Salminen, S.J.; Scott, K.; Stanton, C.; Cani, P.D.; Verbeke, K.; Reid, G. The International Scientific Association for Probiotics and Prebiotics (ISAPP) consensus statement on the definition and scope of prebiotics. Nat. Rev. Gastroenterol. Hepatol. 2017, 14, 491–502. [Google Scholar] [CrossRef] [Green Version]
  6. Akkerman, R.; Faas, M.M.; de Vos, P. Non-digestible carbohydrates in infant formula as substitution for human milk oligosaccharide functions: Effects on microbiota and gut maturation. Crit. Rev. Food Sci. Nutr. 2019, 59, 1486–1497. [Google Scholar] [CrossRef] [PubMed]
  7. Marcobal, A.; Barboza, M.; Froehlich, J.W.; Block, D.E.; German, J.B.; Lebrilla, C.B.; Mills, D.A. Consumption of human milk oligosaccharides by gut-related microbes. J. Agric. Food Chem. 2010, 58, 5334–5340. [Google Scholar] [CrossRef] [PubMed] [Green Version]
  8. Ruiz-Moyano, S.; Totten, S.M.; Garrido, D.A.; Smilowitz, J.T.; Bruce German, J.; Lebrilla, C.B.; Mills, D.A. Variation in consumption of human milk oligosaccharides by infant gut-associated strains of Bifidobacterium breve. Appl. Environ. Microbiol. 2013, 79, 6040–6049. [Google Scholar] [CrossRef] [PubMed] [Green Version]
  9. Wang, Y.; Jiang, K.; Ma, H.; Zeng, W.; Wang, P.G.; Yao, N.; Han, W.; Cheng, J.; Wang, W. Enzymatic production of HMO mimics by the sialylation of galacto-oligosaccharides. Food Chem. 2015, 181, 51–56. [Google Scholar] [CrossRef] [PubMed]
  10. Barile, D.; Rastall, R.A. Human milk and related oligosaccharides as prebiotics. Curr. Opin. Biotechnol. 2013, 24, 214–219. [Google Scholar] [CrossRef] [PubMed]
  11. Oswari, H.; Widodo, A.D.; Handayani, F.; Juffrie, M.; Sundjaya, T.; Bindels, J.; Hegar, B. Dosage-related prebiotic effects of inulin in formula-fed infants. Pediatr. Gastroenterol. Hepatol. Nutr. 2019, 22, 63–71. [Google Scholar] [CrossRef] [PubMed]
  12. Ehara, T.; Izumi, H.; Tsuda, M.; Nakazato, Y.; Iwamoto, H.; Namba, K.; Takeda, Y. Combinational effects of prebiotic oligosaccharides on bifidobacterial growth and host gene expression in a simplified mixed culture model and neonatal mice. Br. J. Nutr. 2016, 116, 270–278. [Google Scholar] [CrossRef] [PubMed] [Green Version]
  13. Gopalsamy, G.; Mortimer, E.; Greenfield, P.; Bird, A.R.; Young, G.P.; Christophersen, C.T. Resistant starch is actively fermented by infant faecal microbiota and increases microbial diversity. Nutrients 2019, 11, 1–16. [Google Scholar] [CrossRef] [PubMed] [Green Version]
  14. Hernandez-Hernandez, O.; Olano, A.; Rastall, R.; Moreno, F.J. In Vitro digestibility of dietary carbohydrates: Toward a standardized methodology beyond amylolytic and microbial enzymes. Front. Nutr. 2019, 6, 61. [Google Scholar] [CrossRef] [Green Version]
  15. Van den Ende, W. Multifunctional fructans and raffinose family oligosaccharides. Front. Plant. Sci. 2013, 4, 1–11. [Google Scholar]
  16. Myhara, R.M.; Nilsson, K.; Skura, B.J.; Bowmer, E.J.; Cruickshank, P.K. Gas production from melibiose, raffinose and white bean extracts by bacteria of human fecal origin. Can. Inst. Food Sci. Technol. 1988, 21, 245–250. [Google Scholar] [CrossRef]
  17. Martins, G.N.; Ureta, M.M.; Tymczyszyn, E.E.; Castilho, P.C.; Gomez-Zavaglia, A. Technological aspects of the production of fructo and galacto-oligosaccharides. Enzymatic synthesis and hydrolysis. Front. Nutr. 2019, 6, 78. [Google Scholar] [CrossRef] [PubMed]
  18. EFSA NDA Panel (EFSA Panel on Dietetics Products, Nutrition and Allergies). Scientific Opinion on the substantiation of a health claim related to AlphaGOS® and a reduction of post-prandial glycaemic responses pursuant to Article 13(5) of Regulation (EC) N° 1924/2006. EFSA J. 2014, 12. [Google Scholar] [CrossRef] [Green Version]
  19. Fehlbaum, S.; Prudence, K.; Kieboom, J.; Heerikhuisen, M.; van den Broek, T.; Schuren, F.H.J.; Steinert, R.E.; Raederstorff, D. In Vitro fermentation of selected prebiotics and their effects on the composition and activity of the adult gut microbiota. Int. J. Mol. Sci. 2018, 19, 3097. [Google Scholar] [CrossRef] [Green Version]
  20. Kruger, C.; Zhou, Y.; Thorsrud, B.A.; Morel-Despeisse, F.; Chappuis, E. Safety evaluation of α-galacto-oligosaccharides for use in infant formulas investigated in neonatal piglets. Toxicol. Res. Appl. 2017, 1, 1–10. [Google Scholar] [CrossRef]
  21. Hernandez-Hernandez, O.; Marín-Manzano, M.C.; Rubio, L.A.; Moreno, F.J.; Sanz, M.L.; Clemente, A. Monomer and linkage type of galacto-oligosaccharides affect their resistance to ileal digestion and prebiotic properties in rats. J. Nutr. 2012, 142, 1232–1239. [Google Scholar] [CrossRef] [Green Version]
  22. Arboleya, S.; Binetti, A.; Salazar, N.; Fernández, N.; Solis, G.; Hernández-Barranco, A.; Margolles, A.; de los Reyes-Gavilán, C.G.; Gueimonde, M. Establisment and development of intestinal microbiota in preterm neonates. FEMS Microbiol. Ecol. 2012, 79, 763–772. [Google Scholar] [CrossRef] [Green Version]
  23. Marín-Manzano, M.C.; Abecia, L.; Hernández-Hernández, O.; Sanz, M.L.; Montilla, A.; Olano, A.; Rubio, L.A.; Moreno, F.J.; Clemente, A. Galacto-oligosaccharides derived from lactulose exert a selective stimulation on the growth of Bifidobacterium animalis in the large intestine of growing rats. J. Agric. Food Chem. 2013, 61, 7560–7567. [Google Scholar] [CrossRef] [Green Version]
  24. Tabasco, R.; Fernández de Palencia, P.; Fontecha, J.; Peláez, C.; Requena, T. Competition mechanisms of lactic acid bacteria and bifidobacteria: Fermentative metabolism and colonization. Food Sci. Technol. 2014, 55, 680–684. [Google Scholar] [CrossRef] [Green Version]
  25. Magurran, A.E. Ecological Diversity and its Measurements; Princenton University Press: Princenton, NJ, USA, 1988; p. 179. [Google Scholar]
  26. Pielou, E.C. Ecological Diversity; John Wiley & Sons, Inc.: New York, NY, USA, 1975; p. 165. [Google Scholar]
  27. Altschul, S.F.; Gish, W.; Myers, E.W.; Lipman, D.J. Basic local alignment search tool. J. Biol. Mol. 1990, 215, 403–410. [Google Scholar] [CrossRef]
  28. Brobst, K.; Lott, C.E. Determination of some components in corn syrup by gas-liquid chromatography of trimethylsilyl derivatives. Cereal Chem. 1966, 43, 35–43. [Google Scholar]
  29. Grimaldi, R.; Cela, D.; Swann, J.R.; Vulevic, J.; Gibson, G.R.; Tzortzis, G.; Costabile, A. In Vitro fermentation of β-GOS: Impact of faecal bacterial populations and metabolic activity in autistic and non-autistic children. FEMS Microbiol. Ecol. 2017, 93, 1–10. [Google Scholar] [CrossRef] [PubMed] [Green Version]
  30. Borewicz, K.; Suarez-Diez, M.; Hechler, C.; Beijers, R.; de Weerth, C.; Arts, I.; Penders, J.; Thijs, C.; Nauta, A.; Lindner, C.; et al. The effect of prebiotic fortified infant formulas on microbiota composition and dynamics in early life. Sci. Rep. 2019, 9, 1–13. [Google Scholar] [CrossRef] [Green Version]
  31. Ispirli, I.; Kaya, Y.; Dertli, E. Bifidogenic effect and In Vitro immunomodulatory roles of melibiose-derived oligosaccharides produced by the acceptor reaction of glucansucrase E81. Proc. Biochem. 2020, 91, 126–131. [Google Scholar] [CrossRef]
  32. Matsuki, T.; Watanabe, K.; Tanaka, R. Genus- and species-specific PCR primers for the detection and identification of bifidobacterial. Curr. Issues Intest. Microbiol. 2003, 4, 61–69. [Google Scholar]
  33. Turroni, F.; Peano, C.; Pass, D.A.; Foroni, E.; Severgnini, M.; Claesson, M.J.; Kerr, C.; Hourihane, J.; Murray, D.; Fuligni, F. Diversity of Bifidobacteria Within the Infant Gut Microbiota. PLoS ONE 2012, 7, e36957. [Google Scholar] [CrossRef] [PubMed] [Green Version]
  34. Yang, B.; Chen, Y.; Stanton, C.; Ross, R.P.; Lee, Y.K.; Zhao, J.; Zhang, H.; Chen, W. Bifidobacterium and Lactobacillus composition at species level and gut microbiota diversity in infants before 6 weeks. Int. J. Mol. Sci. 2019, 20, 3306. [Google Scholar] [CrossRef] [Green Version]
  35. Berström, A.; Skoy, T.H.; Bahl, M.I.; Roager, H.M.; Christensen, L.B.; Ejlerskov, K.T.; Molgaard, C.; Michaelsen, K.F.; Licht, T.R. Establishment of intestinal microbiota during early life: A longitudinal, explorative study of a large cohort of Danish infants. App. Environm. Microbiol. 2014, 80, 2889–2900. [Google Scholar] [CrossRef] [PubMed] [Green Version]
  36. Braegger, C.; Chmielewska, A.; Decsi, T.; Kolacek, S.; Mihatsh, W.; Moreno, L.; Piescik, M.; Puntis, J.; Shamir, R.; Szajewska, H.; et al. Supplementation of infant formula with probiotics and/or prebiotics: A systematic review and comment by the ESPGHAN committee on nutrition. J. Pediatr. Gastroenterol. Nutr. 2011, 52, 238–250. [Google Scholar] [CrossRef] [Green Version]
  37. Bindels, L.B.; Delzenne, N.M.; Cani, P.D.; Walter, J. Towards a more comprehensive concept for prebiotics. Nat. Rev. Gastroenterol. Hepatol. 2015, 12, 303–310. [Google Scholar] [CrossRef]
  38. Hutkins, R.W.; Krumbeck, J.A.; Bindels, L.B.; Cani, P.D.; Fahey, G.; Goh, Y.J.; Hamaker, B.; Martens, E.C.; Mills, D.A.; Rastall, R.A.; et al. Prebiotics: Why definitions matter. Curr. Opin. Biotechnol. 2016, 37, 1–7. [Google Scholar] [CrossRef] [PubMed] [Green Version]
  39. Davis, L.M.; Martinez, I.; Walter, J.; Goin, C.; Hutkins, R. Barcoded pyrosequencing reveals that consumption of galactooligosaccharides results in a highly specific bifidogenic response in humans. PLoS ONE 2011, 6, e25200. [Google Scholar] [CrossRef] [PubMed] [Green Version]
  40. Pokusaeva, K.; Fitzgerald, G.F.; van Sinderen, D. Carbohydrate metabolism in Bifidobacteria. Genes Nutr. 2011, 6, 285–306. [Google Scholar] [CrossRef] [PubMed] [Green Version]
  41. El Kaoutari, A.; Armougom, F.; Gordon, J.I.; Raoult, D.; Henrisat, B. The abundance and variety of carbohydrate-active enzymes in the human gut microbiota. Nat. Rev. Microbiol. 2013, 11, 497–504. [Google Scholar] [CrossRef]
  42. Canfora, E.E.; Jocken, J.W.; Blaak, E.E. Short-chain fatty acids in control of body weight and insulin sensitivity. Nat. Rev. Endocrinol. 2015, 11, 577–591. [Google Scholar] [CrossRef]
  43. Flint, H.J.; Scott, K.P.; Louis, P.; Duncan, S.H. The role of the gut microbiota in nutrition and health. Nat. Rev. Gastroenterol. Hepatol. 2012, 9, 577–589. [Google Scholar] [PubMed]
  44. Ventura, M.; O’Connell-Motherway, M.; Leahy, S.; Moreno-Munoz, J.A.; Fitzgerald, G.F.; van Sinderen, D. From bacterial genome to functionality; case bifidobacteria. Int. J. Food Microbiol. 2007, 120, 2–12. [Google Scholar] [CrossRef] [PubMed]
  45. Alexander, C.; Swanson, K.; Fahey, G.C.; Garleb, K.A. Physiological importance of short-chain fatty acids from undigestible carbohydrate fermentation. Adv. Nutr. 2019, 10, 576–589. [Google Scholar] [CrossRef] [PubMed]
  46. Ejby, M.; Fredslund, F.; Andersen, J.M.; Žagar, A.V.; Henriksen, J.R.; Andersen, T.L.; Svensson, B.; Slotboom, D.J.; Hachem, M.A. An ATP binding cassette transporter mediates the uptake of α-(1,6)-linked dietary oligosaccharides in Bifidobacterium and correlates with competitive growth on these substrates. J. Biol. Chem. 2016, 291, 20220–20231. [Google Scholar] [CrossRef] [PubMed] [Green Version]
  47. Thongaram, T.; Hoeflinger, J.L.; Chow, J.; Miller, M.J. Prebiotic galactooligosaccharides metabolism by probiotic lactobacilli and bifidobacterial. J. Agric. Food Chem. 2017, 65, 4184–4192. [Google Scholar] [CrossRef]
Figure 1. (A) DGGE profiles and (B) dendrogram of the Bifidobacterium population from faecal samples of six infants and three experimental groups (control, non-fructosylated α-galactooligosaccharides (α-GOS) and β-galactooligosaccharides (β-GOS)) at time 0 and 24 h. Samples were grouped in two gels corresponding to 1, 2, 3 and 4, 7, 8 infants, respectively. Cluster analysis of Denaturing Gradient Gel Electrophoresis (DGGE) pattern profiles was performed using the Dice similarity coefficient and the unweighted-pair group method by means of arithmetic average clustering algorithm (UPGMA). The vertical arrow shows the direction and concentration of the denaturing gradient.
Foods 09 00921 g001aFoods 09 00921 g001b
Figure 2. Relative percentage (%) of fermented melibiose (DP2), manninotriose (DP3) and verbascotetraose (DP4) following fermentation of non-fructosylated α-GOS with infant faecal samples (n = 5). Darker and lighter colours on the bars indicate the percentage of metabolized carbohydrate after 6 and 24 h of incubation, respectively.
Foods 09 00921 g002
Table 1. Chemical composition of AlphaGOS®.
Parameter% (Dry Matter)
Dry matter a96.3
Crude proteins a<0.2
Crude ash a<0.2
DP1 + Maltose + Sucrose b<0.2
DP2: Melibiose b3.9
DP3: Manninotriose b49.2
DP4: Verbascotetraose b43.0
a Provided by the supplier; b quantified by GC-FID (see Section 2.10 for details); DP: degree of polymerization.
Table 2. Microbiota population from in vitro-fermented infant faecal samples with non-fructosylated α-GOS and commercial β-GOS derived from lactose.
Controlα-GOSβ-GOSp-ValuesPooled SEM
Log10 Copy Number/
Gr Dry Faeces
Bs6 h24 hBs6 h24 hBs6 h24 hTPrebioticsT * PrebioticsBs
All bacteria9.789.839.759.779.799.799.899.779.830.8710.3160.600<0.0010.027
Bifidobacteria spp.7.497.59 a7.68 a8.018.59 b8.62 b7.618.18 b8.35 b0.285<0.0010.823<0.0010.043
Clostridium coccoides/
Eubacterium rectale group
8.548.608.548.638.618.668.618.538.550.9940.1440.606<0.0010.020
Lactobacilli spp.5.014.784.405.034.865.025.024.694.800.7880.1500.208<0.0010.068
Clostridium leptum subgroup7.577.677.737.727.687.698.007.937.880.9000.0490.719<0.0010.026
Enterobacteria spp.7.817.85 b7.88 b8.248.12 a, b8.12 a, b7.937.69 a7.70 a0817<0.0010.967<0.0010.028
F. praustnizii8.138.148.128.208.098.108.138.047.990.7160.1000.893<0.0010.023
Bacteroides9.639.679.619.679.599.609.639.519.540.8550.0650.707<0,0010.021
Outcomes were analyzed using a linear mixed model: repeat measure. A Bonferroni method was used for adjustments for major effects (time of treatment and type of GOS) a,b Mean value with different letters means that differences among treatments was significantly different at p-value < 0.05. Unadjusted mean values n = 8. Bs: Baseline like covariate. * Interaction among major effects.
Table 3. Diversity indices of bifidobacterial samples after non-fructosylated α-GOS and β-GOS 24 h treatment of infant faecal samples.
TimeEnrichmentShannon IndexEvenness Index
MeanSDMeanSDMeanSD
Control0 h8.33 a4.032.04 a0.420.65 a0.13
24 h8.33 a4.032.04 a0.420.65 a0.13
α-GOS0 h10.83 a3.972.33 a0.360.74 a0.11
24 h12.50 a4.682.47 a0.360.78 a0.10
β-GOS0 h7.50 a2.071.99 a0.260.63 a0.08
24 h12.00 b3.162.46 b0.240.78 b0.07
a, b, within each row, mean values bearing a different superscript letter differ significantly (n = 6; p < 0.05). Significance main effects were determined by GLM REP (General Linear Model by one-way ANOVA).
Table 4. Effect of non-fructosylated α-GOS and β-GOS on bifidobacterial species of infant faecal samples.
Controlα-GOSβ-GOSp-ValuesPooled SEM
Log10 Copy Number/Gr De Contenido Fecal0 h24 h0 h24 h0 h24 hPbBs
Bifidobacterium adolescentis4.454.684.655.114.524.52NS<0.0010.193
Bifidobacterium bifidum4.555.09 b4.704.04 a4.574.27 a0.045<0.0010.157
Bifidobacterium catenulatum/pseudo-catenulatum7.477.41 a7.257.65 b7.447.74 a, b0.068<0.0010.094
Bifidobacterium longum subsp. infantis4.965.125.225.405.175.48NS<0.0010.117
Bifidobacterium longum subsp. longum8.258.26 a8.038.47 b8.368.71 b0.010<0.0010.065
Outcomes were analyzed using a linear mixed model: repeat measure. A Bonferroni method was used for adjustments for major effects (time of treatment and type of GOS). a, b Mean value with different letters means the differences among treatments was significantly different at p-value < 0.05. Unadjusted mean values n = 6. Pb: Prebiotics. Bs: Baseline like covariate.
Table 5. Concentration (mM) of lactic acid and short-chain fatty acids (SCFA) infant faecal samples after non-fructosylated α-GOS and β-GOS fermentation.
SCFA (mM)Controlα-GOSβ-GOSp-ValuesPooled SEM
Bs6 h24 hBs6 h24 hBs6 h24 hTPrebioticsT * PrebioticsBs
Acetate14.66921.640 a18.908 a10.80844.356 b45.752 b16.58733.463 b40.743 b0.6710.0010.6770.0842.313
Propionate3.1636.4916.1162.9159.1308.5223.9718.19610.0720.83902760.7460.0600.729
Butyrate3.4086.6644.9006.7276.9706.7727.5127.7198.1120.72807140.8310.0440.746
Iso-butyrate0.3070.6490.7640.2530.7000.7910.3390.5820.6240.5400.6050.9750.4120.067
Valerate1.1744.2284.7881.1392.2160.6071.1972.1022.2490.7790.0590.6780.0000.531
Iso-valerate0.3170.6350.8270.3030.7750.7190.2360.6020.6570.6820.8970.8060.0520.077
Formate0.6112.400 a2.447 a0.5233.651 b8.954 b0.7854.042 a, b3.115 a, b0.2580.0460.1170.3900.643
Succinate0.2651.0221.0220.4281.0650.9750.3541.0180.9690.8990.9980.9950.9670.182
Lactate0.2480.782 a0.500 a0.2113.908 b1.554 b0.3431.353 a, b0.559 a, b0.0280.0090.2250.0150.250
Outcomes were analyzed using a linear mixed model: repeat measure. A Bonferroni method was used for adjustments for major effects (time of treatment and type of GOS). a, b Mean value with different letters means that differences among treatments was significantly different at p-value < 0.05. Unadjusted mean values n = 8. Bs: Baseline like covariate. * Interaction among major effects.

