Effect of Sieve Particle Size and Blend Proportion on the Quality Properties of Peeled and Unpeeled Orange Fleshed Sweet Potato Composite Flours


Abstract
1. Introduction
2. Materials and Methods
2.1. Sweet Potato Samples
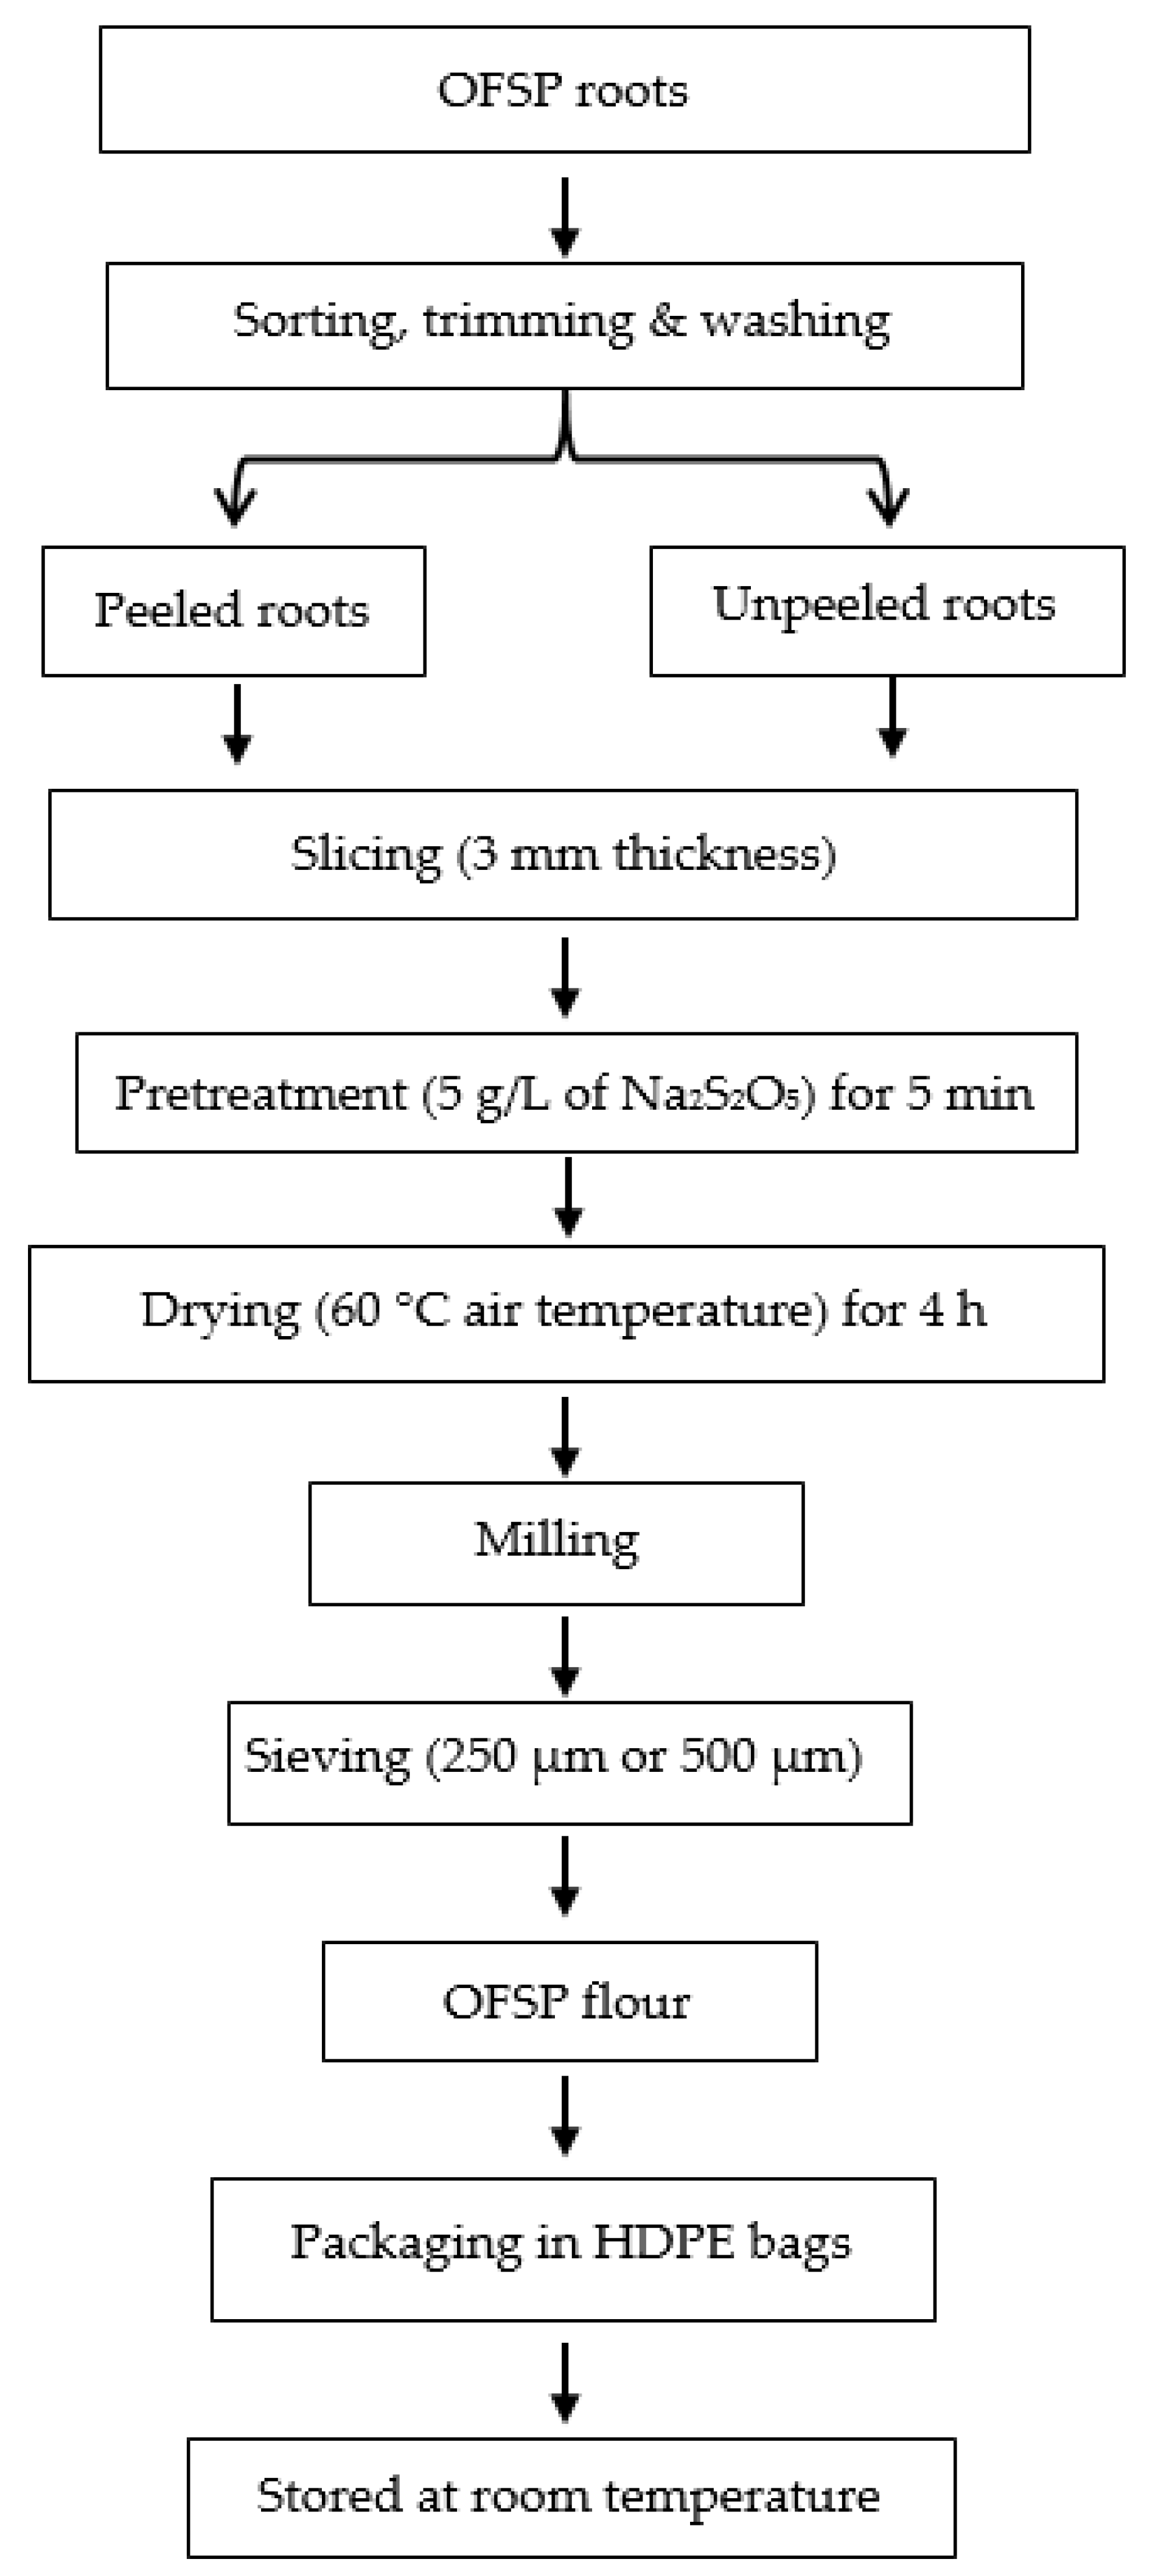
2.2. Orange Fleshed Sweet Potato Flour Processing
2.3. Preparation of Composite Flour of Different Particle Sizes
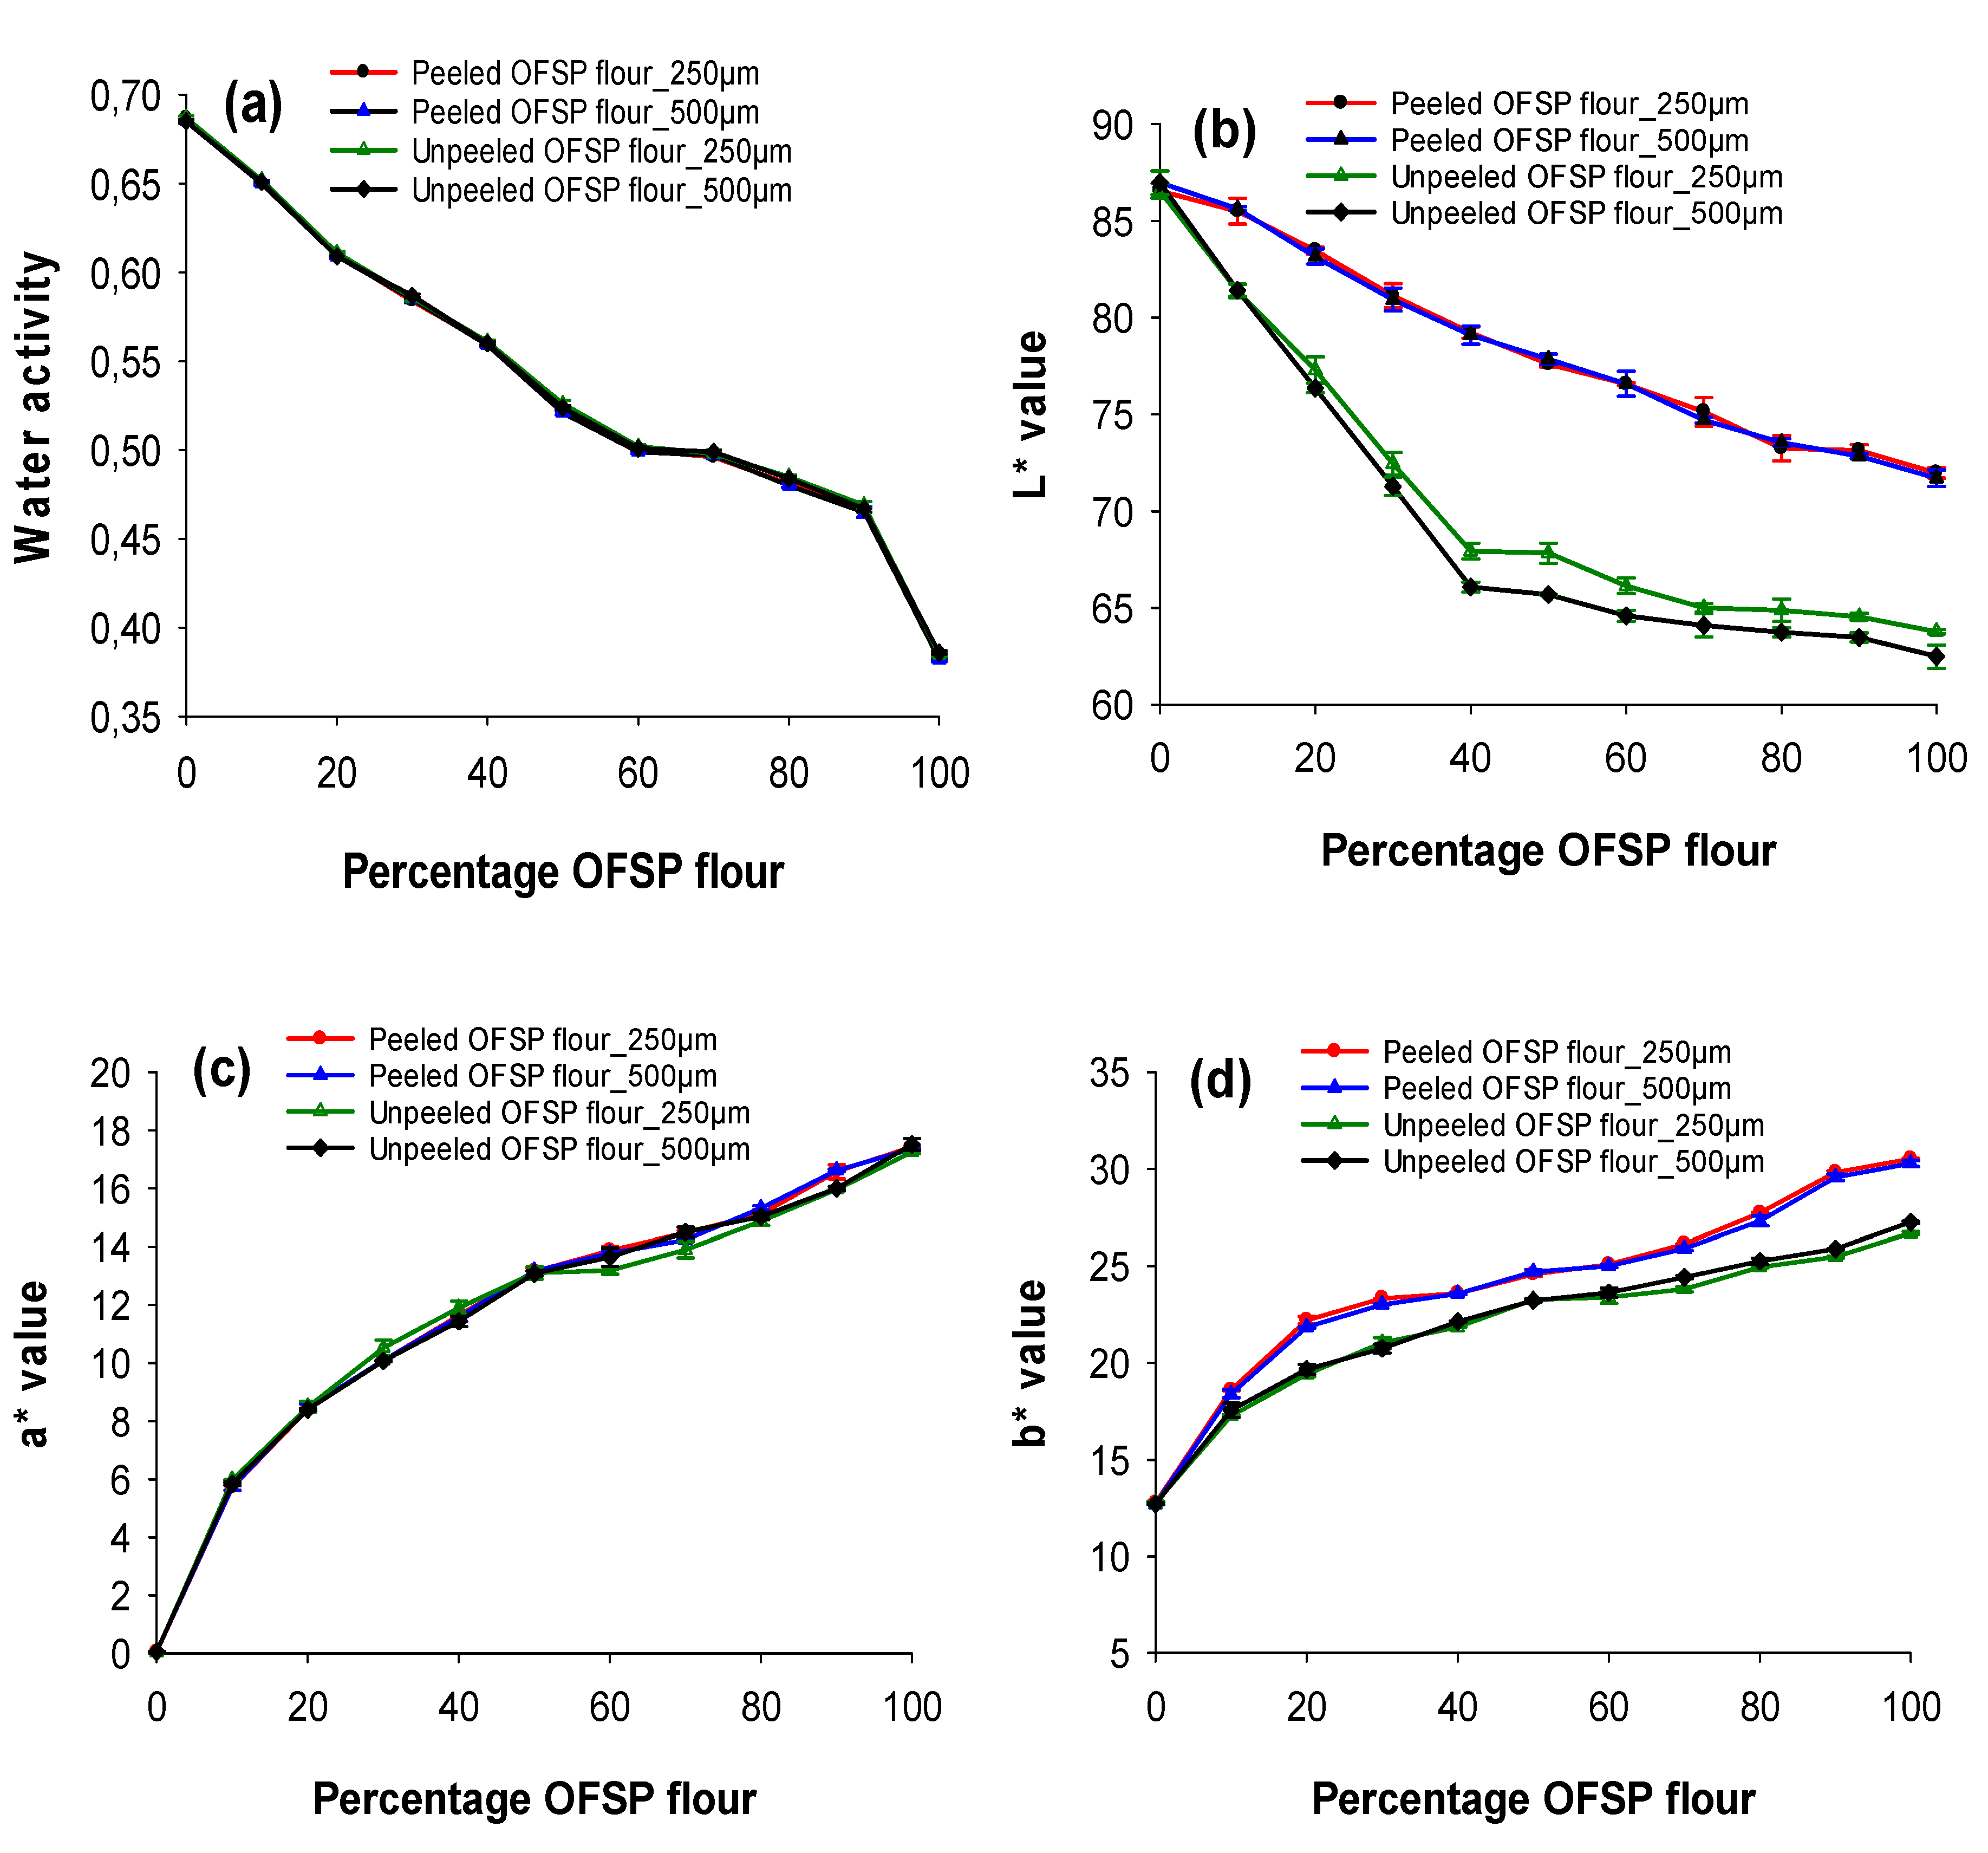
2.4. Measurement of Flour Water Activity and Colour
2.5. Determination of Proximate and Mineral Compositions
2.6. Determination of ß-carotene, Vitamin A and Ascorbic Acid
2.7. Analysis of Total Phenolic, Flavonoids and Total Antioxidant Activity
2.7.1. Sample Extraction
2.7.2. Total Phenolic Content
2.7.3. Total Flavonoid Content
2.7.4. Analysis of Total Antioxidant Activity
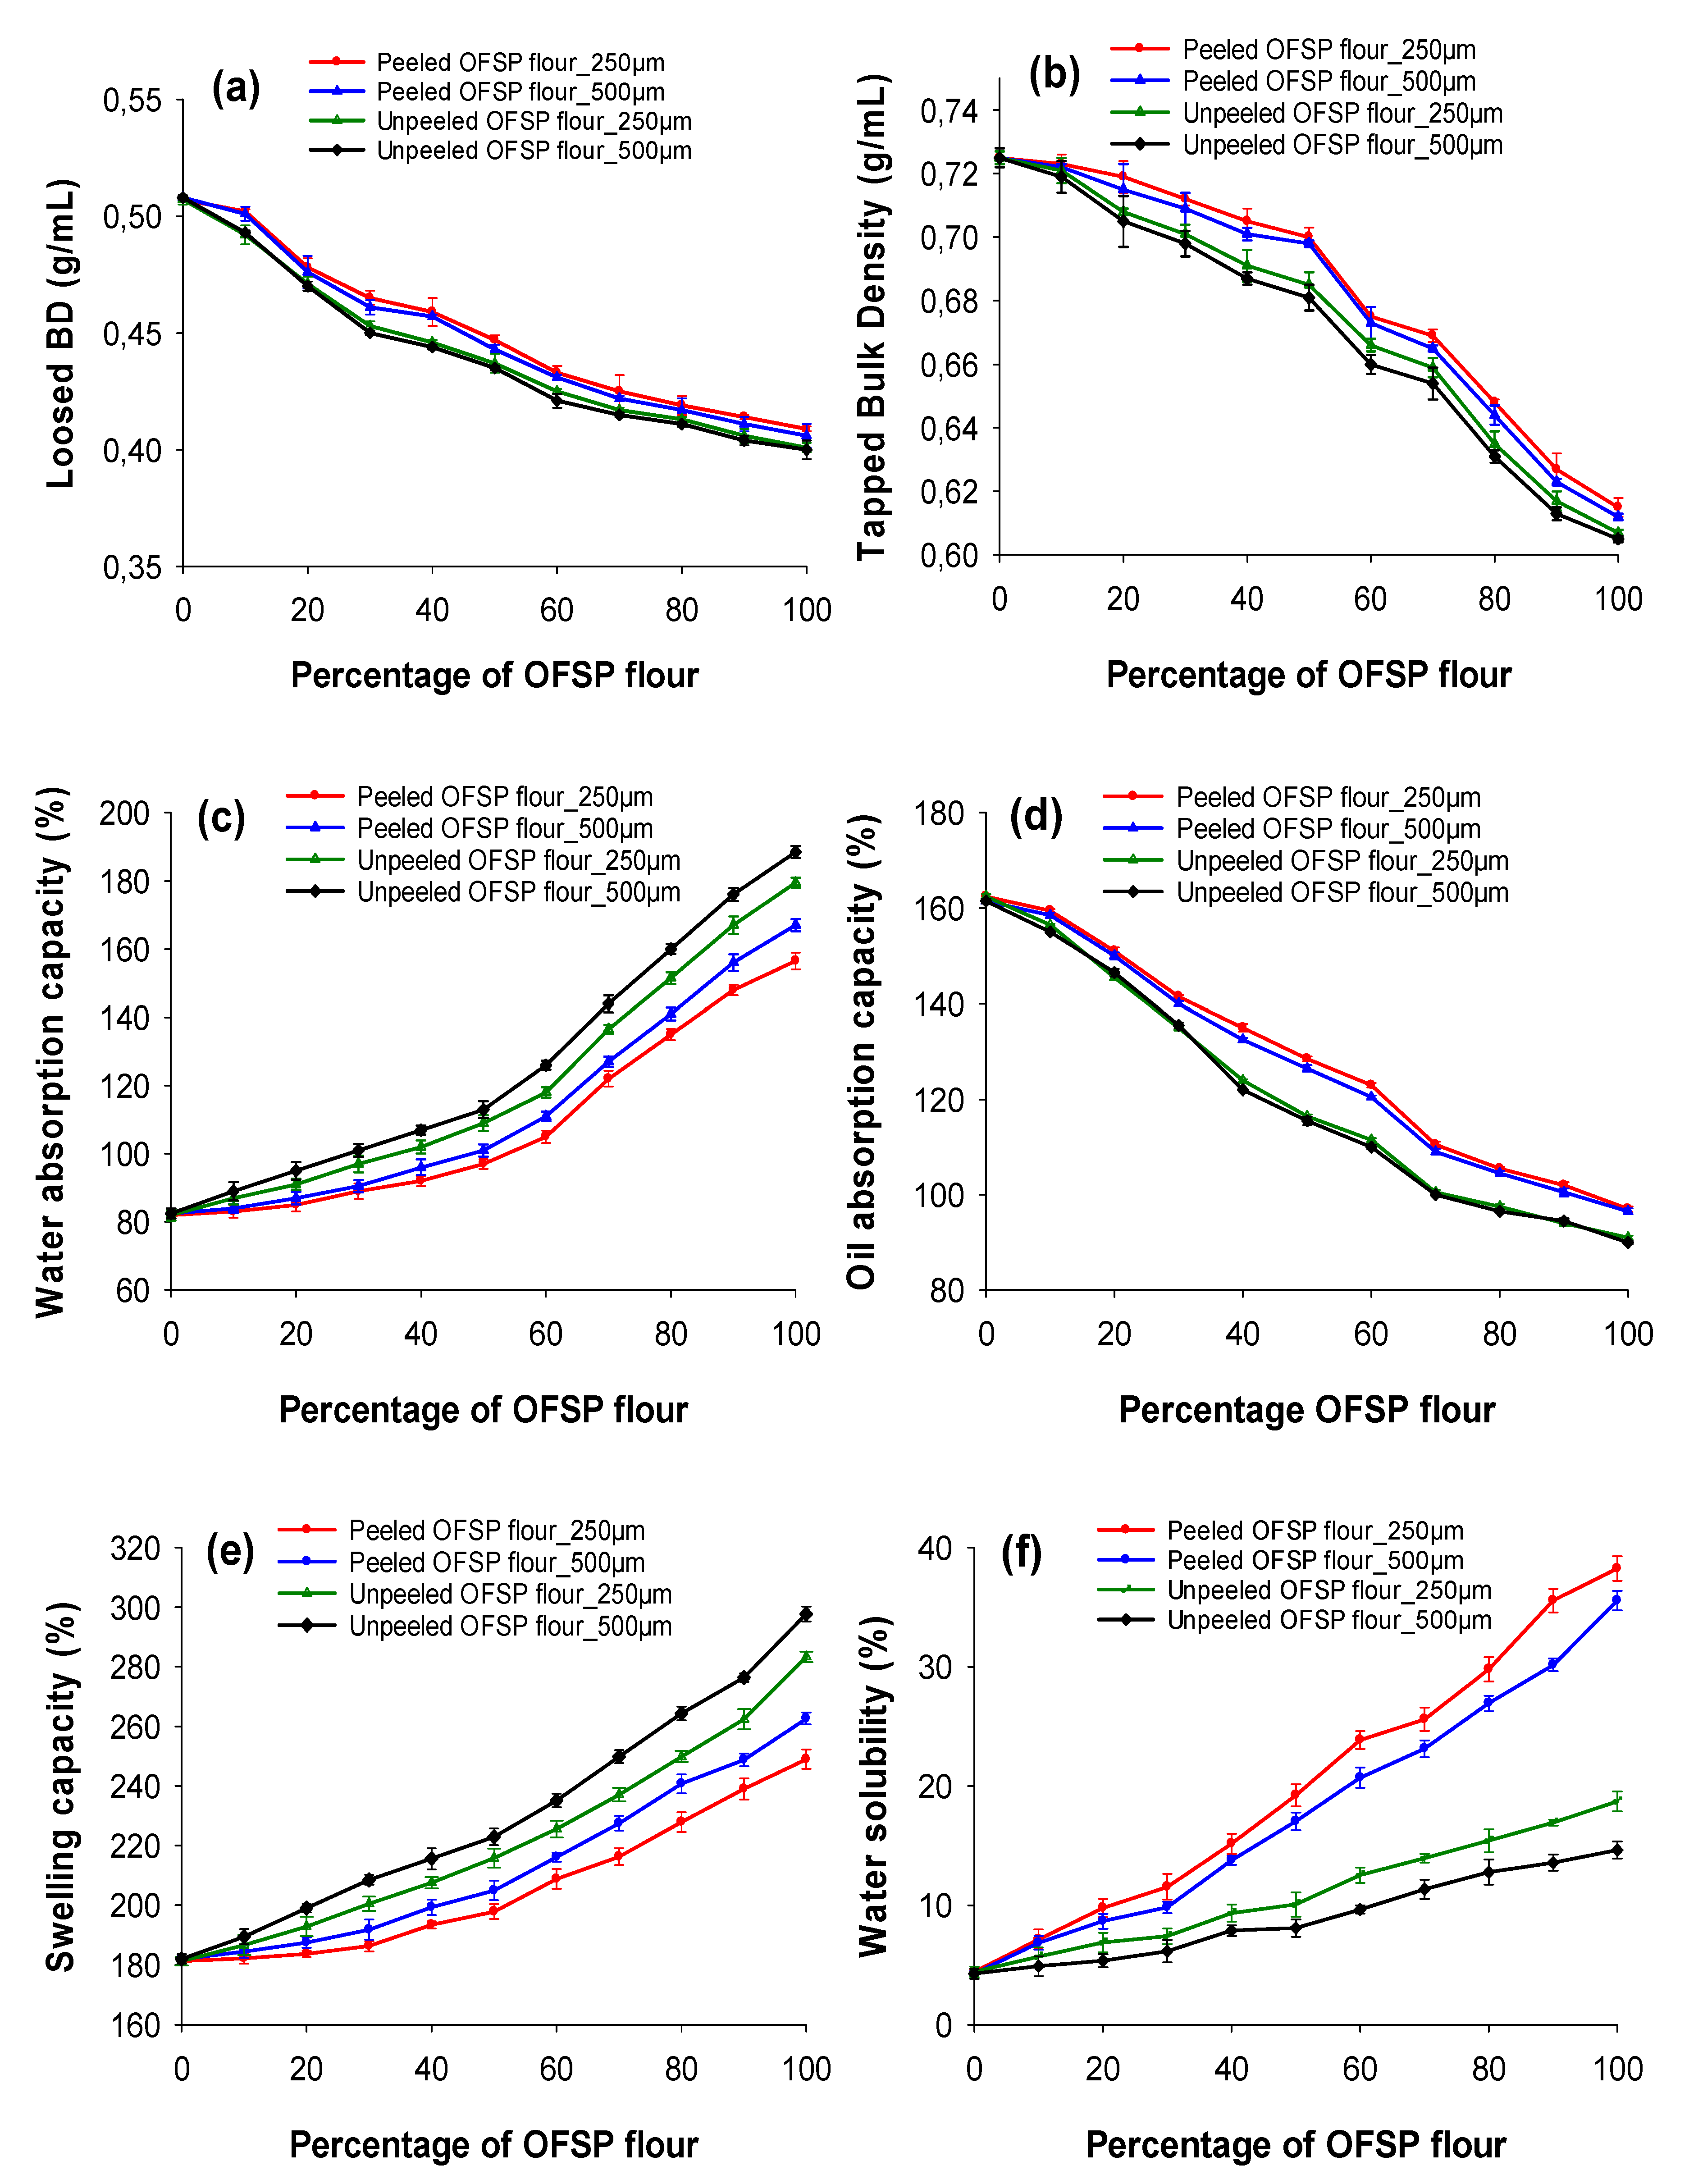
2.8. Determination of Flour Functional Properties
2.8.1. Loose and Packed Bulk Densities
2.8.2. Water Absorption Capacity
2.8.3. Oil Absorption Capacity
2.8.4. Swelling Capacity and Water Solubility
2.9. Analysis of Flour Pasting Properties
2.10. Statistical Analysis
3. Results and Discussion
3.1. Physical Properties of Peeled and Unpeeled OFSP Composite Flours
3.2. Proximate Composition and Energy Value of Peeled and Unpeeled OFSP Composite Flours
3.3. Mineral Composition of Peeled and Unpeeled OFSP Composite Flours
3.4. Bioactive Compounds and Total Antioxidant Activity in Peeled and Unpeeled OFSP Composite Flours
3.5. Functional Properties of Peeled and Unpeeled OFSP Composite Flours
3.6. Pasting Properties of Peeled and Unpeeled OFSP Composite Flours
4. Conclusions
Author Contributions
Funding
Acknowledgments
Conflicts of Interest
References
- FAO; IFAD; UNICEF; WFP; WHO. The State of Food Security and Nutrition in the World 2019: Safeguarding against Economic Slowdowns and Downturns; FAO: Rome, Italy, 2019. [Google Scholar] [CrossRef]
- ACPF. Lack of Will: Child Huunger in Africa; Afriacan Child Policy Forum: Addis Ababa, Ethiopia, 2019. Available online: https://www.africanchildforum.org/index.php/en/ (accessed on 16 October 2019).
- Ruttarattanamongkol, K.; Chittrakorn, S.; Weerawatanakorn, M.; Dangpium, N. Effect of drying conditions on properties, pigments and antioxidant activity retentions of pretreated orange and purple-fleshed sweet potato flours. J. Food Sci. Technol. 2016, 53, 1811–1822. [Google Scholar] [CrossRef]
- Van Hal, M. Quality of sweet potato flour during processing and storage. Food Rev. Int. 2000, 16, 1–37. [Google Scholar] [CrossRef]
- Haskell, M.J.; Jamil, K.M.; Hassan, F.; Peerson, J.M.; Hossain, M.I.; Fuchs, G.J.; Brown, K.H. Daily consumption of Indian spinach (Basella alba) or sweet potatoes has a positive effect on total-body vitamin A stores in Bangladeshi men. Am. J. Clin. Nutr. 2004, 80, 705–714. [Google Scholar] [CrossRef] [PubMed]
- Sebben, J.A.; Trierweiler, L.F.; Trierweiler, J.O. Orange-fleshed sweet potato flour obtained by drying in microwave and hot air. J. Food Process. Preserv. 2017, 4, 1–8. [Google Scholar] [CrossRef]
- Olatunde, G.O.; Henshaw, F.O.; Idowu, M.A.; Tomlins, K. Quality attributes of sweet potato flour as influenced by variety, pretreatment and drying method. Food Sci. Nutr. 2016, 4, 623–635. [Google Scholar] [CrossRef] [PubMed]
- Hamed, M.G.E.; Hussein, M.F.; Refai, F.Y.; EL-Samahy, S.K. Preparation and chemical composition of sweet potato flour. Cereal Chem. 1973, 50, 133–139. [Google Scholar]
- Liu, T.; Hou, G.G.; Lee, B.; Marquart, L.; Dubat, A. Effects of particle size on the quality attributes of reconstituted whole-wheat flour and tortillas made from it. J. Cereal Sci. 2016, 71, 145–152. [Google Scholar] [CrossRef]
- Martins, A.N.A.; Pasquali, M.A.d.B.; Schnorr, C.E.; Martins, J.J.A.; de Araujo, G.T.; Rocha, A.P.T. Development and characterization of blends formulated with banana peel and banana pulp for the production of blends powders rich in antioxidant properties. J. Food Sci. Technol. 2019, 56, 5289–5297. [Google Scholar] [CrossRef]
- Sturm, B.; Raut, S.; Chikpah, S.K.; Ndisya, J.; Hensel, O.; Esper, A.; Korese, J.K. Increase of nutritional security in Sub-Saharan Africa through the production of dried products from underutilized species. In Proceedings of the 22nd International Drying Symposium (IDS 2020), Worcester, MA, USA, 28 June–1 July 2020. (Accepted for publication). [Google Scholar]
- Gonçalves, E.M.; Pinheiro, J.; Abreu, M.; Brandão, T.R.S.; Silva, C.L.M. Modelling the kinetics of peroxidase inactivation, colour and texture changes of pumpkin (Cucurbita maxima L.) during blanching. J. Food Eng. 2007, 81, 693–701. [Google Scholar] [CrossRef]
- AOAC. Official Methods of Analysis of AOAC; AOAC: Arlington, VA, USA, 2005; p. 1050. [Google Scholar]
- FAO. Food Energy: Methods of Analysis and Conversion Factors: Report of a Technical Workshop. Rome, 3–6 December 2002; Food and Nutrition Paper 77; FAO: Rome, Italy, 2003. [Google Scholar]
- Negi, J.S.; Bisht, V.K.; Bhandari, A.K.; Sundriyal, R.C. Determination of mineral contents of Digitalis purpurea L. and Digitalis lanata Ehrh. J. Soil Sci. Plant Nutr. 2012, 12, 463–469. [Google Scholar] [CrossRef]
- Rodriguez-Amaya, D.B.; Kimura, M. HarvestPlus Handbook for Carotenoid Analysis, HarvestPlus Technical Monograph 2; International Food Policy Research Institute (IFPRI) and International Center for Tropical Agriculture (CIAT): Washington, DC, USA, 2004. [Google Scholar]
- Albrecht, J.A. Ascorbic Acid Content and Retention in Lettuce. J. Food Qual. 1993, 16, 311–316. [Google Scholar] [CrossRef]
- Mohammed, A.E.; Smit, I.; Pawelzik, E.; Keutgen, A.J.; Horneburg, B. Organically grown tomato (Lycopersicon esculentum Mill.): Bioactive compounds in the fruit and infection with Phytophthora infestans. J. Sci. Food Agric. 2012, 92, 1424–1431. [Google Scholar] [CrossRef] [PubMed]
- Li, Y.; Ma, D.; Sun, D.; Wang, C.; Zhang, J.; Xie, Y.; Guo, T. Total phenolic, flavonoid content, and antioxidant activity of flour, noodles, and steamed bread made from different colored wheat grains by three milling methods. Crop J. 2015, 3, 328–334. [Google Scholar] [CrossRef]
- Prieto, P.; Pineda, M.; Aguilar, M. Spectrophotometric quantitation of antioxidant capacity through the formation of a phosphomolybdenum complex: Specific application to the determination of Vitamin E1. Anal. Biochem. 1999, 269, 337–341. [Google Scholar] [CrossRef] [PubMed]
- Elkhalifa, A.E.O.; Schiffler, B.; Bernhardt, R. Effect of fermentation on the functional properties of sorghum flour. Food Chem. 2005, 92, 1–5. [Google Scholar] [CrossRef]
- Awolu, O.O. Optimization of the functional characteristics, pasting and rheological properties of pearl millet-based composite flour. Heliyon 2017, 3, e00240. [Google Scholar] [CrossRef] [PubMed]
- Jangchud, K.; Phimolsiripol, Y.; Haruthaithanasan, V. Physicochemical properties of sweet potato flour and starch as affected by blanching and processing. Starch/Staerke 2003, 55, 258–264. [Google Scholar] [CrossRef]
- Singh, S.; Riar, C.S.; Saxena, D.C. Effect of incorporating sweetpotato flour to wheat flour on the quality characteristics of cookies. Afr. J. Food Sci. 2008, 2, 65–72. [Google Scholar]
- Fana, H.; Shimelis, A.; Abrehet, F. Effects of pre-treatments and drying methods on chemical composition, microbial and sensory quality of orange-fleshed sweet potato flour and porridge. Am. J. Food Sci. Technol. 2015, 3, 82–88. [Google Scholar] [CrossRef]
- Kuyu, C.G.; Tola, Y.B.; Mohammed, A.; Ramaswamy, H.S. Determination of citric acid pretreatment effect on nutrient content, bioactive components, and total antioxidant capacity of dried sweet potato flour. Food Sci. Nutr. 2018, 6, 1724–1733. [Google Scholar] [CrossRef]
- Rodrigues, N.d.R.; Barbosa, J.L.; Barbosa, M.I.M.J. Determination of physico-chemical composition, nutritional facts and technological quality of organic orange and purple-fleshed sweet potatoes and its flours. Int. Food Res. J. 2016, 23, 2071–2078. [Google Scholar]
- Tumuhimbise, G.A.; Tumwine, G.; Kyamuhangire, W. Amaranth leaves and skimmed milk powders improve the nutritional, functional, physico-chemical and sensory properties of orange fleshed sweet potato flour. Foods 2019, 8, 13. [Google Scholar] [CrossRef] [PubMed]
- Brar, A.; Bhatia, A.K.; Pandey, V.; Kumari, P. Biochemical and phytochemical properties of potato: A Review. Chem. Sci. Rev. Lett. 2017, 6, 117–129. [Google Scholar]
- Prinyawiwatkul, W.; McWatters, K.H.; Beuchat, L.R.; Phillips, R.D. Functional characteristics of cowpea (Vigna unguiculata) flour and starch as affected by soaking, boiling, and fungal fermentation before milling. Food Chem. 1997, 58, 361–372. [Google Scholar] [CrossRef]
- Soria-Hernández, C.; Serna-Saldívar, S.; Chuck-Hernández, C. Physicochemical and functional properties of vegetable and cereal proteins as potential sources of novel food ingredients. Food Technol. Biotechnol. 2015, 53, 269–277. [Google Scholar] [CrossRef]
- Kolawole, F.L.; Akinwande, B.A.; Ade-Omowaye, B.I.O. Physicochemical properties of novel cookies produced from orange-fleshed sweet potato cookies enriched with sclerotium of edible mushroom (Pleurotus tuberregium). J. Saudi Soc. Agric. Sci. 2020, 19, 174–178. [Google Scholar] [CrossRef]
- Wang, S.; Li, C.; Copeland, L.; Niu, Q.; Wang, S. Starch retrogradation: A comprehensive review. Food Sci. Saf. 2015, 14, 568–585. [Google Scholar] [CrossRef]


| OFSP Flour Processing | Wheat: OFSP Flour (%) | Proximate Composition (g/100 gDM) | ||||||
|---|---|---|---|---|---|---|---|---|
| Moisture | Crude Protein | Fat | Crude Fiber | Ash | Carbohydrates | Energy (Kcal/100 g) | ||
| Peeled _ 250 μm sieve particle size | 100:0 | 11.52 ± 0.00a | 12.79 ± 0.03a | 1.62 ± 0.01a | 0.54 ± 0.03s | 1.10 ± 0.01q | 72.43 ± 0.24q | 355.42 ± 0.78op |
| 90:10 | 10.76 ± 0.03b | 12.43 ± 0.09ab | 1.49 ± 0.03abc | 0.71 ± 0.03rs | 1.19 ± 0.03opq | 73.42 ± 0.17p | 356.77 ± 0.25klmnop | |
| 80:20 | 10.14 ± 0.01c | 11.98 ± 0.13c | 1.37 ± 0.01cde | 0.77 ± 0.01pqr | 1.32 ± 0.01mnopq | 74.42 ± 0.15no | 357.87 ± 0.40fghijklmno | |
| 70:30 | 9.46 ± 0.01de | 11.23 ± 0.05ef | 1.29 ± 0.01cdefg | 0.86 ± 0.01pqr | 1.74 ± 0.01klm | 75.43 ± 0.20lm | 358.23 ± 0.23efghijklm | |
| 60:40 | 8.92 ± 0.00fg | 10.85 ± 0.01fgh | 1.16 ± 0.04efghij | 0.93 ± 0.03opq | 1.90 ± 0.00ijkl | 76.25 ± 0.03jk | 358.78 ± 0.37defghijkl | |
| 50:50 | 8.61 ± 0.03fg | 10.39 ± 0.08j | 1.09 ± 0.03ghijkl | 1.10 ± 0.01mno | 2.26 ± 0.01ghi | 76.55 ± 0.08jk | 357.57 ± 0.25fghijklmnop | |
| 40:60 | 7.02 ± 0.02hi | 9.77 ± 0.05kl | 1.03 ± 0.03ijklmn | 1.32 ± 0.04jkl | 2.50 ± 0.04efgh | 78.38 ± 0.01efg | 361.83 ± 0.08ab | |
| 30:70 | 6.18 ± 0.02jkl | 9.42 ± 0.04klm | 0.98 ± 0.01jklmnop | 1.66 ± 0.06gh | 2.75 ± 0.01cdef | 79.02 ± 0.41de | 362.58 ± 1.68a | |
| 20:80 | 6.12 ± 0.00klm | 8.65 ± 0.01n | 0.95 ± 0.02jklmnopq | 1.99 ± 0.01f | 3.00 ± 0.03abcd | 79.31 ± 0.17cd | 360.33 ± 0.46abcde | |
| 10:90 | 5.42 ± 0.02n | 7.93 ± 0.04o | 0.91 ± 0.01lmnopqrs | 2.18 ± 0.03de | 3.23 ± 0.01ab | 80.35 ± 0.06b | 361.25 ± 0.12abc | |
| 0:100 | 5.27 ± 0.02n | 7.54 ± 0.01opq | 0.87 ± 0.01mnopqrs | 2.45 ± 0.05bc | 3.40 ± 0.00a | 80.47 ± 0.02b | 359.89 ± 0.29bcdefg | |
| Peeled _ 500 μm sieve particle size | 100:0 | 11.51 ± 0.03a | 12.77 ± 0.11ab | 1.60 ± 0.01ab | 0.54 ± 0.01s | 1.10 ± 0.04q | 72.48 ± 0.37q | 355.40 ± 0.25p |
| 90:10 | 10.84 ± 0.01b | 12.39 ± 0.01b | 1.48 ± 0.01abc | 0.72 ± 0.01rs | 1.18 ± 0.03opq | 73.41 ± 0.08p | 356.48 ± 0.24lmnop | |
| 80:20 | 10.21 ± 0.01c | 11.94 ± 0.01cd | 1.35 ± 0.03cdef | 0.79 ± 0.01pqr | 1.31 ± 0.01nopq | 74.42 ± 0.13no | 357.57 ± 0.68fghijklmnop | |
| 70:30 | 9.55 ± 0.00d | 11.19 ± 0.06efg | 1.26 ± 0.02defgh | 0.89 ± 0.04pqr | 1.72 ± 0.07klmn | 75.41 ± 0.02lm | 357.66 ± 0.15fghijklmnop | |
| 60:40 | 9.00 ± 0.01efg | 10.81 ± 0.01ghi | 1.14 ± 0.04fghijk | 0.95 ± 0.02nop | 1.88 ± 0.03ijkl | 76.24 ± 0.14jk | 358.4 ± 0.16defghijklm | |
| 50:50 | 8.59 ± 0.01g | 10.34 ± 0.03j | 1.05 ± 0.01hijklmn | 1.15 ± 0.04lm | 2.25 ± 0.06hij | 76.63 ± 0.11ijk | 357.31 ± 0.41hijklmnop | |
| 40:60 | 7.26 ± 0.01h | 9.73 ± 0.04kl | 1.01 ± 0.02jklmno | 1.35 ± 0.06ijk | 2.47 ± 0.03fgh | 78.20 ± 0.07fg | 360.73 ± 0.37abcd | |
| 30:70 | 7.00 ± 0.01hi | 9.40 ± 0.11lm | 0.95 ± 0.01jklmnopq | 1.68 ± 0.04g | 2.73 ± 0.01cdef | 78.25 ± 0.03efg | 359.15 ± 0.55cdefghijk | |
| 20:80 | 6.61 ± 0.00ij | 8.63 ± 0.06n | 0.93 ± 0.01klmnopqr | 2.01 ± 0.03ef | 2.99 ± 0.02abcd | 78.84 ± 0.06def | 358.21 ± 0.36efghijklm | |
| 10:90 | 5.90 ± 0.05lm | 7.88 ± 0.04op | 0.89 ± 0.01lmnopqrs | 2.20 ± 0.01d | 3.20 ± 0.01ab | 79.94 ± 0.23bc | 359.27 ± 0.22cdefghij | |
| 0:100 | 5.28 ± 0.02n | 7.51 ± 0.01pq | 0.85 ± 0.03nopqrs | 2.49 ± 0.06abc | 3.37 ± 0.01a | 80.51 ± 0.06b | 359.71 ± 0.28bcdefgh | |
| Unpeeled_ 250 μm sieve particle size | 90:10 | 10.88 ± 0.01b | 11.94 ± 0.04cd | 1.38 ± 0.04bcd | 0.74 ± 0.01r | 1.13 ± 0.01q | 73.95 ± 0.06op | 355.94 ± 0.24mnop |
| 80:20 | 10.19 ± 0.03c | 11.56 ± 0.13de | 1.26 ± 0.02defgh | 0.81 ± 0.02pqr | 1.21 ± 0.03opq | 74.98 ± 0.03mn | 357.46 ± 0.19ghijklmnop | |
| 70:30 | 9.66 ± 0.06d | 10.71 ± 0.03hij | 1.10 ± 0.01ghijkl | 0.93 ± 0.03opq | 1.55 ± 0.01lmnop | 76.06 ± 0.12kl | 356.92 ± 0.43ijklmnop | |
| 60:40 | 9.07 ± 0.03ef | 10.43 ± 0.06ij | 1.04 ± 0.04hijklmn | 1.09 ± 0.06mno | 1.80 ± 0.04kl | 76.59 ± 0.26ijk | 357.36 ± 1.11hijklmnop | |
| 50:50 | 8.59 ± 0.01g | 9.80 ± 0.09k | 0.99 ± 0.02jklmnop | 1.2 ± 0.01klm | 2.10 ± 0.00hijk | 77.35 ± 0.09hi | 357.43 ± 0.54hijklmnop | |
| 40:60 | 7.36 ± 0.00h | 9.26 ± 0.08m | 0.93 ± 0.04klmnopqr | 1.48 ± 0.01hij | 2.34 ± 0.02fgh | 78.64 ± 0.32def | 359.93 ± 0.58bcdef | |
| 30:70 | 7.04 ± 0.00hi | 8.63 ± 0.11n | 0.86 ± 0.01mnopqrs | 1.79 ± 0.02g | 2.67 ± 0.04defg | 79.02 ± 0.07de | 358.32 ± 0.07defghijklm | |
| 20:80 | 6.62 ± 0.00ij | 7.48 ± 0.23q | 0.81 ± 0.01opqrs | 2.15 ± 0.05def | 2.89 ± 0.03bcde | 80.06 ± 0.18bc | 357.39 ± 0.64hijklmnop | |
| 10:90 | 6.47 ± 0.00jk | 6.73 ± 0.25r | 0.77 ± 0.03pqrs | 2.38 ± 0.01c | 3.11 ± 0.01abc | 80.55 ± 0.15b | 356.01 ± 0.14mnop | |
| 0:100 | 5.67 ± 0.01mn | 6.15 ± 0.21s | 0.72 ± 0.02rs | 2.61 ± 0.01ab | 3.25 ± 0.00ab | 81.60 ± 0.27a | 357.48 ± 0.04fghijklmnop | |
| Unpeeled_ 500 μm sieve particle size | 90:10 | 10.86 ± 0.01b | 11.91 ± 0.01cd | 1.35 ± 0.01cdef | 0.76 ± 0.01qr | 1.17 ± 0.01pq | 73.97 ± 0.18op | 355.63 ± 0.85nop |
| 80:20 | 10.21 ± 0.03c | 11.52 ± 0.08e | 1.23 ± 0.01defghi | 0.81 ± 0.03pqr | 1.25 ± 0.03opq | 74.99 ± 0.02mn | 357.07 ± 0.54ijklmnop | |
| 70:30 | 9.60 ± 0.02d | 10.69 ± 0.06hij | 1.08 ± 0.00ghijklm | 0.95 ± 0.01nop | 1.60 ± 0.02lmno | 76.10 ± 0.09jkl | 356.84 ± 0.39jklmnop | |
| 60:40 | 9.04 ± 0.01efg | 10.40 ± 0.02j | 1.01 ± 0.03ijklmno | 1.12 ± 0.03mn | 1.83 ± 0.00jkl | 76.85 ± 0.01hij | 358.05 ± 0.14efghijklmn | |
| 50:50 | 8.57 ± 0.00g | 9.78 ± 0.03kl | 0.97 ± 0.04jklmnopq | 1.23 ± 0.05klm | 2.13 ± 0.04hijk | 77.63 ± 0.11gh | 358.35 ± 0.07defghijklm | |
| 40:60 | 7.31 ± 0.03h | 9.22 ± 0.22m | 0.89 ± 0.03lmnopqrs | 1.50 ± 0.02hi | 2.37 ± 0.01fgh | 78.97 ± 0.28def | 360.73 ± 0.03abcd | |
| 30:70 | 7.05 ± 0.03hi | 8.59 ± 0.10n | 0.84 ± 0.01nopqrs | 1.81 ± 0.05g | 2.71 ± 0.01cdef | 79.36 ± 0.05cd | 359.30 ± 0.02cdefghi | |
| 20:80 | 6.61 ± 0.03ij | 7.41 ± 0.02q | 0.79 ± 0.00opqrs | 2.19 ± 0.02de | 2.91 ± 0.02bcde | 80.21 ± 0.14b | 357.57 ± 0.48fghijklmnop | |
| 10:90 | 6.42 ± 0.02jk | 6.70 ± 0.04r | 0.75 ± 0.03qrs | 2.43 ± 0.05c | 3.18 ± 0.01ab | 80.54 ± 0.06b | 355.67 ± 0.03nop | |
| 0:100 | 5.65 ± 0.00mn | 6.13 ± 0.02s | 0.70 ± 0.01s | 2.64 ± 0.00a | 3.27 ± 0.01ab | 81.61 ± 0.02a | 357.22 ± 0.13ijklmnop | |
| OFSP Flour Processing | Wheat: OFSP Flour (%) | Mineral Composition (mg/100 gDM) | |||||
|---|---|---|---|---|---|---|---|
| Ca | K | Mg | Fe | Na | Zn | ||
| Peeled _ 250 μm sieve particle size | 100:0 | 6.47s | 71.67u | 4.52n | 2.78t | 4.46a | 2.34a |
| 90:10 | 7.94r | 141.42s | 4.80mn | 2.96r | 4.40b | 1.63jklmn | |
| 80:20 | 9.34p | 207.92q | 4.99jklm | 3.15p | 4.31cd | 1.55mno | |
| 70:30 | 10.79n | 280.60o | 5.20ijklm | 3.38n | 4.23f | 1.43opq | |
| 60:40 | 12.26l | 346.72m | 5.37ij | 3.44lm | 4.11gh | 1.72ijk | |
| 50:50 | 13.61j | 413.87k | 5.59fghi | 3.61j | 4.03jkl | 1.89deg | |
| 40:60 | 15.03h | 482.21i | 5.84efgh | 3.78h | 3.98mno | 1.94d | |
| 30:70 | 16.50f | 552.56g | 5.92cdef | 3.85fg | 3.90qrs | 1.50nop | |
| 20:80 | 17.89e | 623.04e | 6.20abcde | 3.97c | 3.82vw | 1.26rst | |
| 10:90 | 19.35d | 689.66c | 6.37abc | 4.14b | 3.79wxy | 1.58klmn | |
| 0:100 | 20.96c | 757.96a | 6.58a | 4.24a | 3.72z | 1.32qrst | |
| Peeled _ 500 μm sieve particle size | 100:0 | 6.47s | 71.70u | 4.52n | 2.78t | 4.46a | 2.36a |
| 90:10 | 7.96r | 141.35s | 4.80mn | 2.98r | 4.40b | 1.70ijkl | |
| 80:20 | 9.35p | 207.87q | 5.00jklm | 3.17p | 4.32cd | 1.67ijklm | |
| 70:30 | 10.81n | 280.57o | 5.240ijklm | 3.41mn | 4.24ef | 1.58klmn | |
| 60:40 | 12.28l | 346.59m | 5.40hij | 3.48kl | 4.13g | 1.77ghij | |
| 50:50 | 13.67j | 413.85k | 5.61fghi | 3.63ij | 4.05ijk | 1.64jklmn | |
| 40:60 | 15.07h | 482.19i | 6.35abcd | 3.87ef | 3.99lmn | 1.35qrst | |
| 30:70 | 16.54f | 552.45g | 5.98bcdef | 3.92cde | 3.92pqr | 1.90deg | |
| 20:80 | 17.91e | 623.02e | 6.22abcde | 4.04b | 3.85tuw | 1.28rst | |
| 10:90 | 19.38d | 689.54c | 6.38abc | 4.18b | 3.80wx | 1.56lmno | |
| 0:100 | 20.94c | 757.94a | 6.61a | 4.26a | 3.74z | 1.39pqr | |
| Unpeeled_ 250 μm sieve particle size | 90:10 | 8.16q | 140.84t | 4.82lmn | 2.90s | 4.42ab | 2.15b |
| 80:20 | 9.76o | 205.63r | 5.02jklm | 3.06q | 4.33c | 2.00cd | |
| 70:30 | 11.39m | 279.45p | 5.28ijkl | 3.18p | 4.28de | 1.88degh | |
| 60:40 | 13.09k | 343.20n | 5.41hij | 3.27o | 4.14g | 1.87degh | |
| 50:50 | 14.75i | 410.36l | 5.60fghi | 3.39mn | 4.06ij | 1.24st | |
| 40:60 | 16.32g | 479.55j | 5.86efgh | 3.50k | 4.00lm | 1.57lmno | |
| 30:70 | 17.87e | 551.82h | 5.92cdef | 3.59j | 3.94opq | 1.35qrst | |
| 20:80 | 19.42d | 618.78f | 6.22abcde | 3.66i | 3.86stu | 1.79eghi | |
| 10:90 | 21.25b | 673.21d | 6.38abc | 3.81gh | 3.80wx | 1.28rst | |
| 0:100 | 22.78a | 756.76b | 6.63a | 3.92de | 3.75yz | 1.33qrst | |
| Unpeeled_ 500 μm sieve particle size | 90:10 | 8.17q | 140.82t | 4.83klmn | 2.91s | 4.41b | 2.13bc |
| 80:20 | 9.78o | 205.54r | 5.03jklm | 3.08q | 4.34c | 1.92de | |
| 70:30 | 11.41m | 279.40p | 5.30ijk | 3.19p | 4.28de | 1.74hij | |
| 60:40 | 13.12k | 343.10n | 5.44ghij | 3.29o | 4.13g | 1.70ijkl | |
| 50:50 | 14.77i | 410.33l | 5.62fghi | 3.40mn | 4.08hi | 1.97d | |
| 40:60 | 16.34g | 479.52j | 5.88defg | 3.52k | 4.01klm | 1.59klmn | |
| 30:70 | 17.92e | 551.76h | 5.97bcdef | 3.61j | 3.95nop | 1.21t | |
| 20:80 | 19.45d | 618.67f | 6.27abcde | 3.68i | 3.88rst | 1.64jklmn | |
| 10:90 | 21.27b | 673.16d | 6.41ab | 3.82gh | 3.82uvw | 1.29qrst | |
| 0:100 | 22.80a | 756.75b | 6.64a | 3.93cd | 3.76xyz | 1.37pqrs | |
| OFSP Flour Processing | Wheat: OFSP Flour (%) | Bioactive Compounds and TAA (per 100 gDM) | |||||
|---|---|---|---|---|---|---|---|
| Beta-Carotene (µg) | Vitamin A (µg RAE) | Ascorbic Acid (mg) | TPC (mg GAE) | TFC (mg CE) | TAA (mg AAE) | ||
| Peeled _250 μm sieve particle size | 100:0 | 3.5 ± 0.71u | 0.27 ± 0.01u | 5.90 ± 0.42r | 36.76 ± 0.62p | 29.00 ± 0.18t | 106.83 ± 1.47t |
| 90:10 | 1087.6 ± 5.66t | 83.62 ± 0.43t | 8.87 ± 0.37q | 47.82 ± 0.23o | 40.72 ± 0.74s | 114.68 ± 1.91st | |
| 80:20 | 1969.0 ± 5.56r | 151.47 ± 1.05r | 12.01 ± 0.18op | 56.51 ± 0.40mn | 41.69 ± 0.18s | 127.03 ± 1.66qr | |
| 70:30 | 2507.5 ± 5.66p | 192.85 ± 0.72p | 14.69 ± 0.33n | 69.06 ± 0.21jkl | 45.54 ± 0.22qr | 154.85 ± 1.75o | |
| 60:40 | 3248.0 ± 1.31n | 249.85 ± 0.86n | 18.86 ± 0.48jkl | 76.88 ± 0.55i | 49.17 ± 0.18nop | 167.08 ± 1.23n | |
| 50:50 | 3631.1 ± 8.38m | 279.31 ± 1.50m | 20.95 ± 0.27hij | 85.62 ± 0.38h | 53.38 ± 0.90m | 197.10 ± 1.96k | |
| 40:60 | 4417.4 ± 4.24k | 339.77 ± 0.34k | 23.89 ± 0.25fg | 93.79 ± 0.51g | 57.05 ± 0.52kl | 214.65 ± 2.74j | |
| 30:70 | 5078.0 ± 8.49i | 390.62 ± 0.69i | 26.15 ± 0.59e | 106.36 ± 0.84f | 64.11 ± 0.34ij | 231.33 ± 1.05i | |
| 20:80 | 5728.7 ± 9.50g | 440.62 ± 1.84g | 29.63 ± 0.17c | 121.81 ± 0.26e | 70.20 ± 0.19fg | 243.07 ± 1.96h | |
| 10:90 | 6359.0 ± 5.36f | 489.16 ± 2.72f | 32.60 ± 0.51b | 142.50 ± 0.92c | 74.64 ± 0.37de | 270.62 ± 1.16d | |
| 0:100 | 6910.5 ± 4.24d | 531.54 ± 0.58d | 35.72 ± 0.66a | 155.00 ± 0.79b | 79.50 ± 0.58bc | 322.58 ± 1.63b | |
| Peeled _500 μm sieve particle size | 100:0 | 3.5 ± 0.71u | 0.27 ± 0.01u | 5.86 ± 0.19r | 36.42 ± 0.27p | 29.16 ± 0.22t | 106.79 ± 1.58t |
| 90:10 | 1090.0 ± 2.83t | 83.85 ± 0.25t | 8.53 ± 0.25q | 47.96 ± 0.66o | 40.77 ± 0.19s | 115.46 ± 1.58st | |
| 80:20 | 1971.3 ± 4.24r | 151.62 ± 0.33r | 11.97 ± 0.38op | 57.15 ± 0.24m | 41.85 ± 0.24s | 127.90 ± 2.07qr | |
| 70:30 | 2513.9 ± 5.66p | 193.31 ± 0.44p | 14.38 ± 0.24n | 69.44 ± 0.213jk | 46.12 ± 0.33pqr | 155.83 ± 1.20o | |
| 60:40 | 3255.0 ± 1.80n | 250.39 ± 1.52n | 18.52 ± 0.16l | 77.29 ± 0.43i | 49.51 ± 0.29no | 168.25 ± 1.81n | |
| 50:50 | 3645.1 ± 5.46m | 280.39 ± 1.96m | 20.74 ± 0.51ijk | 86.13 ± 0.37h | 53.86 ± 0.47lm | 198.48 ± 1.41k | |
| 40:60 | 4421.5 ± 9.90k | 340.08 ± 0.76k | 23.66 ± 0.55g | 94.50 ± 0.48g | 57.40 ± 0.53k | 215.51 ± 1.99j | |
| 30:70 | 5093.0 ± 8.38i | 391.77 ± 1.08i | 26.08 ± 0.44e | 107.10 ± 0.95f | 64.55 ± 0.71hi | 232.95 ± 2.05i | |
| 20:80 | 5744.8 ± 7.07g | 441.85 ± 0.54g | 29.59 ± 0.77c | 122.73 ± 0.67e | 70.46 ± 0.26fg | 244.78 ± 1.54gh | |
| 10:90 | 6365.3 ± 4.31f | 489.62 ± 0.87f | 32.45 ± 0.38b | 143.25 ± 0.29c | 75.19 ± 0.43de | 272.56 ± 1.19d | |
| 0:100 | 6925.9 ± 2.63d | 532.69 ± 1.74d | 35.60 ± 0.64a | 154.08 ± 0.36b | 79.63 ± 0.37bc | 323.70 ± 1.27b | |
| Unpeeled _250 μm sieve particle size | 90:10 | 1179.8 ± 5.16s | 90.75 ± 0.47s | 6.34 ± 0.27r | 51.03 ± 0.25o | 41.23 ± 0.24s | 123.05 ± 1.65rs |
| 80:20 | 2307.5 ± 4.24q | 177.46 ± 0.30q | 8.71 ± 0.16q | 63.79 ± 0.37l | 43.59 ± 0.53rs | 135.72 ± 1.87pq | |
| 70:30 | 3152.5 ± 3.54o | 242.50 ± 0.27o | 10.65 ± 0.49pq | 73.41 ± 0.53ij | 47.27 ± 0.47opq | 165.50 ± 1.75n | |
| 60:40 | 3788.4 ± 8.49l | 291.39 ± 0.66l | 13.68 ± 0.25no | 85.67 ± 0.34h | 51.78 ± 0.23mn | 179.85 ± 1.10lm | |
| 50:50 | 4871.5 ± 6.97j | 374.70 ± 1.31j | 15.19 ± 0.11mn | 93.51 ± 0.22g | 56.91 ± 0.19kl | 211.47 ± 2.68j | |
| 40:60 | 5546.0 ± 2.53h | 426.62 ± 2.55h | 17.37 ± 0.27l | 103.49 ± 0.73f | 61.25 ± 0.62j | 229.82 ± 1.64i | |
| 30:70 | 6793.1 ± 6.87e | 522.54 ± 2.06e | 18.96 ± 0.18jkl | 119.88 ± 0.58e | 67.62 ± 0.17gh | 247.68 ± 1.67gh | |
| 20:80 | 7485.0 ± 8.38c | 575.77 ± 1.48c | 21.49 ± 0.25hi | 131.6 ± 0.27d | 73.01 ± 0.39ef | 260.25 ± 1.15ef | |
| 10:90 | 8562.5 ± 3.84b | 658.62 ± 1.37b | 23.64 ± 0.59g | 156.89 ± 0.63b | 77.45 ± 0.46cd | 289.74 ± 1.63c | |
| 0:100 | 9530.0 ± 3.11a | 733.08 ± 0.79a | 25.90 ± 0.18ef | 186.50 ± 0.11a | 81.70 ± 0.98ab | 334.67 ± 1.60a | |
| Unpeeled _500 μm sieve particle size | 90:10 | 1183.1 ± 5.66s | 91.00 ± 0.44s | 6.35 ± 0.17r | 51.47 ± 0.17no | 41.37 ± 0.13s | 127.11 ± 1.87qr |
| 80:20 | 2310.7 ± 9.90q | 177.69 ± 0.76q | 8.59 ± 0.24q | 64.13 ± 0.21kl | 43.91 ± 0.18rs | 140.47 ± 1.13p | |
| 70:30 | 3165.1 ± 2.21o | 243.47 ± 1.63o | 10.63 ± 0.19pq | 73.90 ± 0.27ij | 47.63 ± 0.25opq | 171.99 ± 1.58mn | |
| 60:40 | 3791.5 ± 5.66l | 291.62 ± 0.43l | 13.46 ± 0.27no | 86.21 ± 0.24h | 52.06 ± 0.16mn | 183.49 ± 2.96l | |
| 50:50 | 4880.0 ± 6.97j | 375.39 ± 1.31j | 15.07 ± 0.38mn | 94.07 ± 0.25g | 57.14 ± 0.67k | 215.43 ± 1.00j | |
| 40:60 | 5569.1 ± 8.30h | 428.39 ± 0.19h | 16.93 ± 0.53lm | 104.38 ± 0.59f | 61.58 ± 0.39ij | 233.45 ± 1.76i | |
| 30:70 | 6805.0 ± 9.90e | 523.46 ± 0.76e | 18.60 ± 0.45kl | 120.16 ± 0.27e | 68.45 ± 0.44g | 252.86 ± 1.47fg | |
| 20:80 | 7492.0 ± 8.38c | 576.31 ± 1.44c | 20.88 ± 0.58hij | 132.11 ± 0.61d | 73.89 ± 0.25e | 264.85 ± 1.95de | |
| 10:90 | 8635.0 ± 5.66b | 664.23 ± 0.84b | 22.97 ± 0.79gh | 157.30 ± 0.42b | 78.60 ± 0.14bc | 292.84 ± 1.39c | |
| 0:100 | 9570.0 ± 5.46a | 736.16 ± 1.96a | 25.10 ± 0.45efg | 187.18 ± 0.18a | 83.21 ± 0.16a | 335.82 ± 2.65a | |
| OFSP Flour Processing | Wheat: OFSP Flour (%) | Peak Viscosity (cP) | Trough Viscosity (cP) | Breakdown Viscosity (cP) | Final Viscosity (cP) | Setback Viscosity (cP) | Peak Time (min) | Pasting Temperature (°C) |
|---|---|---|---|---|---|---|---|---|
| Peeled_250 μm sieve particle size | 100:0 | 1501.0 ± 1.2a | 801.0 ± 1.5a | 700.0 ± 0.8a | 1858.0 ± 0.3a | 1057.0 ± 1.7a | 5.74 ± 0.01a | 86.52 ± 0.02a |
| 90:10 | 640.0 ± 1.1c | 232.5 ± 0.9c | 407.5 ± 0.4c | 620.5 ± 0.8c | 388.0 ± 0.8c | 5.01 ± 0.01c | 82.74 ± 0.01cd | |
| 80:20 | 422.0 ± 1.6e | 139.5 ± 1.4e | 282.5 ± 0.0d | 341.5 ± 0.7e | 202.0 ± 1.3e | 4.81 ± 0.01e | 82.45 ± 0.01d | |
| 70:30 | 289.5 ± 1.4g | 109.5 ± 1.2f | 180.0 ± 1.4f | 219.5 ± 0.4f | 110.0 ± 0.6f | 4.75 ± 0.01f | 82.33 ± 0.01d | |
| 60:40 | 234.0 ± 0.9j | 79.5 ± 0.7g | 154.5± 0.0gh | 139.5 ± 0.0g | 60.0 ± 0.3g | 4.36 ± 0.01h | 82.82 ± 0.02cd | |
| 50:50 | 208.5 ± 1.5l | 55.5 ± 1.2hi | 153.0 ± 0.0h | 93.5 ± 0.5i | 38.0 ± 0.8h | 4.17 ± 0.01jkl | 82.27 ± 0.01d | |
| 40:60 | 197.0 ± 1.7m | 51.5 ± 1.1jk | 145.5 ± 0.6i | 75.5 ± 0.5j | 24.0 ± 0.4ij | 4.11 ± 0.02no | 82.25 ± 0.00d | |
| 30:70 | 154.5 ± 2.2o | 45.0 ± 1.7m | 109.5 ± 0.7k | 67.5 ± 1.0k | 22.5 ± 0.3jk | 4.05 ± 0.00p | 82.24 ± 0.00d | |
| 20:80 | 149.0 ± 0.0pq | 38.5 ± 0.0opq | 110.5 ± 0.0k | 59.5 ± 0.7l | 21.0 ± 0.0k | 4.13 ± 0.01mn | 83.22 ± 0.01c | |
| 10:90 | 139.5 ± 1.8rs | 35.5 ± 0.9pqrs | 104.0 ± 0.0lm | 53.5 ± 0.3n | 18.0 ± 1.0l | 4.14 ± 0.01klmn | 83.98 ± 0.01b | |
| 0:100 | 98.0 ± 0.0v | 34.0 ± 0.2rs | 64.0 ± 0.0op | 50.0 ± 0.5o | 16.0 ± 0.0lm | 4.14 ± 0.00klmn | 83.98 ± 0.01b | |
| Peeled_500 μm sieve particle size | 100:0 | 1500.5 ± 0.8a | 800.5 ± 0.7a | 700.0 ± 0.4a | 1858 ± 0.3a | 1057.5 ± 0.6a | 5.73 ± 0.01a | 86.50 ± 0.00a |
| 90:10 | 639.0 ± 1.3c | 231.0 ± 0.8c | 408.0 ± 0.0c | 621.5 ± 0.3c | 390.5 ± 1.2c | 5.02 ± 0.01c | 82.73 ± 0.01cd | |
| 80:20 | 420.5 ± 1.4e | 139.0 ± 1.3e | 281.5 ± 0.4d | 342.0 ± 0.9e | 203.0 ± 0.8e | 4.83 ± 0.00de | 82.43 ± 0.00d | |
| 70:30 | 289.0 ± 0.0g | 108.5 ± 0.3f | 180.5 ± 0.3f | 221.0 ± 1.1f | 112.5 ± 0.7f | 4.76 ± 0.00f | 82.31 ± 0.01d | |
| 60:40 | 235.0 ± 0.8ij | 78.5 ± 0.0g | 156.5 ± 0.7g | 141.5 ± 0.8g | 63.0 ± 0.0g | 4.37 ± 0.01h | 82.81 ± 0.03cd | |
| 50:50 | 208.0 ± 0.0l | 54.5 ± 0.7hij | 153.5 ± 0.5h | 94.5 ± 0.0hi | 40.0 ± 0.3h | 4.17 ± 0.01ijk | 82.27 ± 0.00d | |
| 40:60 | 196.5 ± 1.0m | 50.5 ± 0.2kl | 146.0 ± 0.0i | 76.5 ± 0.6j | 26.0 ± 0.7i | 4.13 ± 0.01mn | 82.24 ± 0.01d | |
| 30:70 | 153.5 ± 1.6op | 44.5 ± 1.5mn | 109.0 ± 0.3kl | 69.0 ± 1.5k | 24.5 ± 0.7ij | 4.06 ± 0.01p | 82.22 ± 0.00d | |
| 20:80 | 148.0 ± 0.8q | 37.5 ± 0.0opqr | 110.5 ± 0.0k | 60.5 ± 0.7l | 23.0 ± 0.0jk | 4.14 ± 0.01klmn | 83.21 ± 0.01c | |
| 10:90 | 138.5 ± 0.7rs | 35.0 ± 0.6qrs | 103.5 ± 0.7m | 54.5 ± 0.9n | 19.5 ± 0.3l | 4.15 ± 0.01klmn | 83.95 ± 0.01b | |
| 0:100 | 96.5 ± 0.4v | 33.5 ± 0.0s | 63.0 ± 0.3p | 51.0 ± 0.0o | 17.5 ± 0.5lm | 4.15 ± 0.01klm | 83.97 ± 0.01b | |
| Unpeeled_250 μm sieve particle size | 90:10 | 742.0 ± 1.5b | 289.5 ± 1.3b | 452.5 ± 0.7b | 808.5 ± 0.6b | 519.0 ± 0.6b | 5.13 ± 0.01b | 82.41 ± 0.01d |
| 80:20 | 429.0 ± 1.3d | 143.5 ± 1.0d | 285.5 ± 1.4d | 359.5 ± 0.8d | 216.0 ± 0.5d | 5.01 ± 0.01c | 82.36 ± 0.01d | |
| 70:30 | 301.0 ± 1.1f | 111.5 ± 1.1f | 189.5 ± 1.1e | 222.5 ± 1.1f | 111.0 ± 0.4f | 4.87 ± 0.01d | 82.31 ± 0.01d | |
| 60:40 | 239.5 ± 2.0h | 81.5 ± 1.3g | 158.0 ± 0.0g | 142.0 ± 0.4g | 60.5 ± 0.7g | 4.41 ± 0.01g | 82.30 ± 0.01d | |
| 50:50 | 214.0 ± 1.4kl | 58.0 ± 1.4h | 156.0 ± 0.0gh | 95.5 ± 0.7hi | 37.5 ± 0.3h | 4.21 ± 0.01i | 82.25 ± 0.00d | |
| 40:60 | 199.0 ± 1.4m | 53.5 ± 1.2ijk | 145.5 ± 0.4i | 77.5 ± 0.5j | 24.0 ± 1.0ij | 4.14 ± 0.01klmn | 82.25 ± 0.01d | |
| 30:70 | 165.5 ± 0.7n | 47.0 ± 0.3lm | 118.5 ± 0.0j | 68.5 ± 0.6k | 21.5 ± 0.1k | 4.08 ± 0.01op | 82.23 ± 0.00d | |
| 20:80 | 152.0 ± 1.5pq | 41.0 ± 1.0no | 111.0 ± 0.0k | 61.5 ± 0.3l | 20.5 ± 0.3k | 4.14 ± 0.01klmn | 83.21 ± 0.01c | |
| 10:90 | 143.0 ± 1.2r | 39.0 ± 0.9op | 104.0 ± 0.3lm | 57.5 ± 0.2m | 18.5 ± 0.2l | 4.14 ± 0.01klmn | 83.96 ± 0.01b | |
| 0:100 | 108.5 ± 1.1t | 36.0 ± 1.1pqrs | 72.5 ± 0.7n | 51.0 ± 1.1o | 15.0 ± 0.0m | 4.14 ± 0.01klmn | 83.96 ± 0.0b | |
| Unpeeled_500 μm sieve particle size | 90:10 | 741.0 ± 1.1b | 288.5 ± 1.0b | 452.5 ± 1.2b | 809.5 ± 0.3b | 521.0 ± 0.6b | 5.13 ± 0.0b | 82.40 ± 0.00d |
| 80:20 | 428.5 ± 1.4d | 142.5 ± 1.4de | 286.0 ± 0.0d | 361.5 ± 0.7d | 219.0 ± 0.4d | 5.02 ± 0.00c | 82.35 ± 0.01d | |
| 70:30 | 299.0 ± 1.1f | 110.5 ± 0.8f | 188.5 ± 0.5e | 222.5 ± 0.9f | 112.0 ± 0.0f | 4.85 ± 0.01d | 82.29 ± 0.01d | |
| 60:40 | 235.5 ± 0.9hi | 80.0 ± 0.0g | 155.5 ± 0.0gh | 143.0 ± 1.4g | 63.0 ± 0.3g | 4.41 ± 0.01g | 82.28 ± 0.01d | |
| 50:50 | 211.0 ± 0.5kl | 56.5 ± 0.5hi | 154.5 ± 0.4gh | 97.5 ± 0.2h | 41.0 ± 0.9h | 4.20 ± 0.01ij | 82.23 ± 0.01d | |
| 40:60 | 197.5 ± 0.7m | 53.0 ± 0.4ijk | 144.5 ± 1.2i | 78.5 ± 0.4j | 25.5 ± 0.7ij | 4.13 ± 0.01lmn | 82.24 ± 0.01d | |
| 30:70 | 164.5 ± 1.0n | 45.5 ± 0.2m | 119.0 ± 1.4j | 67.5 ± 0.5k | 22.0 ± 0.0k | 4.07 ± 0.0p | 82.23 ± 0.01d | |
| 20:80 | 150.5 ± 0.8opq | 38.5 ± 0.7opq | 112.0 ± 0.0k | 59.5 ± 0.7l | 21.0 ± 0.2k | 4.13 ± 0.01lmn | 83.20 ± 0.00c | |
| 10:90 | 142.0 ± 1.5r | 37.0 ± 1.3pqrs | 105.0 ± 0.6lm | 56.5 ± 0.6m | 19.5 ± 0.5kl | 4.17 ± 0.0ijk | 83.93 ± 0.01b | |
| 0:100 | 106.5 ± 1.2t | 35.0 ± 1.1qrs | 71.5 ± 0.8n | 52.0 ± 1.1o | 17.0 ± 0.0lm | 4.12 ± 0.01mno | 83.90 ± 0.00b |
© 2020 by the authors. Licensee MDPI, Basel, Switzerland. This article is an open access article distributed under the terms and conditions of the Creative Commons Attribution (CC BY) license (http://creativecommons.org/licenses/by/4.0/).
Share and Cite
Chikpah, S.K.; Korese, J.K.; Hensel, O.; Sturm, B. Effect of Sieve Particle Size and Blend Proportion on the Quality Properties of Peeled and Unpeeled Orange Fleshed Sweet Potato Composite Flours. Foods 2020, 9, 740. https://doi.org/10.3390/foods9060740
Chikpah SK, Korese JK, Hensel O, Sturm B. Effect of Sieve Particle Size and Blend Proportion on the Quality Properties of Peeled and Unpeeled Orange Fleshed Sweet Potato Composite Flours. Foods. 2020; 9(6):740. https://doi.org/10.3390/foods9060740
Chicago/Turabian StyleChikpah, Solomon Kofi, Joseph Kudadam Korese, Oliver Hensel, and Barbara Sturm. 2020. "Effect of Sieve Particle Size and Blend Proportion on the Quality Properties of Peeled and Unpeeled Orange Fleshed Sweet Potato Composite Flours" Foods 9, no. 6: 740. https://doi.org/10.3390/foods9060740
APA StyleChikpah, S. K., Korese, J. K., Hensel, O., & Sturm, B. (2020). Effect of Sieve Particle Size and Blend Proportion on the Quality Properties of Peeled and Unpeeled Orange Fleshed Sweet Potato Composite Flours. Foods, 9(6), 740. https://doi.org/10.3390/foods9060740