Assessment of Healthy and Harmful Maillard Reaction Products in a Novel Coffee Cascara Beverage: Melanoidins and Acrylamide

 ,
,  ,
,  ,
,  and
and 
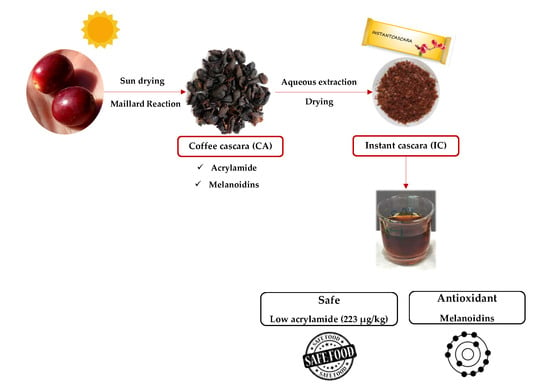
Abstract
:
1. Introduction
2. Materials and Methods
2.1. Food Samples
2.1.1. Raw Cascara
2.1.2. Homemade Instant Cascara
2.1.3. Commercial Cascara Infusion (Tabifruit)
2.2. Nutritional Characterization
2.2.1. Protein and Amino Acid Profile
2.2.2. Lipids and Fatty Acid Profile
2.2.3. Dietary Fiber
2.2.4. Sugars, Minerals and Vitamin C
2.2.5. Total Carbohydrates
2.2.6. Glucose
2.3. Maillard Reaction Products (MRP)
2.3.1. Acrylamide
2.3.2. Melanoidins
2.3.3. Antioxidants
Preliminary Information on Antioxidant Composition by Spectral Analysis
Phenolic Compounds
Total Anthocyanins
Overall Antioxidant Capacity
- ABTS
- FRAP
Contribution of Melanoidins to the Overall Antioxidant Properties of IC
2.4. Shelf Life Study Under Accelerated Storage Conditions of Liquid IC
Color
2.5. Statistical Analysis
3. Results and Discussion
3.1. Nutritional Characterization of CA
3.2. Characterization of IC
3.2.1. Nutritional Profile
3.2.2. Impact of MRP on Safety and Health Promoting Properties of IC
Safety
Antioxidant Properties
- Overall Antioxidant Capacity and Identification of Antioxidant Compounds
- Contribution of MRP to the Antioxidant Properties of IC
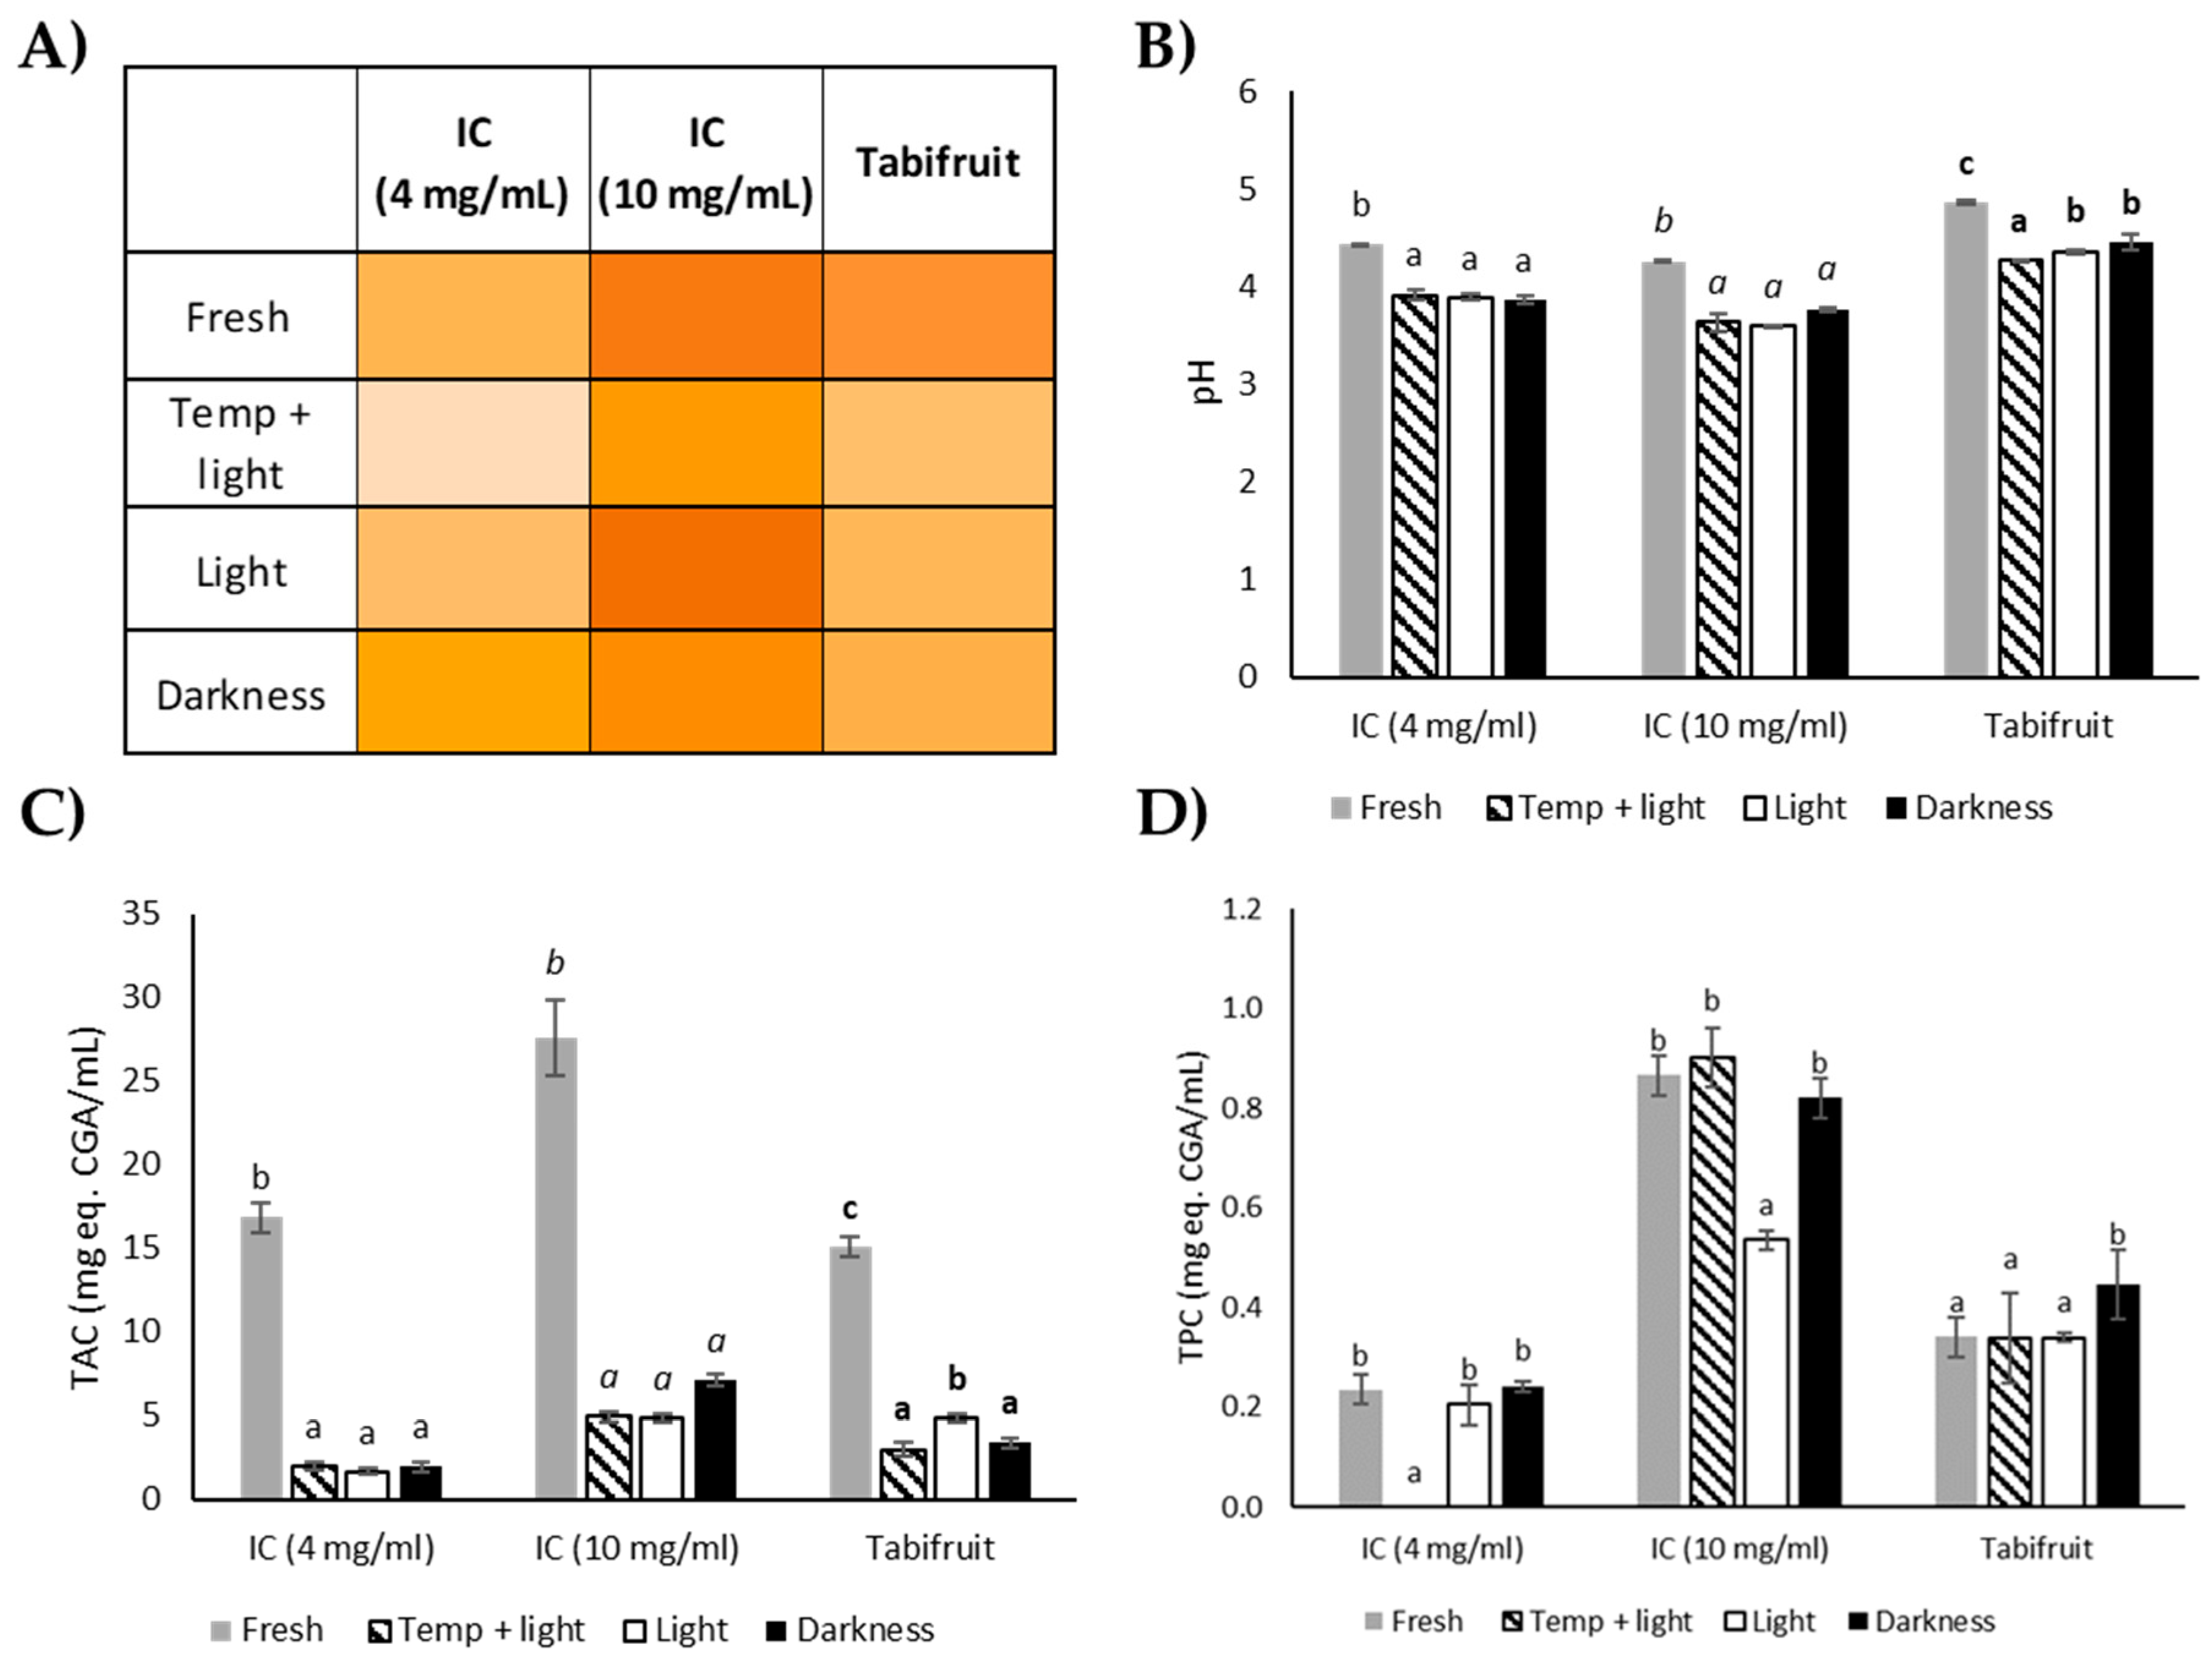
3.3. Shelf Life Study Under Accelerated Storage Conditions of Liquid IC
4. Conclusions
Supplementary Materials
Author Contributions
Funding
Acknowledgments
Conflicts of Interest
References
- Cagliero, C.; Ho, T.D.; Zhang, C.; Bicchi, C.; Anderson, J.L. Determination of acrylamide in brewed coffee and coffee powder using polymeric ionic liquid-based sorbent coatings in solid-phase microextraction coupled to gas chromatography-mass spectrometry. J. Chromatogr. A 2016, 1449, 2–7. [Google Scholar] [CrossRef]
- Tamanna, N.; Mahmood, N. Food Processing and Maillard Reaction Products: Effect on Human Health and Nutrition. Int. J. Food Sci. 2015, 2015, 526762. [Google Scholar] [CrossRef] [PubMed]
- Fogliano, V.; Morales, F.J. Estimation of dietary intake of melanoidins from coffee and bread. Food Funct. 2011, 2, 117–123. [Google Scholar] [CrossRef] [PubMed] [Green Version]
- Mesías, M.; Delgado-Andrade, C. Melanoidins as a potential functional food ingredient. Curr. Opin. Food Sci. 2017, 14, 37–42. [Google Scholar] [CrossRef]
- Iriondo-dehond, A.; Ramírez, B.; Escobar, F.V. Antioxidant properties of high molecular weight compounds from coffee roasting and brewing byproducts. Bioact. Compd. Health Dis. 2019, 2, 48–63. [Google Scholar] [CrossRef]
- Soares, C.M.D.; Alves, R.C.; Oliveira, M.B.P.P. Acrylamide in coffee. In Processing and Impact on Active Components in Food; Elsevier: Amsterdam, The Netherlands, 2015; pp. 575–582. ISBN 9780124047099. [Google Scholar]
- European Food Safety Authority Scientific Opinion on acrylamide in food. EFSA J. 2015, 13, 4104.
- Pedreschi, F.; Mariotti, M.S.; Granby, K. Current issues in dietary acrylamide: Formation, mitigation and risk assessment. J. Sci. Food Agric. 2014, 94, 9–20. [Google Scholar] [CrossRef]
- Esquivel, P.; Jiménez, V.M. Functional properties of coffee and coffee by-products. Food Res. Int. 2012, 46, 488–495. [Google Scholar] [CrossRef]
- Rios, M.B.; Iriondo-deHond, A.; Iriondo-deHond, M.; Herrera, T.; Velasco, D.; Gomez-Alonso, S.; Callejo, M.J.; del Castillo, M.D. Effect of coffee cascara dietary fiber on the physicochemical, nutritional and sensory properties of a gluten-free bread formulation. Molecules 2020, 25, 1358. [Google Scholar] [CrossRef] [Green Version]
- Sanz, M.L.; del Castillo, M.D.; Corzo, N.; Olano, A. Formation of amadori compounds in dehydrated fruits. J. Agric. Food Chem. 2001, 49, 5228–5231. [Google Scholar] [CrossRef]
- European Commission COMMISSION REGULATION (EU) 2017/2158 of 20 November 2017 establishing mitigation measures and benchmark levels for the reduction of the presence of acrylamide in food. Off. J. Eur. Union 2017, 204, 24–44.
- Martínez-Saez, N.; Del Castillo, M.D. Development of Sustainable Novel Foods and Beverages Based on Coffee By-Products for Chronic Diseases. Encycl. Food Secur. Sustain. 2018, 307–315. [Google Scholar] [CrossRef]
- Alves, R.C.; Rodrigues, F.; Nunes, M.A.A.; Vinha, A.F.; Oliveira, M.B.P.P. State of the art in coffee processing by-products. In Handbook of Coffee Processing By-Products: Sustainable Applications; Galanakis, C., Ed.; Academic Press-Elsevier: Burlington, MA, USA, 2017; pp. 1–26. ISBN 978-0-12-811290-8. [Google Scholar]
- Murthy, P.S.; Madhava Naidu, M. Sustainable management of coffee industry by-products and value addition—A review. Resour. Conserv. Recycl. 2012, 66, 45–58. [Google Scholar] [CrossRef]
- The European Parliament and The Council of the European Union Regulation (EU) 2015/2283 on novel foods. Off. J. Eur. Union 2015, 327, 1–22.
- EFSA Panel on Dietetic Products Guidance on the preparation and presentation of an application for authorisation of a novel food in the context of Regulation (EU) 2015/2283. EFSA J. 2016, 14, 11.
- Alaska Health Fair, I. How Much Sugar Is There in a Glass of a Powdered Mix Drink? Available online: https://alaskahealthfair.org/much-sugar-glass-powdered-mix-drink/ (accessed on 23 March 2020).
- Tahmassebi, J.F.; BaniHani, A. Impact of soft drinks to health and economy: A critical review. Eur. Arch. Paediatr. Dent. 2020, 21, 109–117. [Google Scholar] [CrossRef] [Green Version]
- del Castillo, M.D.; Ibañez, M.E.; Amigo, M.; Herrero, M.; Plaza del Moral, M.; Ullate, M. Application of Products of Coffee Silverskin in Anti-Ageing Cosmetics and Functional Food. WO 2013/004873 2013. Available online: https://digital.csic.es/handle/10261/92745 (accessed on 30 March 2020).
- Martinez-Saez, N.; Tamargo García, A.; Domínguez Pérez, I.; Rebollo-Hernanz, M.; Mesías, M.; Morales, F.J.; Martín-Cabrejas, M.A.; del Castillo, M.D. Use of spent coffee grounds as food ingredient in bakery products. Food Chem. 2017, 216, 114–122. [Google Scholar] [CrossRef] [PubMed]
- Sukhija, P.S.; Palmquist, D.L. Rapid method for determination of total fatty acid content and composition of feedstuffs and feces. J. Agric. Food Chem. 1988, 36, 1202–1206. [Google Scholar] [CrossRef]
- Iriondo-DeHond, A.; Cornejo, F.S.; Fernandez-Gomez, B.; Vera, G.; Guisantes-Batan, E.; Alonso, S.G.; Andres, M.I.S.; Sanchez-Fortun, S.; Lopez-Gomez, L.; Uranga, J.A.; et al. Bioaccesibility, metabolism, and excretion of lipids composing spent coffee grounds. Nutrients 2019, 11, 1411. [Google Scholar] [CrossRef] [PubMed] [Green Version]
- Iriondo-DeHond, A.; Rios, M.B.; Herrera, T.; Rodriguez-Bertos, A.; Nuñez, F.; San Andres, M.I.; Sanchez-Fortun, S.; del Castillo, M.D. Coffee silverskin extract: Nutritional value, safety and effect on key biological functions. Nutrients 2019, 11, 2693. [Google Scholar] [CrossRef] [PubMed] [Green Version]
- Masuko, T.; Minami, A.; Iwasaki, N.; Majima, T.; Nishimura, S.-I.; Lee, Y.C. Carbohydrate analysis by a phenol-sulfuric acid method in microplate format. Anal. Biochem. 2005, 339, 69–72. [Google Scholar] [CrossRef] [PubMed]
- Comite Europeen de Normalisation Food Analysis—Determination of Acrylamide in Food by Liquid Chromatography Tandem Mass Spectrometry (LC-ESI-MS/MS); Comite Europeen de Normalisation: Brussels, Belgium, 2015; EN 166182015.
- Mastovska, K.; Lehotay, S.J. Rapid Sample Preparation Method for LC−MS/MS or GC−MS Analysis of Acrylamide in Various Food Matrices. J. Agric. Food Chem. 2006, 54, 7001–7008. [Google Scholar] [CrossRef]
- Contini, M.; Baccelloni, S.; Massantini, R.; Anelli, G. Extraction of natural antioxidants from hazelnut (Corylus avellana L.) shell and skin wastes by long maceration at room temperature. Food Chem. 2008, 110, 659–669. [Google Scholar] [CrossRef]
- Wrolstad, R.E.; Giusti, M.M. Characterization and Measurement of Anthocyanins by UV-Visible Spectroscopy. Curr. Protoc. Food Anal. Chem. 2001, F1.2.1–F1.2.13. [Google Scholar] [CrossRef]
- Tsao, R.; Yang, R.; Young, C.; Zhu, H. Polyphenolic profiles in eight apple cultivars using high-performance liquid chromatography (HPLC). J. Agric. Food Chem. 2003, 51, 6347–6353. [Google Scholar] [CrossRef]
- Oki, T.; Nagai, S.; Yoshinaga, M.; Nishiba, Y.; Suda, I. Contribution of b-Carotene to Radical Scavenging Capacity Varies among Orange-fleshed Sweet Potato Cultivars. Food Sci. Technol. Res 2006, 12, 156–160. [Google Scholar] [CrossRef]
- Benzie, I.F.F.; Strain, J.J. The ferric reducing ability of plasma (frap) as a measure of ‘“ antioxidant power ”’: The FRAP assay. Anal. Biochem. 1996, 76, 70–76. [Google Scholar] [CrossRef] [Green Version]
- Manzocco, L.; Kravina, G.; Calligaris, S.; Nicoli, M.C. Shelf life modeling of photosensitive food: The case of colored beverages. J. Agric. Food Chem. 2008, 56, 5158–5164. [Google Scholar] [CrossRef]
- Sebastian Loncar Colorizer—Color Picker and Converter. Available online: http://colorizer.org/ (accessed on 20 March 2020).
- Adrianzén, G. Determinación De La Capacidad Antioxidante y Polifenoles Totales de la Cáscara Y Mucílago De La Especie Coffea Arábica L. Y Sus Posibles Usos. Bachelor’s Thesis, Universidad Nacional José Faustino Sánchez Carrión, Huacho, Peru, 2018. [Google Scholar]
- Alvarez, W. Evaluación De Rangos Del Espectro Caracterización Fisicoquímica De Cáscara De Café Para Alimentación Animal. Master’s Thesis, Universidad Nacional Toribio Rodríguez Mendoza de Amazonas, Chachapoyas, Peru, 2018. [Google Scholar]
- Tobón Arroyave, N.; Cerón Cárdenas, A.F.; Garcés Giraldo, L.F. Análisis y modelamiento de la granulometría en la cáscara del café (Coffea arabica L.) variedad Castillo. Producción+ Limpia 2015, 10, 80–91. [Google Scholar] [CrossRef] [Green Version]
- Pandey, A.; Soccol, C.R.; Nigam, P.; Brand, D.; Mohan, R.; Roussos, S. Biotechnological potential of coffee pulp and coffee husk for bioprocesses. Biochem. Eng. J. 2000, 6, 153–162. [Google Scholar] [CrossRef]
- Elías, L.G. Chemical composition of coffee-berry by-products. Coffee Pulp Compos. Technol. Util. 1979, 11–16. [Google Scholar]
- Heeger, A.; Kosińska-Cagnazzo, A.; Cantergiani, E.; Andlauer, W. Bioactives of coffee cherry pulp and its utilisation for production of Cascara beverage. Food Chem. 2016, 221, 969–975. [Google Scholar] [CrossRef] [PubMed]
- Janissen, B.; Huynh, T. Chemical composition and value-adding applications of coffee industry by-products: A review. Resour. Conserv. Recycl. 2018, 128, 110–117. [Google Scholar] [CrossRef]
- World Health Organization. Joint WHO-FAO expert consultation on diet, nutrition, and the prevention of chronic diseases, 2002, Geneva, Switzerland. WHO Tech. Rep. Ser. 2003, 916, 149. [Google Scholar]
- Urbaneja, G.; Ferrer, J.; Paez, G.; Arenas, L.; Colina, G. Acid hydrolysis and carbohydrates characterization of coffee pulp. Renew. Energy 1996, 9, 1041–1044. [Google Scholar] [CrossRef]
- Belliveau, D. The Coffee Cherry Co. Available online: https://coffeecherryco.com/ (accessed on 24 March 2020).
- Bernacchia, R.; Preti, R.; Vinci, G. Organic and conventional foods: Differences in nutrients. Ital. J. Food Sci. 2016, 28, 565–578. [Google Scholar]
- Ito, H.; Ueno, H.; Kikuzaki, H. Nutrition and dietetic practice free amino acid compositions for fruits. J. Nutr. Diet. Pr. 2017, 1, 1–5. [Google Scholar]
- Takaoka, M.; Okumura, S.; Seki, T.; Ohtani, M. Effect of amino-acid intake on physical conditions and skin state: A randomized, double-blind, placebo-controlled, crossover trial. J. Clin. Biochem. Nutr. 2019, 65, 52–58. [Google Scholar] [CrossRef]
- Turck, D.; Castenmiller, J.; De Henauw, S.; Hirsch-Ernst, K.I.; Kearney, J.; Knutsen, H.K.; Maciuk, A.; Mangelsdorf, I.; McArdle, H.J.; Naska, A.; et al. Guidance on the scientific requirements for health claims related to muscle function and physical performance: (Revision 1). EFSA J. 2018, 16. [Google Scholar]
- Regulation EC 1924 European Community (EC) No 1924/2006 of the European Parliament and of the Council of 20 December 2006 on nutrition and health claims made on foods. Off. J. Eur. Union 2006, 9–25.
- Chawla, R.; Patil, G.R. Soluble dietary fiber. Compr. Rev. Food Sci. Food Saf. 2010, 9, 178–196. [Google Scholar] [CrossRef]
- Koh, A.; De Vadder, F.; Kovatcheva-Datchary, P.; Bäckhed, F. From dietary fiber to host physiology: Short-chain fatty acids as key bacterial metabolites. Cell 2016, 165, 1332–1345. [Google Scholar] [CrossRef] [PubMed] [Green Version]
- The european commission commission regulation (EU) No 432/2012. Off. J. Eur. Union 2012, 13.
- European council council directive of 24 September 1990 on nutrition labelling for foodstuffs (90/496/ EEC). Off. J. Eur. Union 1990, 18–63.
- Hasanah, U.; Setyowati, M.; Efendi, R.; Safitri, E.; Idroes, R.; Heng, L.Y.; Sani, N.D. Isolation of Pectin from coffee pulp Arabica Gayo for the development of matrices membrane. IOP Conf. Ser. Mater. Sci. Eng. 2019, 523, 12–14. [Google Scholar] [CrossRef]
- USDA (United States Department of Agriculture USA) FoodData Central. Available online: https://fdc.nal.usda.gov/fdc-app.html#/?query=hemp (accessed on 25 March 2020).
- Porto, A.C.V.; Freitas-Silva, O.; de Souza, E.F.; Gottschalk, L.M.F. Effect of asparaginase enzyme in the reduction of asparagine in green coffee. Beverages 2019, 5, 32. [Google Scholar] [CrossRef] [Green Version]
- Onishi, Y.; Prihanto, A.A.; Yano, S.; Takagi, K.; Umekawa, M.; Wakayama, M. Effective treatment for suppression of acrylamide formation in fried potato chips using L-asparaginase from Bacillus subtilis. 3 Biotech 2015, 5, 783–789. [Google Scholar] [CrossRef] [Green Version]
- Atanda, S. A Fungi and mycotoxins in stored foods. Afr. J. Microbiol. Res. 2011, 5, 4373–4382. [Google Scholar] [CrossRef]
- Iriondo-DeHond, A.; Aparicio García, N.; Velazquez Escobar, F.; San Andres, M.I.; Sanchez-Fortun, S.; Blanch, G.P.; Fernandez-Gomez, B.; Guisantes Batan, E.; del Castillo, M.D. Validation of coffee by-products as novel food ingredients. Innov. Food Sci. Emerg. Technol. 2019, 51, 194–204. [Google Scholar] [CrossRef] [Green Version]
- European Food Safety Authority (EFSA) Scientific Opinion on the safety of caffeine. EFSA J. 2015, 13, 1–21.
- del Castillo, M.D.; Iriondo-DeHond, A.; Martinez-Saez, N.; Fernandez-Gomez, B.; Iriondo-DeHond, M.; Zhou, J.-R. Chapter 6—Applications of recovered compounds in food products. In Handbook of Coffee Processing By-Products; Academic Press-Elsevier: London, UK, 2017; pp. 171–194. ISBN 9780128112908. [Google Scholar]
- Murthy, P.S.; Naidu, M.M. Recovery of phenolic antioxidants and functional compounds from coffee industry by-products. Food Bioprocess Technol. 2012, 5, 897–903. [Google Scholar] [CrossRef]
- Karadeniz, F.; Durst, R.W.; Wrolstad, R.E. Polyphenolic composition of raisins. J. Agric. Food Chem. 2000, 48, 5343–5350. [Google Scholar] [CrossRef]
- Murthy, P.S.; Manjunatha, M.R.; Sulochannama, G.; Naidu, M.M. Characterization and bioactivity of coffee anthocyanins. Eur. J. Biol. Sci. 2012, 4, 13–19. [Google Scholar]
- Prata, E.R.; Oliveira, L.S. Fresh coffee husks as potential sources of anthocyanins. LWT Food Sci. Technol. 2007, 40, 1555–1560. [Google Scholar] [CrossRef]
- Belay, A.; Gholap, A. Characterization and determination of chlorogenic acids (CGA) in coffee beans by UV-Vis spectroscopy. Afr. J. Pure Appl. Chem. 2009, 3, 234–240. [Google Scholar]
- Tores de la Cruz, S.; Iriondo-DeHond, A.; Herrera, T.; Lopez-Tofiño, Y.; Galvez-Robleño, C.; Prodanov, M.; Velazquez-Escobar, F.; Abalo, R.; del Castillo, M.D. An assessment of the bioactivity of coffee silverskin melanoidins. Foods 2019, 8, 68. [Google Scholar] [CrossRef] [Green Version]
- Delgado-Andrade, C.; Rufián-Henares, J.A.; Morales, F.J. Assessing the antioxidant activity of melanoidins from coffee brews by different antioxidant methods. J. Agric. Food Chem. 2005, 53, 7832–7836. [Google Scholar] [CrossRef] [Green Version]
- Pastoriza, S.; Rufián-Henares, J.A. Contribution of melanoidins to the antioxidant capacity of the Spanish diet. Food Chem. 2014, 164, 438–445. [Google Scholar] [CrossRef]
- Bravo, J.; Juániz, I.; Monente, C.; Caemmerer, B.; Kroh, L.W.; De Peña, M.P.; Cid, C. Evaluation of spent coffee obtained from the most common coffeemakers as a source of hydrophilic bioactive compounds. J. Agric. Food Chem. 2012, 60, 12565–12573. [Google Scholar] [CrossRef]
- Torres-Valenzuela, L.S.; Martínez, K.G.; Serna-Jimenez, J.A.; Hernández, M.C. Secado de pulpa de café: Condiciones de proceso, modelación matemática y efecto sobre propiedades fisicoquímicas. Inf. Tecnológica 2019, 30, 189–200. [Google Scholar] [CrossRef] [Green Version]
- Royle, L.; Radcliffe, C.M. Analysis of caramels by capillary electrophoresis and ultrafiltration. J. Sci. Food Agric. 1999, 79, 1709–1714. [Google Scholar] [CrossRef]
- Nicoli, M.C.; Calligaris, S.; Manzocco, L. Shelf-life testing of coffee and related products: Uncertainties, pitfalls, and perspectives. Food Eng. Rev. 2009, 1, 159–168. [Google Scholar] [CrossRef]
- Manzocco, L.; Lagazio, C. Coffee brew shelf life modelling by integration of acceptability and quality data. Food Qual. Prefer. 2009, 20, 24–29. [Google Scholar] [CrossRef]
- Malvais, R. Estudio De Vida De Anaquel En Bebidas Saborizadas. Bachelor’s Thesis, Universidad Autonóma del Estado de México, Cuernavaca, Mexico, 2017. [Google Scholar]
- Marete, E.N.; Jacquier, J.C.; O’Riordan, D. Feverfew as a source of bioactives for functional foods: Storage stability in model beverages. J. Funct. Foods 2011, 3, 38–43. [Google Scholar] [CrossRef]
- Michalska, A.; Wojdyło, A.; Brzezowska, J.; Majerska, J.; Ciska, E. The influence of inulin on the retention of polyphenolic compounds during the drying of blackcurrant juice. Molecules 2019, 24, 4167. [Google Scholar] [CrossRef] [Green Version]

| CA | IC | |||
|---|---|---|---|---|
| Total Protein (%) | 9.55 ± 0.11 b | 6.25 ± 0.27 a | ||
| Amino Acids (mg/g) | Free | Total | Free | Total |
| Aminobutyric acid (GABA) | N.D. | N.A. | 0.3 ± 0.00 | N.A. |
| Glutamic acid (Glu) | N.D. | 2.13 ± 0.04 a | 0.40 ± 0.01 | 2.11 ± 0.17 a |
| Alanine (Ala) | N.D. | 2.06 ± 0.11 a | 2.27 ± 0.01 | 2.44 ± 0.05 a |
| Arginine (Arg) | N.D. | 0.48 ± 0.03 a | 1.39 ± 0.02 | 1.05 ± 0.04 b |
| Asparagine (Asp) | N.D. | 2.84 ± 0.14 a | 1.91 ± 0.05 | 7.79 ± 0.37 b |
| Cysteine (Cis) | N.D. | 0.18 ± 0.00 a | 0.17 ± 0.01 | 0.22 ± 0.02 a |
| Phenylalanine (Phe) | N.D. | 0.98 ± 0.10 a | 0.17 ± 0.01 | 0.31 ± 0.01 a |
| Glycine (Gly) | N.D. | 2.71 ± 0.17 a | 0.30 ± 0.27 | 1.19 ± 0.04 a |
| Histidine (His) | N.D. | 0.52 ± 0.10 b | 0.08 ± 0.01 | 0.16 ± 0.01 a |
| Isoleucine (Ile) | N.D. | 0.63 ± 0.05 b | 0.05 ± 0.00 | 0.18 ± 0.04 a |
| Leucine (Leu) | N.D. | 1.17 ± 0.03 b | 0.05 ± 0.01 | 0.27 ± 0.04 a |
| Lysine (Lys) | N.D. | 0.38 ± 0.01 a | 0.03 ± 0.01 | 0.21 ± 0.01 a |
| Methionine (Met) | N.D. | 0.25 ± 0.02 a | N.D. | 0.07 ± 0.04 a |
| Proline (Pro) | N.D. | 1.60 ± 0.01 a | 6.77 ± 0.02 | 4.82 ± 0.12 b |
| Serine (Ser) | N.D. | 1.91 ± 0.02 a | 5.71 ± 0.01 | 2.08 ± 0.05 a |
| Tyrosine (Tyr) | N.D. | 0.63 ± 0.05 a | N.D. | 0.68 ± 0.01 a |
| Tryptophan (Trp) | N.D. | N.A. | N.D. | N.A. |
| Threonine (Thr) | N.D. | 0.96 ± 0.03 b | 0.05 ± 0.01 | 0.35 ± 0.02 a |
| Valine (Val) | N.D. | 1.27 ± 0.02 a | 0.30 ± 0.01 | 0.60 ± 0.07 a |
| Totals (mg/g) | N.D. | 25.05 ± 0.16 a | 20.43 ± 0.37 | 29.78 ± 1.97 b |
| EAA (% total) | N.D. | 32.07 ± 0.07 b | 10.19 ± 0.01 | 13.04 ± 0.25 a |
| BCAA (Val + Leu + Ile) (% total) | N.D. | 14.83 ± 0.10 b | 1.92 ± 0.01 | 4.28 ± 0.14 a |
| AAA (Phe + Tyr + Trp) (% total) | N.D. | 7.77 ± 0.15 b | 0.8 ± 0.01 | 4.03 ± 0.00 a |
| CA | IC | |
|---|---|---|
| Total Fat (%) | 2.00 ± 0.50 b | 0.58 ± 0.18 a |
| Fatty Acid Profile (g/100 g) | ||
| C12:0 | 0.10 ± 0.02 a | N.D a |
| C14:0 | 1.18 ± 0.02 a | 5.77 ± 0.41 b |
| C15:0 | 0.37 ± 0.01 a | 4.02 ± 0.59 a |
| C16:0 | 36.02 ± 0.32 a | 30.54 ± 3.27 b |
| C16:1n7 | 3.04 ± 0.19 a | 3.90 ± 0.23 a |
| C17:0 | 0.56 ± 0.01 a | N.D b |
| C18:0 | 5.64 ± 0.22 a | 4.54 ± 0.37 a |
| C18:1n7c | 1.79 ± 0.05 a | N.D b |
| C18:1n9c | 6.72 ± 0.37 a | 10.82 ± 1.80 a |
| C18:2n6c | 21.80 ± 0.34 a | 15.83 ± 1.00 a |
| C18:3n3 | 17.37 ± 0.24 a | 14.84 ± 1.46 a |
| C20:0 | 2.82 ± 0.07 a | N.D a |
| C20:1n9 | 0.09 ± 0.00 a | N.D a |
| C20:2n6 | 0.09 ± 0.00 a | N.D a |
| C20:3n3 | 0.19 ± 0.04 a | N.D a |
| C20:5n3 | N.D a | N.D a |
| C21:0/C20:3n6 * | 0.10 ± 0.01 a | N.D a |
| C22:0 | 0.64 ± 0.04 a | N.D b |
| C22:6n3 | 0.76 ± 0.60 a | 9.74 ± 5.54 a |
| C23:0 | 0.16 ± 0.02 a | N.D a |
| C24:0/C22:5n3 * | 0.57 ± 0.00 a | N.D b |
| SFA (%) | 47.48 ± 0.10 a | 44.87 ± 4.65 a |
| MUFA (%) | 11.64 ± 0.12 a | 14.72 ± 1.57 a |
| PUFA (%) | 40.88 ± 0.02 a | 40.41 ± 3.08 a |
| IC (4 mg/mL) | IC (10 mg/mL) | Tabifruit | |
|---|---|---|---|
| Nutrients | |||
| Total carbohydrates (g/100 mL) | 27.50 ± 0.07 b | 47.48 ± 0.20 c | 22.22 ± 0.06 a |
| Glucose (g/100 mL) | 0.04 ± 0.01 b | 0.05 ± 0.01 c | 0.02 ± 0.01 a |
| Antioxidants | |||
| Total phenolic content (mg eq. CGA/mL) | 0.25 ± 0.0 a | 0.89 ± 0.0 c | 0.37 ± 0.0 b |
| Anthocyanins | N.D. | N.D. | N.D. |
| ABTS (mg eq. CGA/mL) | 16.82 ± 0.9 b | 27.58 ± 2.3 c | 15.05 ± 0.6 a |
| FRAP (mg eq. CGA/mL) | 0.15 ± 0.0 a | 0.43 ± 0.0 c | 0.34 ± 0.0 b |
| IC (4 mg/mL) | IC (10 mg/mL) | Tabifruit | ||||
|---|---|---|---|---|---|---|
| HMW | LMW | HMW | LMW | HMW | LMW | |
| ABTS | 61.25 ± 0.49 b | 0.92 ± 0.01 a | 82.85 ± 0.19 d | 0.92 ± 0.00 a | 66.68 ± 0.48 c | 0.93 ± 0.00 a |
| FRAP | 0.61 ± 0.08 b | 0.12 ± 0.00 a | 1.08 ± 0.02 d | 0.25 ± 0.01 a | 0.90 ± 0.09 c | 0.14 ± 0.00 a |
© 2020 by the authors. Licensee MDPI, Basel, Switzerland. This article is an open access article distributed under the terms and conditions of the Creative Commons Attribution (CC BY) license (http://creativecommons.org/licenses/by/4.0/).
Share and Cite
Iriondo-DeHond, A.; Elizondo, A.S.; Iriondo-DeHond, M.; Ríos, M.B.; Mufari, R.; Mendiola, J.A.; Ibañez, E.; del Castillo, M.D. Assessment of Healthy and Harmful Maillard Reaction Products in a Novel Coffee Cascara Beverage: Melanoidins and Acrylamide. Foods 2020, 9, 620. https://doi.org/10.3390/foods9050620
Iriondo-DeHond A, Elizondo AS, Iriondo-DeHond M, Ríos MB, Mufari R, Mendiola JA, Ibañez E, del Castillo MD. Assessment of Healthy and Harmful Maillard Reaction Products in a Novel Coffee Cascara Beverage: Melanoidins and Acrylamide. Foods. 2020; 9(5):620. https://doi.org/10.3390/foods9050620
Chicago/Turabian StyleIriondo-DeHond, Amaia, Ana Sofía Elizondo, Maite Iriondo-DeHond, Maria Belén Ríos, Romina Mufari, Jose A. Mendiola, Elena Ibañez, and Maria Dolores del Castillo. 2020. "Assessment of Healthy and Harmful Maillard Reaction Products in a Novel Coffee Cascara Beverage: Melanoidins and Acrylamide" Foods 9, no. 5: 620. https://doi.org/10.3390/foods9050620
APA StyleIriondo-DeHond, A., Elizondo, A. S., Iriondo-DeHond, M., Ríos, M. B., Mufari, R., Mendiola, J. A., Ibañez, E., & del Castillo, M. D. (2020). Assessment of Healthy and Harmful Maillard Reaction Products in a Novel Coffee Cascara Beverage: Melanoidins and Acrylamide. Foods, 9(5), 620. https://doi.org/10.3390/foods9050620