Article

Valorisation of Grape Stems as a Source of Phenolic Antioxidants by Using a Sustainable Extraction Methodology

1
Institute of Food Science Research (CIAL), Universidad Autónoma de Madrid (CEI, UAM-CSIC), 28049 Madrid, Spain
2
IMDEA-Food Institute, Campus de Cantoblanco, 28049 Madrid, Spain
*
Author to whom correspondence should be addressed.
Foods 2020, 9(5), 604; https://doi.org/10.3390/foods9050604
Submission received: 7 April 2020 / Revised: 2 May 2020 / Accepted: 4 May 2020 / Published: 8 May 2020
(This article belongs to the Special Issue The Health Benefits of the Bioactive Compounds in Foods)

Abstract

:
Pressurized liquid extraction with ethanol:water mixtures was proposed for obtaining phenolic antioxidants from grape stems. The optimal extraction conditions were elucidated by using a central composite rotatable design (solvent (X1, 0–100% ethanol:water v/v), temperature (X2, 40–120 °C) and time (X3, 1–11 min)). Response surface methodology determined 30% ethanol:water, 120 °C and 10 min as the optimal extraction conditions regarding total phenolic content (TPC) (185.3 ± 2.9 mg gallic acid/g of extract) and antioxidant activity (3.55 ± 0.21 mmol Trolox/g, 1.22 ± 0.06 mmol Trolox/g and 1.48 ± 0.17 mmol Trolox/g of extract in ABTS, DPPH and ORAC methodologies, respectively). The antioxidant activity was attributed to total polymer procyanidins and flavan-3-ol monomers and oligomers, although other phenolic compound contributions should not be ruled out. Forty-two phenolic compounds were identified in the optimal extract, mainly polymer procyanidins and, to a lesser extent, monomers and oligomers of flavan-3-ols, quercetin-3-O-glucuronide, ε-viniferin, gallic and caftaric acid. Ethyl gallate, ellagic acid, protocatechuic aldehyde, delphinidin-7-O-glucoside and cyanidin-3-O-glucoside were reported for the first time in grape stem extracts. In conclusion, this study highlights the use of this winery side stream as a source of antioxidants within a sustainable food system.

Graphical Abstract

1. Introduction

Nowadays, there is increasing concern about the sustainability of food production, including an environmentally friendly use of food by-products. In this context, one of the main goals of FAO is the promotion of sustainable food systems [1]. Accordingly, the exploitation of vegetable by-products as a source of bioactive compounds represents a promising opportunity to obtain added-value products for food or pharma industries. Particularly, wine production generates thousands of tons of solid organic waste, where grape stems represent up to 5% (w/w) of the processed grapes, being approximately 25% of the total by-products generated by the wine industry [2].
Whereas several studies have been focused on Vitis vinifera L. grape skins and seeds, less attention has been paid to grape stems as source of useful bioproducts [3,4]. Research papers focused on stem phenolic composition pointed out the presence of a high content of flavan-3-ol monomers (catechin and epicatechin) and, to a lesser extent, stilbenes (mainly resveratrol and ε-viniferin), as well as different phenolic acids and flavonols [5,6,7]. These compounds are known for their important biological activities; therefore, the use of stem by-products as a source of bioactive compounds has become a great opportunity to obtain functional ingredients in a sustainable way [4,8]. Nevertheless, there is a lack of studies with a comprehensive description of the phenolic composition of grape stem extracts. Thus, some studies are only focused on stilbene compounds [9,10], flavan-3-ol composition [11], their main phenolic constituents [3,6], or other specific groups [12,13]. However, there is scarce information about the proanthocyanidin fraction [12,14].
Extraction procedure is an important step to consider in recovery of bioactive compounds from plant sources. As conventional solid–liquid extraction (SLE) procedures usually have different drawbacks (such as long extraction time, intensive labour procedures, large volumes of solvents needed, and low extraction yields), many alternative techniques have been emerged in the last two decades [15]. In this regard, pressurized liquid extraction (PLE), ultrasound assisted extraction (UAE), microwave assisted extraction (MAE) and supercritical fluid extraction (SFE) have been proposed for extraction of bioactive compounds. Specifically, PLE has been used for extraction of phenolic compounds from a wide range of plant materials, e.g., hops, aromatic plants, grapes, as well as microalgae. Methanol, water, ethanol, acetone or their aqueous mixtures have been commonly used up to 170 °C in a light- and oxygen-free environment, with a greater efficiency than SLE procedures [16,17]. Development of an extraction methodology implies the establishment of optimal extraction conditions for a specific compound or group of compounds. For this purpose, the use of experimental designs, along with response surface methodology (RSM), has been proposed as a useful tool that enables the analysis of the influence of different extraction factors and allows reducing the number of experimental trials. Accordingly, it has been successfully used for improving phenolic extraction procedures from vegetable materials [12,13].
Regarding grape stem by-products, SLE with organic solvents has been commonly used for extraction of phenolic compounds [18]. However, alternative extraction techniques such as UAE [19], SFE [20], MAE [21] and PLE [22] have been scarcely studied. Moreover, only a few studies have focused on the use of green solvents, such as pure sub- and supercritical ethanol [23] or aqueous-ethanol mixtures with conventional SLE [12,13].
Therefore, to the best of our knowledge, a green extraction procedure based on the application of PLE to extraction of phenolic antioxidants from grape stems has not been established yet. Moreover, the relationship between phenolic composition and antioxidant activity should be established.
Hence, the aim of the present study was to develop a sustainable extraction procedure for valorisation of grape stems as a source of phenolic antioxidant compounds by using PLE and ethanol:water mixtures as green solvents. For this purpose, an experimental design along with RSM was used to optimize the extraction procedure (extraction solvent, temperature and time). Additionally, an extensive analysis of the phenolic composition of the extracts was done.

2. Materials and Methods

2.1. Chemicals and Reagents

Acetonitrile and formic acid, HPLC quality, were supplied by Labscan (Dublin, Ireland) and Acros Organic (Belgium), respectively. Protocatechuic acid, vanillic acid, syringic acid, caffeic acid, p-coumaric acid, 3-coumaric acid, ethyl gallate, 3,5,4’-trihydroxystilbene-3-O-β-d-glucoside (trans-piceid), (+)-catechin, (−)-epicatechin, epicatechin gallate, procyanidin B1, procyanidin B2, procyanidin B3, quercetin-3-O-galactoside, quercetin-3-O-rutinoside, quercetin-3-O-glucuronide, quercetin-3-O-glucoside, quercetin dihydrate, delphinidin-3-O-glucoside, cyanidin-3-O-glucoside and malvidin-3-O-glucoside were purchased from Extrasynthèse (Genay, France). Gallic acid, 4-hydroxybenzoic acid, trans-caftaric acid, trans-ferulic acid, ellagic acid, protocatechuic aldehyde, trans-resveratrol, 6-hydroxy-2,5,7,8-tetramethylchromane-2-carboxylic acid (Trolox), potassium persulfate, 2,2’-azinobis(3-ethylbenzothiazoline-6-sulphonic acid) diammonium salt (ABTS), 2,2-diphenyl-1-picrylhydrazyl (DPPH), 1 M phosphate buffer, fluorescein sodium and 2,2’-azobis(2-methylpropionamidine) dihydrochloride (AAPH) were obtained from Sigma-Aldrich (Madrid, Spain). Disodium carbonate, Folin–Ciocalteu reagent, methanol and ethanol were from Panreac (Barcelona, Spain).

2.2. Plant Material

Grape stems (Vitis vinifera L. cv. Merlot) were provided by Instituto Madrileño de Investigación y Desarrollo Rural, Agrario y Alimentario (IMIDRA, Spain). Stems were separated manually. Raw fresh stems were dried at 40 °C for 48 h in an air bath Stuart S150 (Stuart, UK). Thereafter, dried material was ground in a blender and the resulting powder was sieved to a ≤ 1 mm particle size and stored in a closed bag at −20 °C until further use.

2.3. Experimental Design

A central composite rotatable design (CCRD) was used to evaluate the influence of three independent variables (factors), i.e., solvent composition (X1, 0%–100% ethanol), extraction temperature (X2, 40–120 °C) and extraction time (X3, 1–11 min) on the yield, antioxidant activity (ABTS, DPPH), total phenolic content (TPC) and flavan-3-ols content (mono-oligomers and polymers), measured by means of NP-HPLC, after PLE extraction. Therefore, a total of 19 experimental conditions were established at five levels (23 points of the full factorial design + 6 star points + 5 central points) (Table 1). To determine the influence of the different experimental factors, response surface methodology (RSM) was used, and regression analysis of the response variable data was performed and fitted to a quadratic polynomial model as shown in the following equation:
Y = β0 + β1Et + β2T + β3t + β1,1Et2 + β2,2T2 + β3,3t2 + β1,2EtT + β1,3Ett + β2,3Tt + ε,
where Y is the response variable; β0 the independent term; β1, β2 and β3 the linear coefficients; β1,1, β2,2 and β3,3 the quadratic coefficients; β1,2, β1,3 and β2,3 the interaction factor coefficients and ε the experimental error. The goodness of fit was evaluated according to the determination coefficient (R2), the residual standard deviation (RSD), and the lack of fit test provided by the analysis of variance (ANOVA).

2.4. PLE

Extractions were performed by using an ASE 350 extractor from Dionex Corporation (Sunnyvale, CA, USA). Dry stem powder (1 g) was mixed in a ceramic mortar with 1 g of diatomaceous earth (Dionex, Sunnyvale, CA, USA). The solid mixture was loaded in an 11-mL extraction cell. Two cellulose filters (Dionex, Sunnyvale, CA, USA) were placed at the bottom of the cell to prevent the clogging of the system. The cell was automatically filled with the proper solvent to a pressure of 1500 psi. The extraction cell heat-up time was fitted according to the applied extraction temperature (e.g., 5 min, when the extraction temperature was 40 °C). Subsequently, a static extraction was performed. Afterwards, the cell was rinsed (60% cell volume) and solvent was purged from the cell with pressurized N2 gas for 90 s. A rinse of the complete system was made between extractions. Ethanol from all extracts was removed by vacuum evaporation at 37 °C in an IKA RV 10 control (IKA, Staufen, Germany), followed by freeze-drying (Telstar Lyobeta 15 equipment; Telstar, Madrid, Spain). Powder extracts were kept at −20 °C until analysis.

2.5. Identification and Quantification of Phenolic Compounds by RP-HPLC-PAD-MS

Individual phenolics were determined by reversed-phase high-performance liquid chromatography (RP-HPLC) as described by Grases et al. [24], adapted for grape stems. Chromatographic analyses were carried out in a C18 ACE RP18-AR (150 mm × 4.6 mm, 3 µm particle size) (Symta, Madrid, Spain) protected by a guard column ACE 3 C18-AR (7 mm × 13 mm) packed with the same stationary phase. The column oven was set at 30 °C and sample injection volume was 40 µL. A gradient consisting of 1% aqueous formic acid (solvent A) and acetonitrile containing 1% formic acid (solvent B) was used at a flow rate of 0.6 mL/min. The elution programme was applied as follows: 0 min, 0% B; 80 min, 20% B; 115 min, 28% B; 125 min, 50% B; 135 min, 100% B; 145 min, 100% B; and finally 10 min to recover initial chromatographic conditions. Chromatographic separation was carried out in an Agilent HPLC 1260 series equipped with a photodiode array detector (PAD) coupled online to an ion trap mass selective detector with an electrospray ionization source (Agilent Technologies Inc., Santa Clara, CA, USA). The system was controlled by ChemStation software (Agilent, vers. 6.8). Chromatograms were recorded at 280, 320, 360 and 520 nm. The electrospray ionization (ESI) parameters were as follows: drying gas (N2) flow and temperature, at 11 L min−1 and 350 °C, respectively; nebulizer pressure 65.0 psi; and capillary voltage 4 kV. The full-scan mass covered the range from m/z 100 to 2000 uma. Mass spectrometry data were acquired in positive ionisation mode for anthocyanins and negative ionisation mode for the other phenolic compounds. Prior to injection, all samples were diluted in 1 mL of ultrapure water:methanol (1:1) mixture and then filtered by a 0.45 µm PVDF membrane filter.
Phenolic compounds were identified according to their retention time, mass-to-charge ratio (m/z) of their molecular ions and UV/Vis spectrum by chromatographic comparison with analytical reference substances. Procyanidin dimers B4 and B7 were purified from natural extracts by high-speed countercurrent chromatography (HSCCC) as described in Grases et al. [24]. Procyanidin trimer C1 was identified by the use of a purified OPC-rich extract from cocoa as a complex reference substance, according to Prodanov et al. [25]. The rest of phenolic compounds were tentatively identified on base of their peak retention time, m/z of their molecular ions and diagnostic fragments, UV/Vis spectrum and/or data from Scifinder database and literature.
For quantification purposes, PAD was used. Chromatographic conditions were similar to those already described for identification purposes. Phenolic compounds were quantified by calibration curves of their respective reference solutions, except for procyanidin oligomers, apart from B2, and resveratrol derivatives that were quantified from procyanidin B1 and resveratrol calibration curves, respectively. Hydroxybenzoic acids and flavan-3-ols were quantified at 280 nm, hydroxycinnamic acids and stilbenes at 320 nm, flavonols at 360 nm and anthocyanins at 520 nm. Samples were analysed at least in triplicate.

2.6. Analysis of Total Flavan-3-ol Monomers and Oligomers and Total Polymers by NP-HPLC

Analyses of total flavan-3-ol monomers and oligomers and total polymers, based on increasing order of their molecular masses (degree of polymerization), were performed by NP-HPLC following Muñoz-Labrador et al. [26] elution programme. A Kromasil 60 DIOL column (250 mm × 4.6 mm, 5 µm particle size; AzkoNobel, Amsterdam, Netherland) was used with a security guard Lichrospher Diol-5 (7 mm × 13 mm) cartridge packed with the same material. Column temperature was kept at 35 °C. Solvent (A) was 2% acetic acid in acetonitrile, solvent (B) was methanol containing 2% acetic acid and 3% water, and solvent C was a 2% aqueous acetic acid. A constant flow rate of 0.8 mL min−1 was used. Volume sample injection was 10 µL. Chromatographic analyses were performed using an Agilent Infinity 1260 liquid chromatograph system.
Flanvan-3-ol monomer and oligomers were identified according to their retention time and UV/Vis spectrum in comparison with a purified flavan-3-ol oligomer from cocoa-rich extract, used here as a complex reference substance for oligomer procyanidins of up to octamers. Total polymer procinanidins eluted as a singular peak at the end of the chromatogram [26]. Both mono- and oligomers and total polymers were quantified by means of catechin calibration curve at 280 nm. The results were expressed as mg of catechin equivalent (CE)/g extract. All analyses were done in triplicate.

2.7. Determination of Mean Degree of Procyanidin Polymerization (mDP)

Flavan-3-ol procyanidins were isolated in a minicolumn assembly-line system (minicolumn cartridge C18 Sep-Pack and tC18 Sep-Pack from Waters, Milford, MA, USA) as previously described by Sun et al. [27]. After that, degradation of isolated procyanidins was done by acid-catalysed degradation using toluene-α-tiol. Quantification of degradation products and mDP were conducted by RP-HPLC-PAD. All analyses were done in triplicate.

2.8. Total Phenolic Content (TPC)

Total phenolic content was determined according to the Folin–Ciocalteu reagent method [28]. The results were expressed as mg of gallic acid equivalents (GAE)/g extract. All analyses were done in triplicate.

2.9. Antioxidant Activity

ABTS+ and DPPH radical scavenging assays were carried out according to the original method described by Re et al. [29] and Brand-Williams et al. [30], respectively, and both results were expressed as TEAC value (mmol Trolox/g extract).
ORAC assay was carried out using the method of Huang et al. [31] with some modifications. Briefly, 150 µL of fluorescein solution (8 × 10⁻⁸ M fluorescein in 0.075 M phosphate buffer) was mixed with 25 µL of sample, phosphate buffer (blank) or Trolox solution (100, 80, 60, 40, 20 and 10 µmolar solution), or 50 µL of phosphate buffer (control) in a 96 wells plate. The reaction was carried out by adding 25 µL of a fresh AAPH solution (165.94 mmol AAPH in phosphate buffer) at 37 °C, except for control wells. The mixture was shaken for 8 s and fluorescence intensity was monitored for 120 min (485 nm and 520 nm for excitation and emission wavelength, respectively). ORAC values were expressed as mmol Trolox/g extract.
Antioxidant analyses were done in triplicate.

2.10. Statistical Analyses

The statistical analysis of CCR experimental design data was carried out by RSM with the statistical program Statgraphics Centurion XVI (Statistical Graphics Corp., Warrenton, VA, USA). Correlation coefficients between the different experimental data were performed using Pearson’s test (p ≤ 0.05). Moreover, a principal component analysis (PCA) was conducted for correlation between response variables.

3. Results and Discussion

3.1. Experimental Model Fitting

The present study was conducted to evaluate the optimal conditions for the extraction of phenolic antioxidants from Merlot’s grape stems (Vitis vinifera L.). This variety is one of the most representative grape varieties as it is one of the most widespread cultivars. For this purpose, a central composite rotatable design was applied as displayed in Table 2. Three independent variables or factors, namely, ethanol concentration (X1, 0–100%), temperature (X2, 40 °C–120 °C) and time (X3, 1–11 min), were studied to assess their influence on antioxidant activity, flavan-3-ol monomers and oligomers, polymer procyanidins and total phenolic compounds. These factors are considered as the main extraction-independent variables, at the expense of others less significant, such as solid–solvent ratio or solvent pH [13,32]. Aqueous methanol has been proposed as the most suitable solvent for the extraction of phenolic compounds from grape products [11,22]. Nevertheless, this toxic solvent is currently being replace by aqueous ethanol [6,12]. Its high efficiency and GRAS status makes it suitable for food or pharmaceutical applications [12]. Heating up to 200 °C has been commonly used in PLE extractions, since higher temperatures lead to a greater extraction yield [23]. Nevertheless, values above 120 °C should be avoided as they may cause degradation of phenolic compounds [16]. Accordingly, the maximal temperature value was set at 120 °C in the present study. Moreover, the extraction time variable was limited in low values, since higher extraction time may promote phenolic degradation without an enhancement of extraction yields [17,32]. Table 2 shows response variable data corresponding to each experimental condition.
The regression coefficients of linear, quadratic and interaction terms of the experimental factors were calculated by fixing the experimental values of response variables to a quadratic linear regression model. The effect of each term in the model and its statistical significance on the response variables were analysed from the standardized Pareto chart (data not shown). The quadratic and interaction terms not significantly different from zero (p ≤ 0.05) were excluded from the model, and the mathematical model was refitted by multiple linear regression (MLR), resulting in the polynomial equations shown in Table 3.
These equations suggest that RSM was successfully applied for the optimisation of the considered variables. The models did not show significant lack of fit (p > 0.05), indicating well-fitting models for yield, TPC, ABTS and DPPH, opposite to flavan-3-ol monomers and oligomers, and polymer procyanidin behaviour. However, determination coefficients (R2) for all the studied variables were over 0.90. Therefore, the proposed models could be used as an approach to the real behaviour of these compounds regarding these extraction parameters. Concerning extraction yields, the obtained data exhibited a very good fit for a quadratic model. Moreover, all the experimental factors were significant, mainly ethanol proportion in a quadratic manner (Table 3). In addition, some significant interaction factors were found. Response surface plot showed that an increase of ethanol proportion caused an extraction yield rise of up to almost 25% (Figure 1). Therefore, higher and lower ethanol:water ratios led to a decrease in the extraction yield, more markedly at high ethanol proportions (Figure 1A,B). Moreover, temperature caused a linear effect, that is, extraction yield was enhanced linearly when temperature increased (Figure 1A). On the other hand, a weak quadratic influence of extraction time was noticed.
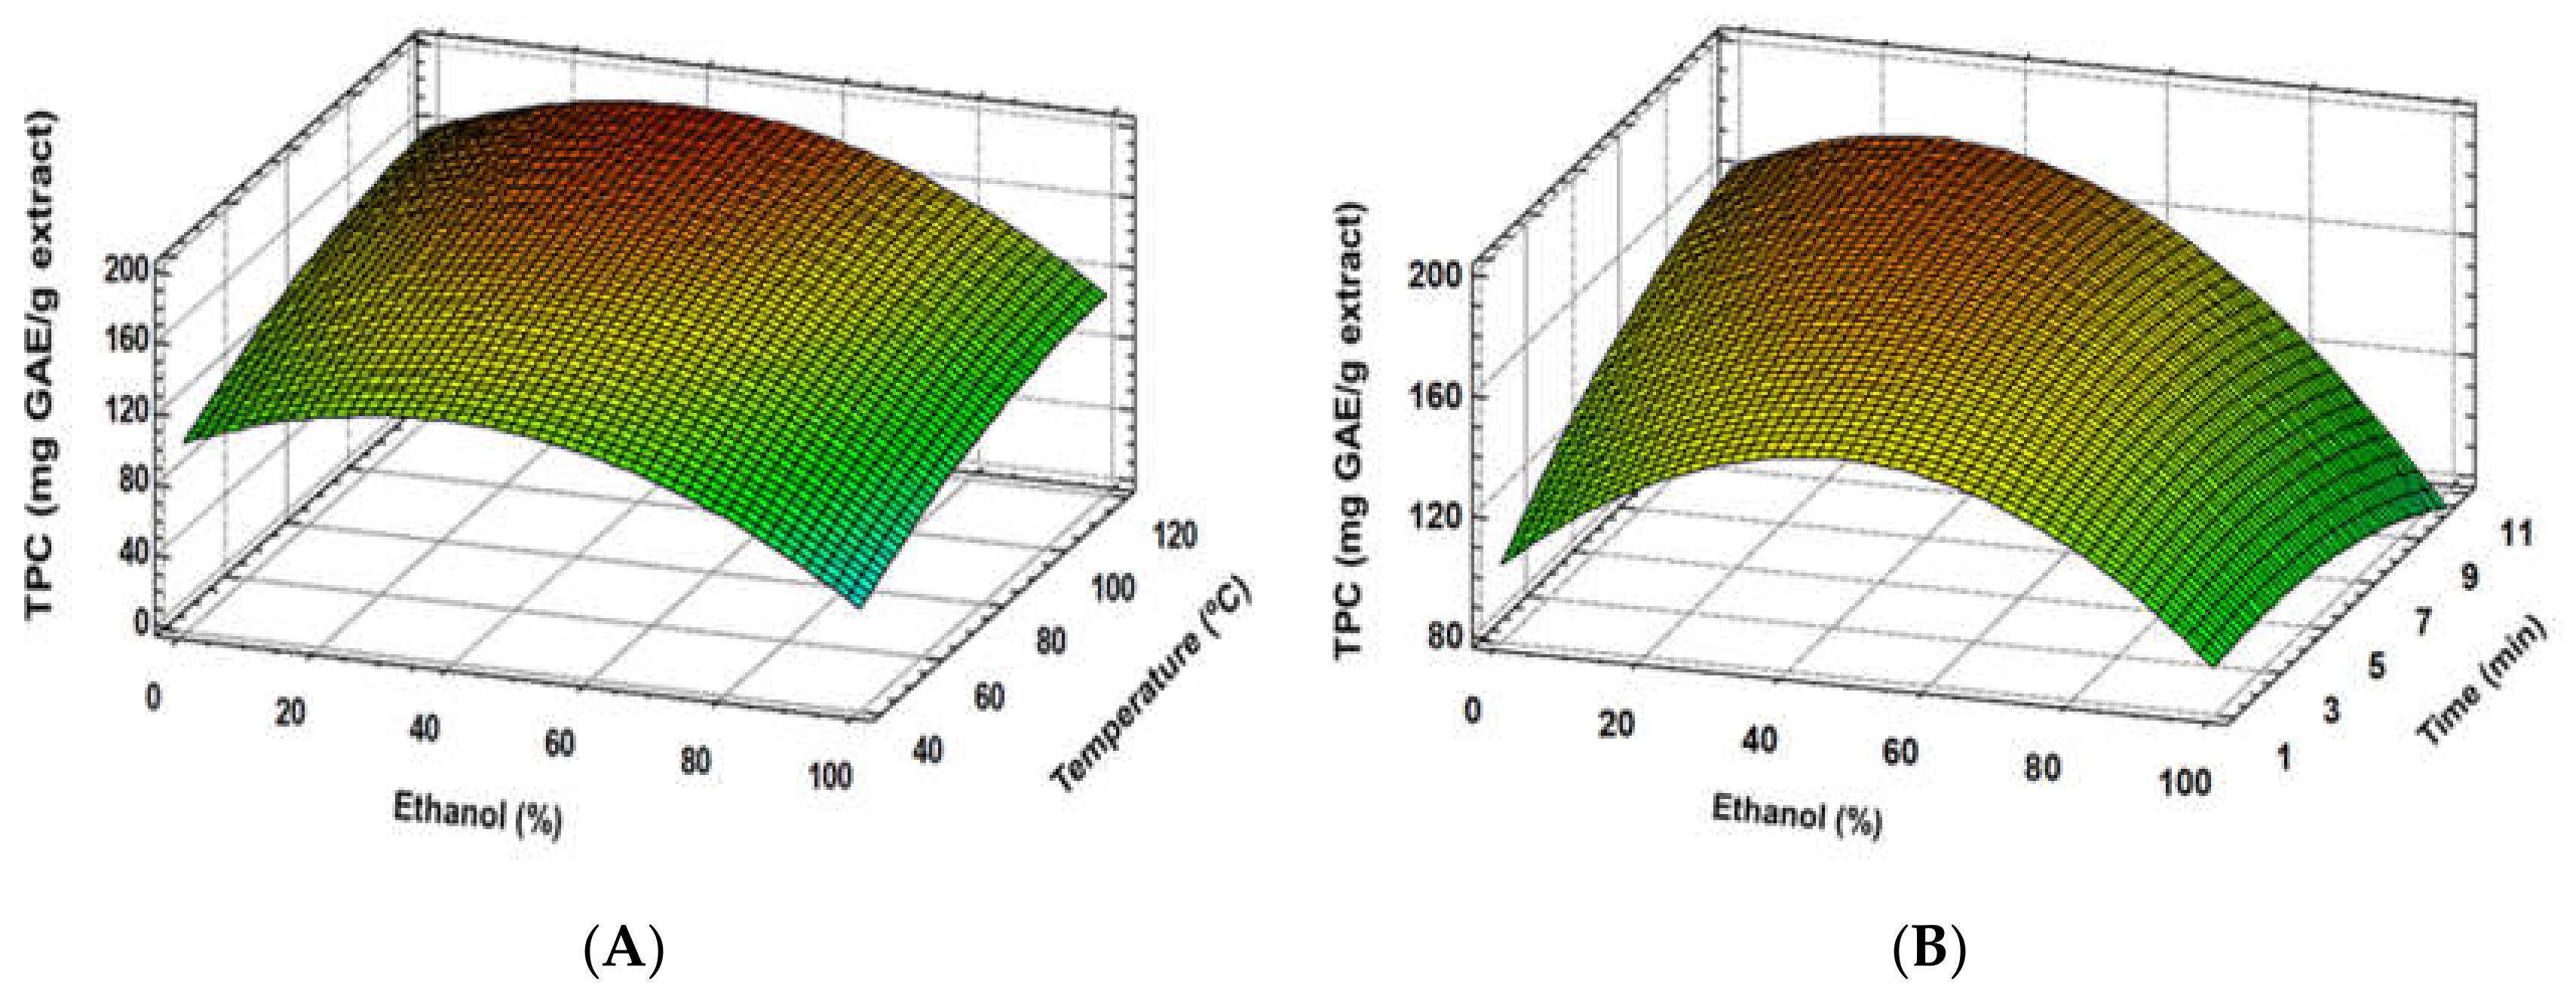
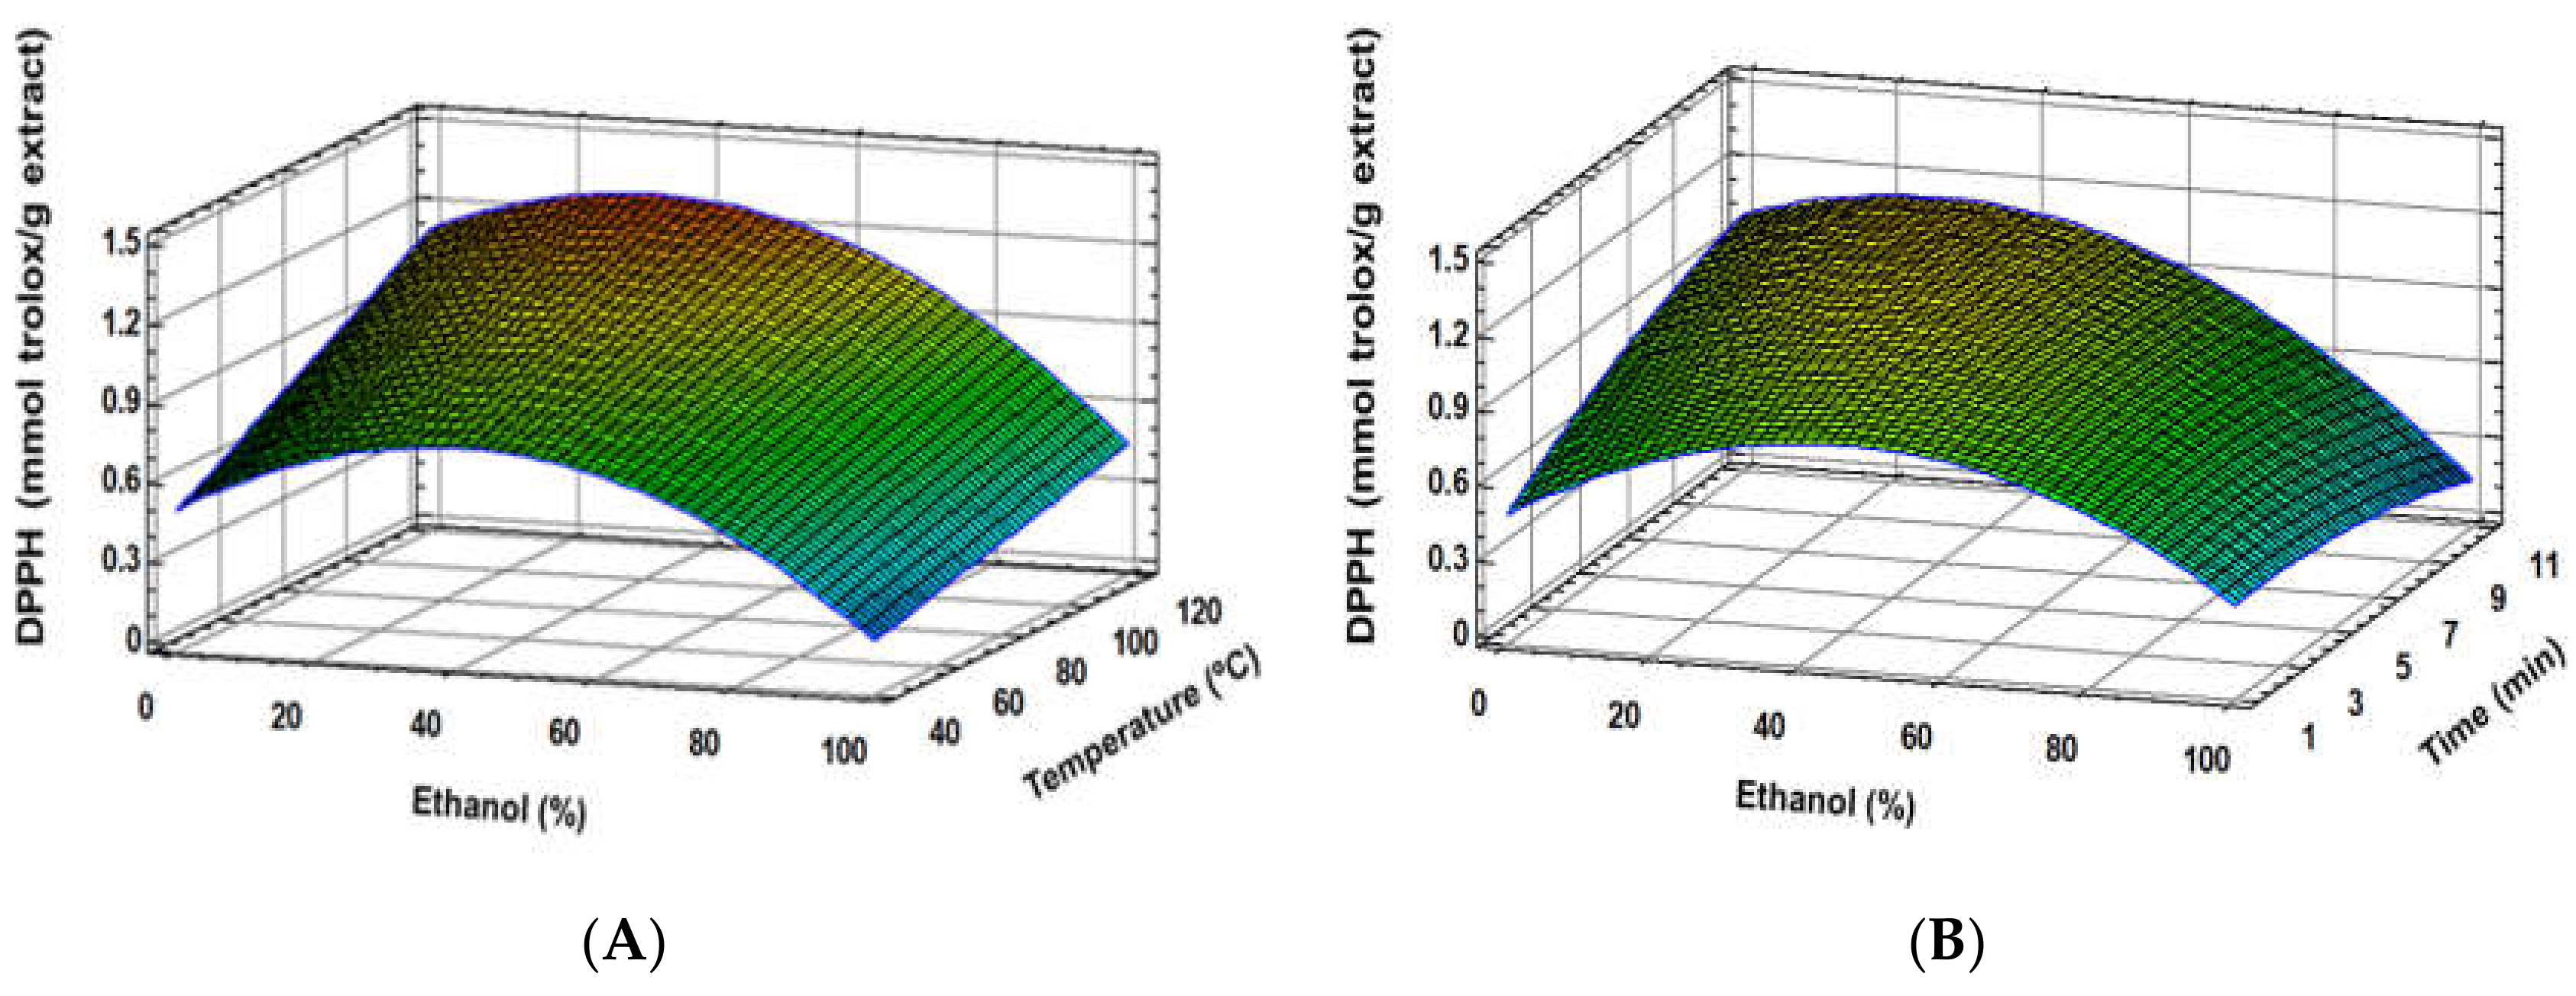
Similar results were found regarding the total phenolic content (TPC) and antioxidant activity (ABTS, DPPH), where good fitting models for these response variables were established (Table 3). Furthermore, extraction solvent was the most important factor, showing a quadratic effect, together with a linear effect of temperature (Figure 2A, Figure 3A and Figure 4A). Although time and some interaction factors resulted in meaningful effects, a lower contribution to response variables was determined for these parameters (Figure 2B, Figure 3B and Figure 4B), where extraction time significance is generally linked to temperature [32]. The optimum ethanol concentration effect was determined to be close to 30%; meanwhile, 120 °C allowed reaching the highest response variable values. Similar results were found in other studies, where ethanol:water mixtures’ behaviour was analysed [12,13]. These authors indicated that extraction solvent was the main factor for both antioxidant activity and TPC of the extracts, showing a quadratic main effect. The optimum ethanol concentration in ethanol:water mixtures to achieve the maximum phenolic extraction, and therefore the greatest antioxidant capacity, is generally observed between 30% and 80% [4,12,13]. In accordance with the present study, the optimization of conventional solid–liquid extraction for two grape stem samples through RSM determined that ethanol and temperature were the main factors during phenolic extractions. The optimum ethanol:water concentration was determined as 57.9% and 63.8%. Although a strong negative and quadratic effect was also observed in these studies for ethanol concentration effect, noticeably higher amounts of ethanol were found [12]. The lower optimum ethanol content in the PLE extraction solvent of the present study (30%) is probably due to the improvement extraction capacities of the solvents because of the pressure and higher temperatures applied during the extraction process. Moreover, PLE modified the extraction capacities of solvents by reducing their polarity [17] and enhancing the extraction of low polar compounds, such as phenolic compounds. Therefore, PLE reduces the required ethanol:water proportion compared to conventional solid–liquid extraction [12,13] or ultrasound extraction [4]. Besides, temperature increase is generally associated with enhancements of phenolic compound extraction [12,13]. Since PLE allows increasing the temperature over the solvent boiling point, the extraction capacity of the used solvents is generally enhanced [17]. Because of that, optimum extraction time is reduced when PLE is used in comparison with conventional extraction [12,13].
Furthermore, temperature was found to be an important but controversial factor, regarding phenolic compound extraction and antioxidant activity. In general, a high extraction temperature is correlated with an increase in the solubility of phenolic compounds from the matrix [33], as it reduces solvent viscosity and enhances solvent penetration [34]. On the other hand, high temperatures may lead to breakdown of thermolabile compounds [13]. Nevertheless, this shortcoming could be avoided by using high extraction temperatures (100–120 °C) at a short extraction time [35]. Accordingly, in the present study, a short extraction time (up to 10 min) at 120 °C avoided thermal degradation of some phenolic compounds.
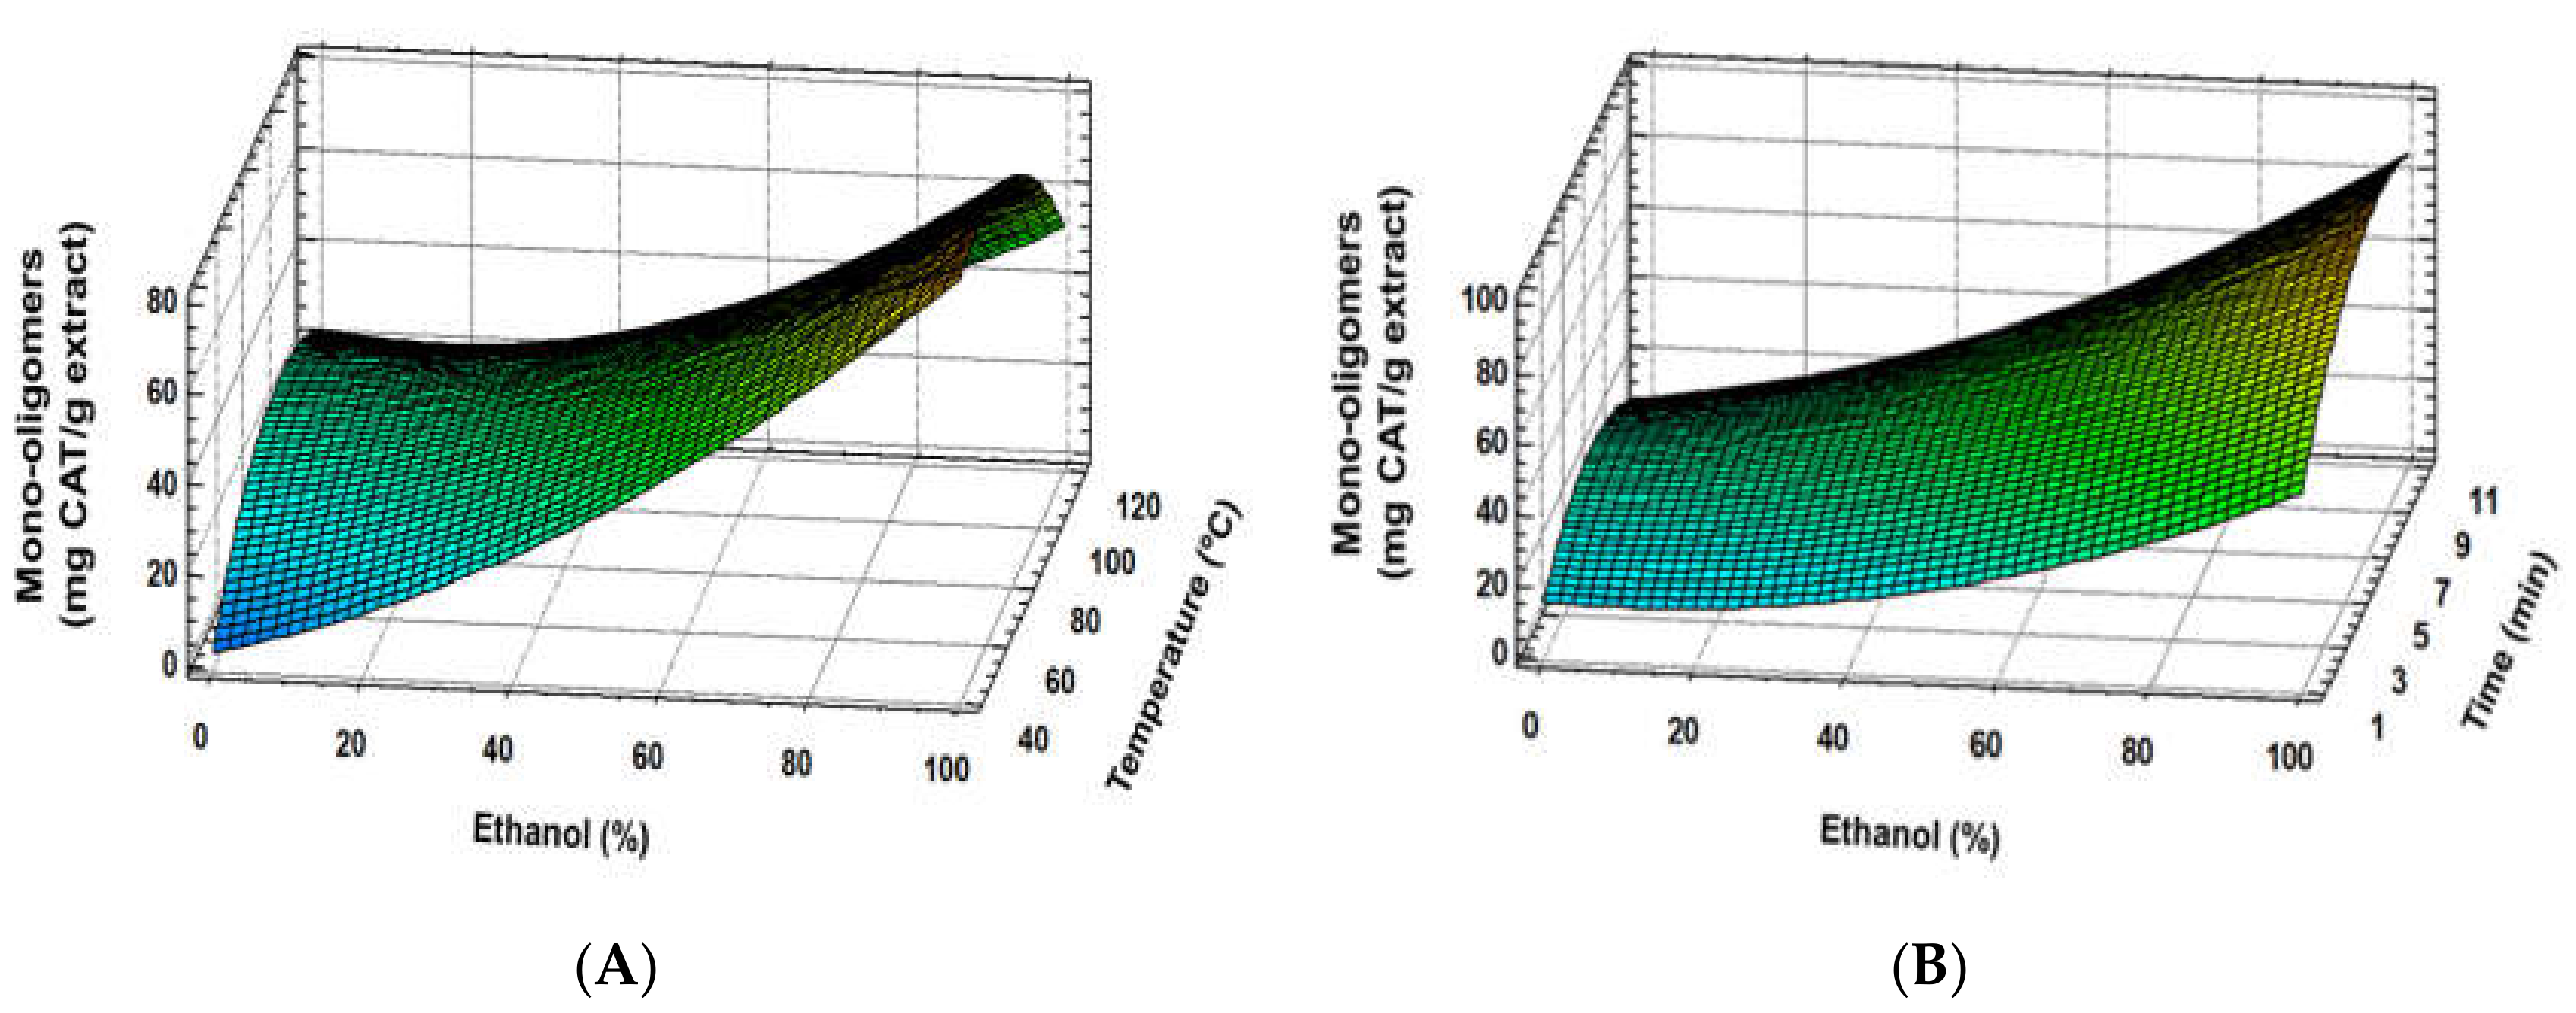
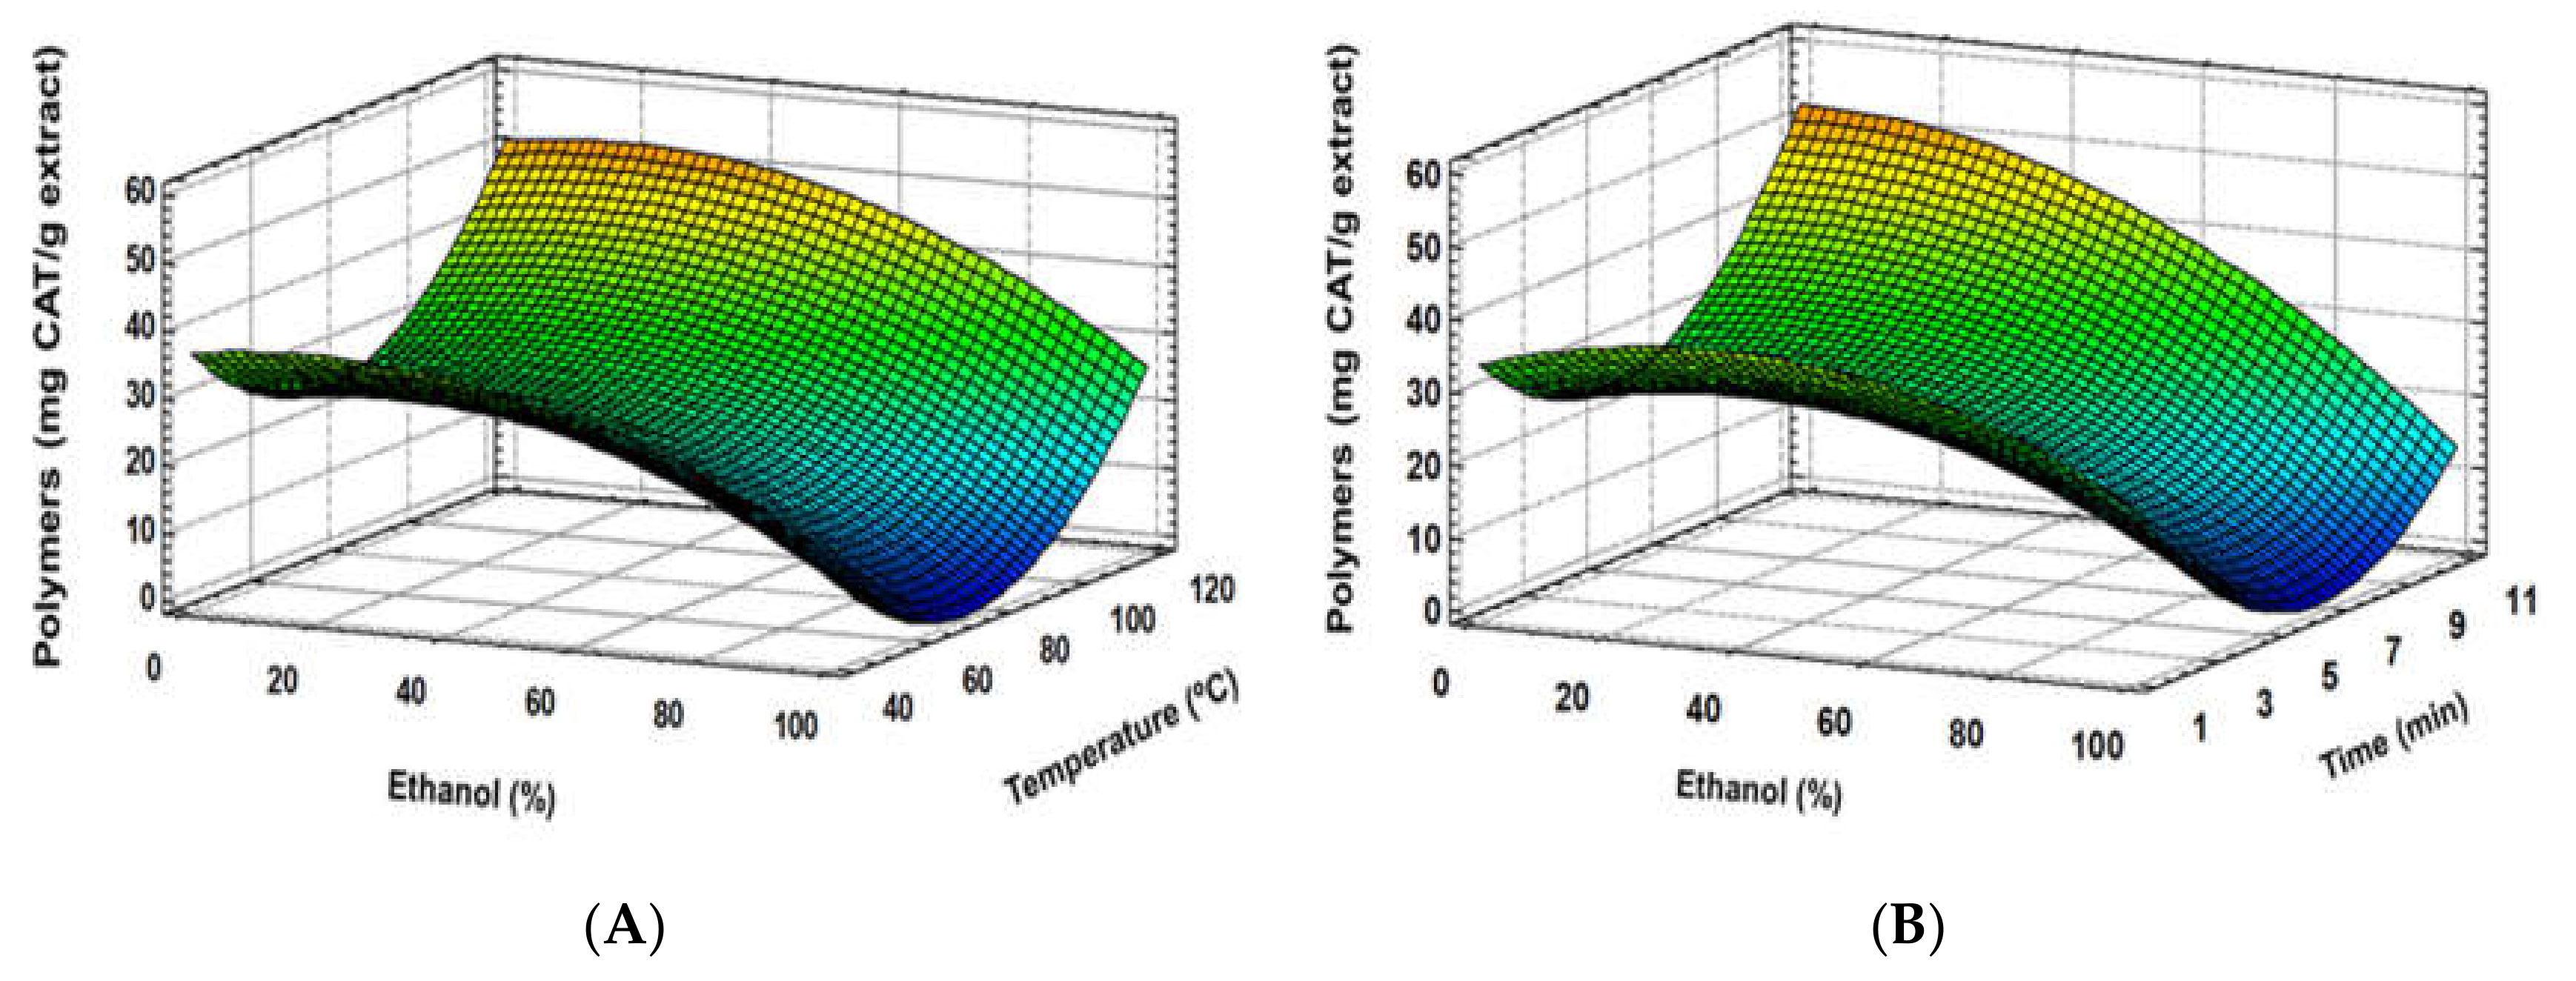
Regarding total flavan-3-ol monomers and oligomers or total polymers of procyanidin content, experimental data did not fit with the quadratic proposed model, suggesting more complex behaviour. Nevertheless, according to response surface plots, extraction solvent resulted as the main factor in the total mono-oligomer demeanour, whereas temperature and time were remarkably less meaningful. Ethanol seems to enhance flavanol-3-ol monomer and oligomer extraction (Figure 5A), while temperature or time influences are less clear (Figure 5A,B). Opposite to that, higher ethanol proportions seem to reduce the extraction of total polymer procyanidins, while temperature increased their extraction yield (Figure 6A). In this case, although extraction time turned out to show a positive tendency, an important interaction between time and the rest of studied factors distorted the effect of time into an overall negative trend (Figure 6A,B). Moreover, temperature increase resulted in a higher extraction of polymers, while ethanol had a suppressive effect, but enhanced the flavan-3-ol monomer and oligomer yield. Sun and Spranger [36] indicated that temperature allowed higher proanthocyanidin extraction rates if the temperature did not reach a degradation point. Likewise, solvent mixtures with higher polarities improve the extraction of these compounds, disrupting the bonds between phenolic compounds and the matrix. In this sense, Karvela et al. [13] found that greater flavanol monomers contents were reached at 60% of ethanol:water, whereas oligomers and polymer proanthocyanidins were achieved at 44% and 55%, respectively.
Nevertheless, it is important to highlight that, in all cases, individual optimisation of extraction conditions is required as grape variety, agro- and weather conditions or plant material are other factors that are not taken into consideration and can have significant influence on phenol recovery [12].

3.2. Optimal Conditions and Validation of the Developed Model

Optimal experimental conditions were achieved for extraction yield, TPC and antioxidant activity since these response variables were fitted to the proposed model. As can be seen in Table 4, only slight differences were found regarding the optimal conditions of these variables. A tight range of ethanol concentrations (22%–30%) was found as the optimum, while the highest temperature (120 °C) was optimal in every response variable. Moreover, high extraction time showed better results, except for extraction yield and TPC, where a slight decrease was shown at 11 min. Therefore, 30% ethanol, 120 °C and 10 min were selected as the most suitable extraction conditions in order to obtain an extract with the highest contents of phenolic antioxidants (optimum extract) by PLE from Merlot grape stem.
Under such optimal conditions, the statistical model predicted an extraction yield of 29.2%, 192.4 mg GAE/g extract (TPC), and TEAC values of 3.81 and 1.31 mmol Trolox/g extrac regarding the ABTS and DPPH methods, respectively. To corroborate these values, additional extractions were made at the optimal extraction conditions (Table 4). The results display that optimum extract showed values very close to the predicted ones, validating the proposed model. In addition, ORAC assay was carried out in order to perform a deeper antioxidant characterization of this optimum extract, with an ORAC value of 1.48 ± 0.17 mmol Trolox/g extract. Moreover, 26.8 ± 0.4 mg of mono-oligomers and 79.17 ± 1.36 mg of proanthocyanidin polymers were quantified in this extract.
These optimal experimental conditions allowed obtaining an extraction yield, TPC and antioxidant activity in agreement with the wide range of values determined by González-Centeno et al. [22] for several grape stem varieties of Vitis vinifera, or even slightly higher results regarding PLE Merlot extract. However, it should be noted that these authors proposed substantially different extraction conditions.
Experimental designs have been proposed previously to find optimal extraction conditions for grape stems [12,13]. In these studies, ethanol:water mixtures, time, temperature or pH were studied as experimental factor using SLE. Slightly higher TPC, along with greater TEAC values, was found in the present study. It is worth mentioning that a lower ethanol:water proportion was required at optimal extraction conditions compared to SLE [12,13]. As has been mentioned before, even if the grape variety or environmental conditions should affect this behaviour, this result could be ascribed to an electric constant decrease in the extraction solvent at high pressure [37]. Furthermore, shorter extraction time and less consumption of solvents were used for PLE than for SLE.
Moreover, similar or lower values of TPC and antioxidant activity were observed when data presented in this study were compared with other SLE or PLE extracts from grape stems [8,18,22]. However, regarding these parameters, the few data in the literature concerning grape stem extracts show a wide range of values. In this regard, differences caused by ripening stage, grape variety, geographic factors, climatological factors or oenological practices, as well as different extraction procedures applied, should be considered [38,39].

3.3. Correlation between Response Variables

Correlations between TPC and TEAC values (ABTS and DPPH) were established in order to confirm the influence of phenolic compounds on the antioxidant activity of the extracts. Antioxidant activity, measured by two methods in the present study (ABTS and DPPH) resulted in a strong correlation with TPC, achieving r = 0.993 and r = 0.987, respectively (p ≤ 0.001). Besides, antioxidant activities obtained by both methods showed a high correlation between them (r = 0.993; p ≤ 0.001)). This confirms that phenolic compounds are the main factor responsible for the extract antioxidant activity, according to the similar optimal conditions predicted by RSM models. In addition, Pearson’s test indicated a good correlation between TPC and the two fractions of phenolic compounds, flavan-3-ol monomers and oligomers (r = 0.557; p ≤ 0.05) and polymers (r = 0.586; p ≤ 0.01). Furthermore, statistical correlations between antioxidant activity and flavan-3-ol monomers and oligomers were found (r = 0.571; p ≤ 0.05 for ABTS method, and r = 0.617; p ≤ 0.01 for DPPH method). However, correlations turned out to be stronger with polymer procyanidins, being r = 0.621 (p ≤ 0.01) for ABTS and r = 0.637 (p ≤ 0.05) for the DPPH method. These results reveal that the antioxidant activity of the grape stem extracts could be ascribed to their general phenolic content [38], although particular contributions of phenolic groups, such as polymer proanthocyanidins, could be higher [13].
Additionally, a PCA was carried out to understand correlations between procyanidins and antioxidant activity. The principal component of the analysis explains a 90.79% of the samples. The antioxidant activity, determined using the ABTS method, was mainly explained by PC1 (76.48%) whereas PC2 contributed to a lesser extent (14.32%) (Figure 7A). Therefore, PCA analyses showed a strong correlation between the polymer content and the total antioxidant activity of the samples. Therefore, those samples characterised by higher amounts of polymers, being samples 7, 12 and the optimum extract, showed greater antioxidant activity. These samples were characterised by the use of high temperatures during PLE extraction (104 °C, 120 °C and 120 °C, respectively), being in concordance with the polynomial equations of the fitted models (Table 3). Additionally, the proximity of samples 3 and 14 in the PCA graph, as well as sample 7, evidences the influence of the extraction time. Similar results were observed when PCA analysis was conducted for DPPH values (Figure 7B), explaining 89.65% of the samples.

3.4. Phenolic Composition of the Optimum Extract

Forty-two phenolic compounds were identified by HPLC-PAD-MS. Optimal PLE grape stem extract showed a complex composition of phenolic compounds, including phenolic acids, stilbenes, flavonols and, especially, flavanols (Table 5). Regarding phenolic acids, gallic and caftaric acids were the main hydroxybenzoic and hydroxycinnamic acids of the extract, followed by vanillic and syringic acid [19]. In addition, stilbenes were identified, including trans-resveratrol, ε-viniferin, trans-resveratrol-glucoside (piceid), along with different dimmers and trimers of trans- and cis-resveratrol [9,10,40].
Numerous flavan-3-ols were also determined, including monomers, dimers and oligomers [40]. Catechin was the main monomeric compound, followed by epicatechin, whereas dimer B1 turned out to be the highest dimer compound [11].
Moreover, different flavonols were quantified, mainly as quercetin derivatives. The most remarkable compound corresponded to quercetin-3-O-glucuronide, followed by quercetin-3-O-glucoside [40]. These forms of quercetin are the main flavonols of grape stems, along with others such as quercetin-3-O-rutinoside and quercetin-3-O-galactoside [8,19,40]. In addition, low quantities of different anthocyanins where detected in the extract, malvidin-3-O-glucoside being the most abundant of this group [8].
It is remarkable that, as far as we know, it is the first time that compounds such as ethyl gallate, ellagic acid, delphinidin-7-O-glucoside or cyanidin-3-O-glucoside have been identified in grape stem extracts, although ethyl gallate has been previously reported in grape seed extracts [25].
Just a few articles depict the composition of proanthocyanidin fraction in grape stem extracts. In the present study, 80 mg of CE/g extract was quantified as procyanidins according to the procedure of Sun et al. [27]. Procyanidin characterization revealed a mDP of 12 units. Structural composition showed catechin as a predominant terminal unit and epicatechin as a principal extension unit, where approximately 12% of the total constituent units of procyanidins were galloylated (Table 6). Focusing on general composition, epicatechin was the main monomer unit (72.3%), followed by catechin (14.6%), epicatechin gallate (12.4%) and, to a lesser extent, epigallocatechin (0.7%). All these results are consistent with the stem proanthocyanidin fraction described in literature [14,22], and particularly with Merlot’s proanthocyanidins [7]. Nevertheless, slightly higher mDP was found in the present study. This result might be attributable to the effect of pressure extraction conditions used in this study, allowing a higher penetration of the solvent during extraction process.

4. Conclusions

Ethanol:water mixture (30%), 120 °C and 10 min turn out to be the optimal extraction conditions of the environmentally friendly PLE process carried out in this study. These conditions lead to obtaining an extract with a high phenolic content and a remarkable antioxidant activity from Merlot grape stems. This methodology allows reducing solvent volume, ethanol concentration and extraction time compared to conventional solid–liquid extraction. This study shows that this by-product is an interesting and undervalued source of procyanidins, and to a lesser extent, stilbene and flavonol derivatives. Moreover, although the contribution of polymer procyanidins to the antioxidant activity of the extract is established, the role played by other phenolics should not be ruled out. Therefore, the present study highlights the valorisation of this side stream as a source of natural phenolic antioxidants by using a green extraction technology as part of a sustainable food system.

Author Contributions

Conceptualization, L.J. and S.S.; Methodology, J.A.N., L.J. and M.P.; Validation, J.A.N., M.P. and L.J.; Formal analysis, J.A.N., L.J. and M.P.; Investigation, J.A.N.; writing—original draft preparation, J.A.N. and L.J.; Supervision, L.J. and S.S.; writing—review and editing, L.J., M.P. and S.S.; Project administration, G.R.; funding acquisition, G.R. All authors have read and agreed to the published version of the manuscript.

Funding

This research was funded by Comunidad Autónoma de Madrid (ALIBIRD, project number P2013/ABI2728).

Acknowledgments

The authors would like to thank Félix Cabello from IMIDRA for the kind supply of grapes.

Conflicts of Interest

The authors declare no conflict of interest.

References

  1. Food and Agriculture Organization of the United Nations (FAO). 2019. Available online: http://www.fao.org/faostat/en/#home (accessed on 11 April 2019).
  2. Gouvinhas, I.; Queiroz, M.; Rodrigues, M.; Barros, A.I. Evaluation of the Phytochemistry and Biological Activity of Grape (Vitis vinifera L.) Stems: Toward a Sustainable Winery Industry. In Polyphenols in Plants; Watson, R.R., Ed.; Academic Press Inc.: San Diego, CA, USA, 2019; pp. 381–394. [Google Scholar]
  3. Barros, A.I.; Gouvinhas, I.; Machado, N.; Pinto, J.; Cunha, M.; Rosa, E.; Domínguez-Perles, R. New grape stems-based liqueur: Physicochemical and phytochemical evaluation. Food Chem. 2016, 190, 896–903. [Google Scholar] [CrossRef] [PubMed]
  4. Ruiz-Moreno, M.J.; Raposo, R.; Cayuela, J.M.; Zafrilla, P.; Piñeiro, Z.; Moreno-Rojas, J.M.; Mulero, J.; Puertas, B.; Girón, F.; Guerrero, R.F.; et al. Valorization of grape stems. Ind. Crop. Prod. 2015, 63, 152–157. [Google Scholar] [CrossRef]
  5. Goutzourelas, N.; Stagos, D.; Spanidis, Y.; Liosi, M.; Apostolou, A.; Priftis, A.; Haroutounian, S.; Spandidos, D.A.; Tsatsakis, A.M.; Kouretas, D. Polyphenolic composition of grape stem extracts affects antioxidant activity in endothelial and muscle cells. Mol. Med. Rep. 2015, 12, 5846–5856. [Google Scholar] [CrossRef] [PubMed]
  6. Silva, V.; Igrejas, G.; Falco, V.; Santos, T.P.; Torres, C.; Oliveira, A.M.P.; Pereira, J.E.; Amaral, J.S.; Poeta, P. Chemical composition, antioxidant and antimicrobial activity of phenolic compounds extracted from wine industry by-products. Food Control. 2018, 92, 516–522. [Google Scholar] [CrossRef] [Green Version]
  7. Souquet, J.M.; Labarbe, B.; Le Guernevé, C.; Cheynier, V.Y. Phenolic composition of grape stems. J. Agric. Food. Comp. Chem. 2000, 48, 1076–1080. [Google Scholar] [CrossRef] [PubMed]
  8. Barros, A.; Gironés-Vilaplana, A.; Teixeira, A.; Collado-González, J.; Moreno, D.A.; Gil-Izquierdo, A.; Rosa, E.; Domínguez-Perles, R. Evaluation of grape (Vitis vinifera L.) stems from Portuguese varieties as a resource of (poly)phenolic compounds: A comparative study. Food Res. Int. 2014, 65, 375–384. [Google Scholar] [CrossRef]
  9. Pugajeva, I.; Perkons, I.; Górnaś, P. Identification and determination of stilbenes by Q-TOF in grape skins, seeds, juice and stems. J. Food Compos. Anal. 2018, 74, 44–52. [Google Scholar] [CrossRef]
  10. Püssa, T.; Floren, J.; Kuldkeep, P.; Raal, A. Survey of grape wine stem polyphenols by liquid chromatography-diode array detection tandem mass spectrometry. J. Agric. Food Chem. 2006, 54, 7488–7994. [Google Scholar] [CrossRef]
  11. Luo, L.; Cui, Y.; Zhang, S.; Li, L.; Suo, H.; Sun, B. Detailed phenolic composition of Vidal grape pomace by ultrahigh-performance liquid chromatography–tandem mass spectrometry. J. Chromatogr. B 2017, 1068, 201–209. [Google Scholar] [CrossRef]
  12. Domínguez-Perles, R.; Teixeira, A.; Rosa, E.; Barros, A. Assessment of (poly)phenols in grape (Vitis vinifera L.) stems by using food/pharma industry compatible solvents and response surface methodology. Food Chem. 2014, 164, 339–346. [Google Scholar]
  13. Karvela, E.; Makris, D.P.; Kalogeropoulosa, N.; Karathanosa, V.T. Deployment of response surface methodology to optimize recovery of grape (Vitis vinifera) stem and seed polyphenols. Procedia Food Sci. 2011, 1, 1686–1693. [Google Scholar] [CrossRef] [Green Version]
  14. Llaudy, M.C.; Canals, R.; Canals, J.M.; Zamora, F. Influence of ripening stage and maceration length on the contribution of grape skins, seeds and stems to phenolic composition and astringency in wine-simulated macerations. Eur. Food Res. Technol. 2008, 226, 337–344. [Google Scholar] [CrossRef]
  15. Choi, M.P.K.; Chan, K.K.C.; Leung, H.W.; Huie, C.W. Pressurized liquid extraction of active ingredients (ginsenosides) from medicinal plants using non-ionic surfactant solutions. J. Chromatogr. A 2003, 983, 153–162. [Google Scholar] [CrossRef] [Green Version]
  16. Arapitsas, P.; Turner, C. Pressurized solvent extraction and monolithic column HPLC/DAD analysis of anthocyanins in red cabbage. Talanta 2008, 74, 1218–1223. [Google Scholar] [CrossRef]
  17. Wijngaard, H.; Hossain, M.B.; Rai, D.K.; Brunton, N. Techniques to extract bioactive compounds from food by-products of plant origin. Food Res. Int. 2012, 46, 505–513. [Google Scholar] [CrossRef]
  18. Llobera, A. Study on the Antioxidant Activity of Grape Stems (Vitis vinifera). A Preliminary Assessment of Crude Extracts. Food Nutr. Sci. 2012, 3, 500–504. [Google Scholar]
  19. Anastasiadi, M.; Pratsinis, H.; Kletsas, D.; Skaltsounis, A.; Haroutounian, S.A. Grape stem extracts: Polyphenolic content and assessment of their in vitro antioxidant properties. Lwt Food Sci. Technol. 2012, 48, 316–322. [Google Scholar] [CrossRef]
  20. Casas, L.; Mantell, C.; Rodríguez, M.; Martínez de la Ossa, E.J.; Roldán, A.; De Ory, I.; Caro, I.; Blandino, A. Extraction of resveratrol from the pomace of Palomino fino grapes by supercritical carbon dioxide. J. Food Eng. 2010, 96, 304–308. [Google Scholar] [CrossRef]
  21. Piñeiro, Z.; Marrufo-Curtido, A.; Vela, C.; Palma, M. Microwave-assisted extraction of stilbenes from woody vine material. Food Bioprod. Process. 2017, 103, 18–26. [Google Scholar] [CrossRef]
  22. González-Centeno, M.R.; Jourdes, M.; Femenia, A.; Simal, S.; Rosselló, C.; Teissedre, P.L. Proanthocyanidin composition and antioxidant potential of the stem winemaking byproducts from 10 different grape varieties (Vitis vinifera L.). J. Agric. Food Chem. 2012, 60, 11850–11858. [Google Scholar]
  23. Wenzel, J.; Storer-Samaniego, C.; Wang, L.; Nelson, L.; Ketchum, K.; Ammerman, M.; Zand, A. Superheated liquid and supercritical denatured ethanol extraction of antioxidants from Crimson red grape stems. Food Sci. Nutr. 2015, 3, 569–576. [Google Scholar] [CrossRef] [PubMed]
  24. Grases, F.; Prieto, R.M.; Fernández-Cabot, R.A.; Costa-Bauzá, A.; Sánchez, A.M.; Prodanov, M. Effect of consuming a grape seed supplement with abundant phenolic compounds on the oxidative status of healthy human volunteers. Nutr. J. 2015, 14, 94–101. [Google Scholar] [CrossRef] [PubMed] [Green Version]
  25. Prodanov, M.; Vacas, V.; Hernández, T.; Estrella, I.; Amador, B.; Winterhalter, P. Chemical characterisation of Malvar grape seeds (Vitis vinifera L.) by ultrafiltration and RP-HPLC-PAD-MS. J. Food Comp. Anal. 2013, 31, 284–292. [Google Scholar] [CrossRef]
  26. Muñoz-Labrador, A.; Prodanov, M.; Villamiel, M. Effects of high intensity ultrasound on disaggregation of a macromolecular procyanidin-rich fraction from Vitis vinifera L. seed extract and evaluation of its antioxidant activity. Ultrason. Sonochem. 2019, 50, 74–81. [Google Scholar] [CrossRef]
  27. Sun, B.S.; Leandro, M.C.; Ricardo-da-Silva, J.M.; Spranger, M.I. Separation of grape and wine proanthocyanidins according to their degree of polymerisation. J. Agric. Food Chem. 1998, 46, 1390–1396. [Google Scholar] [CrossRef]
  28. Singleton, V.L.; Orthofer, R.; Lamuela-Raventós, R.M. Analysis of total phenols and other oxidation substrates and antioxidants by means of Folin-Ciocalteu Reagent. Methods Enzym. 1999, 299, 152–178. [Google Scholar]
  29. Re, R.; Pellegrini, N.; Proteggente, A.; Pannala, A.; Yang, M.; Rice-Evans, C. Antioxidant activity applying an improved ABTS radical cation decolorization assay. Free Radic. Biol. Med. 1999, 26, 1231–1237. [Google Scholar] [CrossRef]
  30. Brand-Williams, W.; Cuveleir, M.E.; Berset, C. Use of a free radical method to evaluate antioxidant activity. Lwt-Food Sci. Technol. 1995, 28, 25–30. [Google Scholar] [CrossRef]
  31. Huang, D.J.; Ou, D.X.; Hampsch-Woodill, M.; Flanagan, J.A.; Prior, R.L. High-throughput assay of oxygen radical absorbance capacity (ORAC) using a multichannel liquid handling system coupled with a microplate fluorescence reader in 96-well format. J. Agric. Food Chem. 2002, 50, 4437–4444. [Google Scholar] [CrossRef]
  32. Li, Y.; Skouroumounis, J.K.; Elsey, G.M.; Taylor, D.K. Microwave-assistance provides very rapid and efficient extraction of grape seed polyphenols. Food Chem. 2011, 129, 570–576. [Google Scholar] [CrossRef]
  33. Silva, E.M.; Rogez, H.; Larondelle, Y. Optimization of extraction of phenolic from Inga edulis leaves using response surface methodology. Sep. Purif. Technol. 2007, 55, 381–387. [Google Scholar] [CrossRef]
  34. Mandal, V.; Mohan, Y.; Hemalatha, S. Microwave assisted extraction-an innovative and promising extraction tool for medicinal plant research. Pharm. Rev. 2007, 1, 7–18. [Google Scholar]
  35. Aliakbarian, B.; Fathi, A.; Perego, P.; Dehghani, F. Extraction of antioxidants from winery wastes using subcritical water. J. Supercrit. Fluids 2012, 65, 18–24. [Google Scholar] [CrossRef]
  36. Sun, B.; Spranger, M.I. Changes in phenolic composition of Tinta Miúda red wines after 2 years of ageing in bottle: effect of winemaking technologies. Eur. Food Res. Technol. 2005, 221, 305–312. [Google Scholar] [CrossRef]
  37. Hawthorne, S.B.; Yang, Y.; Miller, D.J. Extraction of organic pollutans from environmental solids with subcritical and supercritical water. Anal. Chem. 1994, 66, 2912–2920. [Google Scholar] [CrossRef]
  38. Makris, D.P.; Boskou, G.; Andrikopoulos, K. Recovery of antioxidant phenolics from white vinification solid by-prodcts employing water/ethanol mixtures. Bioresour. Technol. 2007, 98, 2963–2967. [Google Scholar] [CrossRef]
  39. Mulero, J.; Martínez, G.; Oliva, J.; Cermeño, S.; Cayuela, J.M.; Zafrilla, P.; Martínez-Cachá, A.; Barba, A. Phenolic compounds and antioxidant activity of red wine made from grapes treated with different fungicides. Food Chem. 2015, 180, 25–31. [Google Scholar] [CrossRef]
  40. Marchante, L.; Loarce, L.; Izquierdo-Cañas, M.P.; Alañón, M.E.; García-Romero, E.; Pérez-Coello, M.S.; Díaz-Maroto, M.C. Natural extracts from grape seed and stem by-products in combination with colloidal silver as alternative preservatives to SO2 for white wines: Effects on chemical composition and sensorial properties. Food Res. Int. 2019, 108594. [Google Scholar] [CrossRef]
Figure 1. Response surface plots of the extraction yield as affected by independent factors; ethanol (%) vs. temperature (A), ethanol (%) vs. time (B).
Foods 09 00604 g001
Figure 2. Response surface plots of the TPC as affected by independent factor; ethanol (%) vs. temperature (A), ethanol (%) vs. time (B).
Foods 09 00604 g002
Figure 3. Response surface plots of the ABTS as affected by independent factors; ethanol (%) vs. temperature (A), ethanol (%) vs. time (B).
Foods 09 00604 g003
Figure 4. Response surface plots of the DPPH as affected by independent factors; ethanol (%) vs. temperature (A), ethanol (%) vs. time (B).
Foods 09 00604 g004
Figure 5. Response surface plots of flavan-3-ol monomer and oligomer content as affected by independent factors; ethanol (%) vs. temperature (A), ethanol (%) vs. time (B).
Foods 09 00604 g005
Figure 6. Response surface plots of polymer procyanidins content as affected by independent factors; ethanol (%) vs. temperature (A), ethanol (%) vs. time (B).
Foods 09 00604 g006
Figure 7. Principal components analysis (PCA) of response variables. Projections of the variables and samples (Biplot) for ABTS (A) and DPPH values (B).
Foods 09 00604 g007
Table 1. Coded levels and experimental values of the factors used in the central composite rotatable design.
FactorCoded SymbolCoded Levels
−1.68−1011.68
Ethanol concentration (%)Et0205080100
Temperature (°C)T405680104120
Time (min)t136911
Table 2. Experimental design and experimental response variable data.
FactorResponse Variables
RunX1, EthanolX2, TemperatureX3, TimeYieldTotal Phenolic Compounds (TPC)ABTSDPPHTotal Flavan-3-ol Mono- and OligomersTotal Polymer Procyanidins
(%)(°C)(min)(g Extract/100 g Stem)(mg GAE/g Extract)(mmol Trolox/g Extract)(mmol Trolox/g Extract)(mg catechin/g Extract)(mg catechin/g Extract)
12056321.5118.12.060.6519.5330.02
2805639.4114.01.890.5552.7214.55
320104327.5164.02.890.9724.4842.64
480104323.3145.92.500.8131.5132.10
52056921.0148.72.630.8627.1641.97
68056910.3113.21.940.5669.9721.26
720104928.5178.73.331.1926.5944.58
880104914.8135.22.420.7252.6419.65
9080624.9147.82.540.8717.8121.68
1010080612.487.41.390.2998.734.06
115040618.8129.42.240.7730.6734.53
1250120630.6186.63.431.2226.5149.78
135080121.2147.82.600.8826.2638.42
1450801124.8172.72.961.0627.7344.51
155080622.8167.62.981.0047.4522.05
165080625.0171.83.001.0545.4321.62
175080624.3167.92.941.0345.6721.30
185080624.1169.72.950.9845.3421.82
195080624.0160.22.771.0146.6521.48
Table 3. Polynomial equations and statistical parameters of the fitted models obtained for response variables.
VariablePolynomial Equation of Fitted ModelR2Lack-of-Fit (p-Value)
Yields (g extract/g stem)Y = −2.05097 + 0.188423(Et) + 0.24681(T) + 2.91554(t) − 0.00271887(Et)2 − 0.0115812(Et × t) − 0.0144409(T × t) − 0.0984341(t)20.9510.15
TPC (mg GAE/g extract)Y = −15.954 + 2.10974(Et) + 1.94514(T) + 10.808(t) − 0.0212643(Et)2 − 0.0807058(Et × t) − 0.00779276(T)2 − 0.408779(t)20.970.21
ABTS (mmol Trolox/g extract)Y = 0.578714 + 0.0369343(Et) + 0.0142628(T) + 0.112674(t) − 0.000382393(Et)2 − 0.00147263(Et × t)0.970.33
DPPH (mmol Trolox/g extract)Y = −0.238343 + 0.0209687(Et) + 0.00766806(T) + 0.0851506(t) − 0.000183361(Et)2 − 0.0000407129(Et × T) − 0.00071712(Et × t) − 0.00273786(t)20.980.19
Table 4. Optimal extraction conditions, experimental and estimated values for response variables in the optimum extract.
Optimal ConditionsOptimal Extract Values (30% Et, 120 °C, 10 min)
Et (%)T (°C)T (min)ExperimentalEstimated
Yields (g extract/100 g stem)251204.528.929.2
TPC (mg GAE/g extract)3012010187.3192.4
ABTS (mmol Trolox/g extract)27120113.693.81
DPPH (mmol Trolox/g extract)22120111.321.37
Table 5. HPLC-PAD-ESI-MS phenolic analysis of the optimal grape stem extracts (mg compound/g dry extract).
Phenolic CompoundUV-Vis Max.[M − H]−1[M + H]+1MS/MS Fragmentsmg/g dry Extract
No Flavonoids
Hydroxybenzoic acids
Gallic acid270169 1250.541 ± 0.029
Protocatechuic acid260/290153 1170.008 ± 0.000
Monogalloyl glucoside257/298331 169<LOQ
4-Hydroxybenzoic acid256137 0.048 ± 0.001
Vanillic acid259/292167 1530.224 ± 0.010
Syringic acid278197 1830.202 ± 0.015
Ethyl gallate277197 1690.010 ± 0.001
Ellagic acid256/353301 2290.073 ± 0.004
Hydroxycinnamic acids
trans-caftaric acid296/328311 1790.357 ± 0.003
trans-caffeic acid300/324179 1610.006 ± 0.000
4-Coumaric acid290/310163 1190.004 ± 0.000
3-Coumaric acid289/309163 1190.003 ± 0.000
Coumaroyl-O-glucoside280/308325 163,1190.003 ± 0.000
trans- ferulic acid298/322193 1490.008 ± 0.000
Stilbenes
trans-Piceid295/324389 2270.016 ± 0.000
trans-Resveratrol303/328227 1850.141 ± 0.003
ε-viniferin262/308/322453 3590.879 ± 0.065
cis-resveratrol trimer286679 5850.031 ± 0.002
trans-resveratrol trimer296/320679 587,5750.012 ± 0.001
trans-resveratrol trimer288/326679 587,5750.042 ± 0.003
trans-resveratrol tetramer306/316905 8110.136 ± 0.011
trans-resveratrol tetramer306/316905 8110.086 ± 0.007
cis-resveratrol tetramer284905 811,7170.038 ± 0.003
trans-resveratrol tetramer306/318905 811,799<LOQ
Flavonoids
Flavan-3-ols
Catechin278289 2452.422 ± 0.034
Epicatechin278289 2451.293 ± 0.039
Epicatechin gallate280441 289,1690.245 ± 0.005
Procyanidin B1278577 4251.410 ± 0.034
Procyanidin B2278577 4250.015 ± 0.003
Procyanidin B3278577 4250.349 ± 0.025
Procyanidin B4279577 4250.036 ± 0.002
Procyanidin B7280577 4250.025 ± 0.003
Procyanidin C1280865 5770.016 ± 0.001
Flavonols
Kaempferol-3-O-glucoside287/358447 285<LOQ
Quercetin-3-O-galactoside256/354463 3010.047 ± 0.000
Quercetin-3-O-rutinoside256/354609 3010.029 ± 0.000
Quercetin-3-O-glucuronide252/354477 3011.425 ± 0.001
Quercetin-3-O-glucoside254/354463 3010.106 ± 0.004
Quercetin256/368301 0.005 ± 0.000
Anthocyanins
Delphinidin-3-O-glucoside292/535 465303<LOQ
Cyanidin-3-O-glucoside290/530 4492870.010 ± 0.001
Malvidin-3-O-glucoside293/537 4933310.079 ± 0.002
LOQ: limit of quantification
Table 6. Characteristics and structural composition (percent in moles) of procyanidin fraction from optimal stem PLE extract.
Terminal Units (%)Extension Units (%)mDPGalloilated Units (%)
CatECECGCatECECGEGC
6.321.070.818.2771.2711.590.6812.2212.40