Consumers Associate High-Quality (Fine) Wines with Complexity, Persistence, and Unpleasant Emotional Responses

 and
and 
Abstract

1. Introduction
2. Materials and Methods
2.1. Focus Group Sessions
2.2. Optimized Descriptive Profile (ODP)
2.3. Consumer Tasting
2.4. Check-All-That-Apply (CATA) and Ideal Sample Testing
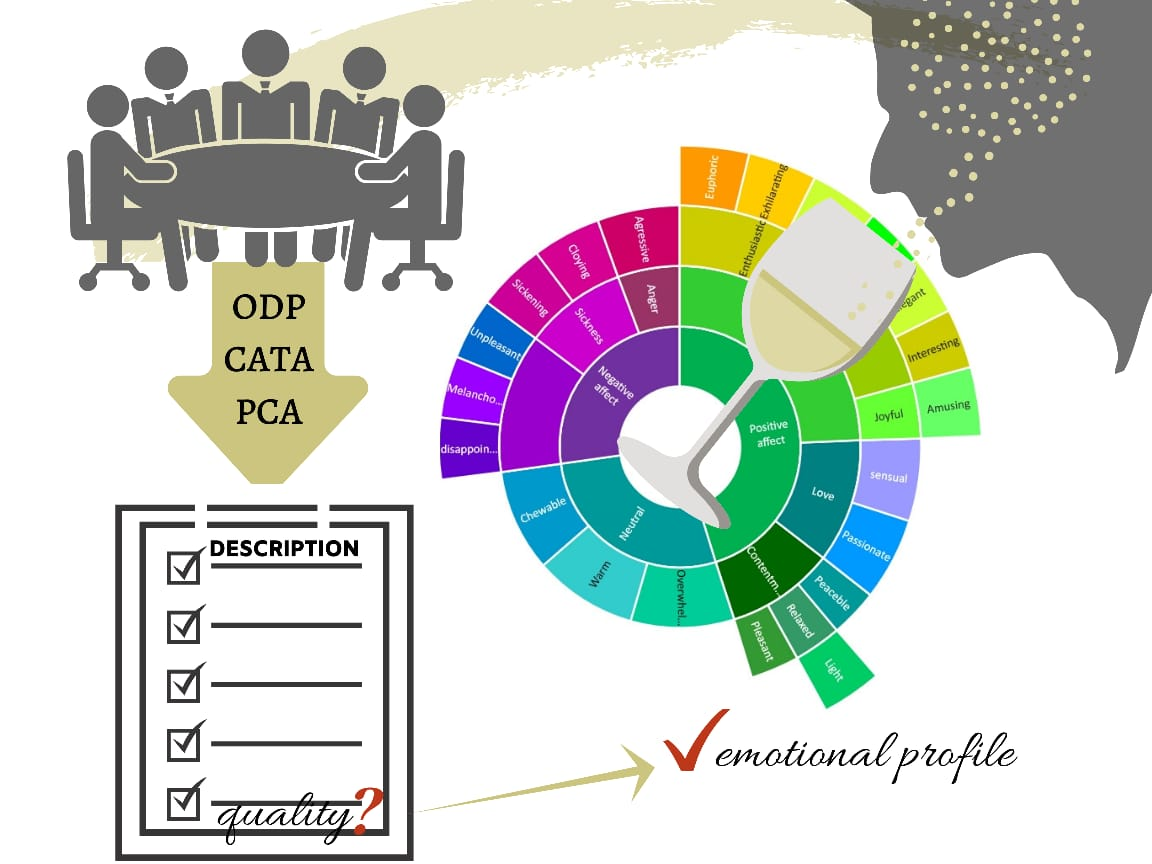
2.5. Development of the Wine Taster Emotion Wheel
2.6. Statistical Analysis
3. Results
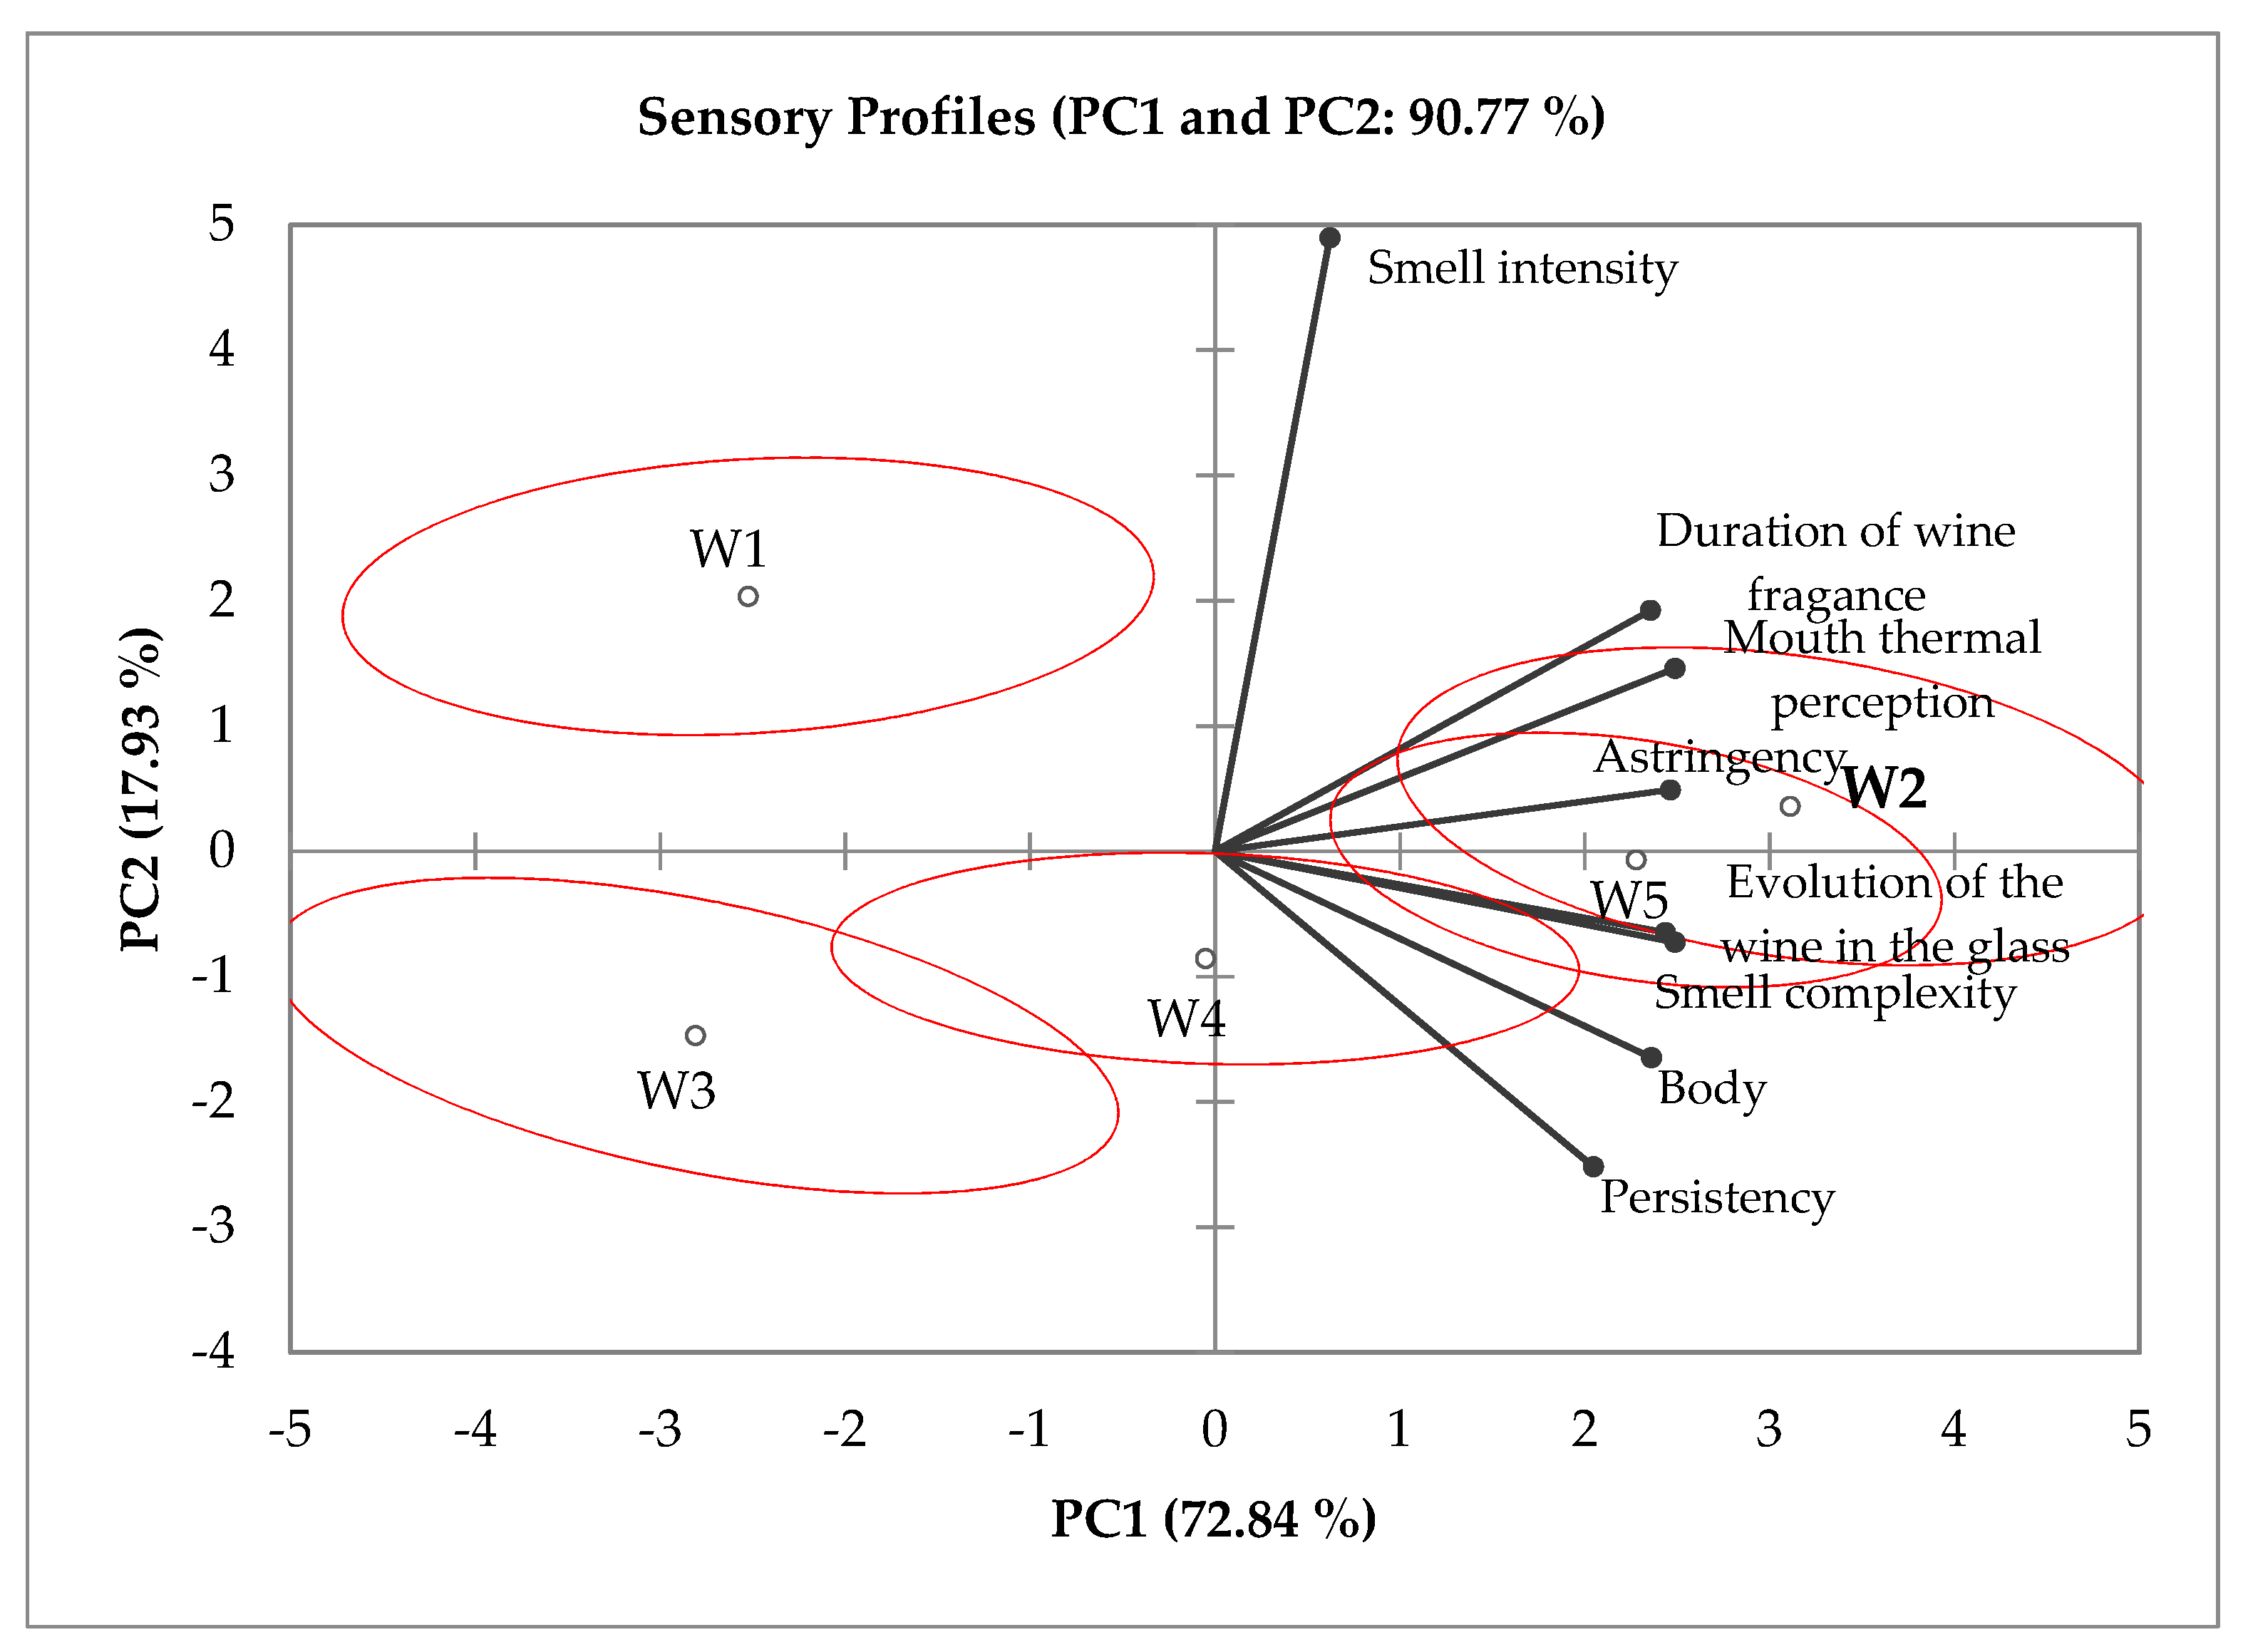
3.1. ODP
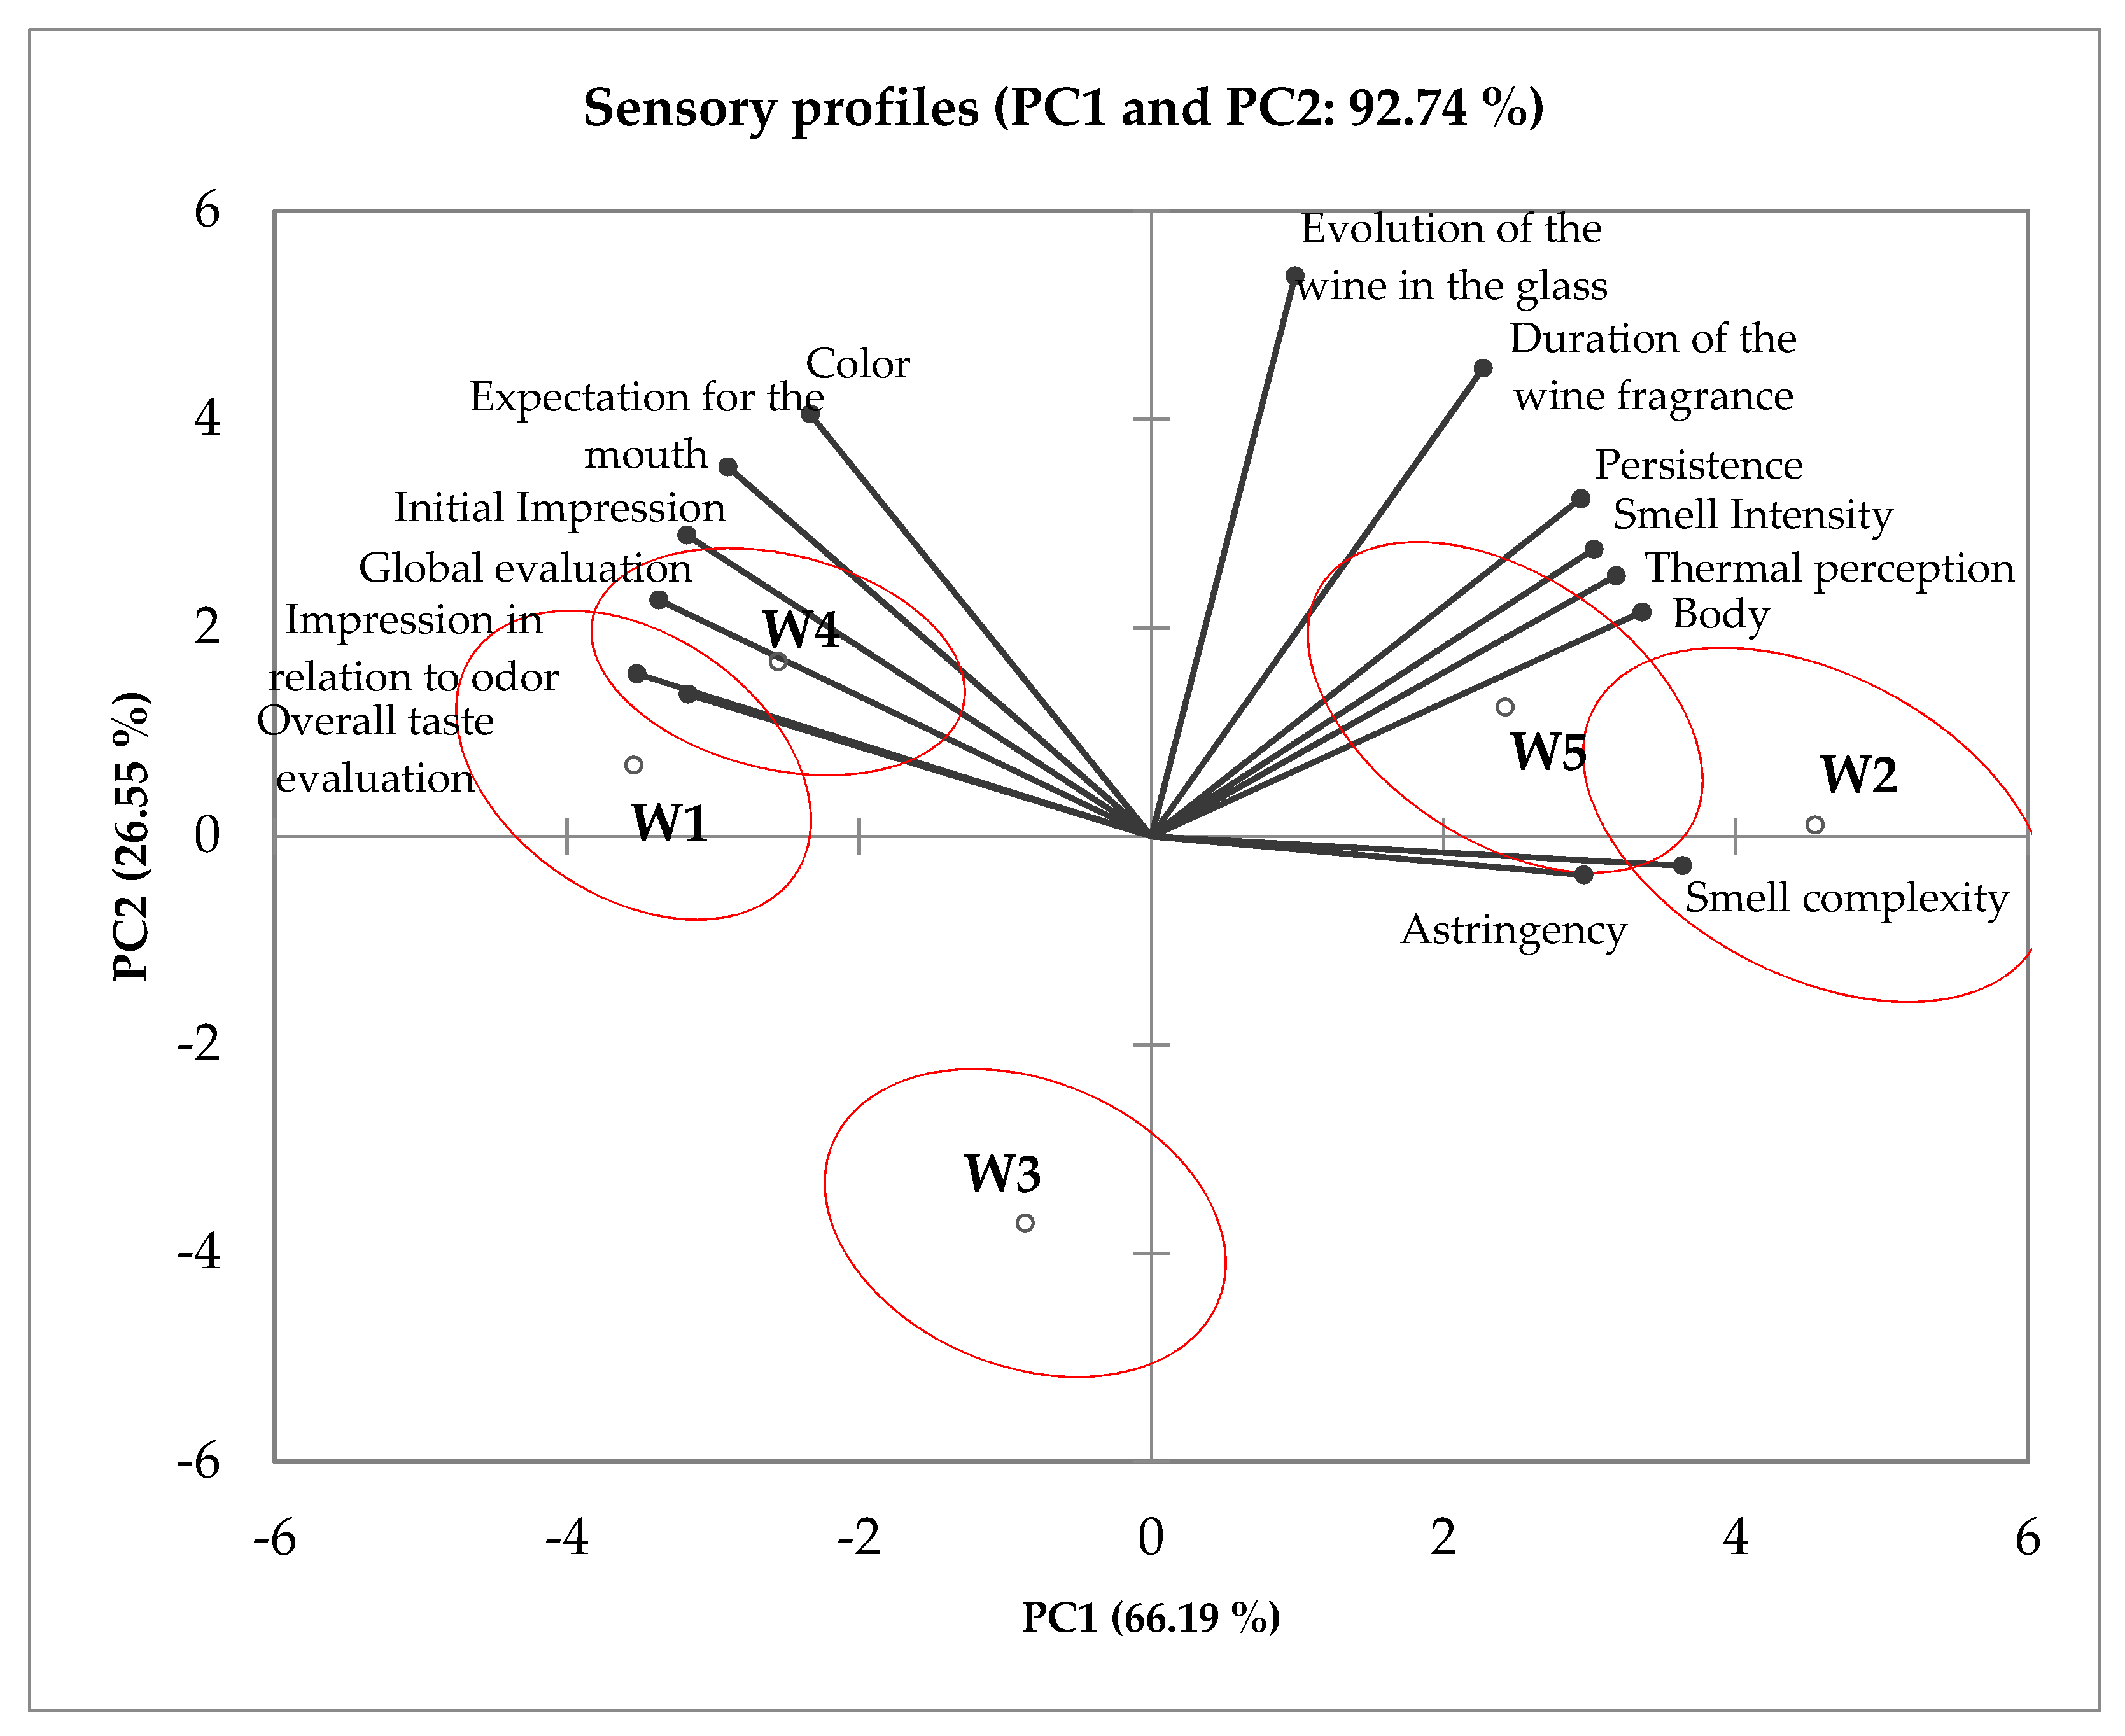
3.2. Consumer Tasting
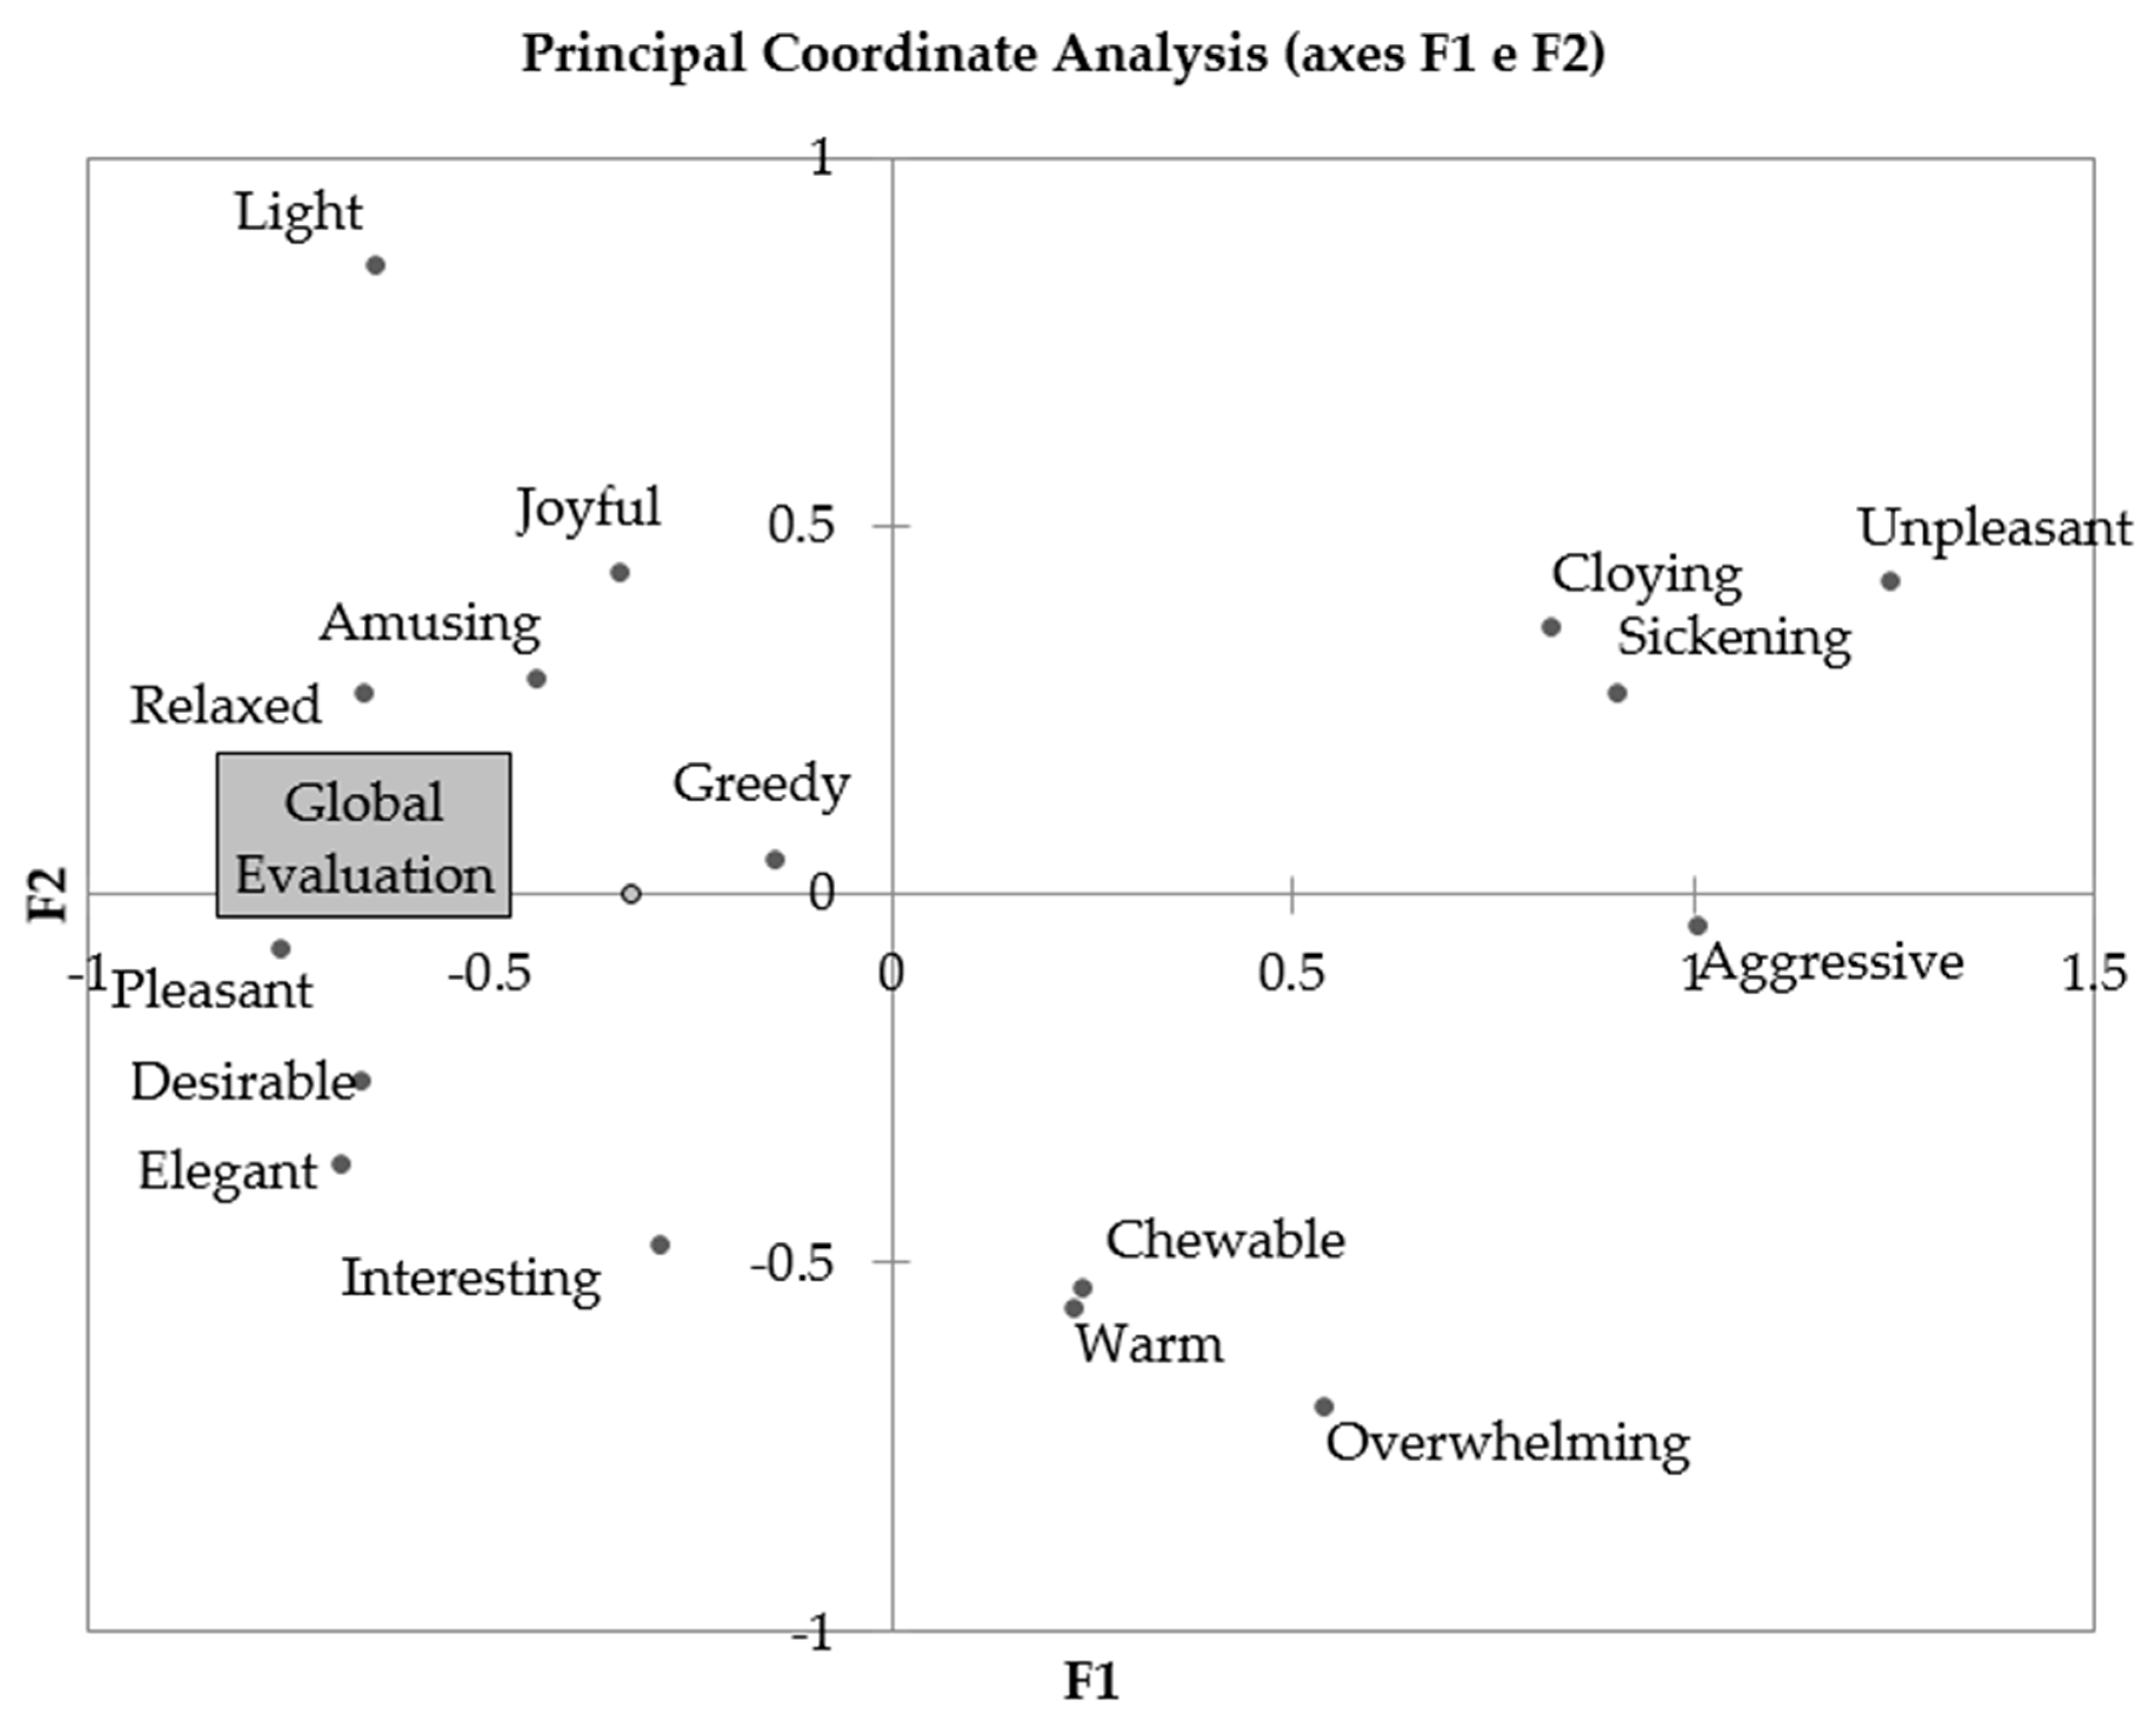
3.3. Check-All-That-Apply for Emotional Responses
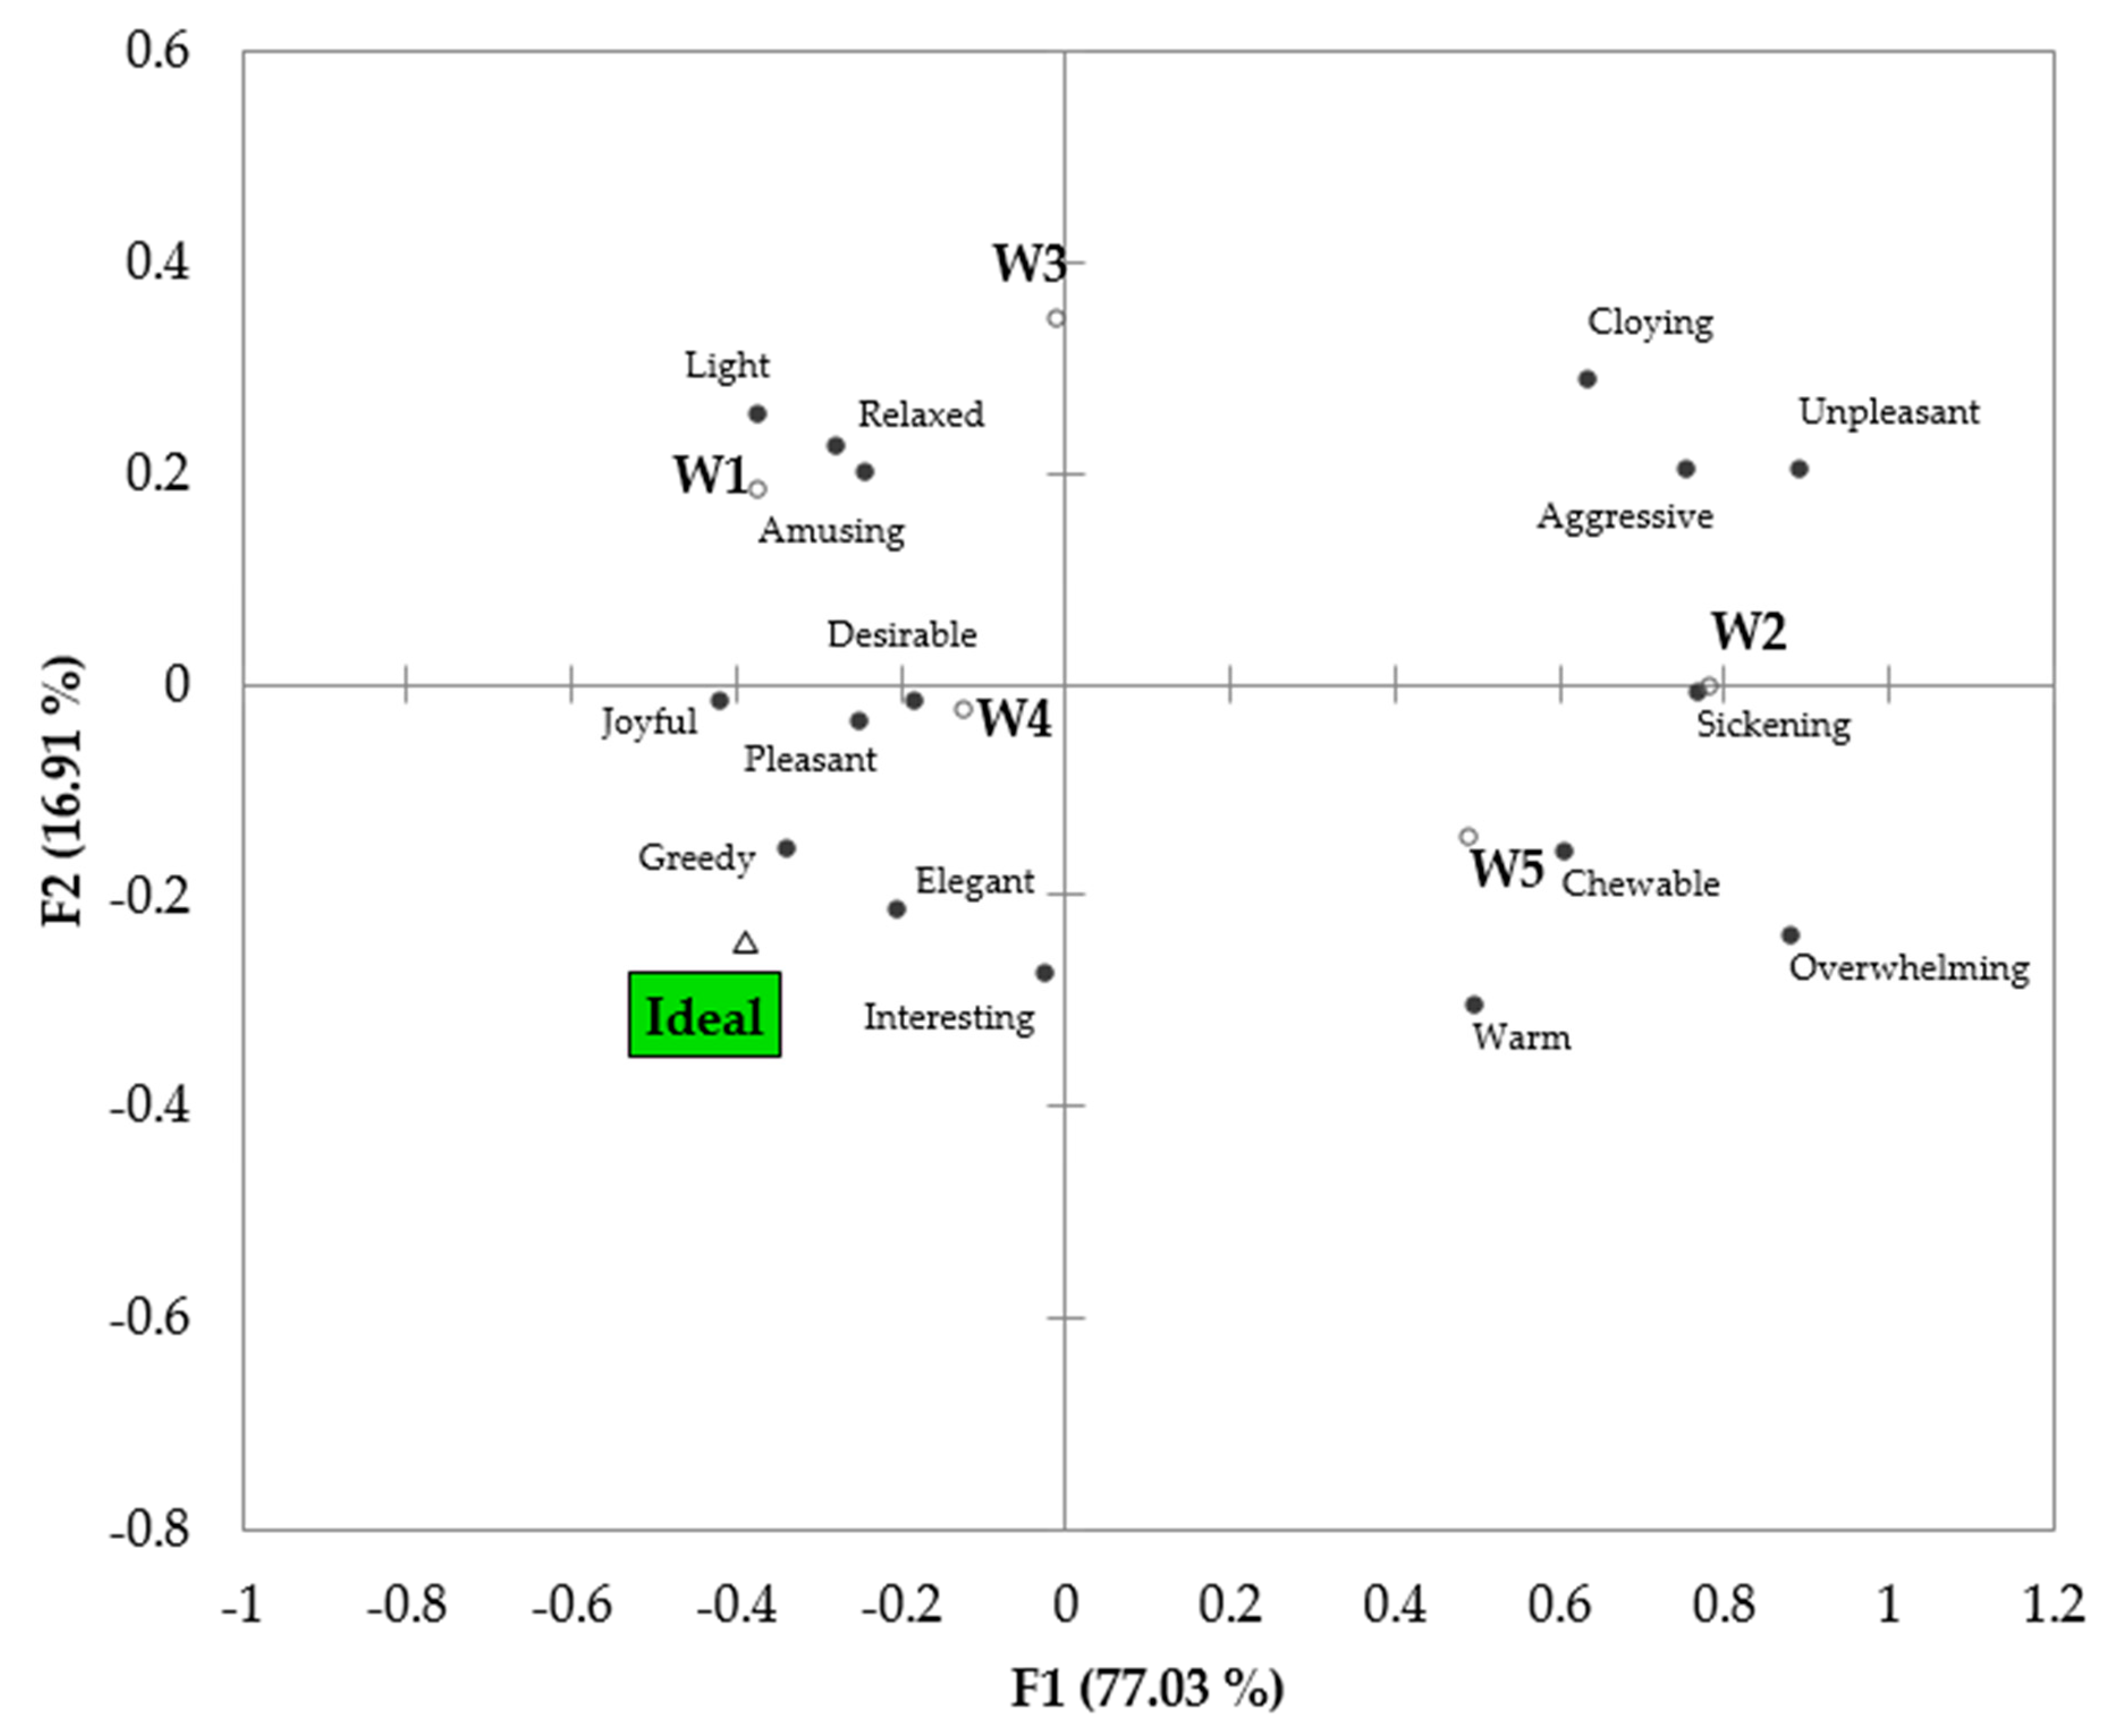
3.4. Ideal Wine Based on Elicited Emotions
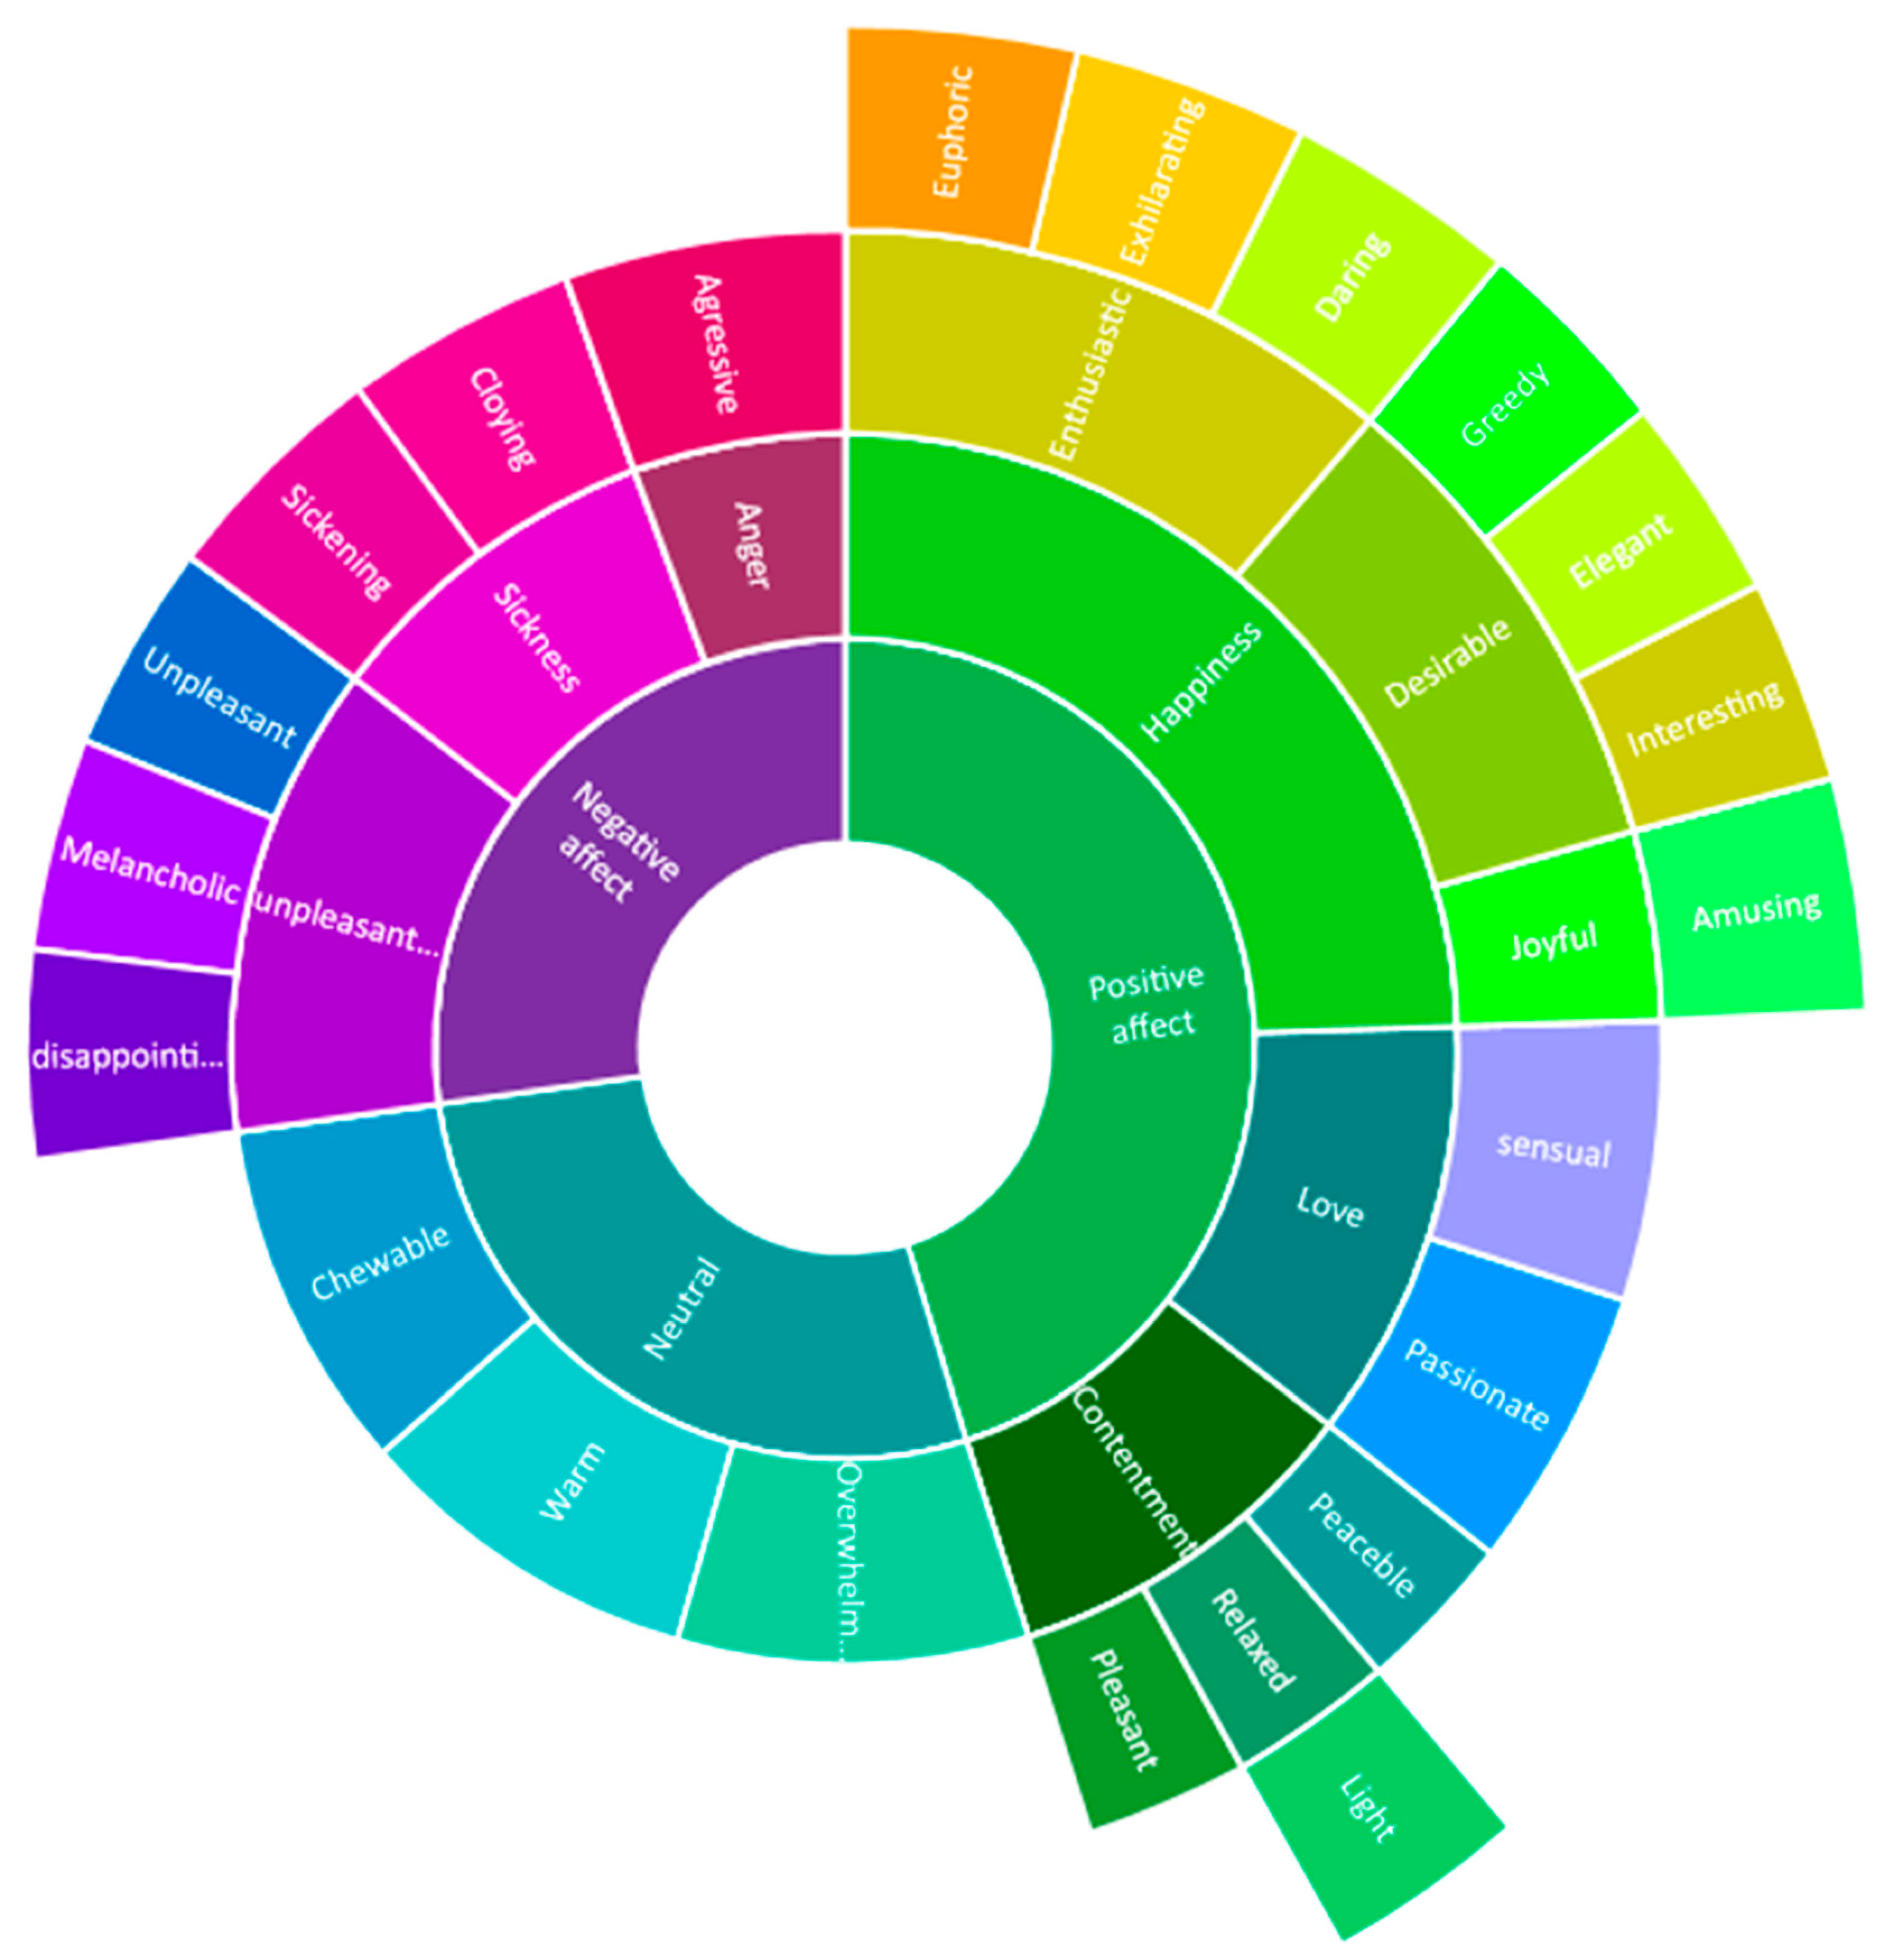
3.5. Emotional Wheel Presentation
4. Conclusions
Supplementary Materials
Author Contributions
Funding
Conflicts of Interest
References
- Francis, I.L.; Williamson, P.O. Application of consumer sensory science in wine research. Aust. J. Grape Wine Res. 2015, 21, 554–567. [Google Scholar] [CrossRef]
- Bruwer, J.; Saliba, A.; Miller, B. Consumer behaviour and sensory preference differences: Implications for wine product marketing. J. Consum. Mark. 2011, 28, 5–18. [Google Scholar] [CrossRef]
- Burnham, D.; Skilleås, O.M. The Aesthetics of Wine; Wiley-Blackwell: Malden, MA, USA, 2012; p. 227. [Google Scholar]
- Holt, H.E.; Francis, I.L.; Field, J.; Herderich, M.J.; Iland, P.G. Relationships between wine phenolic composition and wine sensory properties for Cabernet Sauvignon (Vitis vinifera L.). Aust. J. Grape Wine Res. 2008, 14, 162–176. [Google Scholar]
- Wamg, J.; Capone, D.L.; Wilkinson, K.L.; Jeffery, D.W. Rosé wine volatile composition and the preferences of Chinese wine professionals. Food Chem. 2016, 202, 507–517. [Google Scholar] [CrossRef] [PubMed]
- Sáenz-Navajas, M.-P.; Avizcuri, J.M.; Ballester, J.; Fernández-Zurbano, P.; Ferreira, V.; Peyron, D.; Valentin, D. Sensory-active compounds influencing wine experts’ and consumers’ perception of red wine intrinsic quality. LWT 2015, 60, 400–411. [Google Scholar] [CrossRef]
- Peña-Neira, A. Management of astringency in red wines. In Red Wine Technology, 1st ed.; Morata, A., Ed.; Academic Press: Cambridge, MA, USA, 2019; Chapter 18; pp. 257–272. [Google Scholar]
- Lattey, K.; Bramley, B.; Francis, I. Consumer acceptability, sensory properties and expert quality judgements of Australian Cabernet Sauvignon and Shiraz wines. Aust. J. Grape Wine Res. 2009, 16, 189–202. [Google Scholar] [CrossRef]
- Schlich, P.; Maraboli, M.; Urbano, C.; Parr, W. Perceived complexity in Sauvignon Blanc wines: Influence of domain specific expertise. Aust. J. Grape Wine Res. 2015, 21, 168–178. [Google Scholar] [CrossRef]
- Niimi, J.; Boss, S.; Bastian, P. Sensory profiling and quality assessment of research Cabernet Sauvignon and Chardonnay wines; quality discrimination depends on greater differences in multiple modalities. Food Res. Int. 2018, 106, 304–316. [Google Scholar] [CrossRef]
- Tempère, S.; Marchal, A.; Barbe, J.-C.; Bely, M.; Masneuf-Pomarede, I.; Marullo, P.; Albertin, W. The complexity of wine: Clarifying the role of microorganisms. Appl. Microbiol. Biotechnol. 2018, 109, 3995–4007. [Google Scholar] [CrossRef]
- Wang, Q.; Spence, C. Wine complexity: An empirical investigation. Food Qual. Prefer. 2018, 68, 238–244. [Google Scholar] [CrossRef]
- Smith, B.C. Why is Wine Tasting so Hard? The World of Fine Wine. 2018. Available online: http://www.worldoffinewine.com/News/why-is-wine-tasting-so-hard6223894/ (accessed on 21 January 2020).
- Desmet, P.; Schifferstein, H. Sources of positive and negative emotions in food experience. Appetite 2008, 50, 290–301. [Google Scholar] [CrossRef] [PubMed]
- Yeshurun, Y.; Sobel, N. An odor is not worth a thousand words: From multidimensional odors to unidimensional odor objects. Ann. Rev. Psychol. 2010, 61, 219–241. [Google Scholar] [CrossRef]
- Mora, M.; Urdaneta, E.; Chaya, C. Emotional response to wine: Sensory properties, age and gender as drivers of consumers’ preferences. Food Qual. Prefer. 2018, 66, 19–28. [Google Scholar] [CrossRef]
- Ristic, R.; Danner, L.; Johnson, T.E.; Meiselman, H.L.; Hoek, A.C.; Jiranek, A.C.; Bastian, S.E.P. Wine-related aromas for different seasons and occasions: Hedonic and emotional responses of wine consumers from Australia, UK and USA. Food Qual. Prefer. 2019, 71, 250–260. [Google Scholar] [CrossRef]
- Loureiro, V.; Brasil, R.; Malfeito-Ferreira, M. A new wine tasting approach based on emotional responses to rapidly recognise classic European wine styles. Beverages 2016, 2, 6. [Google Scholar] [CrossRef]
- Coste, A.; Sousa, P.; Malfeito-Ferreira, M. Wine tasting based on emotional responses: An expedite approach to distinguish between warm and cool climate dry red wine styles. Food Res. Int. 2018, 106, 11–21. [Google Scholar] [CrossRef]
- Cooper, J. Cognitive Dissonance: 50 Years of a Classic Theory; Sage Publications: London, UK, 2007. [Google Scholar]
- Hedderley, D.; Wakeling, I. A comparison of imputation techniques for internal preference mapping, using Monte Carlo simulation. Food Qual. Prefer. 1995, 6, 281–297. [Google Scholar] [CrossRef]
- Vidal, L.; Tárrega, A.; Antúnez, L.; Ares, G.; Jaeger, S. Comparison of Correspondence Analysis based on Hellinger and chi-square distances to obtain sensory spaces from check-all-that-apply (CATA) questions. Food Qual. Prefer. 2015, 43, 106–112. [Google Scholar] [CrossRef]
- Van Trijp, H.C.M.; Punter, P.H.; Mickartz, F.; Kruithof, L. The quest for the ideal product: Comparing different methods and approaches. Food Qual. Prefer. 2007, 18, 729–740. [Google Scholar] [CrossRef]
- Gawel, R.; Oberholster, A.; Francis, I.L. A mouth-feel wheel: Terminology for communicating the mouth-feel characteristics of red wine. Aust. J. Grape Wine Res. 2000, 6, 203–207. [Google Scholar] [CrossRef]
- Pickering, G.J.; Demiglio, P. The White Wine Mouthfeel Wheel: A Lexicon for describing the oral sensations elicited by white wine. J. Wine Res. 2008, 19, 51–67. [Google Scholar] [CrossRef]
- Laros, F.J.; Steenkamp, J.E. Emotions in consumer behavior: A hierarchical approach. J. Bus. Res. 2005, 58, 1437–1445. [Google Scholar] [CrossRef]
- Addinsoft. XLSTAT Statistical and Data Analysis Solution; XLSTAT: Boston, MA, USA, 2020.
- Stone, H.; Sidel, J.L. Sensory Evaluation Practices, 3rd ed.; Academic Press: New York, NY, USA, 2004. [Google Scholar]
- Ferrarini, R.; Carbognin, C.; Casarotti, E.M.; Nicolis, E.; Nencini, A.; Meneghini, A.M. The emotional response to wine consumption. Food Qual. Prefer. 2010, 21, 720–725. [Google Scholar] [CrossRef]
- Ciolfi, E. Né Griffato né Famoso: Il vino della Memoria Degli Eno-Appassionati è Legato a un Momento Speciale della vita. Winenews, 6 Marzo, 2009. Available online: https://winenews.it/it/ne-griffato-ne-famoso-il-vino-della-memoria-degli-eno_300477/ (accessed on 17 February 2020).


| Wine | W1 | W2 | W3 | W4 | W5 |
|---|---|---|---|---|---|
| Brand/Producer | Vale dos Barris/Adega Cooperativa de Palmela | Colheita do Sócio Reserva/Adega Cooperativa da Covilhã | Casal Garcia/Aveleda | Casa da Senra/Estate producer | Pouilly-Fuissé/Roux Pére & Fils |
| Region | Península de Setúbal IPR a | Beira Interior DOC b | Vinho Verde DOC | Vinho Verde DOC | Pouilly-Fuissé (Burgundy) AOC c |
| Varietal | Muscat of Alexandria | Blend | Blend | Loureiro | Chardonnay |
| Vintage | 2014 | 2005 | Not dated | 2014 | 2004 |
| Color | Citrus yellow | Yellow straw | Citrus yellow | Citrus yellow | Yellow straw |
| Odor | Intense flowery–fruity | Medium intensity developed | Medium intensity, fruity | Medium intensity, fruity | Medium intensity developed |
| Acidity (taste) | Low | Medium to high | Medium | Medium to high | High |
| Residual Sugars | <2 g/L | <2 g/L | 11 g/L | <2 g/L | <2 g/L |
| Alcohol | 12.0% vol. | 13.5% vol. | 9.5% vol. | 13.0% vol. | 13.0% vol. |
| Attribute | Fsample × Taster | p-Value |
|---|---|---|
| Intensity (smell) | 4.485 | 0.000 * |
| Thermal Perception | 5.790 | 0.000 * |
| Body | 3.621 | 0.000 * |
| Astringency | 4.893 | 0.000 * |
| Persistence | 3.590 | 0.000 * |
| Evolution of the Wine in the Glass | 4.649 | 0.000 * |
| Duration of the Wine Fragrance | 5.151 | 0.000 * |
| Complexity | 7.611 | 0.000 * |
| Attributes | p-Values | Wines | ||||
|---|---|---|---|---|---|---|
| W1 | W2 | W3 | W4 | W5 | ||
| Smell Intensity | <0.0001 | 5.184 c | 4.086 bc | 2.269 a | 3.631 ab | 4.247 bc |
| Smell Complexity | <0.0001 | 1.876 a | 5.678 d | 2.647 ab | 3.233 bc | 4.400 cd |
| Mouth Thermal Perception | <0.0001 | 2.824 a | 4.669 b | 2.111 a | 2.862 a | 4.238 b |
| Body | 0.001 | 2.189 a | 3.516 bc | 2.482 ab | 3.482 bc | 3.758 c |
| Astringency | 0.001 | 1.949 ab | 2.991 bc | 1.700 a | 2.284 abc | 3.396 c |
| Mouth Persistence | 0.002 | 2.544 a | 3.845 ab | 3.122 ab | 4.211 b | 4.316 b |
| Evolution of the Wine in the Glass | 0.000 | 1.657 a | 3.881 b | 2.082 a | 2.416 a | 2.941 ab |
| Duration of the Wine Fragrance | <0.0001 | 3.441 ab | 5.419 c | 2.250 a | 3.630 ab | 4.191 bc |
| Descriptors | p-Values | Wines | ||||
|---|---|---|---|---|---|---|
| W1 | W2 | W3 | W4 | W5 | ||
| Color | <0.0001 | 3.625 bc | 3.202 a | 3.212 a | 3.942 c | 3.500 ab |
| Initial Impression | <0.0001 | 3.654 b | 2.689 a | 2.903 a | 3.692 b | 3.019 a |
| Smell Intensity | <0.0001 | 3.279 a | 3.808 b | 2.971 a | 3.135 a | 3.702 b |
| Smell Complexity | 0.003 | 2.845 a | 3.519 b | 3.154 ab | 2.990 ab | 3.417 b |
| Expectation for the Mouth | 0.003 | 3.375 bc | 2.902 a | 2.923 ab | 3.394 c | 3.058 abc |
| Impression in Relation to Odor | 0.004 | 3.275 b | 2.827 a | 3.165 ab | 3.388 b | 3.176 ab |
| Thermal Perception | <0.0001 | 2.288 a | 3.317 c | 2.385 ab | 2.750 b | 3.437 c |
| Body | <0.0001 | 2.269 a | 3.346 b | 2.375 a | 2.631 a | 3.346 b |
| Astringency | <0.0001 | 2.269 a | 3.067 b | 2.837 b | 2.837 b | 2.990 b |
| Persistence | <0.0001 | 3.019 a | 3.702 b | 2.913 a | 3.327 ab | 3.500 b |
| Overall Taste Evaluation | <0.0001 | 3.558 b | 2.865 a | 3.212 ab | 3.548 b | 3.144 ab |
| Evolution of the Wine in the Glass | 0.002 | 2.806 b | 2.846 b | 2.327 a | 2.769 b | 2.856 b |
| Duration of the Wine Fragrance | 0.000 | 3.223 ab | 3.519 b | 2.875 a | 3.269 ab | 3.500 b |
| Global Evaluation | <0.0001 | 3.853 b | 3.030 a | 3.279 a | 3.825 b | 3.252 a |
| Emotions | p-Values | Wines | ||||
|---|---|---|---|---|---|---|
| W1 | W2 | W3 | W4 | W5 | ||
| Pleasant | 0.000 | 0.548 b | 0.202 a | 0.308 a | 0.452 b | 0.260 a |
| Aggressive | 0.000 | 0.077 a | 0.356 d | 0.231 bc | 0.154 ab | 0.288 cd |
| Joyful | 0.000 | 0.221 b | 0.029 a | 0.202 b | 0.250 b | 0.077 a |
| Warm | 0.000 | 0.096 ab | 0.337 c | 0.058 a | 0.183 b | 0.337 c |
| Light | 0.000 | 0.510 c | 0.096 a | 0.365 b | 0.308 b | 0.087 a |
| Chewable | 0.001 | 0.019 a | 0.173 c | 0.058 ab | 0.067 ab | 0.106 bc |
| Unpleasant | 0.000 | 0.048 a | 0.250 b | 0.106 a | 0.058 a | 0.125 a |
| Relaxed | 0.000 | 0.365 d | 0.087 a | 0.212 bc | 0.250 cd | 0.106 ab |
| Desirable | 0.002 | 0.317 b | 0.135 a | 0.231 ab | 0.327 b | 0.202 ab |
| Interesting | 0.005 | 0.212 abc | 0.183 ab | 0.125 a | 0.298 bc | 0.308 c |
| Sickening | 0.040 | 0.019 a | 0.077 ab | 0.038 ab | 0.019 a | 0.087 b |
| Overwhelming | 0.016 | 0 a | 0.067 b | 0.010 ab | 0.048 ab | 0.067 b |
| Amusing | 0.017 | 0.163 b | 0.029 a | 0.144 b | 0.125 b | 0.087 ab |
| Cloying | 0.033 | 0.096 a | 0.240 b | 0.173 ab | 0.115 a | 0.183 ab |
| Greedy | 0.049 | 0.135 b | 0.058 ab | 0.058 ab | 0.077 ab | 0.038 a |
| Elegant | 0.058 | 0.231 a | 0.144 a | 0.144 a | 0.269 a | 0.163 a |
| Peaceable | 0.165 | 0.202 b | 0.087 a | 0.135 ab | 0.154 ab | 0.115 ab |
| Daring | 0.204 | 0.106 a | 0.192 a | 0.202 a | 0.212 a | 0.173 a |
| Disappointing | 0.226 | 0.106 a | 0.183 a | 0.125 a | 0.096 a | 0.173 a |
| Melancholic | 0.245 | 0.067 ab | 0.106 b | 0.077 ab | 0.029 a | 0.077 ab |
| Euphoric | 0.310 | 0.048 a | 0.077 a | 0.115 a | 0.067 a | 0.058 a |
| Sensual | 0.406 | 0.135 a | 0.087 a | 0.058 a | 0.106 a | 0.106 a |
| Exhilarating | 0.713 | 0.125 a | 0.106 a | 0.087 a | 0.144 a | 0.125 a |
| Passionate | 0.773 | 0.096 a | 0.067 a | 0.067 a | 0.096 a | 0.106 a |
| Surprising | 0.860 | 0.106 a | 0.154 a | 0.135 a | 0.144 a | 0.125 a |
© 2020 by the authors. Licensee MDPI, Basel, Switzerland. This article is an open access article distributed under the terms and conditions of the Creative Commons Attribution (CC BY) license (http://creativecommons.org/licenses/by/4.0/).
Share and Cite
Souza-Coutinho, M.; Brasil, R.; Souza, C.; Sousa, P.; Malfeito-Ferreira, M. Consumers Associate High-Quality (Fine) Wines with Complexity, Persistence, and Unpleasant Emotional Responses. Foods 2020, 9, 452. https://doi.org/10.3390/foods9040452
Souza-Coutinho M, Brasil R, Souza C, Sousa P, Malfeito-Ferreira M. Consumers Associate High-Quality (Fine) Wines with Complexity, Persistence, and Unpleasant Emotional Responses. Foods. 2020; 9(4):452. https://doi.org/10.3390/foods9040452
Chicago/Turabian StyleSouza-Coutinho, Maria, Renato Brasil, Clarisse Souza, Paulo Sousa, and Manuel Malfeito-Ferreira. 2020. "Consumers Associate High-Quality (Fine) Wines with Complexity, Persistence, and Unpleasant Emotional Responses" Foods 9, no. 4: 452. https://doi.org/10.3390/foods9040452
APA StyleSouza-Coutinho, M., Brasil, R., Souza, C., Sousa, P., & Malfeito-Ferreira, M. (2020). Consumers Associate High-Quality (Fine) Wines with Complexity, Persistence, and Unpleasant Emotional Responses. Foods, 9(4), 452. https://doi.org/10.3390/foods9040452