Determining Which Cooking Method Provides the Best Sensory Differentiation of Potatoes †


Abstract
1. Introduction
2. Materials and Methods
2.1. Potato Samples
2.2. Sample Preparation
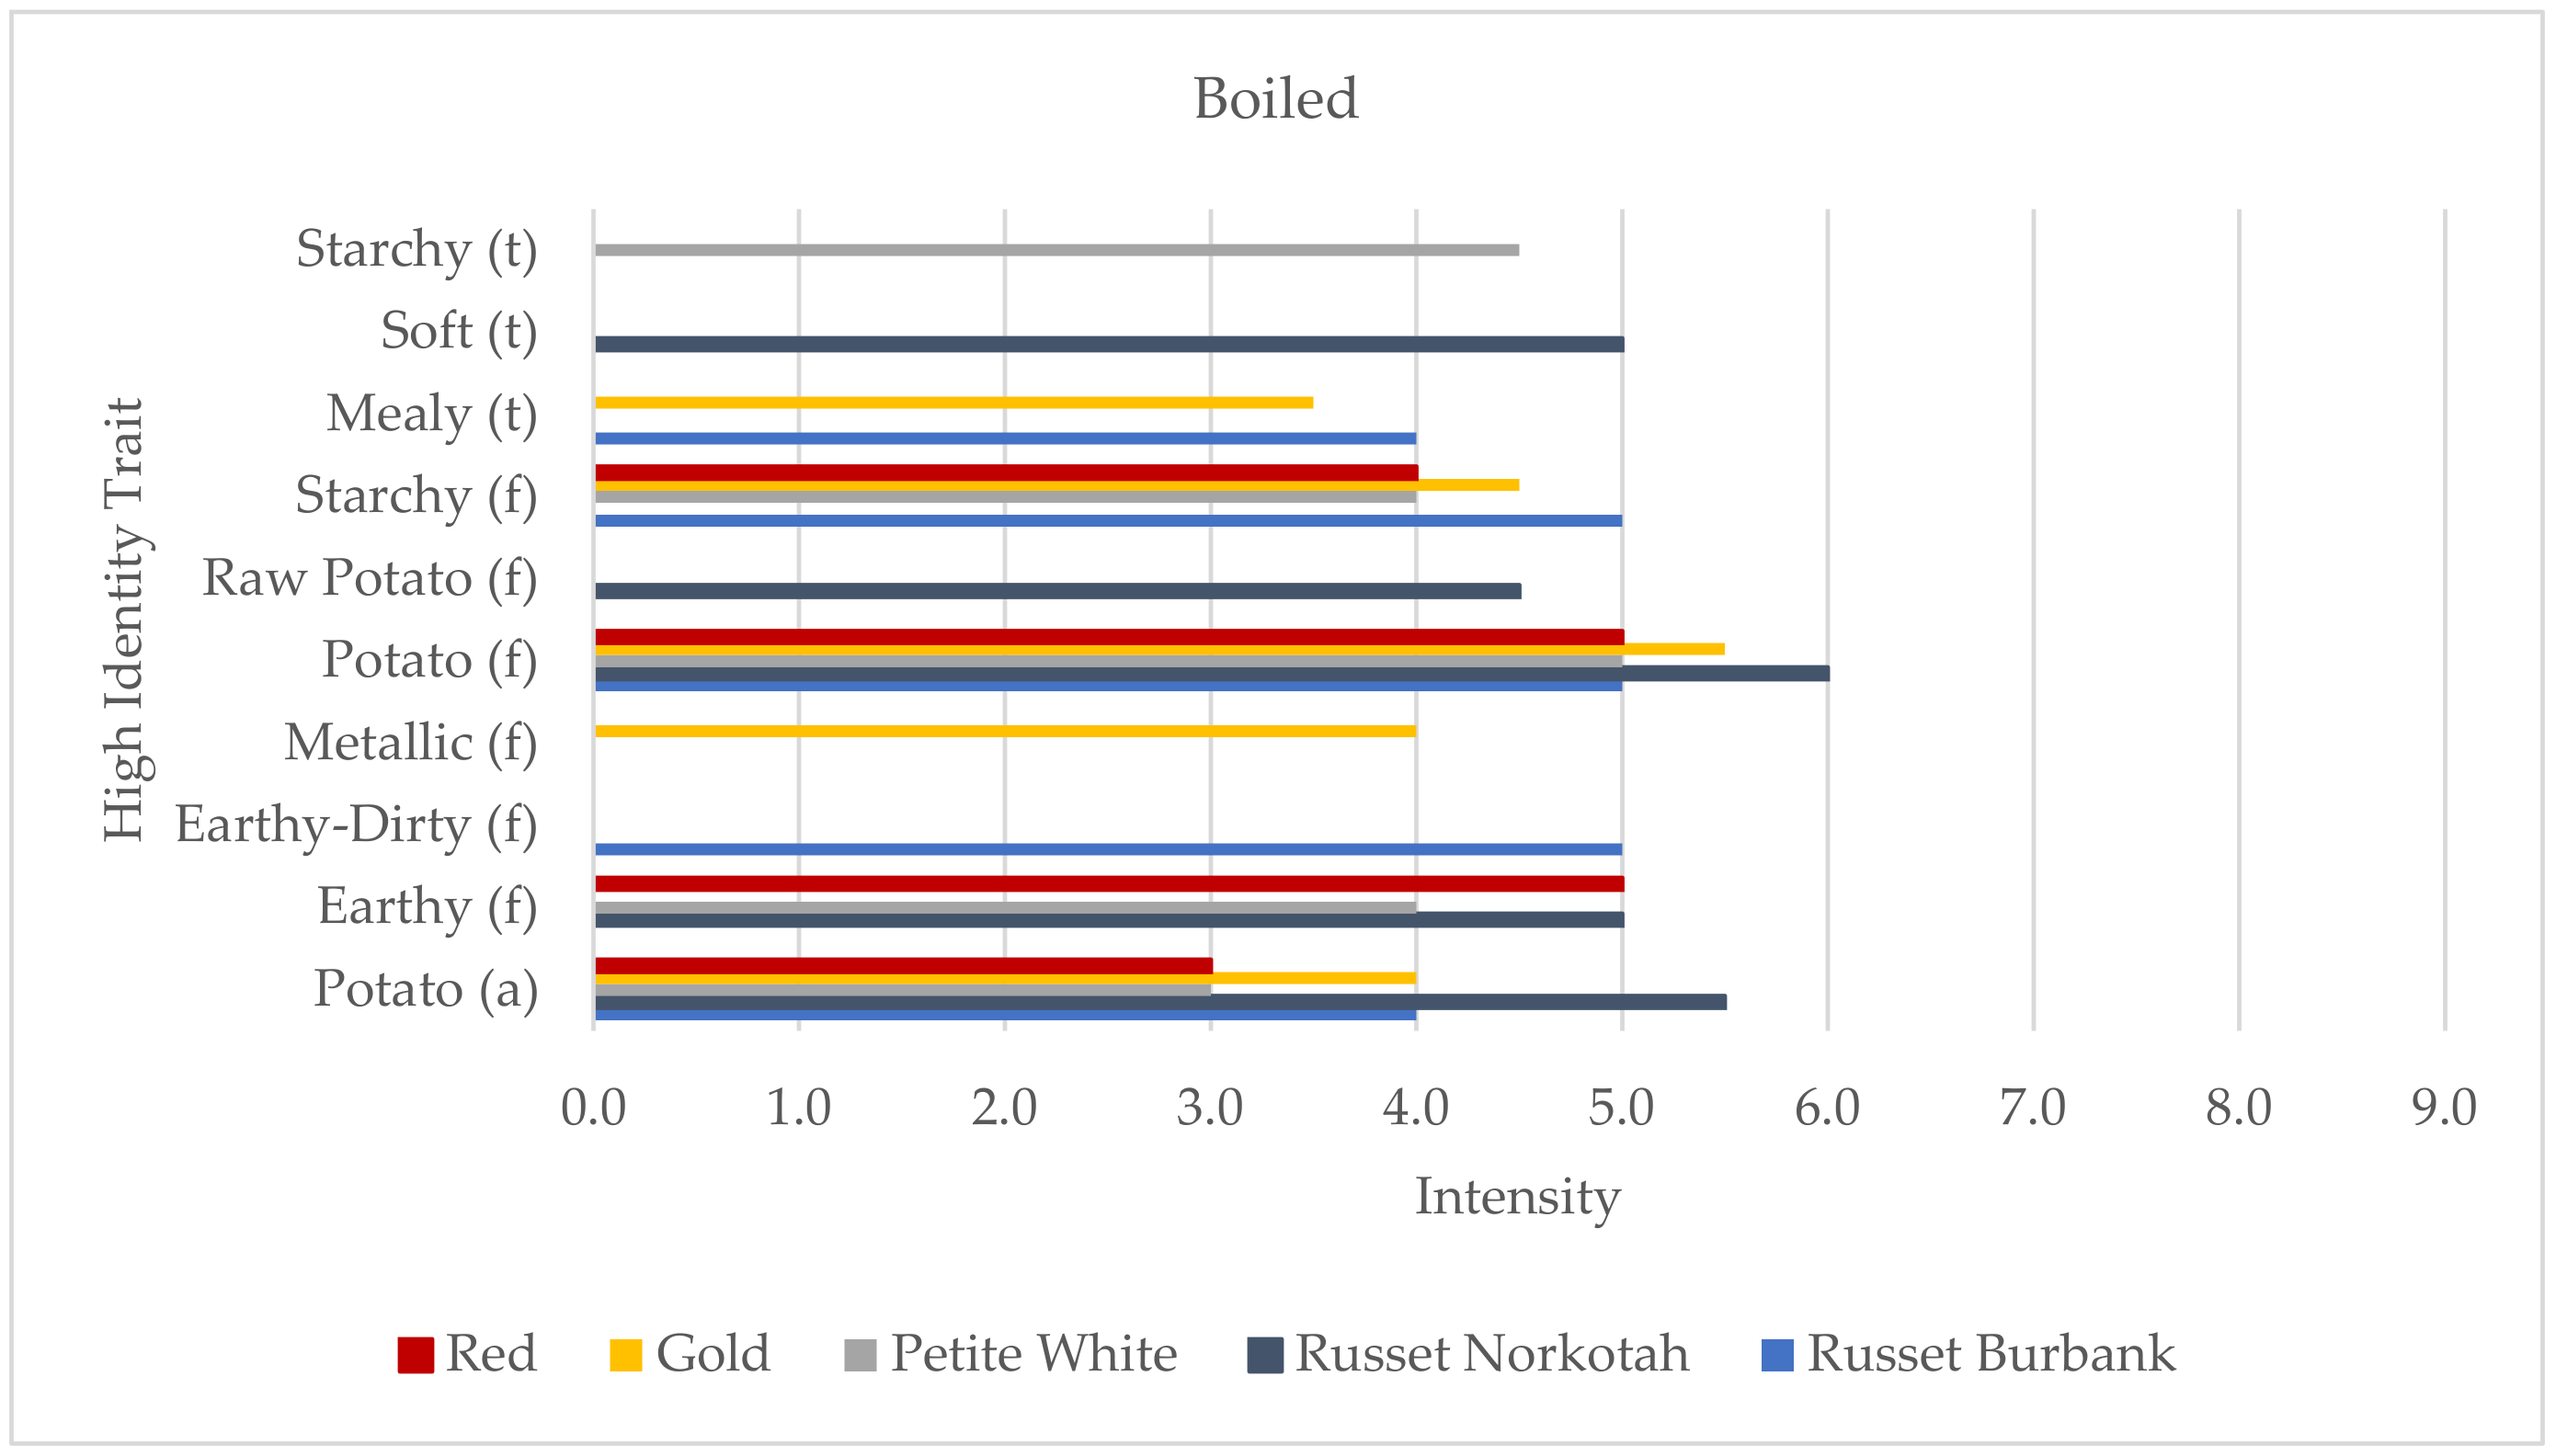
2.2.1. Boiled
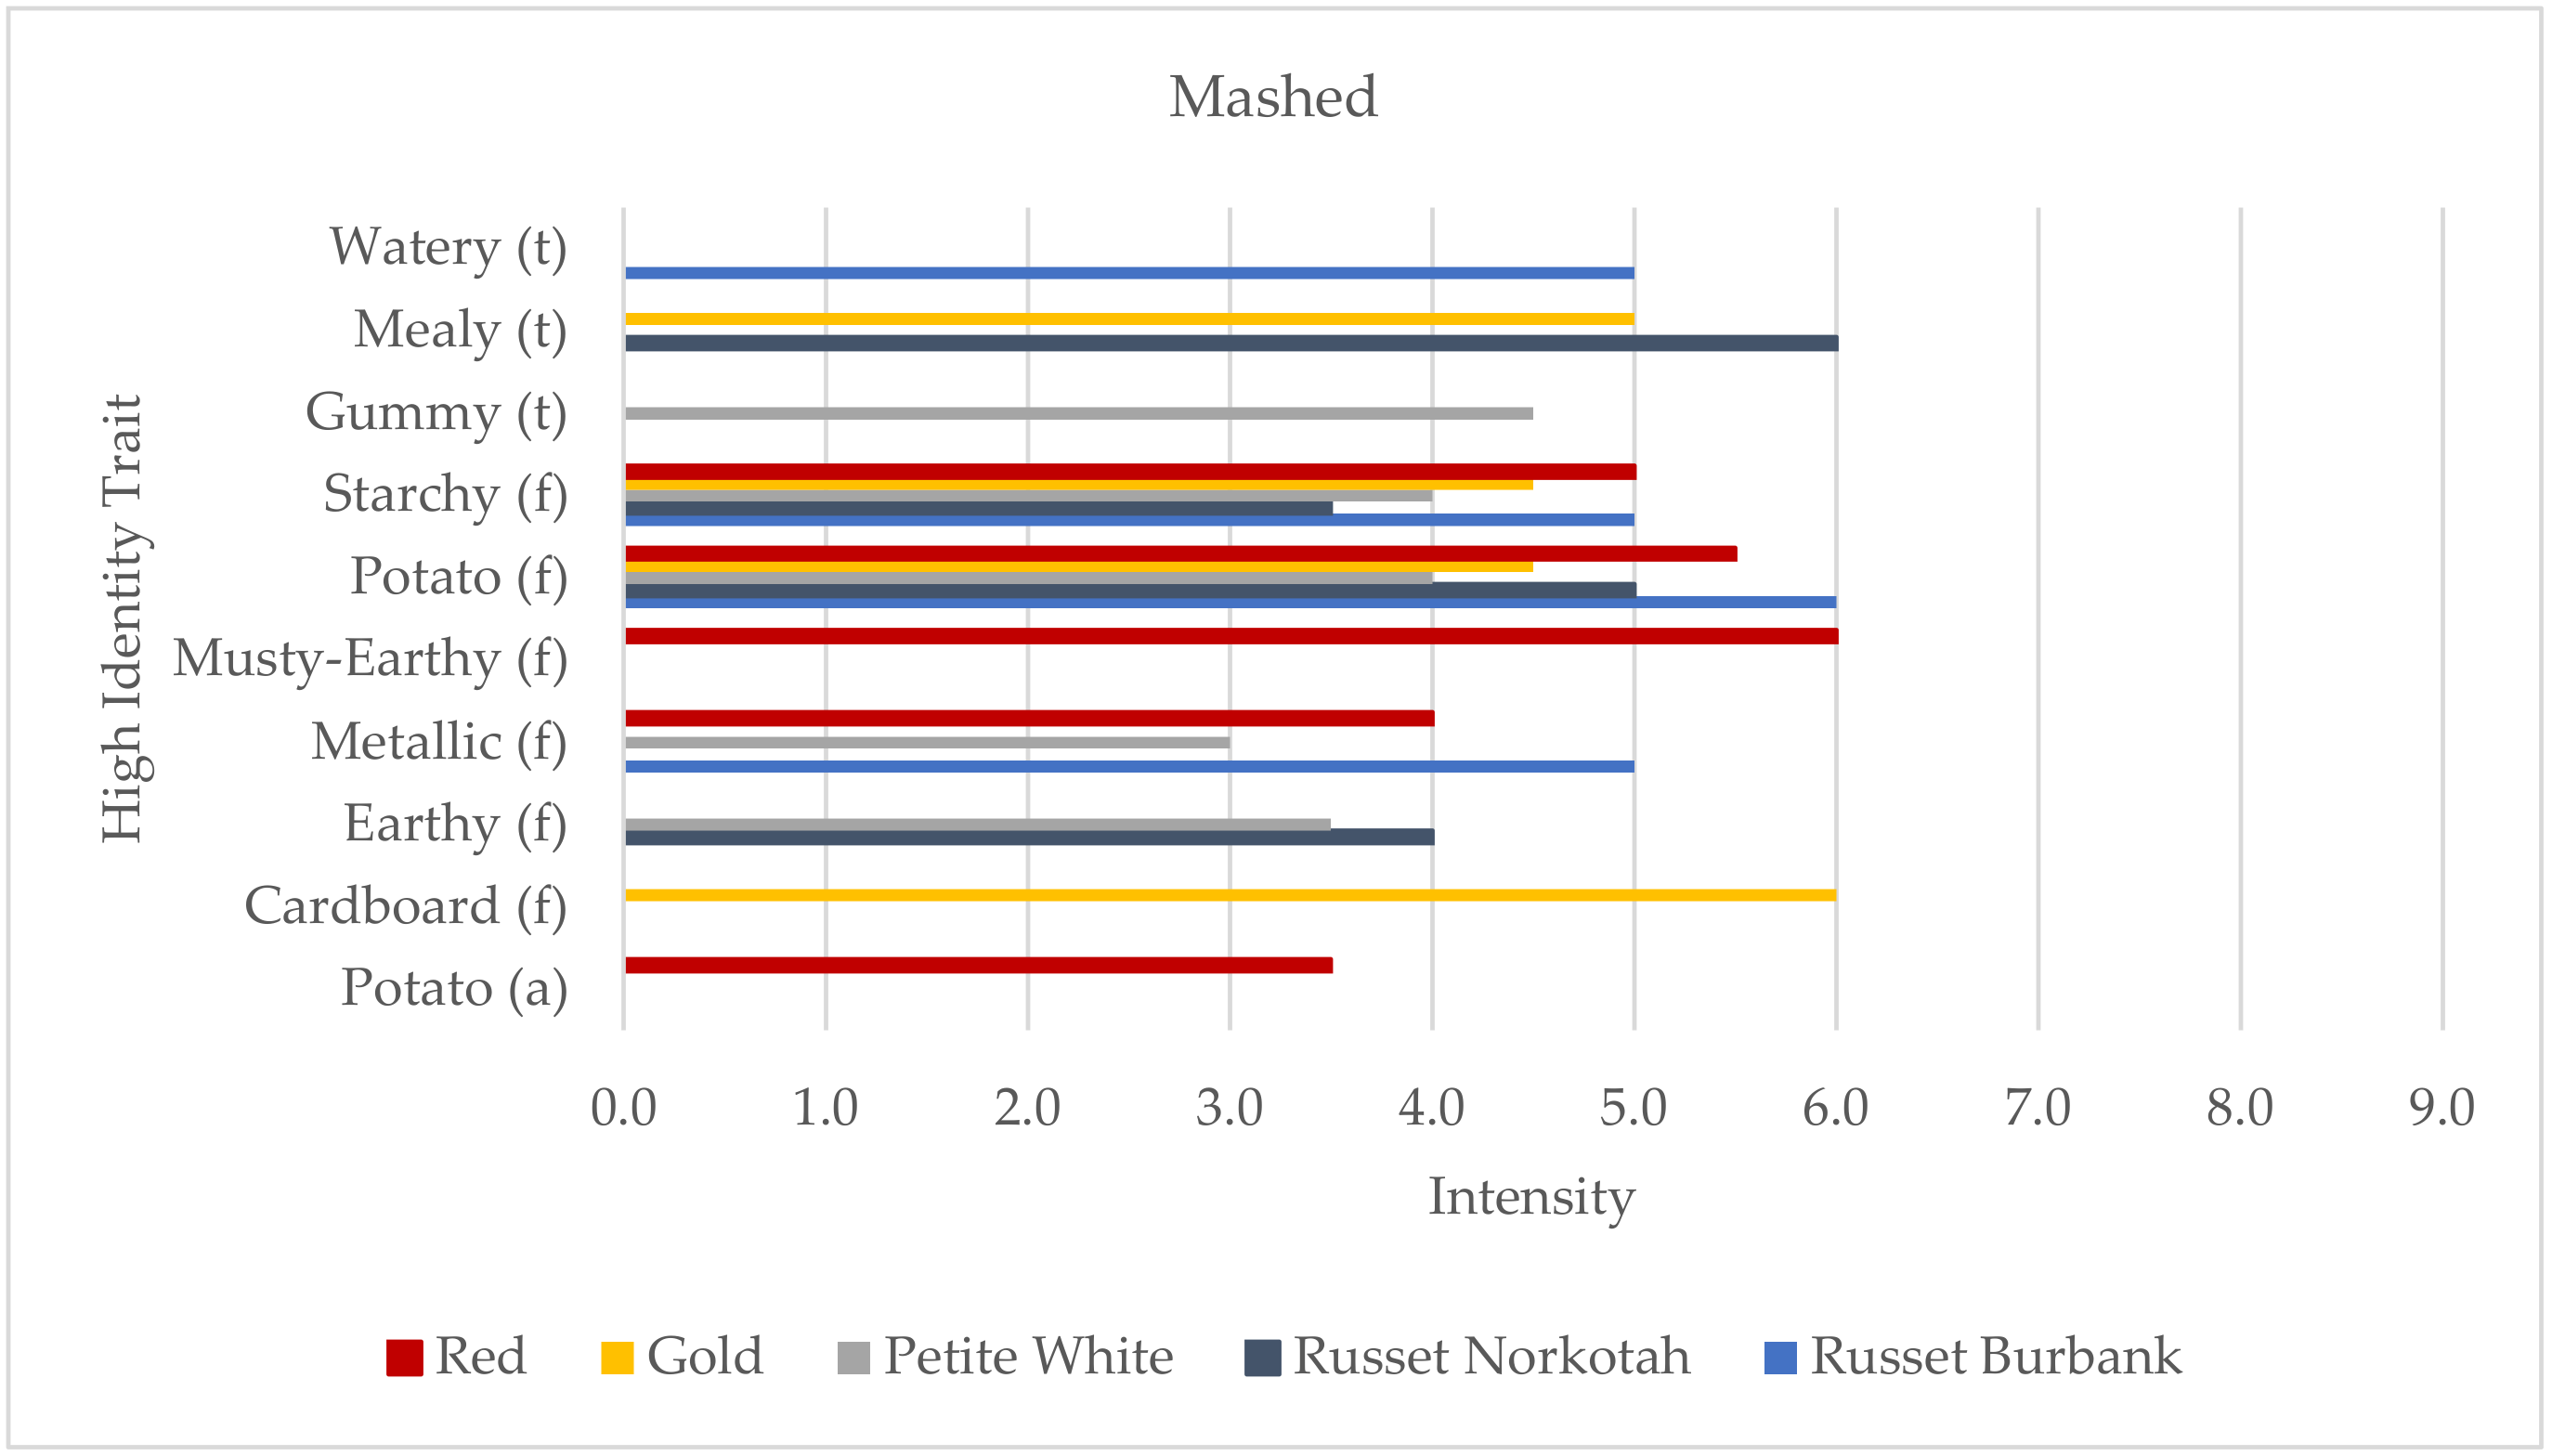
2.2.2. Mashed
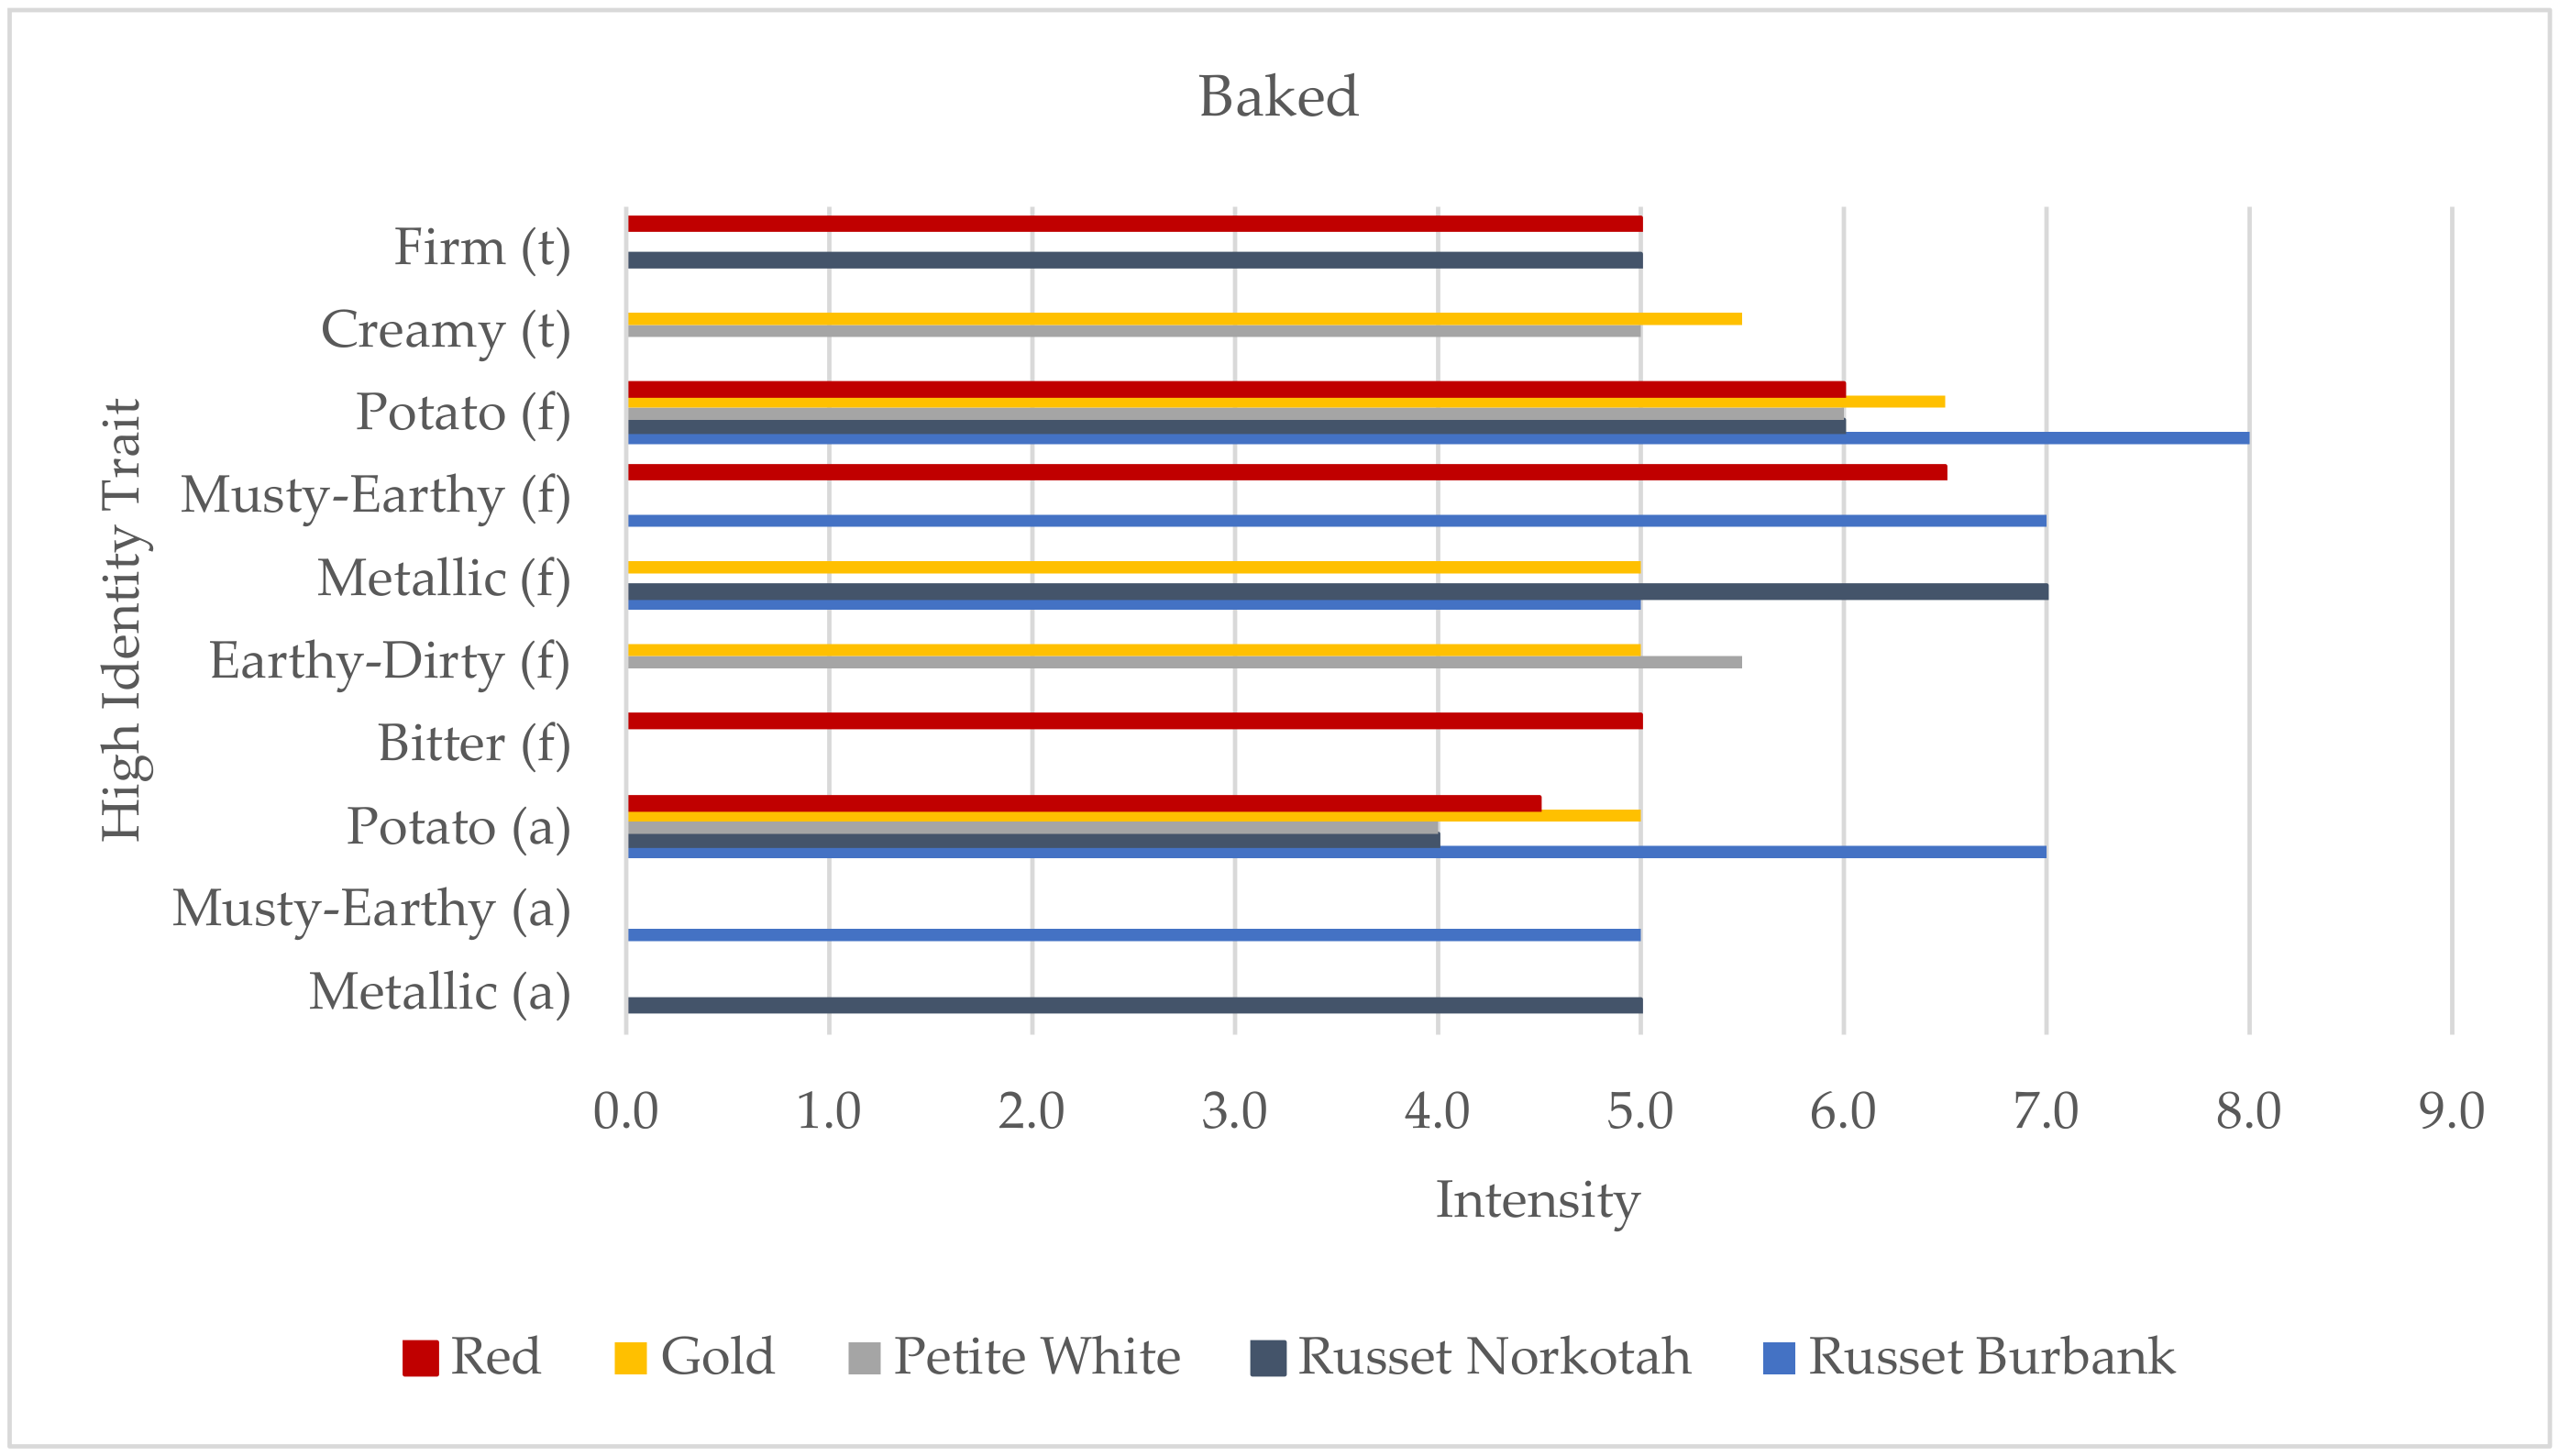
2.2.3. Baked
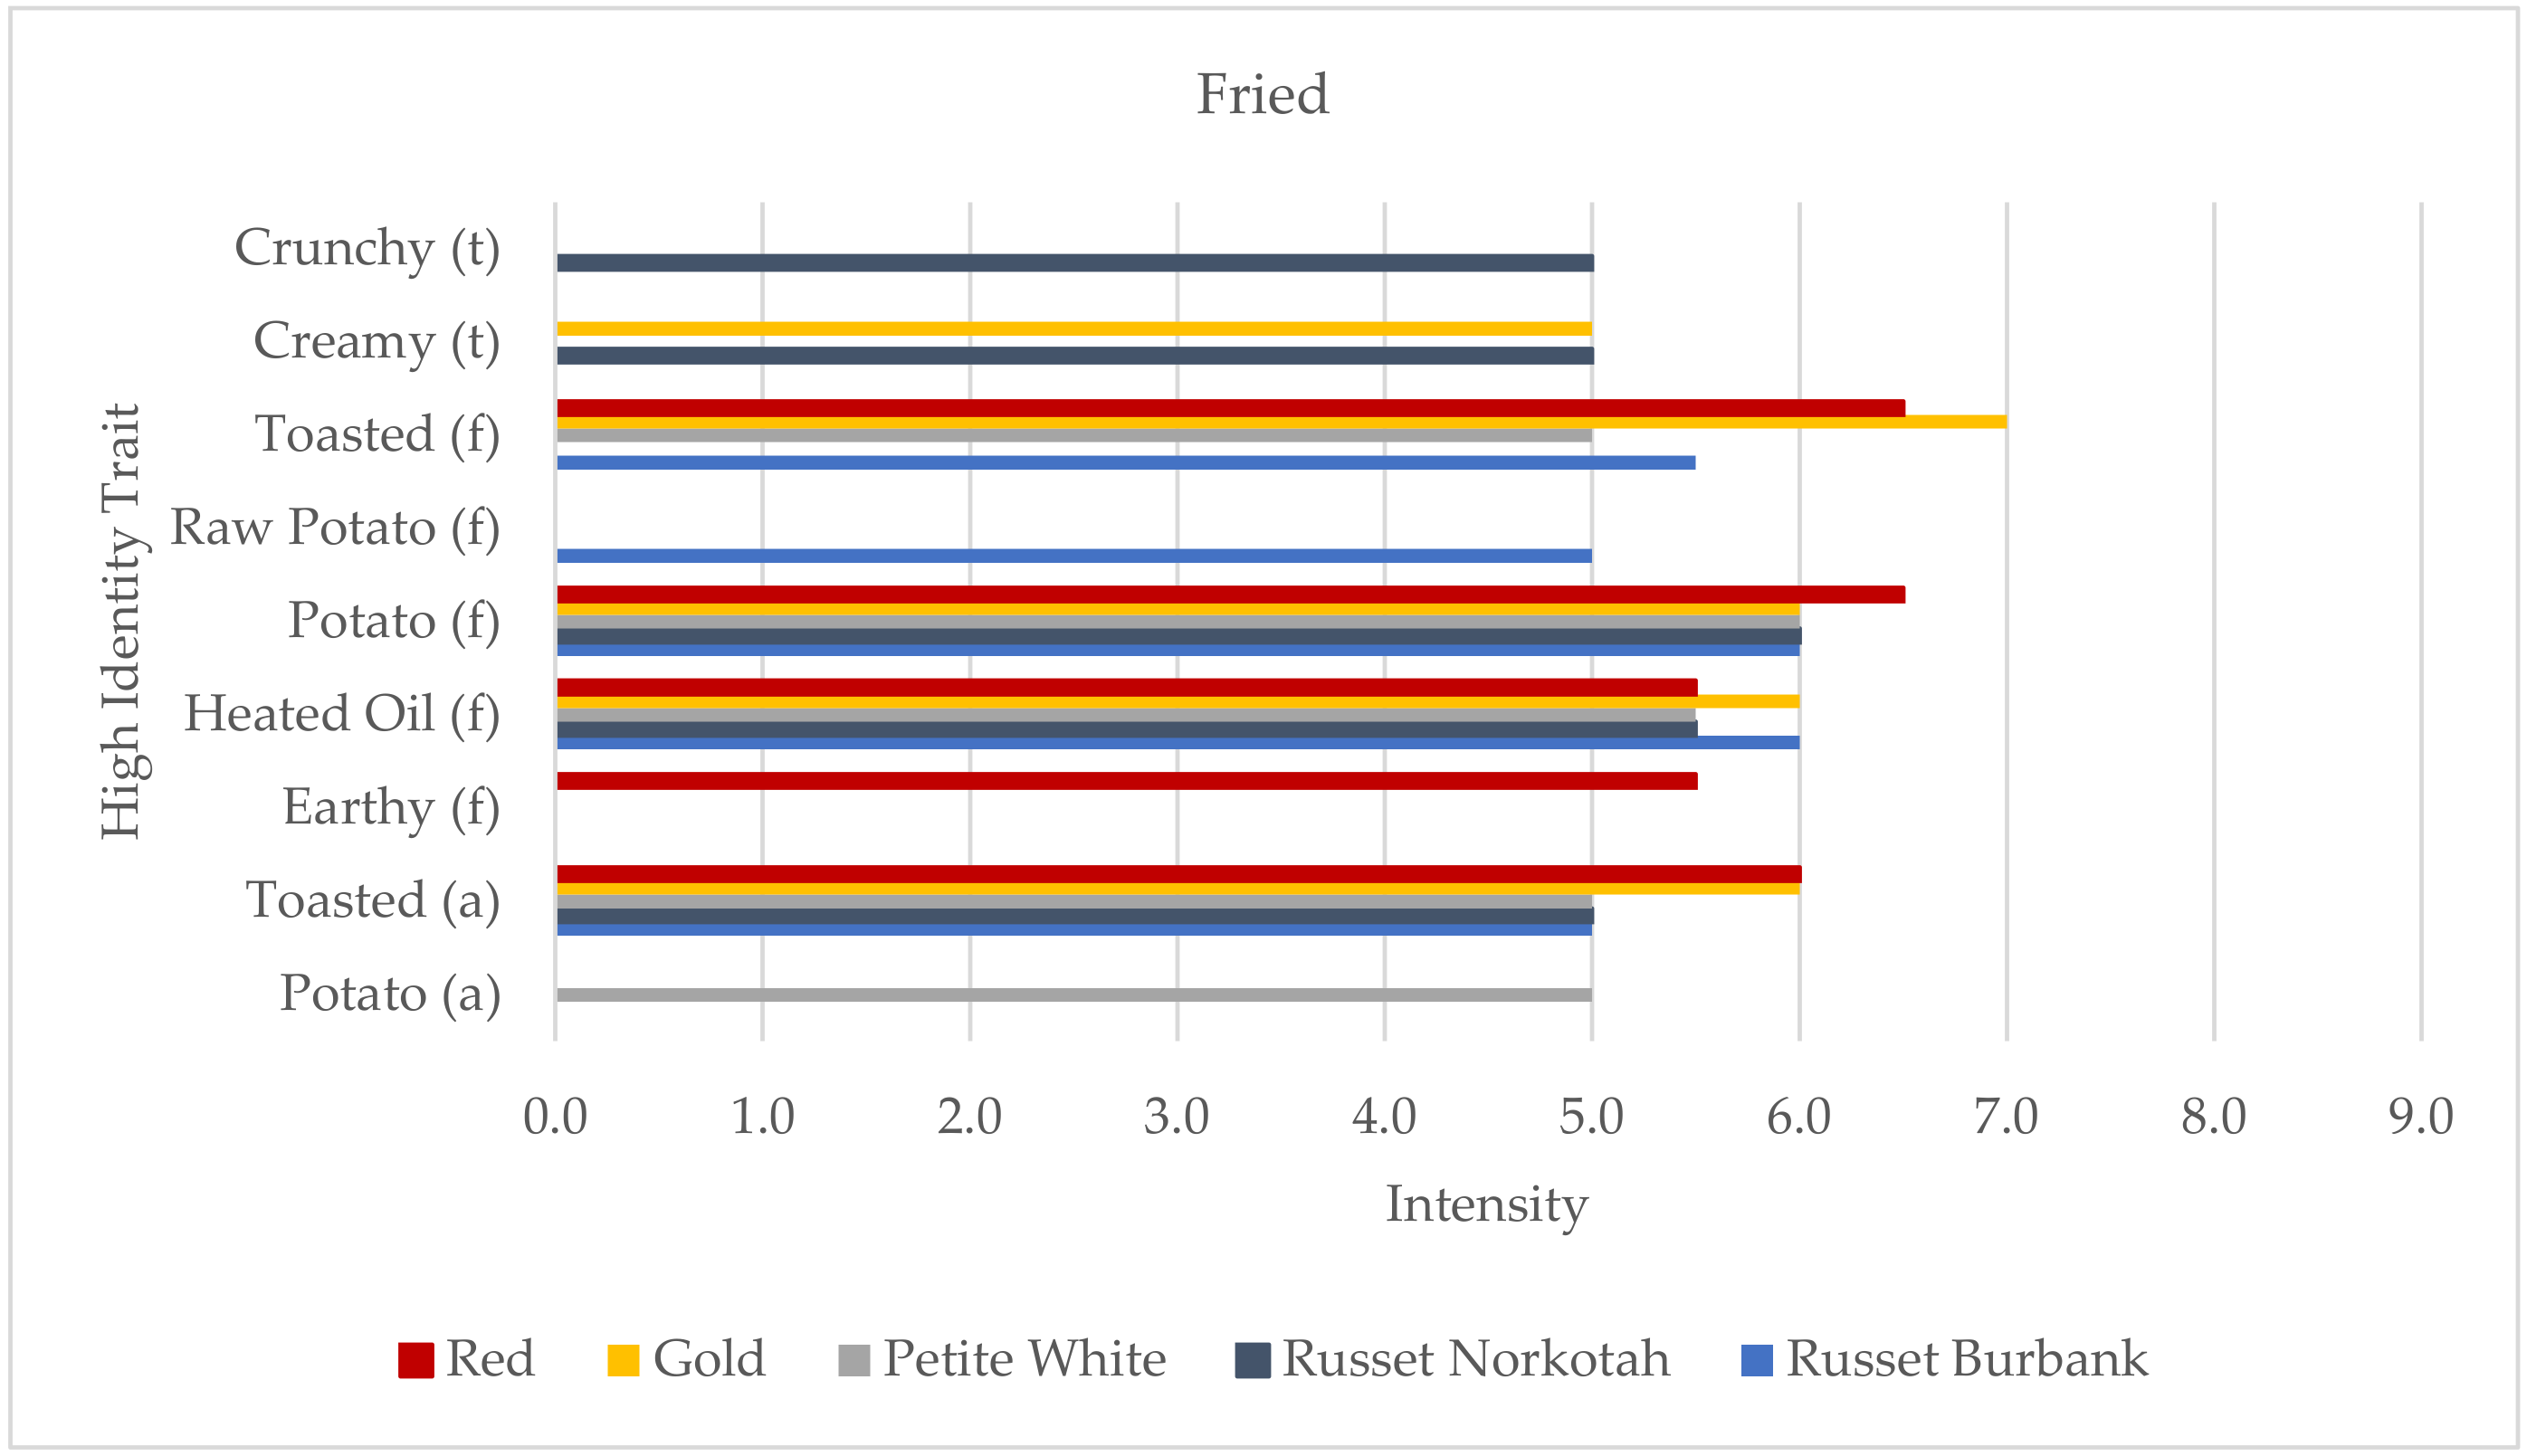
2.2.4. Fried
2.2.5. Air Fried
2.3. Sensory Evaluation
2.3.1. High Identity Traits
2.3.2. Degree of Difference
2.4. Data Analysis
3. Results
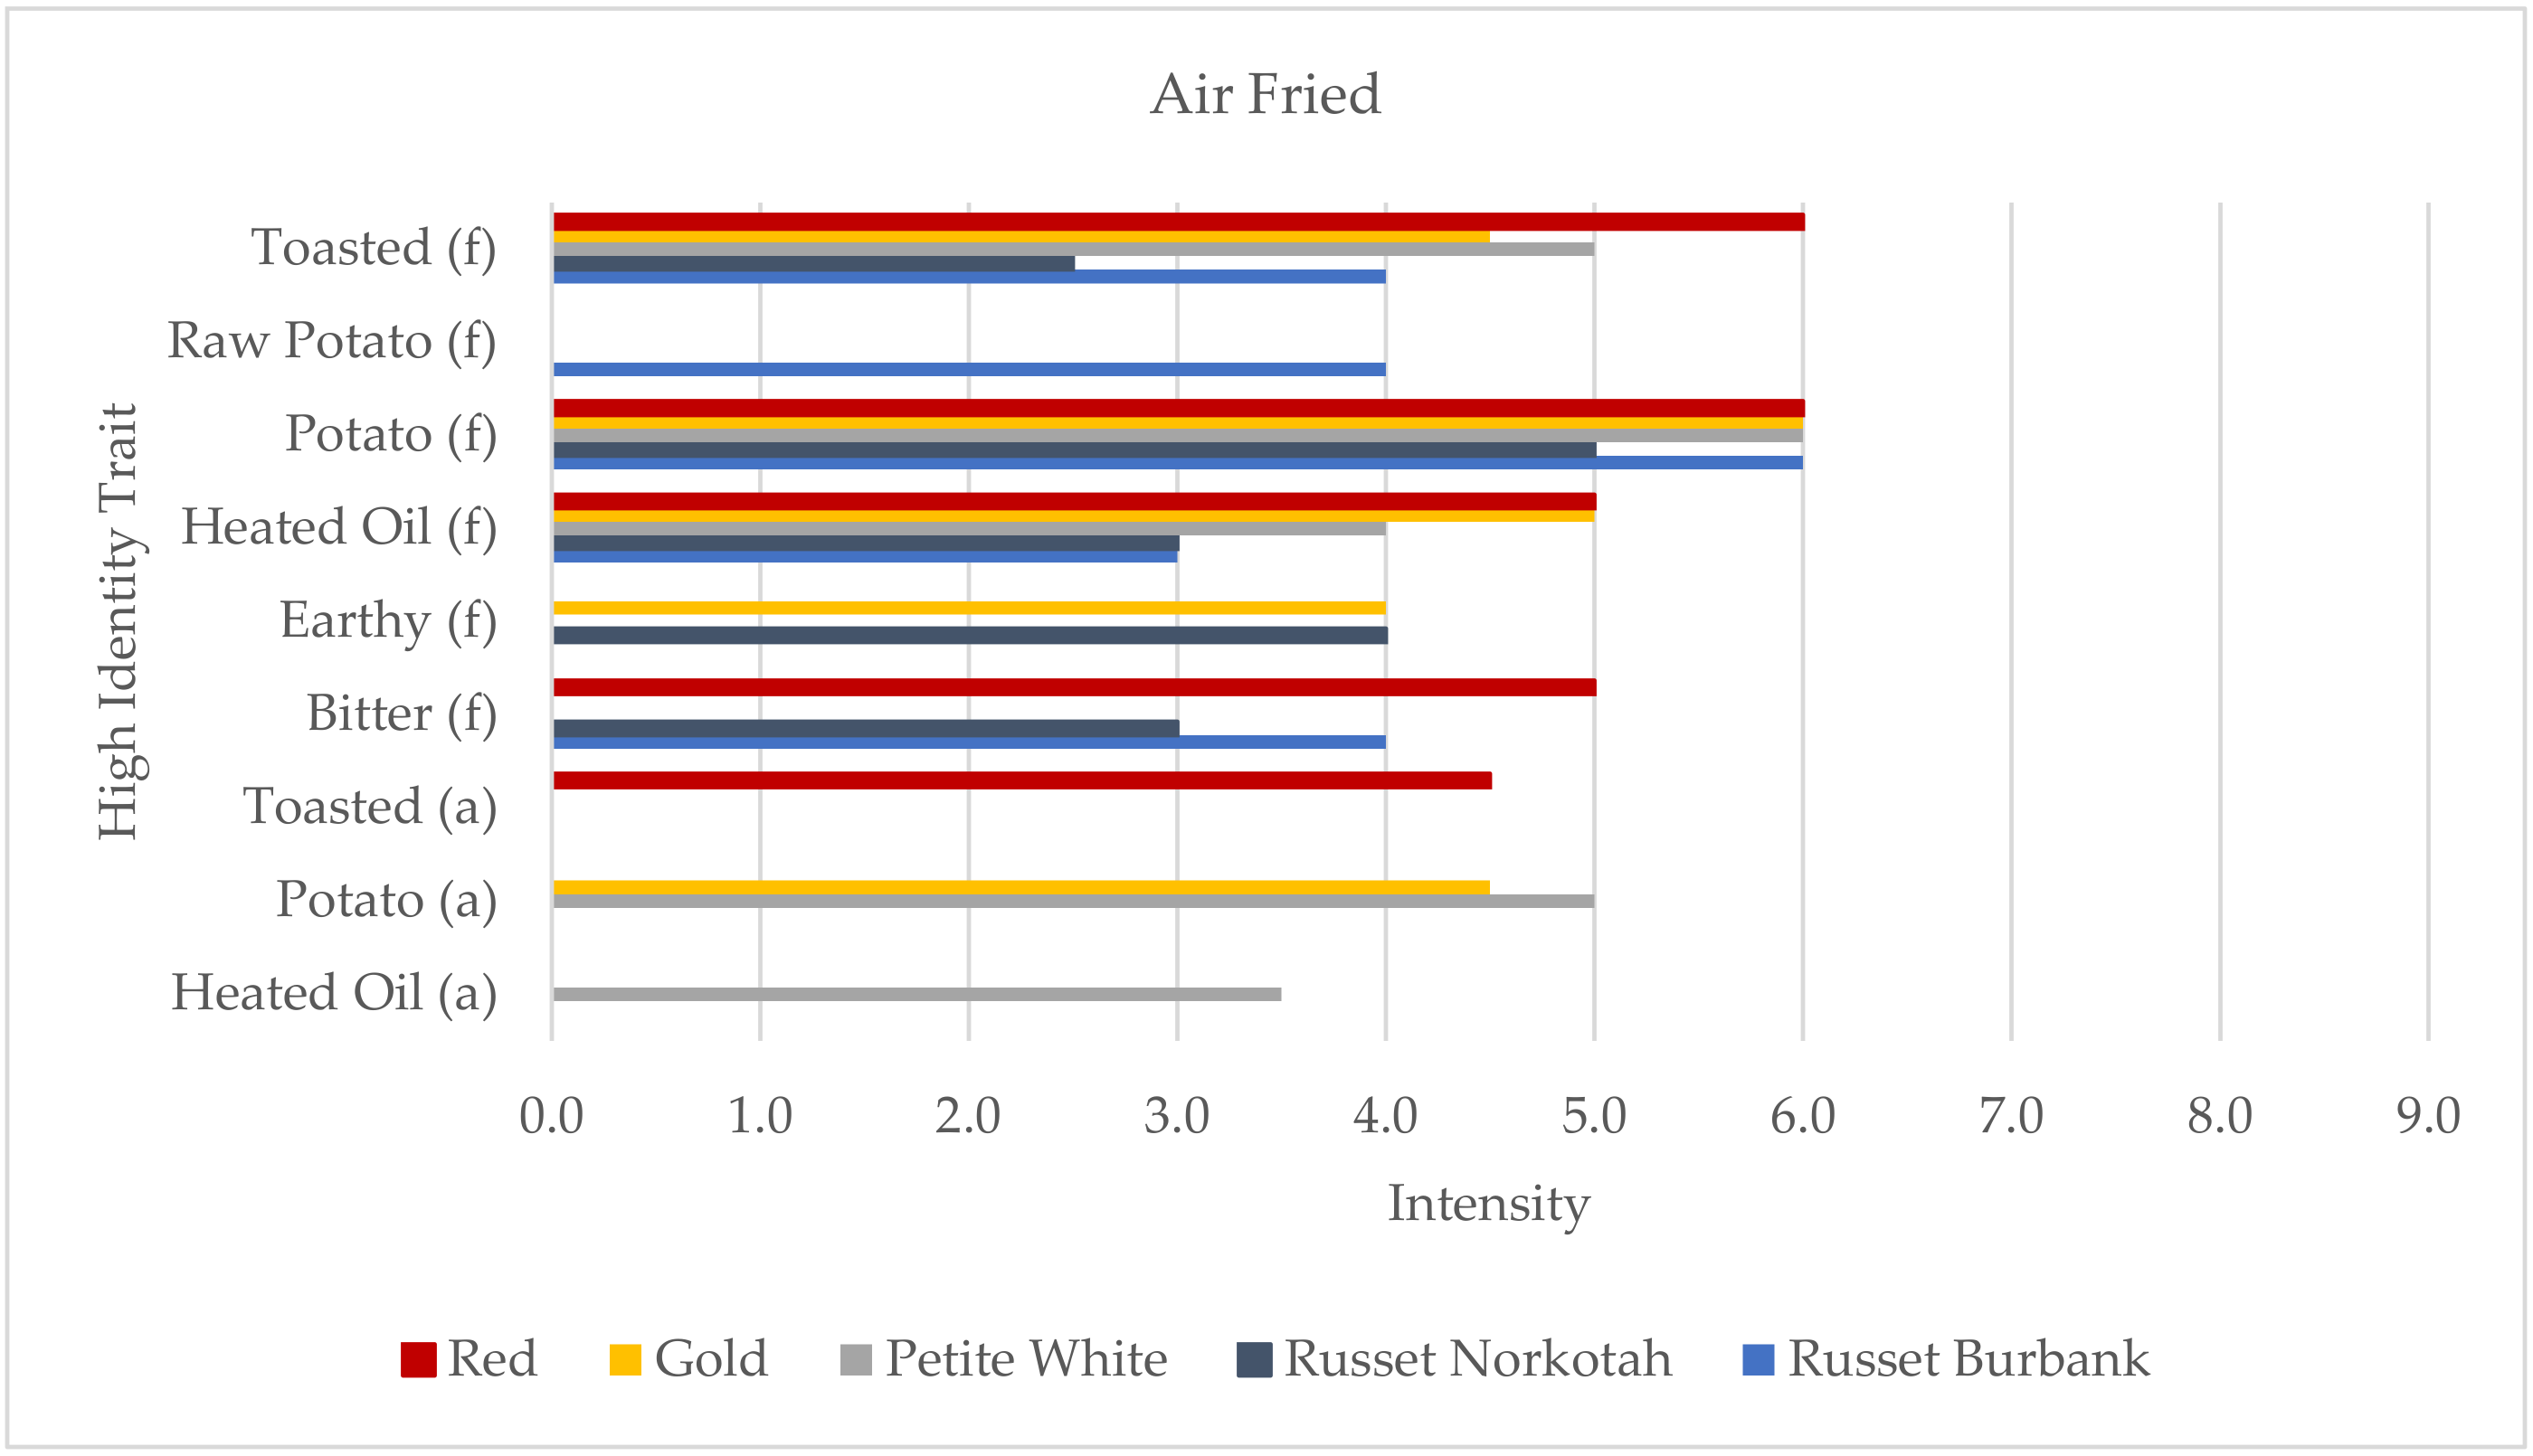
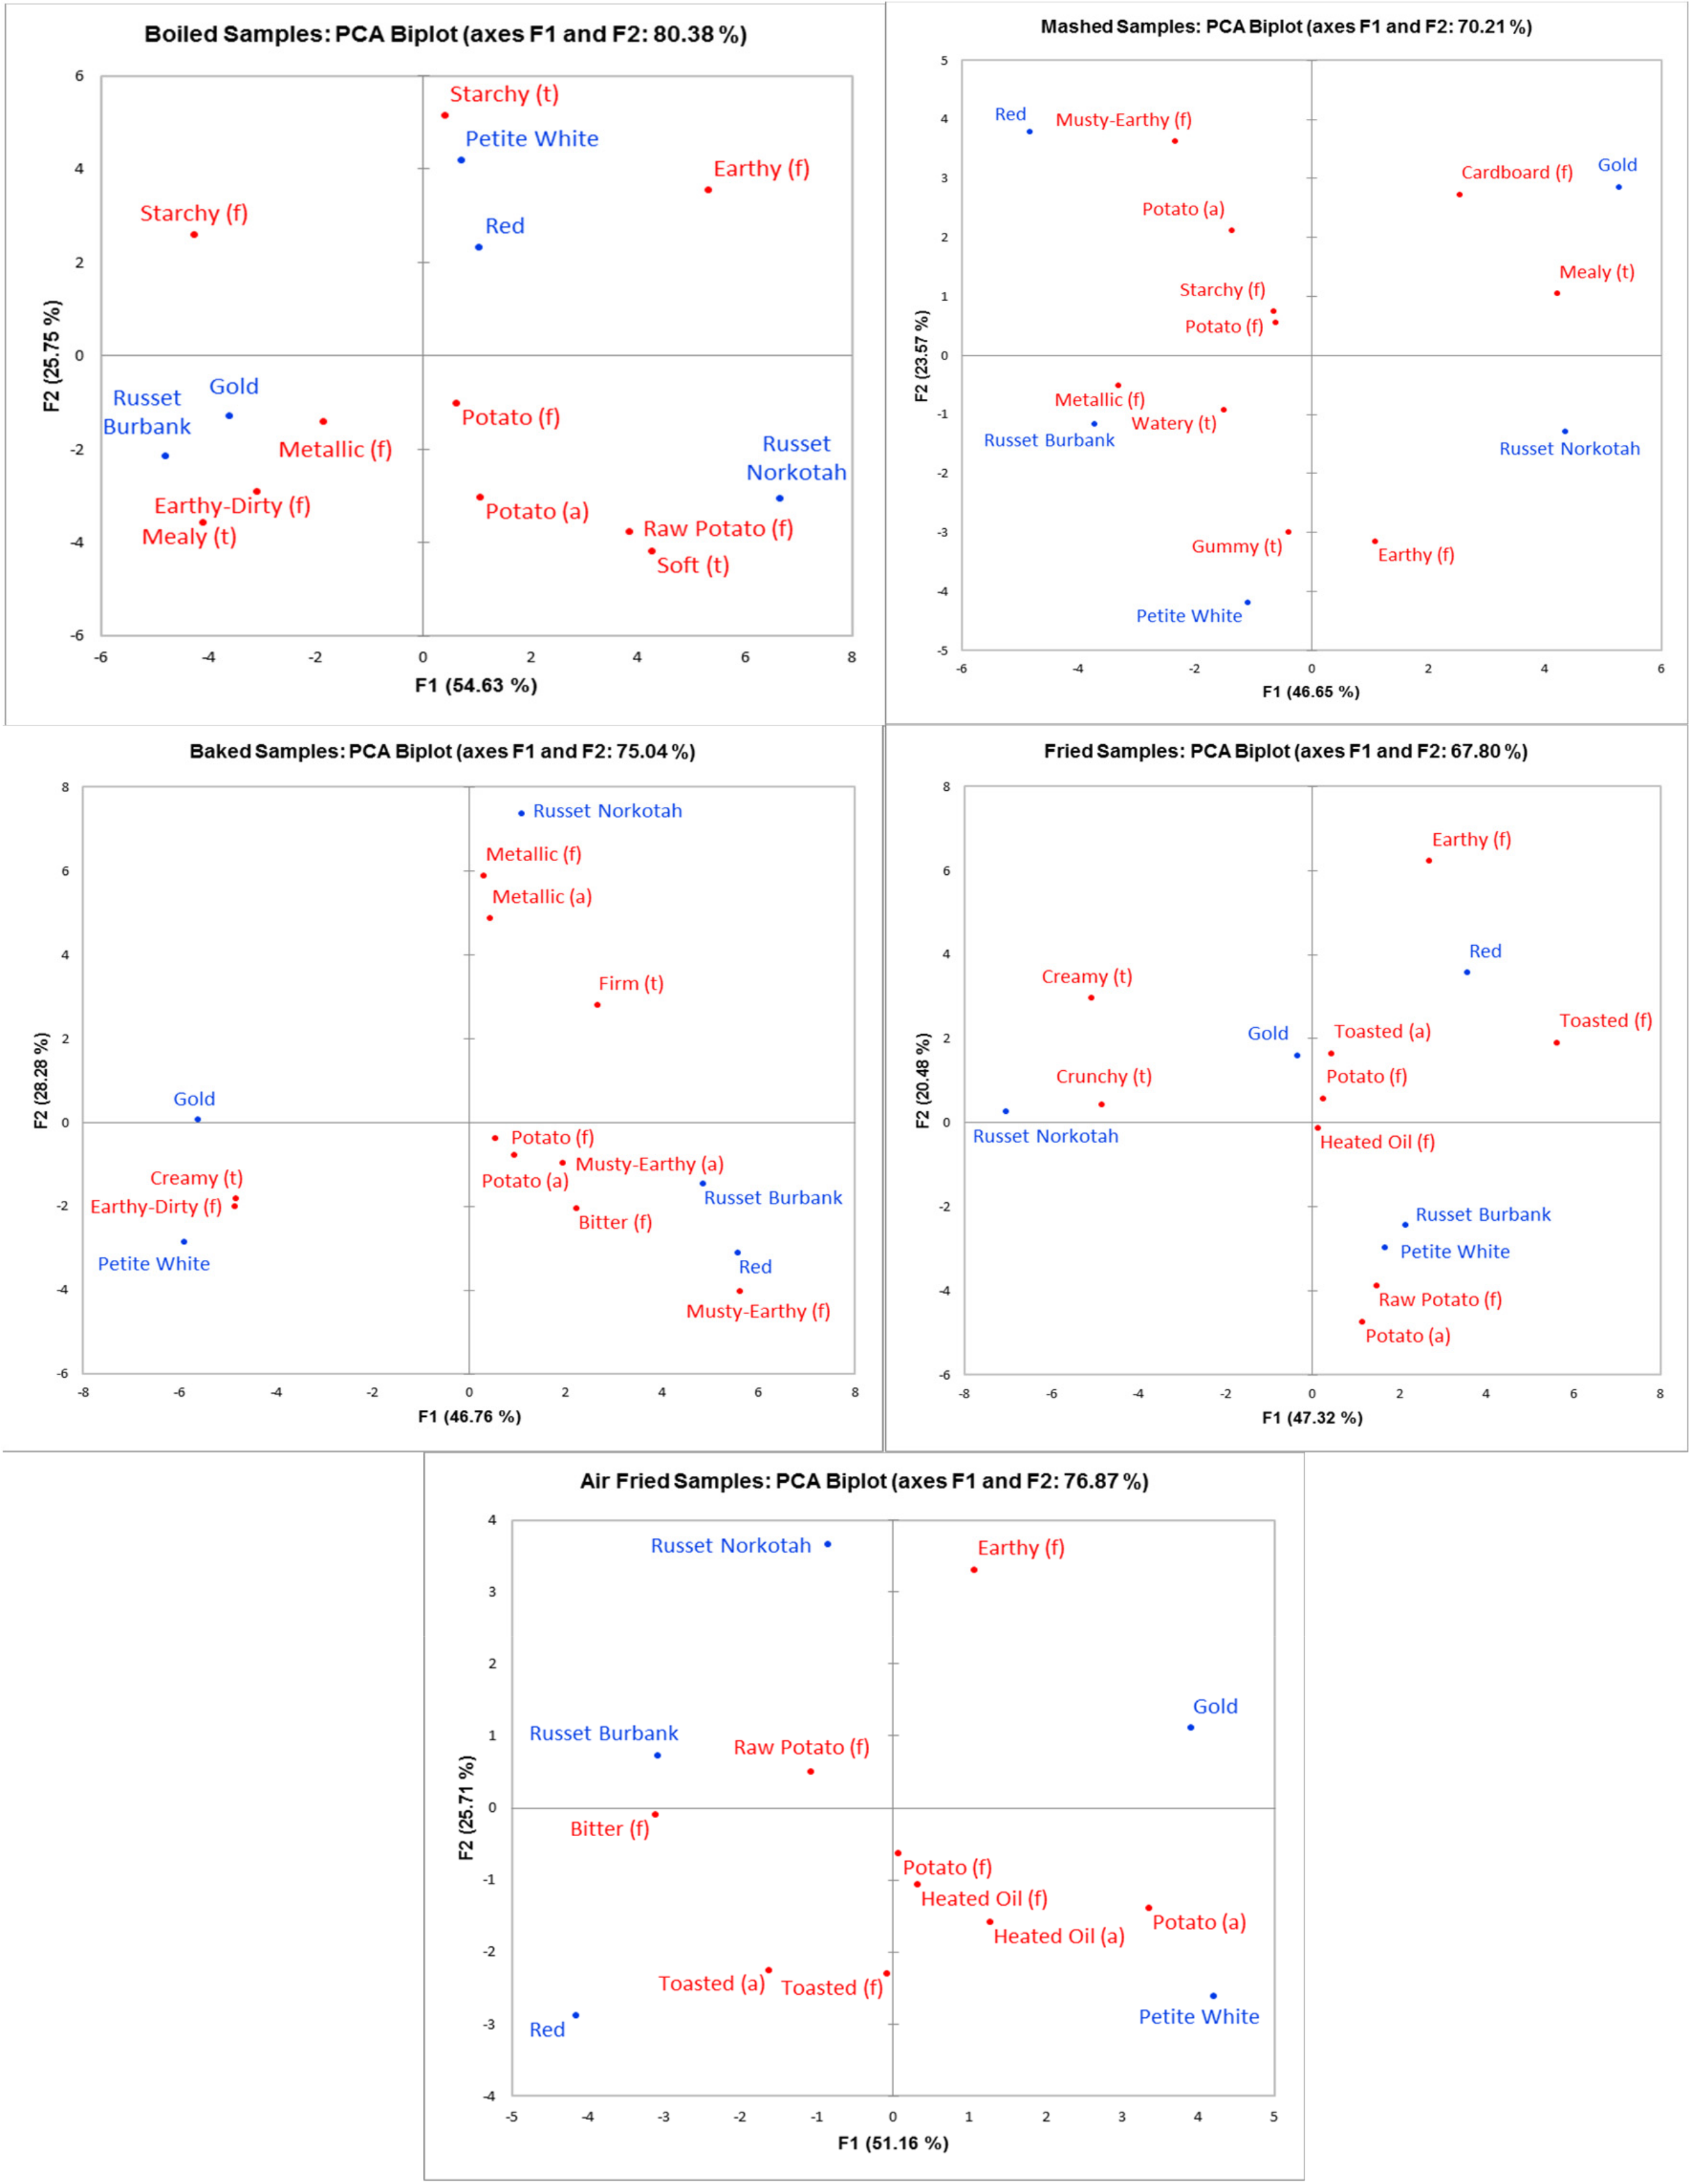
3.1. High Identity Traits
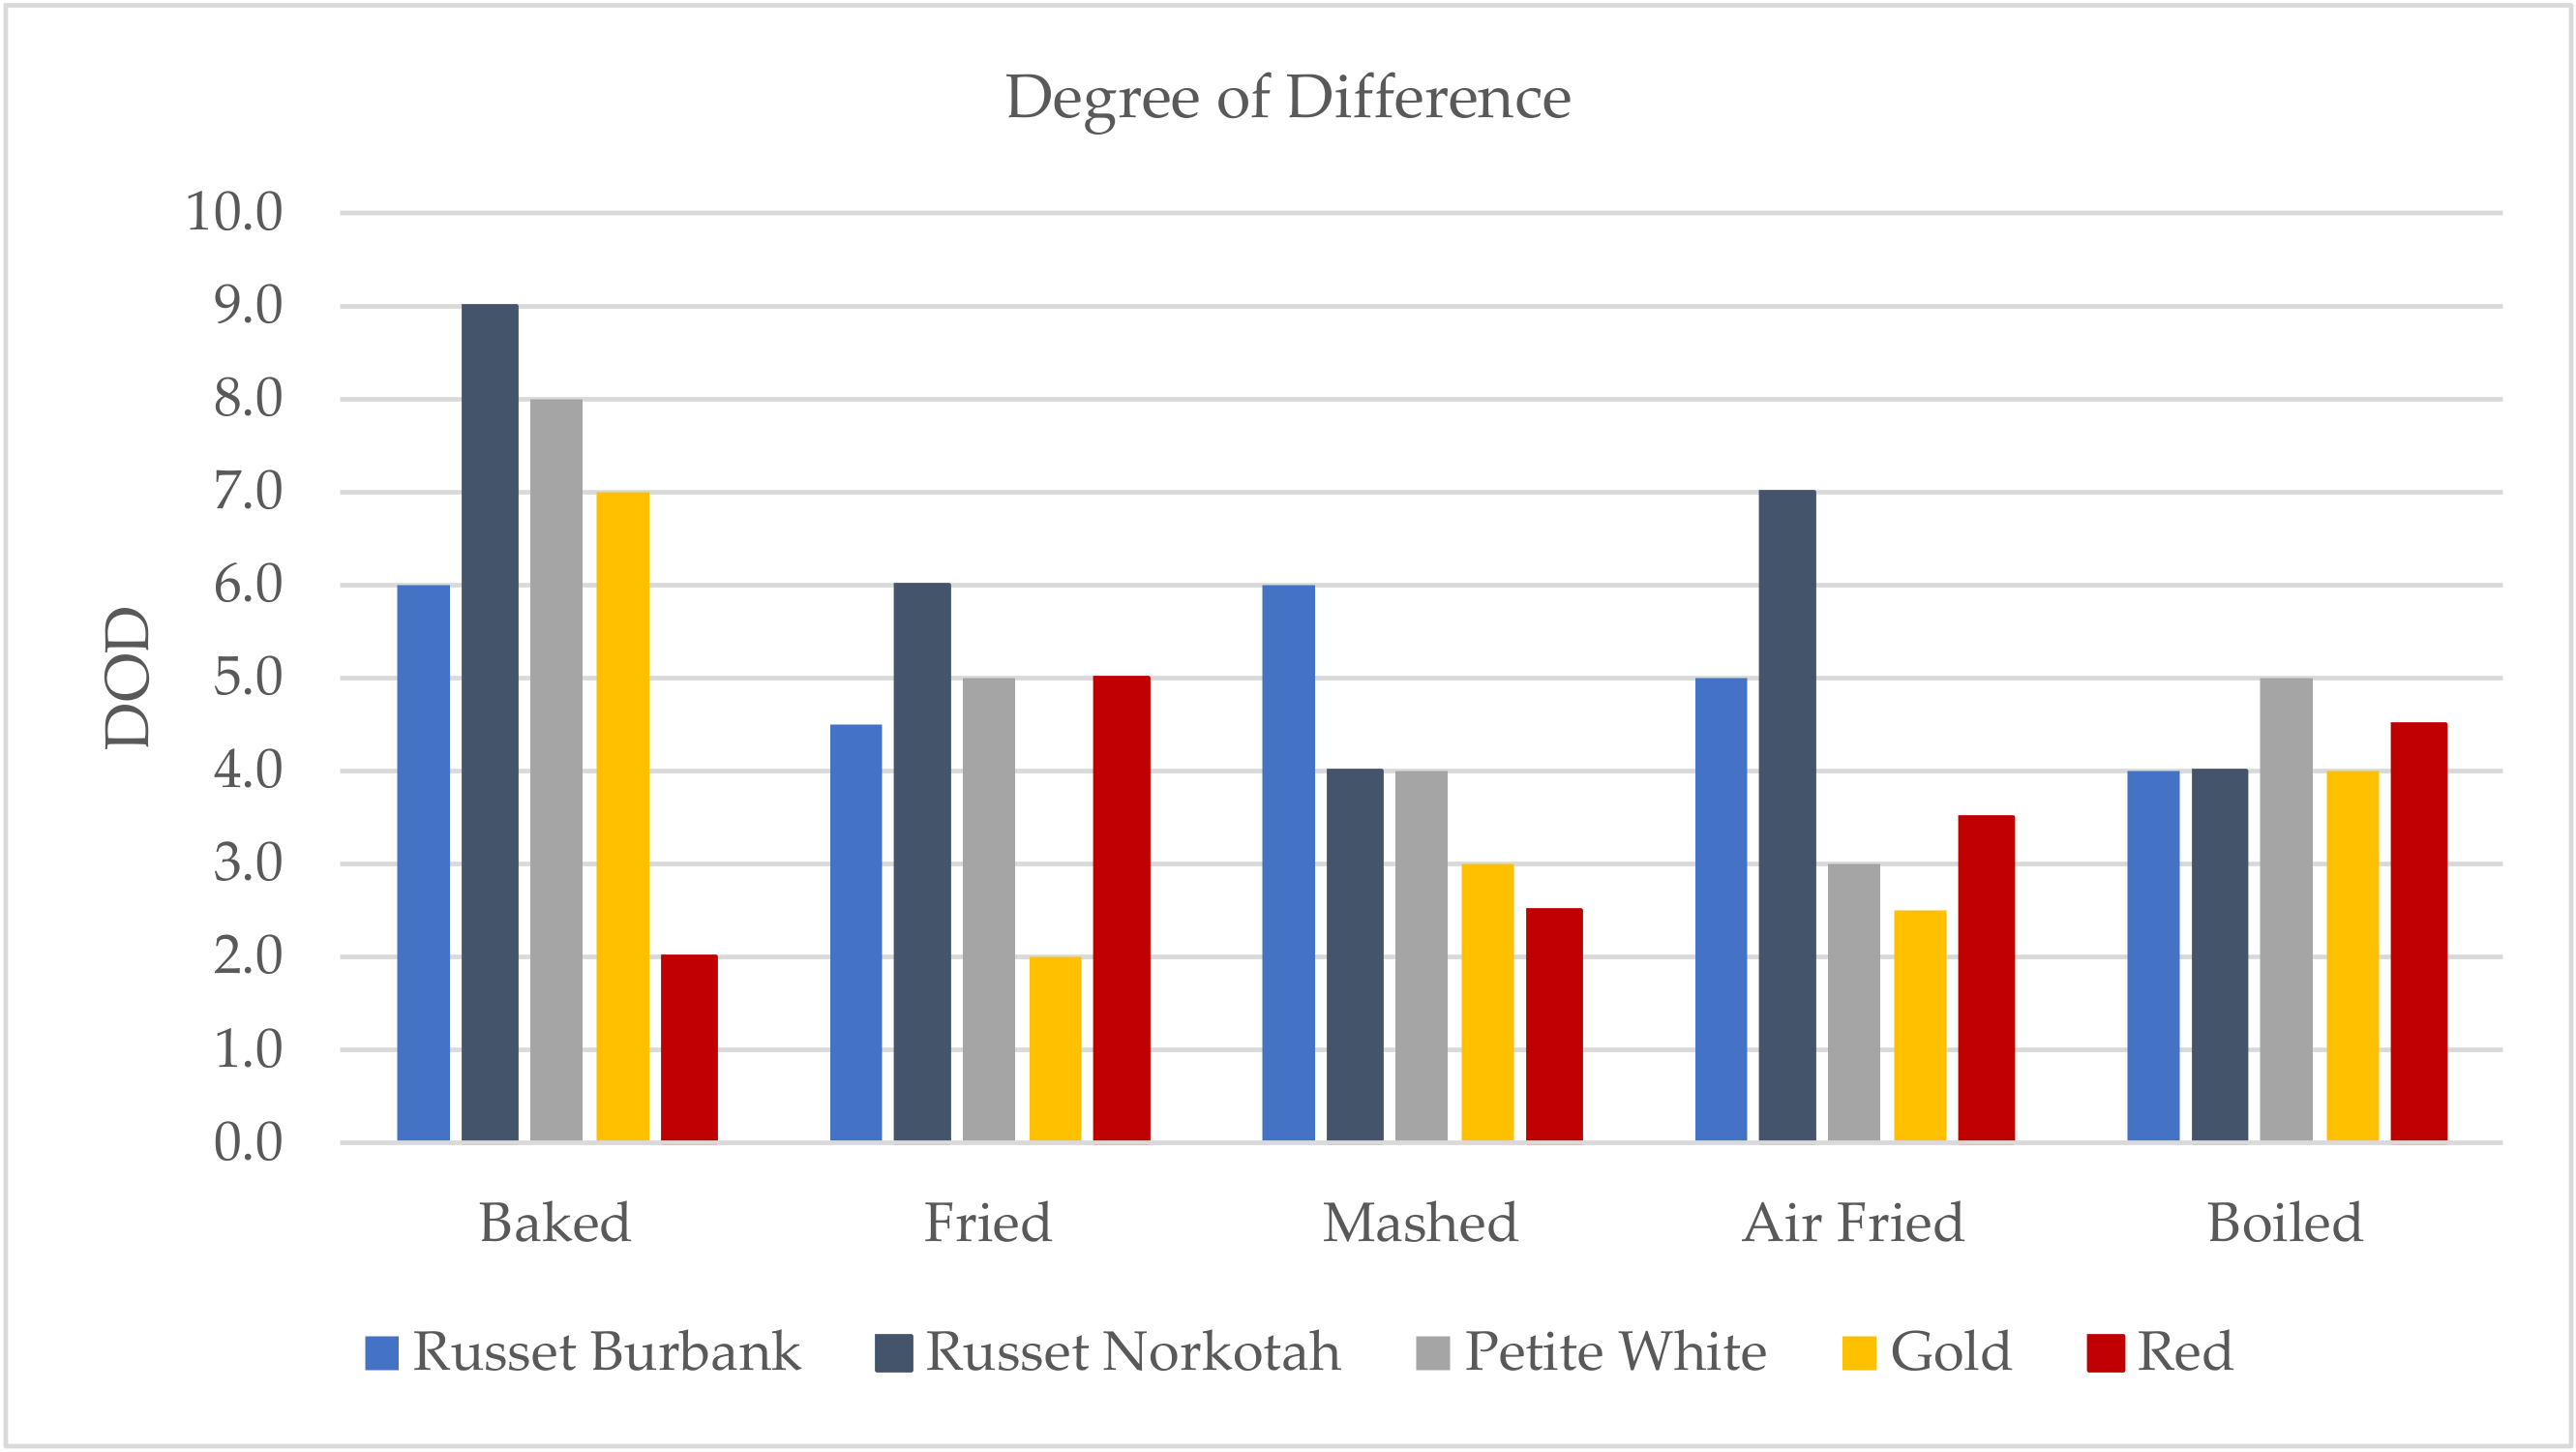
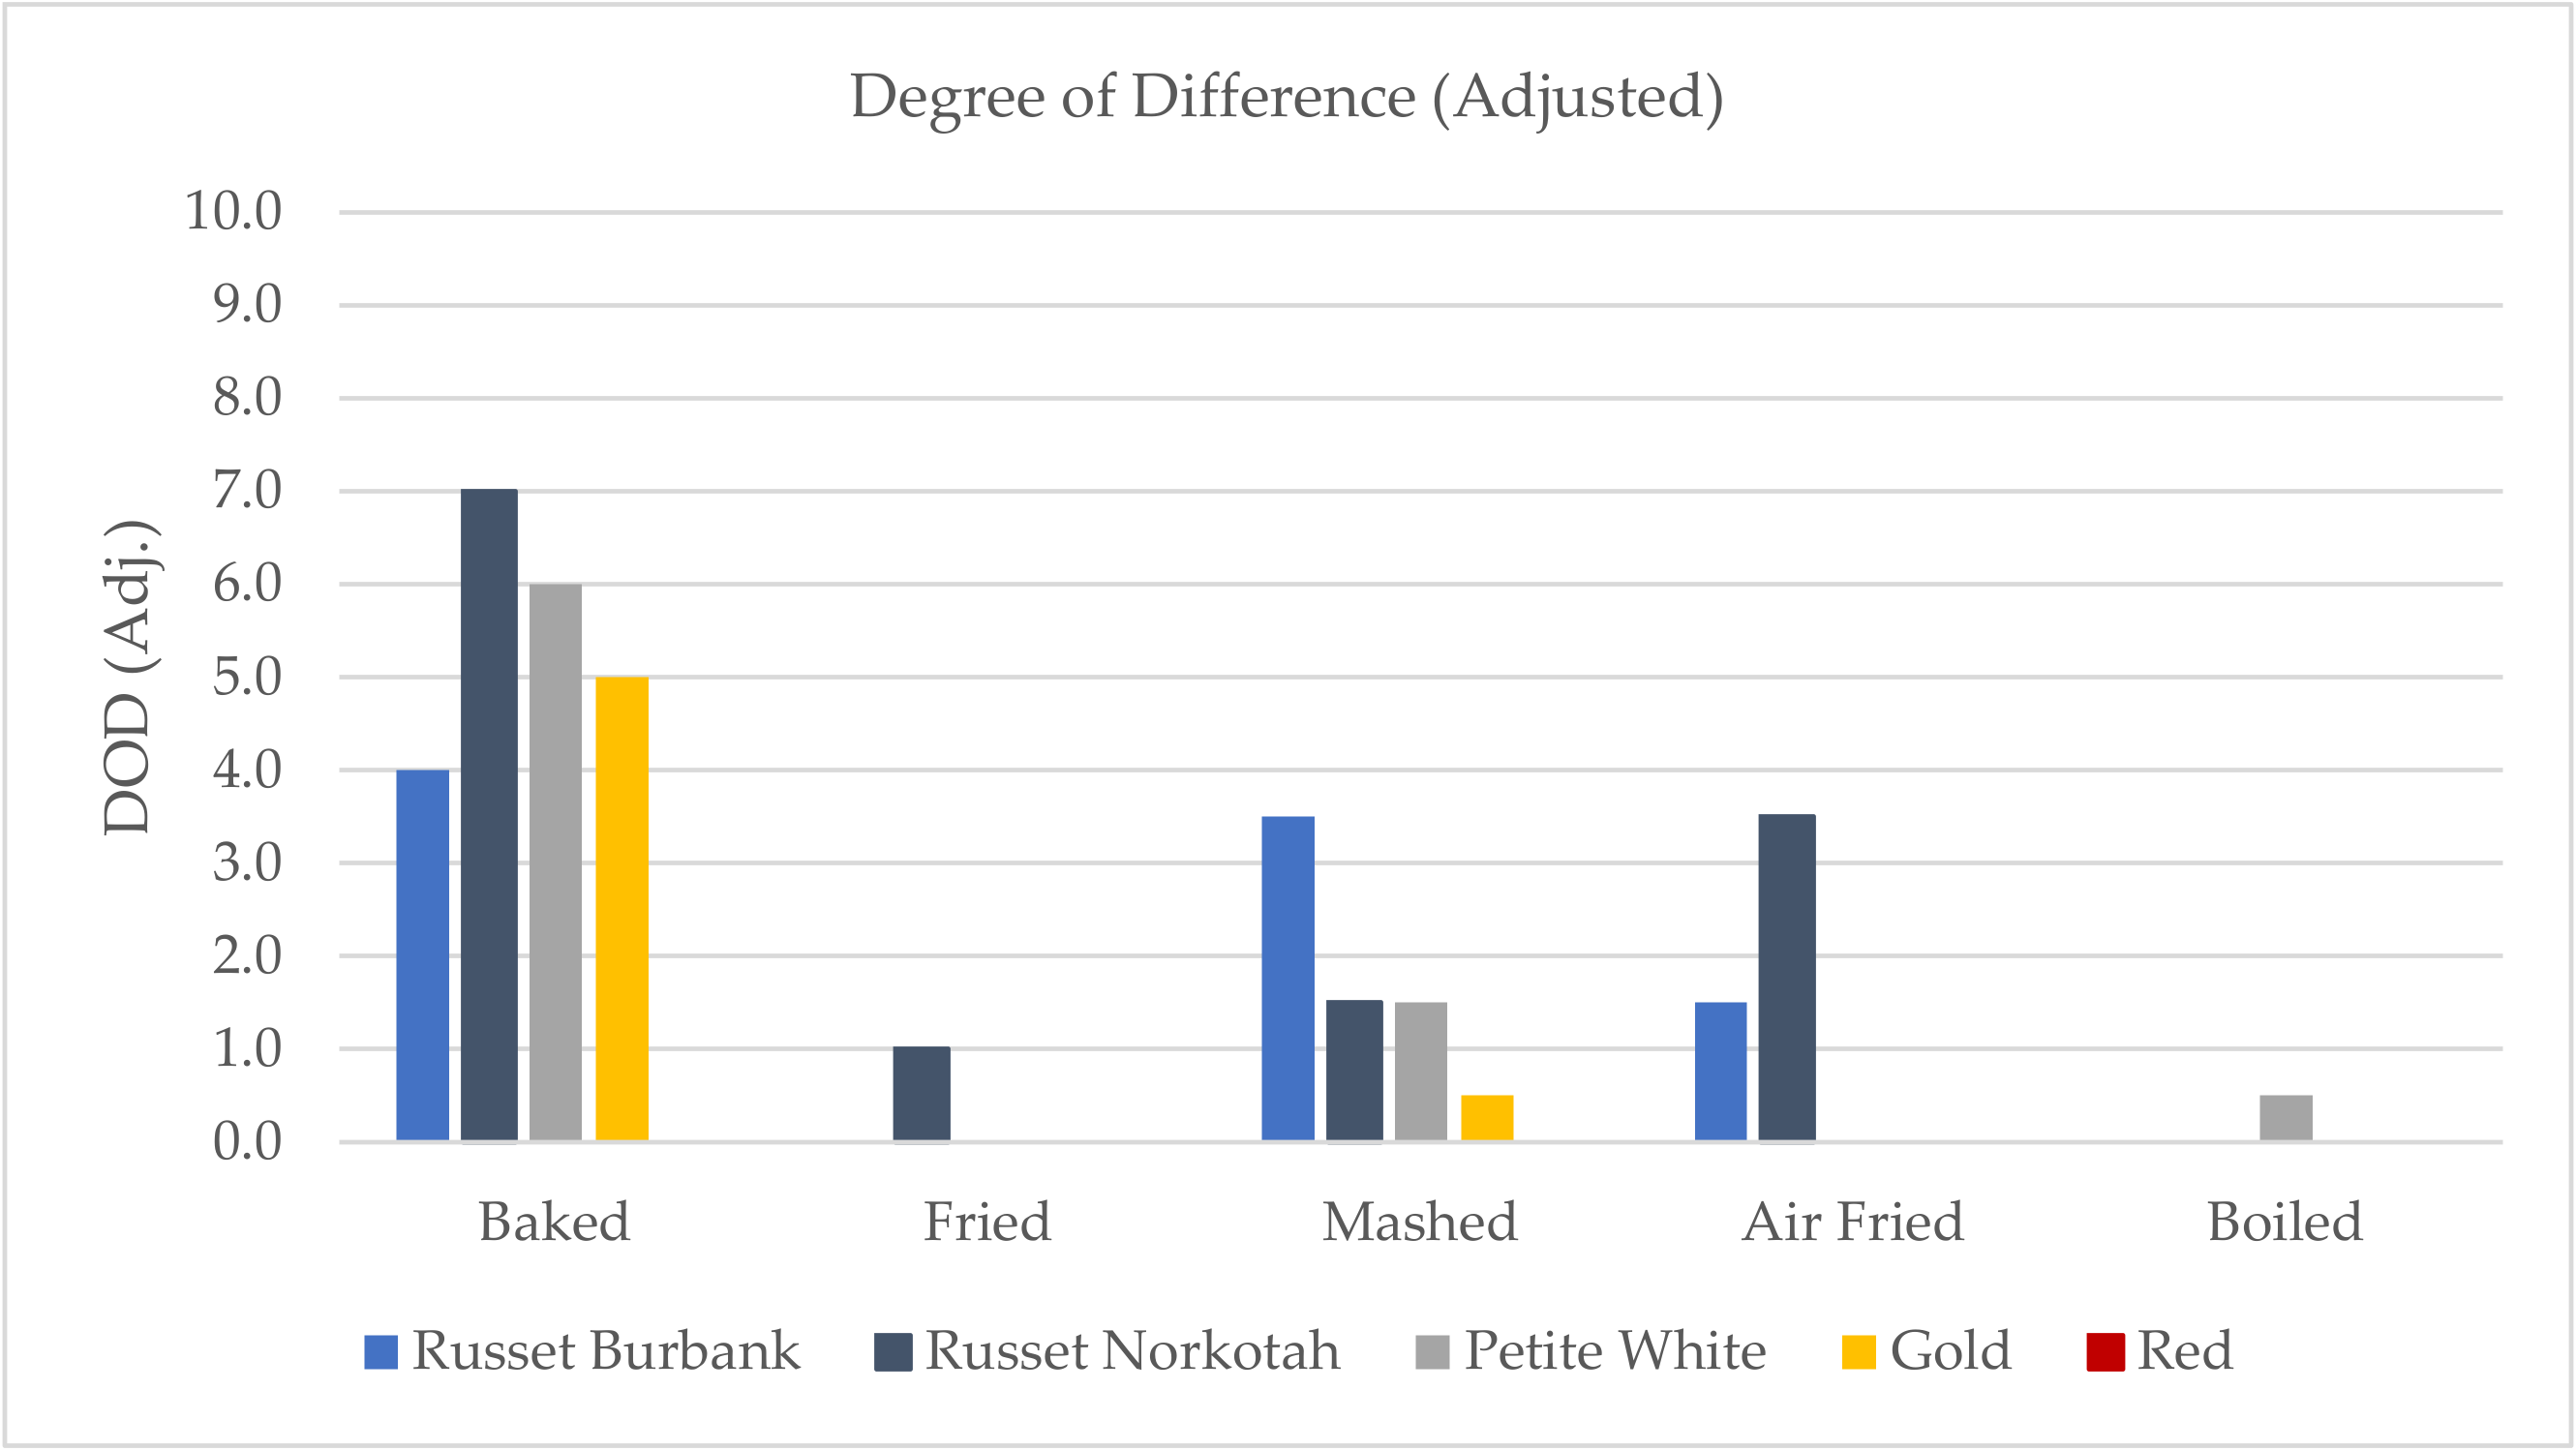
3.2. Degree of Difference
4. Discussion
5. Conclusions
Author Contributions
Funding
Conflicts of Interest
References
- Food Availability and Consumption. Available online: https://www.ers.usda.gov/data-products/ag-and-food-statistics-charting-the-essentials/food-availability-and-consumption/ (accessed on 12 March 2019).
- Potato Statistical Yearbook. Available online: https://www.nationalpotatocouncil.org/files/5015/6380/8213/2019_Stat_Book__fnl.pdf (accessed on 9 August 2019).
- Potato Types. Available online: https://www.potatogoodness.com/potato-types/ (accessed on 12 March 2019).
- Blanda, G.; Cerretani, L.; Comandini, P.; Toschi, T.G.; Lercker, G. Investigation of off-odour and off-flavour development in boiled potatoes. J. Food Chem. 2010, 118, 283–290. [Google Scholar] [CrossRef]
- Mestdagh, F.; De Wilde, T.; Delporte, K.; Van Peteghem, C.; De Meulenaer, B. Impact of chemical pre-treatments on the acrylamide formation and sensorial quality of potato crisps. J. Food Chem. 2008, 106, 914–922. [Google Scholar] [CrossRef]
- Alvarez, M.D.; Fernández, C.; Jiménez, M.J.; Canet, W. Texture of extra virgin olive oil-enriched mashed potatoes: Sensory, instrumental and structural relationships. J. Texture Stud. 2011, 42, 413–429. [Google Scholar] [CrossRef]
- Caetano, P.K.; Mariano-Nasser, F.A.D.C.; Mendonça, V.Z.D.; Furlaneto, K.A.; Daiuto, E.R.; Vieites, R.L. Physicochemical and sensory characteristics of sweet potato chips undergoing different cooking methods. J. Food Sci. Technol. 2017, 38, 434–440. [Google Scholar] [CrossRef]
- Seefeldt, H.F.; Tønning, E.; Wiking, L.; Thybo, A.K. Appropriateness of culinary preparations of potato (Solanum tuberosum L.) varieties and relation to sensory and physicochemical properties. J. Sci. Food Agric. 2011, 91, 412–420. [Google Scholar] [CrossRef]
- Jansky, S. Genotypic and environmental contributions to baked potato flavor. Am. J. Potato Res. 2008, 85, 455–465. [Google Scholar] [CrossRef]
- Rizzo, V.; Amoroso, L.; Licciardello, F.; Mazzaglia, A.; Muratore, G.; Restuccia, C.; Lombardo, S.; Pandino, G.; Strano, M.G.; Mauromicale, G. The effect of sous vide packaging with rosemary essential oil on storage quality of fresh-cut potato. LWT Food Sci. Technol. 2018, 94, 111–118. [Google Scholar] [CrossRef]
- Sharma, C.; Jayanty, S.; Chambers, E., IV; Talavera, M. Segmentation of potato consumers based on sensory and attitudinal aspects. Foods 2020, 9, 161. [Google Scholar] [CrossRef]
- Kreutzmann, S.; Bassompierre, M.; Thybo, A.K.; Buch, L.; Engelsen, S.B. Exploratory Study of Potato Cultivar Differences in Sensory and Hedonistic Applicability Tests. Potato Res. 2011, 54, 13–28. [Google Scholar] [CrossRef]
- Giovanelli, G.; Torri, L.; Sinelli, N.; Buratti, S. Comparative study of physico-chemical and sensory characteristics of French fries prepared from frozen potatoes using different cooking systems. Eur. Food Res. Technol. 2017, 243, 1619–1631. [Google Scholar] [CrossRef]
- Teruel, M.D.R.; Gordon, M.; Linares, M.B.; Garrido, M.D.; Ahromrit, A.; Niranjan, K. A comparative study of the characteristics of French fries produced by deep fat frying and air frying. J. Food Sci. 2015, 80, E349–E358. [Google Scholar] [CrossRef]
- Seefeldt, H.F.; Tønning, E.; Thybo, A.K. Exploratory sensory profiling of three culinary preparations of potatoes (Solanum tuberosum L.). J. Sci. Food Agric. 2011, 91, 104–112. [Google Scholar] [CrossRef] [PubMed]
- Di Donfrancesco, B.; Gutierrez Guzman, N.; Chambers, E., IV. Comparison of results from cupping and descriptive sensory analysis of Colombian brewed Coffee. J. Sens. Stud. 2014, 29, 301–311. [Google Scholar] [CrossRef]
- Sanchez, K.; Chambers, E., IV. How does product preparation affect sensory properties? An example with coffee. J. Sens. Stud. 2015, 30, 499–511. [Google Scholar] [CrossRef]
- Lee, J.; Chambers, D.H. Sensory descriptive evaluation: Brewing methods affect flavor of green tea. Asian J. Food Agro Ind. 2009, 2, 427–439. [Google Scholar]
- Tian, J.; Chen, J.; Chen, J.; Chen, S.; Lv, F.; Liu, D.; Ye, X. Domestic cooking methods affect the phytochemical composition and antioxidant activity of purple-fleshed potatoes. J. Food Chem. 2016, 197, 1264–1270. [Google Scholar] [CrossRef] [PubMed]
- Do Trong, N.N.; Tsuta, M.; Nicolaï, B.M.; De Baersemaeker, J.; Saeys, W. Prediction of optimal cooking time for boiled potatoes by hyperspectral imaging. J. Food Eng. 2011, 105, 617–624. [Google Scholar] [CrossRef]
- Oruna-Concha, M.J.; Bakker, J.; Ames, J.M. Comparison of the volatile components of two cultivars of potato cooked by boiling, conventional baking and microwave baking. J. Sci. Food Agric. 2002, 82, 1080–1087. [Google Scholar] [CrossRef]
- Chambers, E., IV; Sanchez, K.; Phan, U.X.T.; Miller, R.; Civille, G.V.; Di Donfrancesco, B. Development of a “living” lexicon for descriptive sensory analysis of brewed coffee. J. Sens. Stud. 2016, 31, 465–480. [Google Scholar] [CrossRef]
- Tran, T.; James, M.; Chambers, D.; Koppel, K.; Chambers, E., IV. Lexicon development for the sensory description of rye bread. J. Sens. Stud. 2019, 34, e12474. [Google Scholar] [CrossRef]
- Kumar, R.; Chambers, E., IV. Lexicon for multi-parameter texture assessment of snack and snack-like foods in English, Spanish, Chinese, and Hindi. J. Sens. Stud. 2019, 34, e12500. [Google Scholar] [CrossRef]
- Jaffe, T.R.; Wang, H.; Chambers, E., IV. Determination of a lexicon for the sensory flavor attributes of smoked food products. J. Sens. Stud. 2017, 32, e12262. [Google Scholar] [CrossRef]
- Pujchakarn, T.; Suwonsichon, S.; Suwonsichon, T. Development of a sensory lexicon for a specific subcategory of soy sauce: Seasoning soy sauce. J. Sens. Stud. 2016, 31, 443–452. [Google Scholar] [CrossRef]
- Rosales, C.K.; Suwonsichon, S. Sensory Lexicon of Pomelo. J. Sens. Stud. 2015, 30, 21–32. [Google Scholar] [CrossRef]
- Chambers, E., IV; Lee, J.; Chun, S.; Miller, A. Development of a lexicon for commercially available cabbage (baechu) kimchi. J. Sens. Stud. 2012, 27, 511–518. [Google Scholar] [CrossRef]
- Di Donfranchesco, B.; Koppel, K.; Chambers, E., IV. An initial lexicon for sensory properties of dry dog food. J. Sens. Stud. 2012, 27, 498–510. [Google Scholar] [CrossRef]
- Chambers, E., IV; Robel, A. Sensory characteristics of selected species of freshwater fish in retail distribution. J. Food Sci. 1993, 58, 508–512. [Google Scholar]
- Chang, C.Y.; Chambers, E., IV. Flavor characterization of breads made from hard red winter wheat and hard white winter wheat. Cereal Chem. 1992, 69, 556–559. [Google Scholar]
- Wang, H.; Chambers, E., IV; Kan, J. Sensory characteristics of combinations of phenolic compounds potentially associated with smoked aroma in foods. Molecules 2018, 23, 1867. [Google Scholar] [CrossRef]
- Bott, L.; Chambers, E., IV. Sensory characteristics of combinations of chemicals potentially associated with beany aroma in foods. J. Sens. Stud. 2006, 21, 308–321. [Google Scholar] [CrossRef]
- Talavera-Bianchi, M.; Chambers, E., IV; Chambers, D.H. Describing flavor using fewer and simpler “HITS” (high identity traits) profiling: An example with cheese. J. Sens. Stud. 2010, 25, 481–493. [Google Scholar] [CrossRef]
- Muñoz, A.M.; Civille, G.V.; Carr, B.T. Sensory Evaluation in Quality Control; Springer: Boston, MA, USA, 1992. [Google Scholar]
- Yenket, R.; Chambers, E., IV. Influence of cluster analysis procedures on variation explained and consumer orientation in internal and external preference maps. J. Sens. Stud. 2017, 32, e12296. [Google Scholar]
- Chanadang, S.; Chambers, E., IV. Determination of the sensory characteristics of traditional and novel fortified blended foods used in supplementary feeding programs. Foods 2019, 8, 261. [Google Scholar] [CrossRef] [PubMed]
- Lotong, V.; Chambers, E., IV; Chambers, D.H. Categorization of commercial orange juices based on flavor characteristics. J. Food Sci. 2003, 68, 722–725. [Google Scholar] [CrossRef]
- Muñoz, A.M.; Chambers, E., IV; Hummer, S. A Multifaceted Category Research Study: How to understand a product category and its consumer responses. J. Sens. Stud. 1996, 1, 261–291. [Google Scholar] [CrossRef]


| Boiled | Baked | Fried | Mashed | Air Fried | |
|---|---|---|---|---|---|
| Red | 19 min | 50 min | 5 1/2 min | 19 min | 32 min |
| Russet Burbank | 13 min | 45 min | 6 min | 13 min | 30 min |
| Russet Norkotah | 15 min | 45 min | 6 1/2 min | 15 min | 30 min |
| Gold | 21 min | 50 min | 6 min | 21 min | 32 min |
| Petite White | 23 min | 35 min | 5 1/2 min | 23 min | 32 min |
| High Identity Trait | Definition | |
|---|---|---|
| Aroma | Heated Oil | The aromatics associated with oil that has been heated. |
| Metallic | An aromatic associated with tin cans or aluminum foil. | |
| Musty-Earthy | The musty aromatics associated with raw potatoes, decaying vegetation, and damp soil. | |
| Potato | The starchy and slightly metallic cooked vegetable characteristic associated with the meat of the potato. | |
| Toasted | A moderately brown, baked impression. | |
| Flavor | Bitter | A fundamental taste sensation that is characterized as being acrid, sharp, or pungent. May include a lingering flat taste over the back of the tongue. |
| Cardboard | The aromatic associated with cardboard or paper packaging. | |
| Earthy | An aromatic that has a damp, earthy character similar to fresh mushrooms or raw potato. | |
| Earthy-Dirty | Dry, dirt-like aromatic associated with dry soil. | |
| Heated Oil | The aromatics associated with oil that has been heated. | |
| Metallic | An aromatic and mouth feel associated with tin cans or aluminum foil. | |
| Musty-Earthy | The musty aromatics associated with raw potatoes, decaying vegetation, and damp soil. | |
| Potato | The starchy and slightly metallic cooked vegetable characteristic associated with the meat of the potato. | |
| Raw Potato | The starchy, raw vegetable-like character associated with peeled, sliced, uncooked potatoes. May include slight green or unripened notes. | |
| Starchy | The aromatics associated with starch and starch-based vegetables such as corn, potatoes, and legumes. | |
| Toasted | A moderately brown, baked impression. | |
| Texture | Creamy | The rich, smooth, full feeling in the mouth which may be thick and slick. |
| Crunchy | The force and noise with which the sample breaks, cracks, or ruptures. | |
| Firm | Requiring a moderate amount of force to bite completely through the sample. | |
| Gummy | A sticky, gluey impression perceived in product during mastication. | |
| Mealy | The perception of fine, soft, somewhat rounded smooth particles very evenly distributed within the product itself. | |
| Soft | The lack of resistance to the teeth when biting down on the product. | |
| Starchy | Degree to which the sample mixes with saliva to form a starchy, pasty slurry that coats mouth surfaces after swallowing. | |
| Watery | The perceived amount of moisture in the product when placed in the mouth. |
© 2020 by the authors. Licensee MDPI, Basel, Switzerland. This article is an open access article distributed under the terms and conditions of the Creative Commons Attribution (CC BY) license (http://creativecommons.org/licenses/by/4.0/).
Share and Cite
Ciccone, M.; Chambers, D.; Chambers IV, E.; Talavera, M. Determining Which Cooking Method Provides the Best Sensory Differentiation of Potatoes. Foods 2020, 9, 451. https://doi.org/10.3390/foods9040451
Ciccone M, Chambers D, Chambers IV E, Talavera M. Determining Which Cooking Method Provides the Best Sensory Differentiation of Potatoes. Foods. 2020; 9(4):451. https://doi.org/10.3390/foods9040451
Chicago/Turabian StyleCiccone, Melissa, Delores Chambers, Edgar Chambers IV, and Martin Talavera. 2020. "Determining Which Cooking Method Provides the Best Sensory Differentiation of Potatoes" Foods 9, no. 4: 451. https://doi.org/10.3390/foods9040451
APA StyleCiccone, M., Chambers, D., Chambers IV, E., & Talavera, M. (2020). Determining Which Cooking Method Provides the Best Sensory Differentiation of Potatoes. Foods, 9(4), 451. https://doi.org/10.3390/foods9040451