Aroma, Quality, and Consumer Mindsets for Shelf-Stable Rice Thermally Processed by Reciprocal Agitation


Abstract
1. Introduction
2. Materials and Methods
2.1. Source of Material
2.2. Retort Preparation and Setting
2.3. Rice Starch and Proximate Analysis
2.4. Rice 2-AP Aroma Analysis
2.5. Rice Color
2.6. Package Oxygen and Carbon Dioxide Levels
2.7. Consumer Survey
2.8. Statistical Analysis of Rice Physico-Chemical Properties
3. Results
3.1. Rice Heat Penetration and Ball Factors
3.2. Rice Starch Characterization
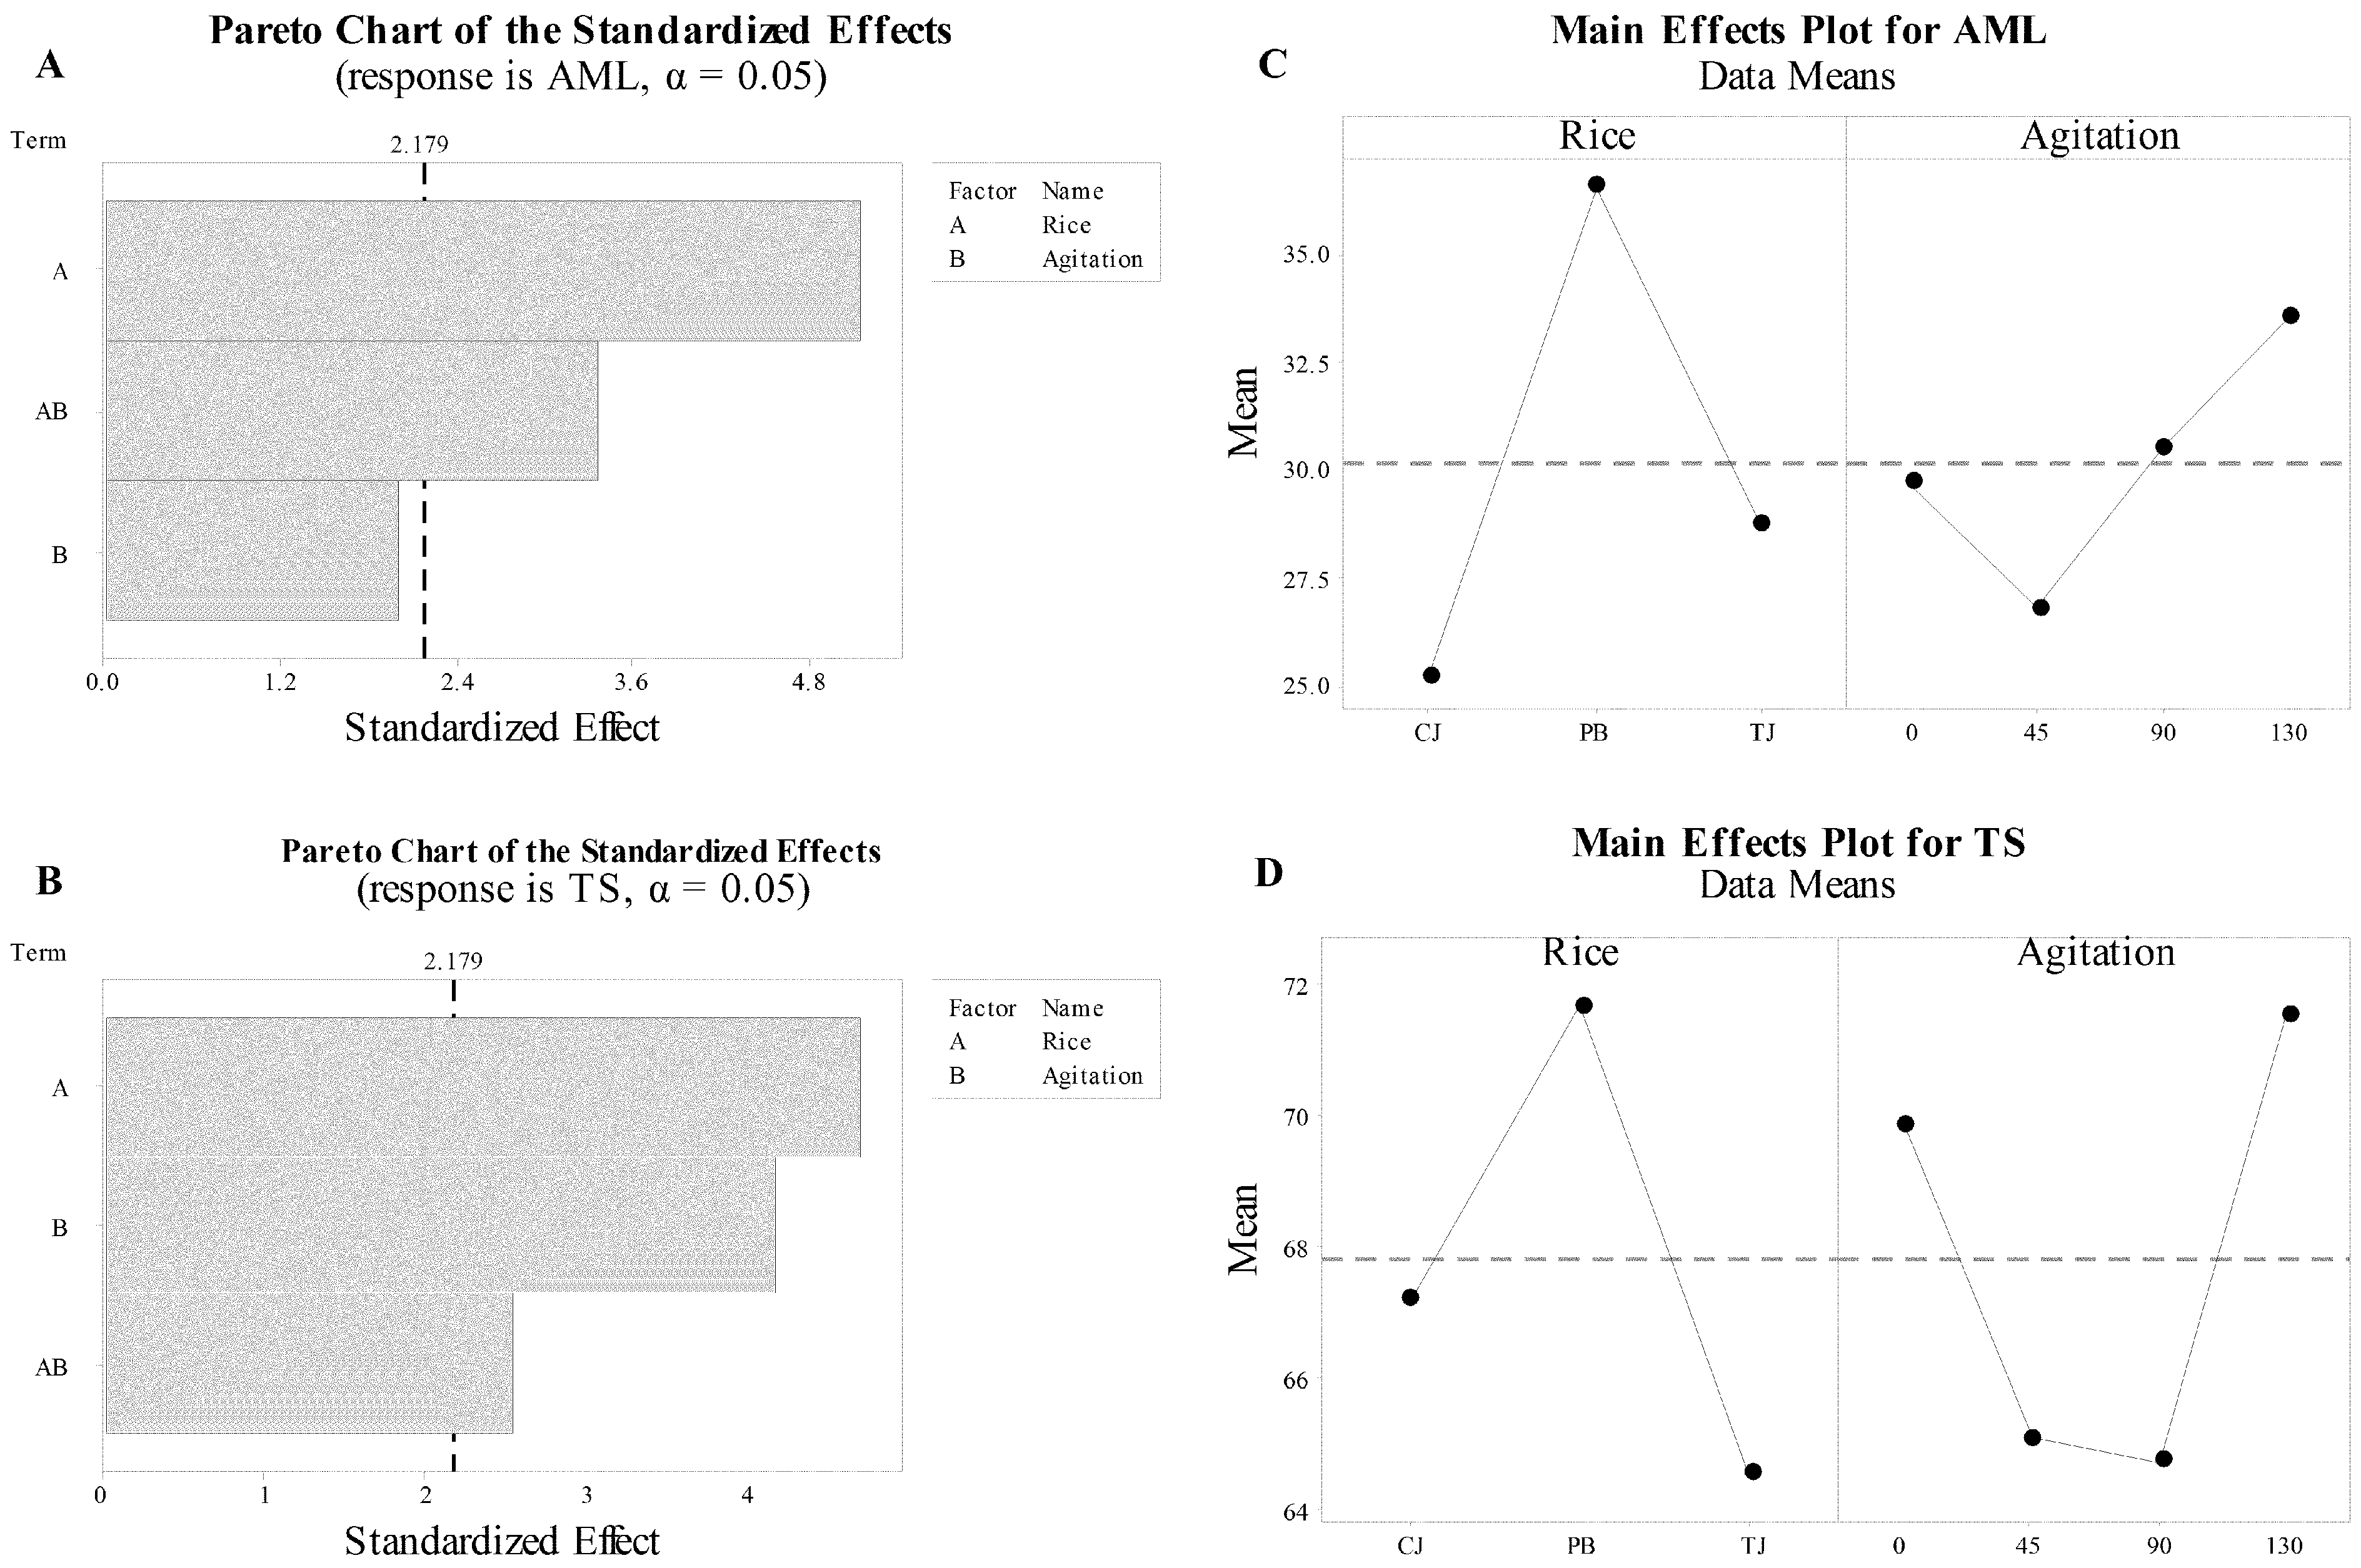
3.3. Rice Aroma Intensity
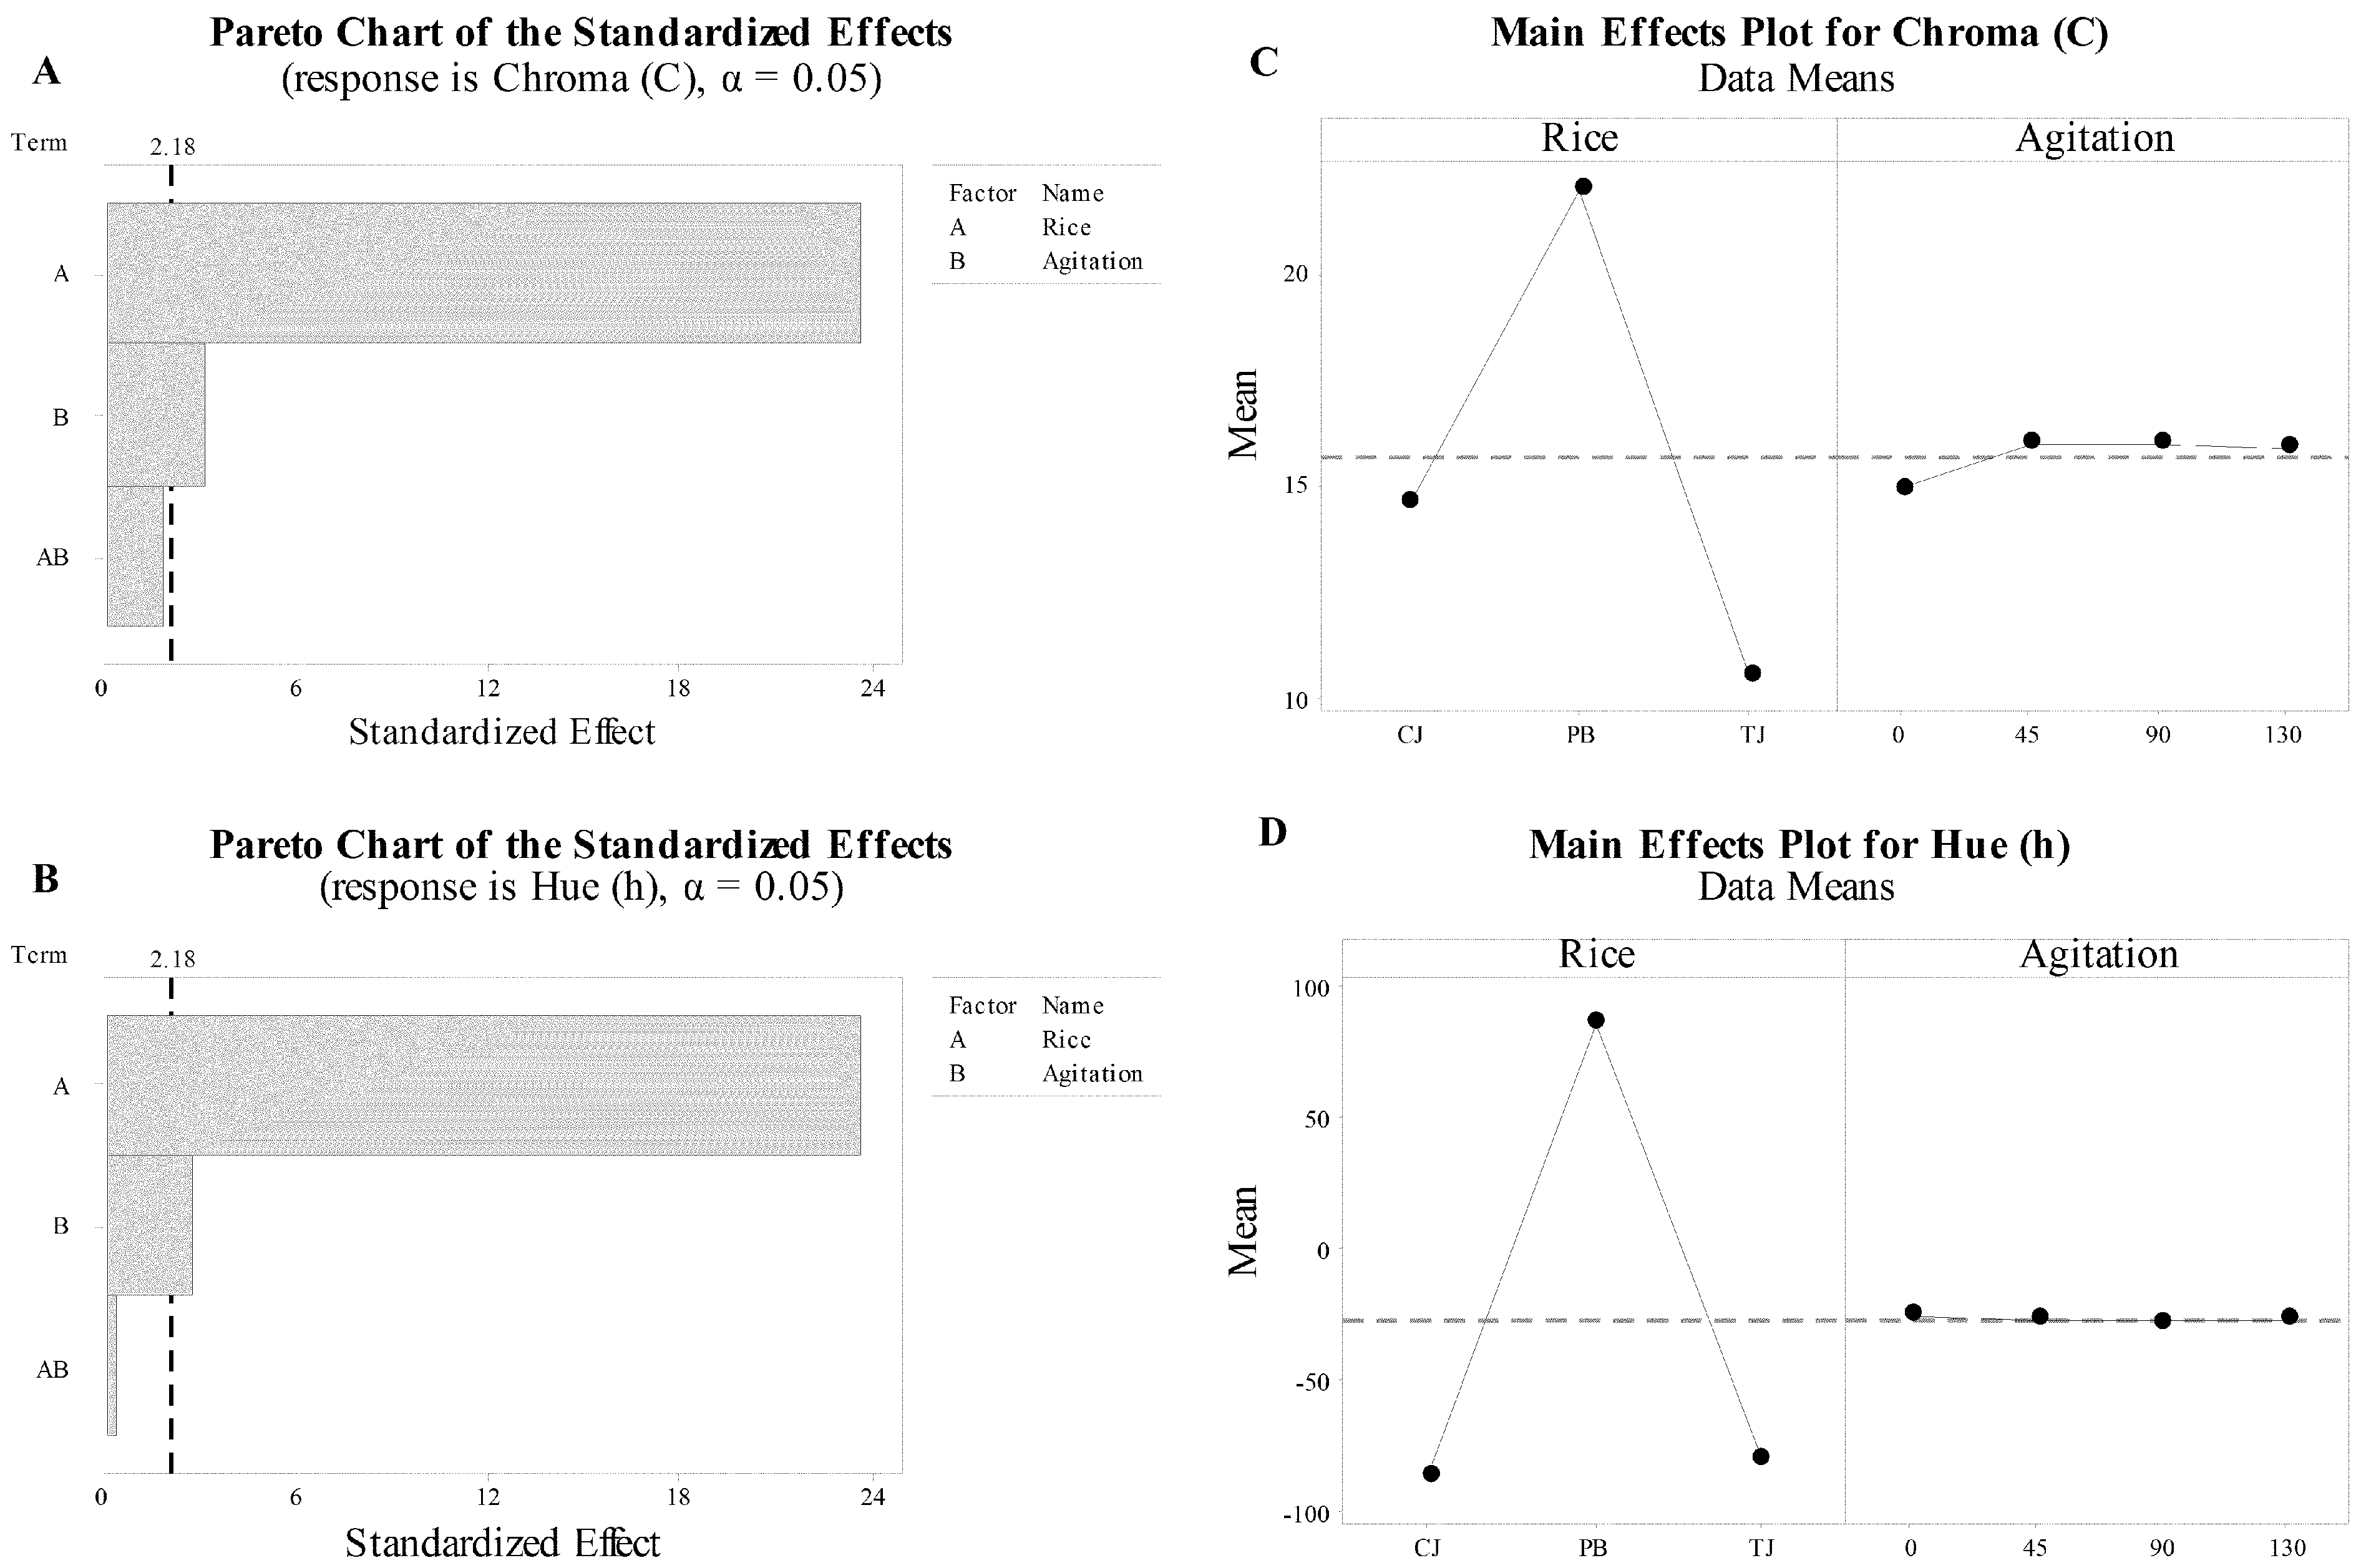
3.4. Rice Color Properties
3.5. Rice Proximate and Mineral Composition
3.6. Container Headspace
3.7. Consumer Response to Ready-to-Heat-and-Eat Rice
4. Discussion and Conclusions
Supplementary Materials
Author Contributions
Funding
Conflicts of Interest
References
- FAO. Available online: http://www.Fao.Org/Economic/Est/Publications/Rice-Publications/Rice-Market-Monitor-Rmm/En/ (accessed on 20 October 2020).
- Anonymous. “Roadmap to Reduce U.S. Food Waste”. 2016. Available online: https://www.refed.com/downloads/ReFED_Report_2016.pdf (accessed on 20 October 2020).
- Poore, J.; Nemecek, T. Reducing food’s environmental impacts through producers and consumers. Science 2018, 360, 987–992. [Google Scholar] [CrossRef] [PubMed]
- Willett, W.; Rockström, J.; Loken, B.; Springmann, M.; Lang, T.; Vermeulen, S.; Garnett, T.; Tilman, D.; Declerck, F.; Wood, A.; et al. Food in the Anthropocene: The EAT–Lancet Commission on healthy diets from sustainable food systems. Lancet 2019, 393, 447–492. [Google Scholar] [CrossRef]
- Muthayya, S.; Sugimoto, J.D.; Montgomery, S.; Maberly, G.F. An overview of global rice production, supply, trade, and consumption. Ann. N. Y. Acad. Sci. 2014, 1324, 7–14. [Google Scholar] [CrossRef] [PubMed]
- Yu, L.; Witt, T.; Bonilla, M.R.; Turner, M.S.; Fitzgerald, M.; Stokes, J.R. New insights into cooked rice quality by measuring modulus, adhesion and cohesion at the level of an individual rice grain. J. Food Eng. 2019, 240, 21–28. [Google Scholar] [CrossRef]
- Li, H.; Prakash, S.; Nicholson, T.M.; Fitzgerald, M.A.; Gilbert, R.G. Instrumental measurement of cooked rice texture by dynamic rheological testing and its relation to the fine structure of rice starch. Carbohydr. Polym. 2016, 146, 253–263. [Google Scholar] [CrossRef]
- Patindol, J.A.; Gonzalez, B.C.; Wang, Y.-J.; McClung, A.M. Starch fine structure and physicochemical properties of specialty rice for canning. J. Cereal Sci. 2007, 45, 209–218. [Google Scholar] [CrossRef]
- Tao, K.; Yu, W.; Prakash, S.; Gilbert, R.G. High-amylose rice: Starch molecular structural features controlling cooked rice texture and preference. Carbohydr. Polym. 2019, 219, 251–260. [Google Scholar] [CrossRef]
- Li, H.; Yu, L.; Yu, W.; Li, H.; Gilbert, R.G. Autoclaved rice: The textural property and its relation to starch leaching and the molecular structure of leached starch. Food Chem. 2019, 283, 199–205. [Google Scholar] [CrossRef]
- Batres-Marquez, S.P.; Jensen, H.H.; Upton, J. Rice Consumption in the United States: Recent Evidence from Food Consumption Surveys. J. Am. Diet. Assoc. 2009, 109, 1719–1727. [Google Scholar] [CrossRef]
- Kim, H.R.; Hong, J.S.; Ryu, A.; Choi, H. Combination of rice varieties and cooking methods resulting in a high content of resistant starch. Cereal Chem. J. 2019, 97, 149–157. [Google Scholar] [CrossRef]
- Wiruch, P.; Naruenartwongsakul, S.; Chalermchart, Y. Textural Properties, Resistant Starch, and in Vitro Starch Digestibility as Affected by Parboiling of Brown Glutinous Rice in a Retort Pouch. Curr. Res. Nutr. Food Sci. J. 2019, 7, 555–567. [Google Scholar] [CrossRef]
- Yasutomi, M.; Kosaka, T.; Kawakita, A.; Hayashi, H.; Okazaki, S.; Murai, H.; Miyagawa, K.; Mayumi, M.; Ohshima, Y. Rice protein-induced enterocolitis syndrome with transient specific IgE to boiled rice but not to retort-processed rice. Pediatr. Int. 2014, 56, 110–112. [Google Scholar] [CrossRef] [PubMed]
- Yu, L.; Turner, M.; Fitzgerald, M.; Stokes, J.; Witt, T. Review of the effects of different processing technologies on cooked and convenience rice quality. Trends Food Sci. Technol. 2017, 59, 124–138. [Google Scholar] [CrossRef]
- Fitzgerald, M.; McCouch, S.R.; Hall, R.D. Not Just a Grain of Rice: The Quest for Quality. Trends Plant Sci. 2009, 14, 133–139. [Google Scholar] [CrossRef] [PubMed]
- IFT. Home cooking during Covid-19. Food Technol. 2020, 74, 1. [Google Scholar]
- Prakash, M.; Ravi, R.; Sathish, H.; Shyamala, J.; Shwetha, M.; Rangarao, G. Sensory and instrumental texture measurement of thermally processed rice. J. Sens. Stud. 2005, 20, 410–420. [Google Scholar] [CrossRef]
- Auksornsri, T.; Bornhorst, E.R.; Tang, J.; Tang, Z.; Songsermpong, S. Developing model food systems with rice based products for microwave assisted thermal sterilization. LWT 2018, 96, 551–559. [Google Scholar] [CrossRef]
- Deng, Y.; Zhong, Y.; Yu, W.; Yue, J.; Liu, Z.; Zheng, Y.; Zhao, Y. Effect of hydrostatic high pressure pretreatment on flavor volatile profile of cooked rice. J. Cereal Sci. 2013, 58, 479–487. [Google Scholar] [CrossRef]
- Gerdes, D.L.; Burns, E.E. Techniques for cannning instant parboiled rice. J. Food Sci. 1982, 47, 1734–1735. [Google Scholar] [CrossRef]
- Narkrugsa, W. Study on the thermal processing of canned rice. Warasan Samnakngan Khana Kammakan Wichai Haeng Chat 1996, 28, 243–258. [Google Scholar]
- Byun, Y.; Hong, S.I.; Mangalassary, S.; Bae, H.J.; Cooksey, K.; Park, H.J.; Whiteside, S. The performance of organic and inorganic coated retort pouch materials on the shelf life of ready-to-eat rice products. LWT 2010, 43, 862–866. [Google Scholar] [CrossRef]
- Singh, A.P.; Yen, P.P.-L.; Ramaswamy, H.S.; Singh, A. Recent advances in agitation thermal processing. Curr. Opin. Food Sci. 2018, 23, 90–96. [Google Scholar] [CrossRef]
- Walden, R.; Emanuel, J. Developments in in-container retort technology: The Zinetec Shaka® process. In Case Studies in Novel Food Processing Technologies; Elsevier BV: Amsterdam, The Netherlands, 2010; pp. 389–406. [Google Scholar]
- Ramaswamy, H.S.; Basak, S.; Abbatemarco, C.; Sablani, S.S. Rhelogical Properties of Gelatinized Starch Solutions as Influenced by Thermal-Processing in an Agitating Retort. J. Food Eng. 1995, 25, 441–454. [Google Scholar] [CrossRef]
- Porretta, S.; Gere, A.; Radványi, D.; Moskowitz, H. Mind Genomics (Conjoint Analysis): The new concept research in the analysis of consumer behaviour and choice. Trends Food Sci. Technol. 2019, 84, 29–33. [Google Scholar] [CrossRef]
- Saulo, A.A.; Moskowitz, H.R. Uncovering the mind-sets of consumers towards food safety messages. Food Qual. Prefer. 2011, 22, 422–432. [Google Scholar] [CrossRef]
- Della, L.J.; D’Silva, M.U.; Best, L.E.; Smith, S.E.; Carthan, Q.N.; Rajack-Talley, T.A. Modelling message preference: An adaptive conjoint analysis of persuasvie messaging to increase fruit and vegetable consumption. J. Commun. Healthc. 2016, 9, 164–178. [Google Scholar] [CrossRef]
- Dinasco, C.; Wicker, L.; Krieger, B.; Moskowitz, H. How to identify the perfect product claim. World Food Ingred. 2015, 48–52. [Google Scholar]
- Sriseadka, T.; Wongpornchai, S.; Kitsawatpaiboon, P. Rapid Method for Quantitative Analysis of the Aroma Impact Compound, 2-Acetyl-1-pyrroline, in Fragrant Rice Using Automated Headspace Gas Chromatography. J. Agric. Food Chem. 2006, 54, 8183–8189. [Google Scholar] [CrossRef]
- Addison, C.K.; Angira, B.; Kongchum, M.; Harrell, D.L.; Baisakh, N.; Linscombe, S.D.; Famoso, A.N. Characterization of Haplotype Diversity in the BADH2 Aroma Gene and Development of a KASP SNP Assay for Predicting Aroma in U.S. Rice. Rice 2020, 13, 1–9. [Google Scholar] [CrossRef] [PubMed]
- Goufo, P.; Wongpornchai, S.; Tang, X. Decrease in rice aroma after application of growth regulators. Agron. Sustain. Dev. 2010, 31, 349–359. [Google Scholar] [CrossRef]
- Konica, M. Precise Colour Communication. Available online: https://www5.konicaminolta.eu/fileadmin/content/eu/Measuring_Instruments/4_Learning_Centre/C_A/PRECISE_COLOR_COMMUNICATION/PCC_2020/precisecolor_catalogcacpk_eng.pdf (accessed on 8 July 2020).
- Alok, J.; Patel, A.; Gopal, T.; Ravishankar, C. Heat penetration characteristics of rice-kheer during in-pouch processing in a rotary retort. Indian J. Dairy Biosci. 2000, 11, 50–54. [Google Scholar]
- Famoso, A.N.; Harrell, D.L.; Groth, D.E.; Kongchum, M.; Wenefrida, I.; Oard, J.H.; Zaunbrecher, R.E.; Bearb, K.F.; Conner, C.A.; Guidry, G.J.; et al. Registration of ’CLJ01′ rice. J. Plant Regist. 2019, 13, 143–147. [Google Scholar] [CrossRef]
- Saniso, E.; Prachayawarakorn, S.; Swasdisevi, T.; Soponronnarit, S. Parboiled rice production without steaming by microwave-assisted hot air fluidized bed drying. Food Bioprod. Process. 2020, 120, 8–20. [Google Scholar] [CrossRef]
- Xu, D.; Hong, Y.; Gu, Z.; Cheng, L.; Li, Z.; Li, C. Effect of high pressure steam on the eating quality of cooked rice. LWT 2019, 104, 100–108. [Google Scholar] [CrossRef]
- Hien, N.L.; Yoshihashi, T.; Sarhadi, W.A.; Hirata, Y. Sensory Test for Aroma and Quantitative Analysis of 2-Acetyl-1-Pyrroline in Asian Aromatic Rice Varieties. Plant Prod. Sci. 2006, 9, 294–297. [Google Scholar] [CrossRef]
- Dias, L.; Duarte, G.; Mariutti, L.R.; Bragagnolo, N. Aroma profile of rice varieties by a novel SPME method able to maximize 2-acetyl-1-pyrroline and minimize hexanal extraction. Food Res. Int. 2019, 123, 550–558. [Google Scholar] [CrossRef]
- McLellan, M.R.; Lind, L.R.; Kime, R.W. Hue angle determinations and statistical analysis for multiquadrant hunter L,a,b data. J. Food Qual. 1995, 18, 235–240. [Google Scholar] [CrossRef]
- Application Note. Insight on Color. Available online: https://www.hunterlab.se/wp-content/uploads/2012/11/CIE-L-a-b-.pdf (accessed on 10 October 2020).
- Ahmed, J.; Mulla, M.Z.; Arfat, Y.A.; Kumar, V. Effects of High-Pressure Treatment on Functional, Rheological, Thermal and Structural Properties of Thai Jasmine Rice Flour Dispersion. J. Food Process. Preserv. 2016, 41, e12964. [Google Scholar] [CrossRef]
- USDA. Jasmine Rice. Available online: https://fdc.nal.usda.gov/fdc-app.html#/food-details/604038/nutrients (accessed on 14 April 2020).
- FDA. Arsenic in Rice and Rice Products Risk Assessment Report; FDA Center for Food Safety and Applied Nutrition: Washington, DC, USA, 2016; pp. 47–48.
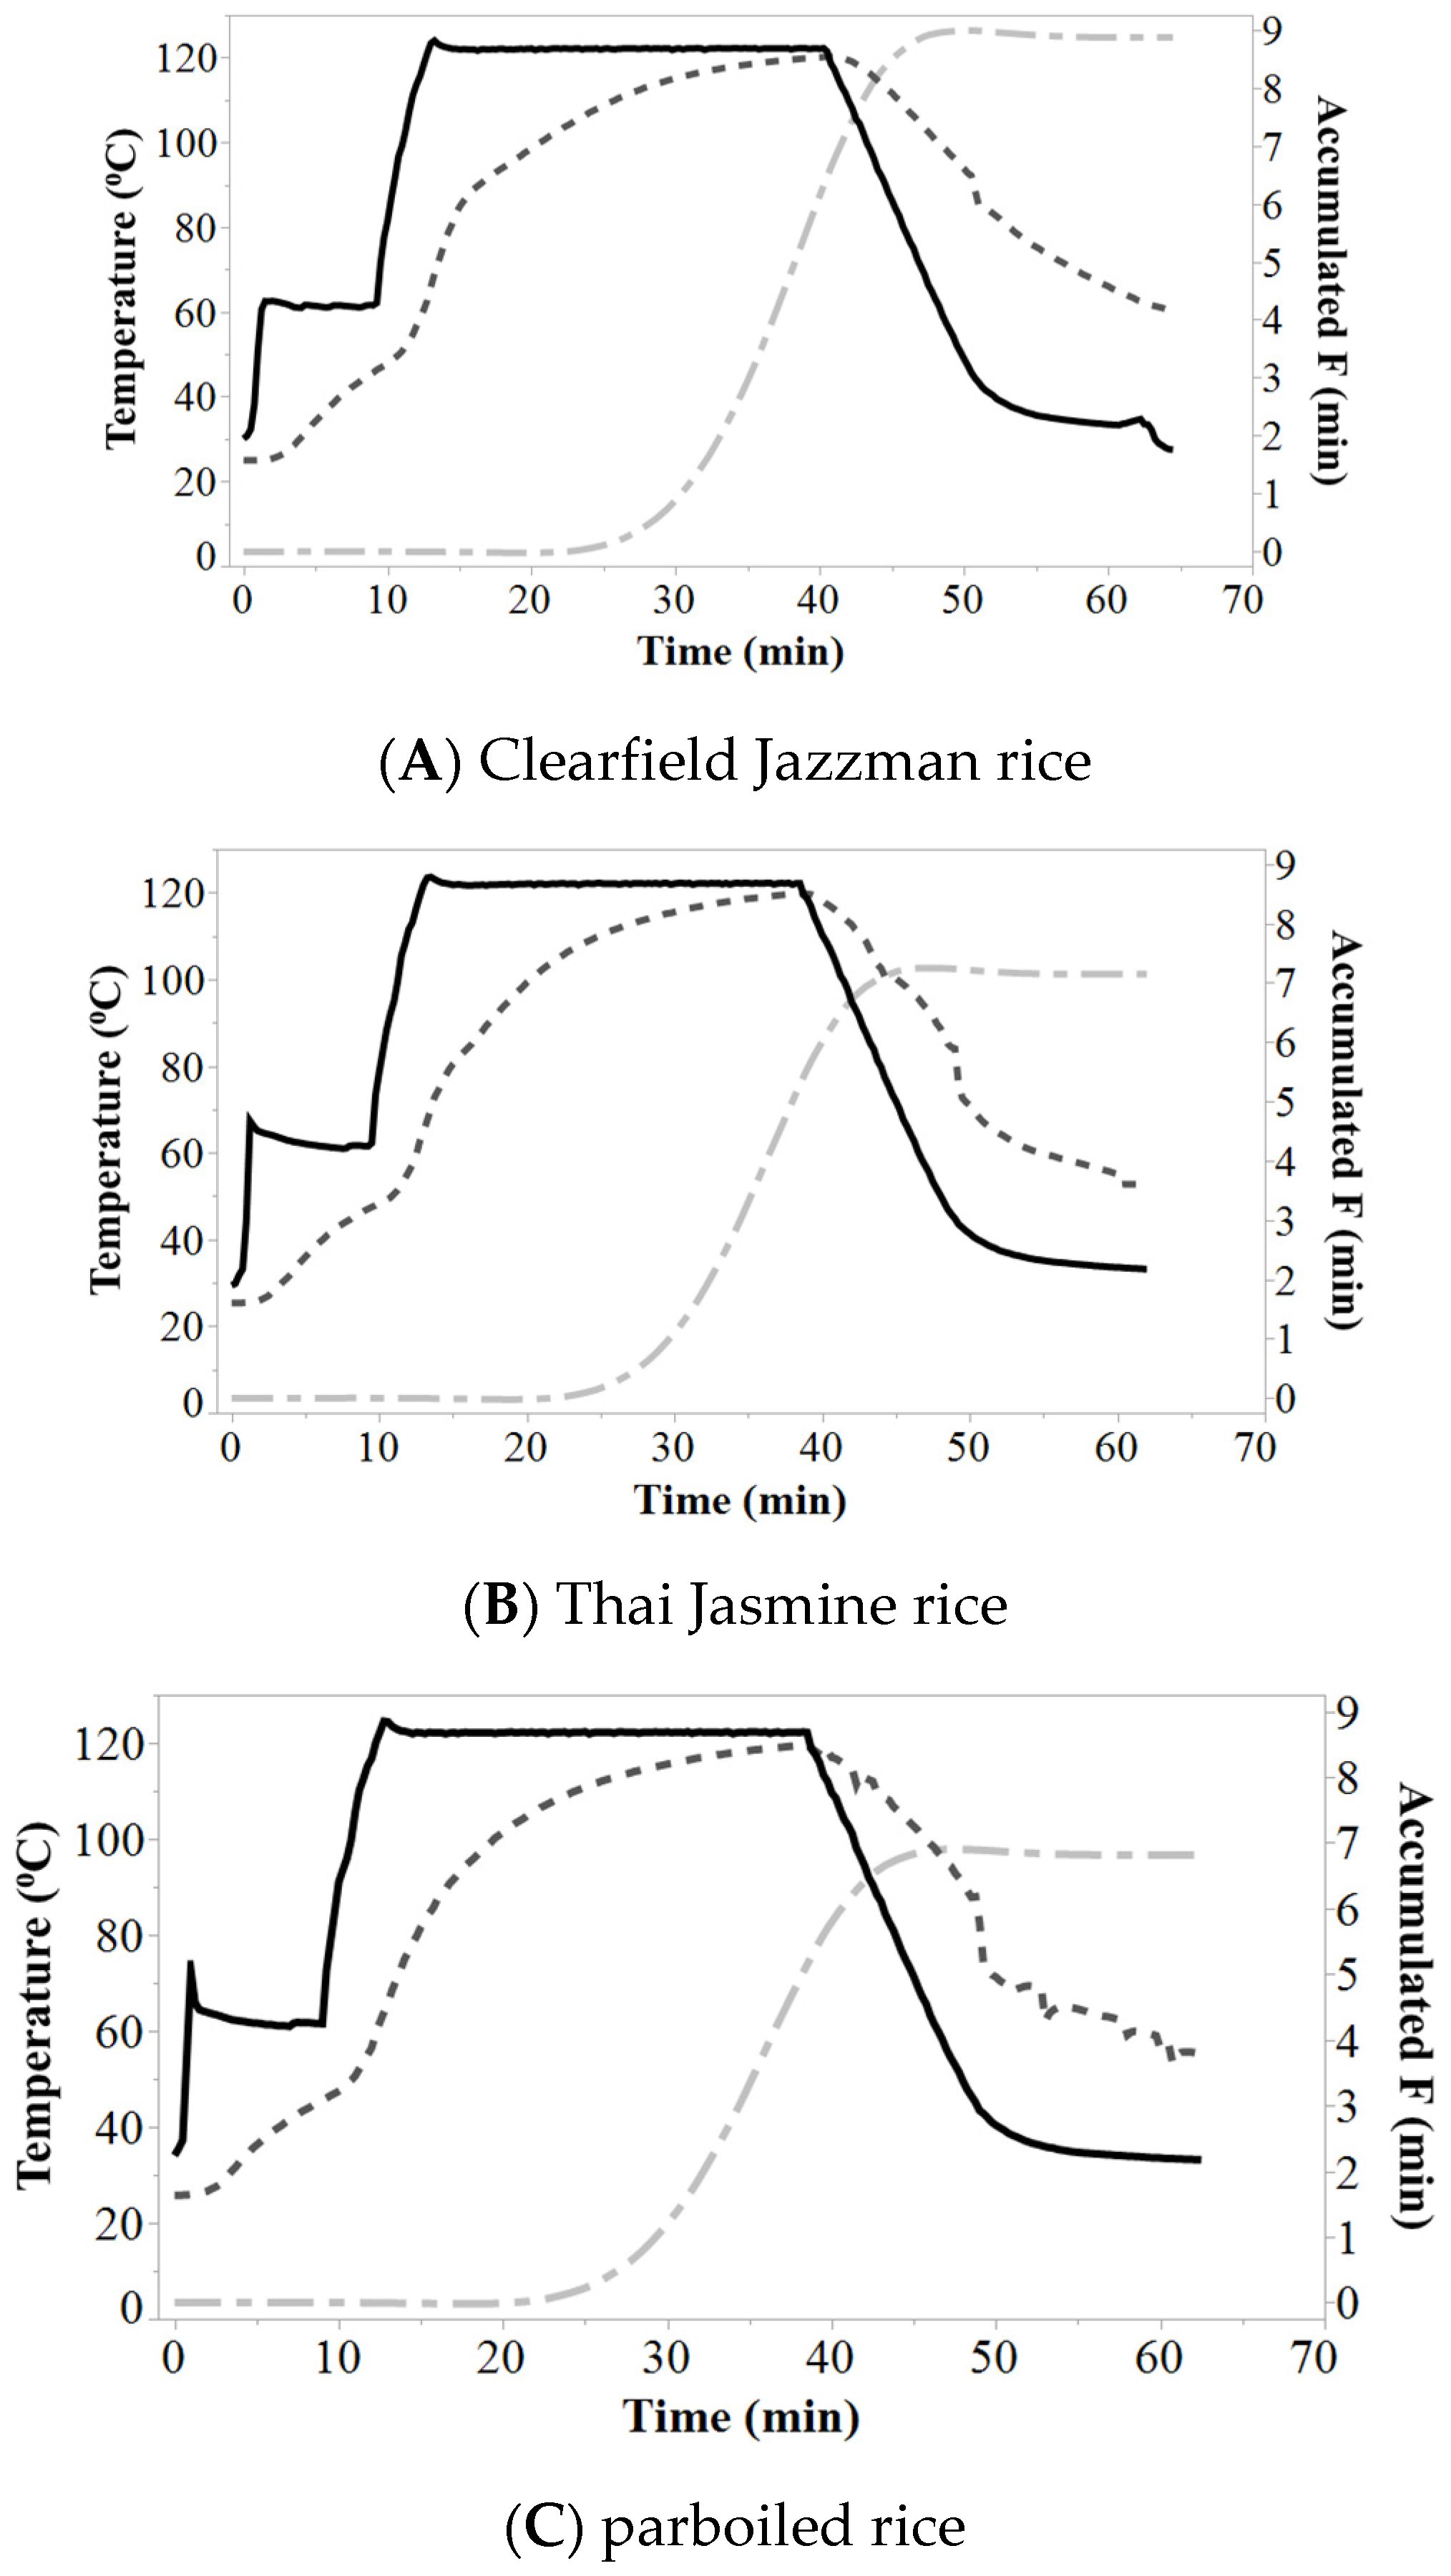
 ), heat penetration (
 ), and accumulated F0 (
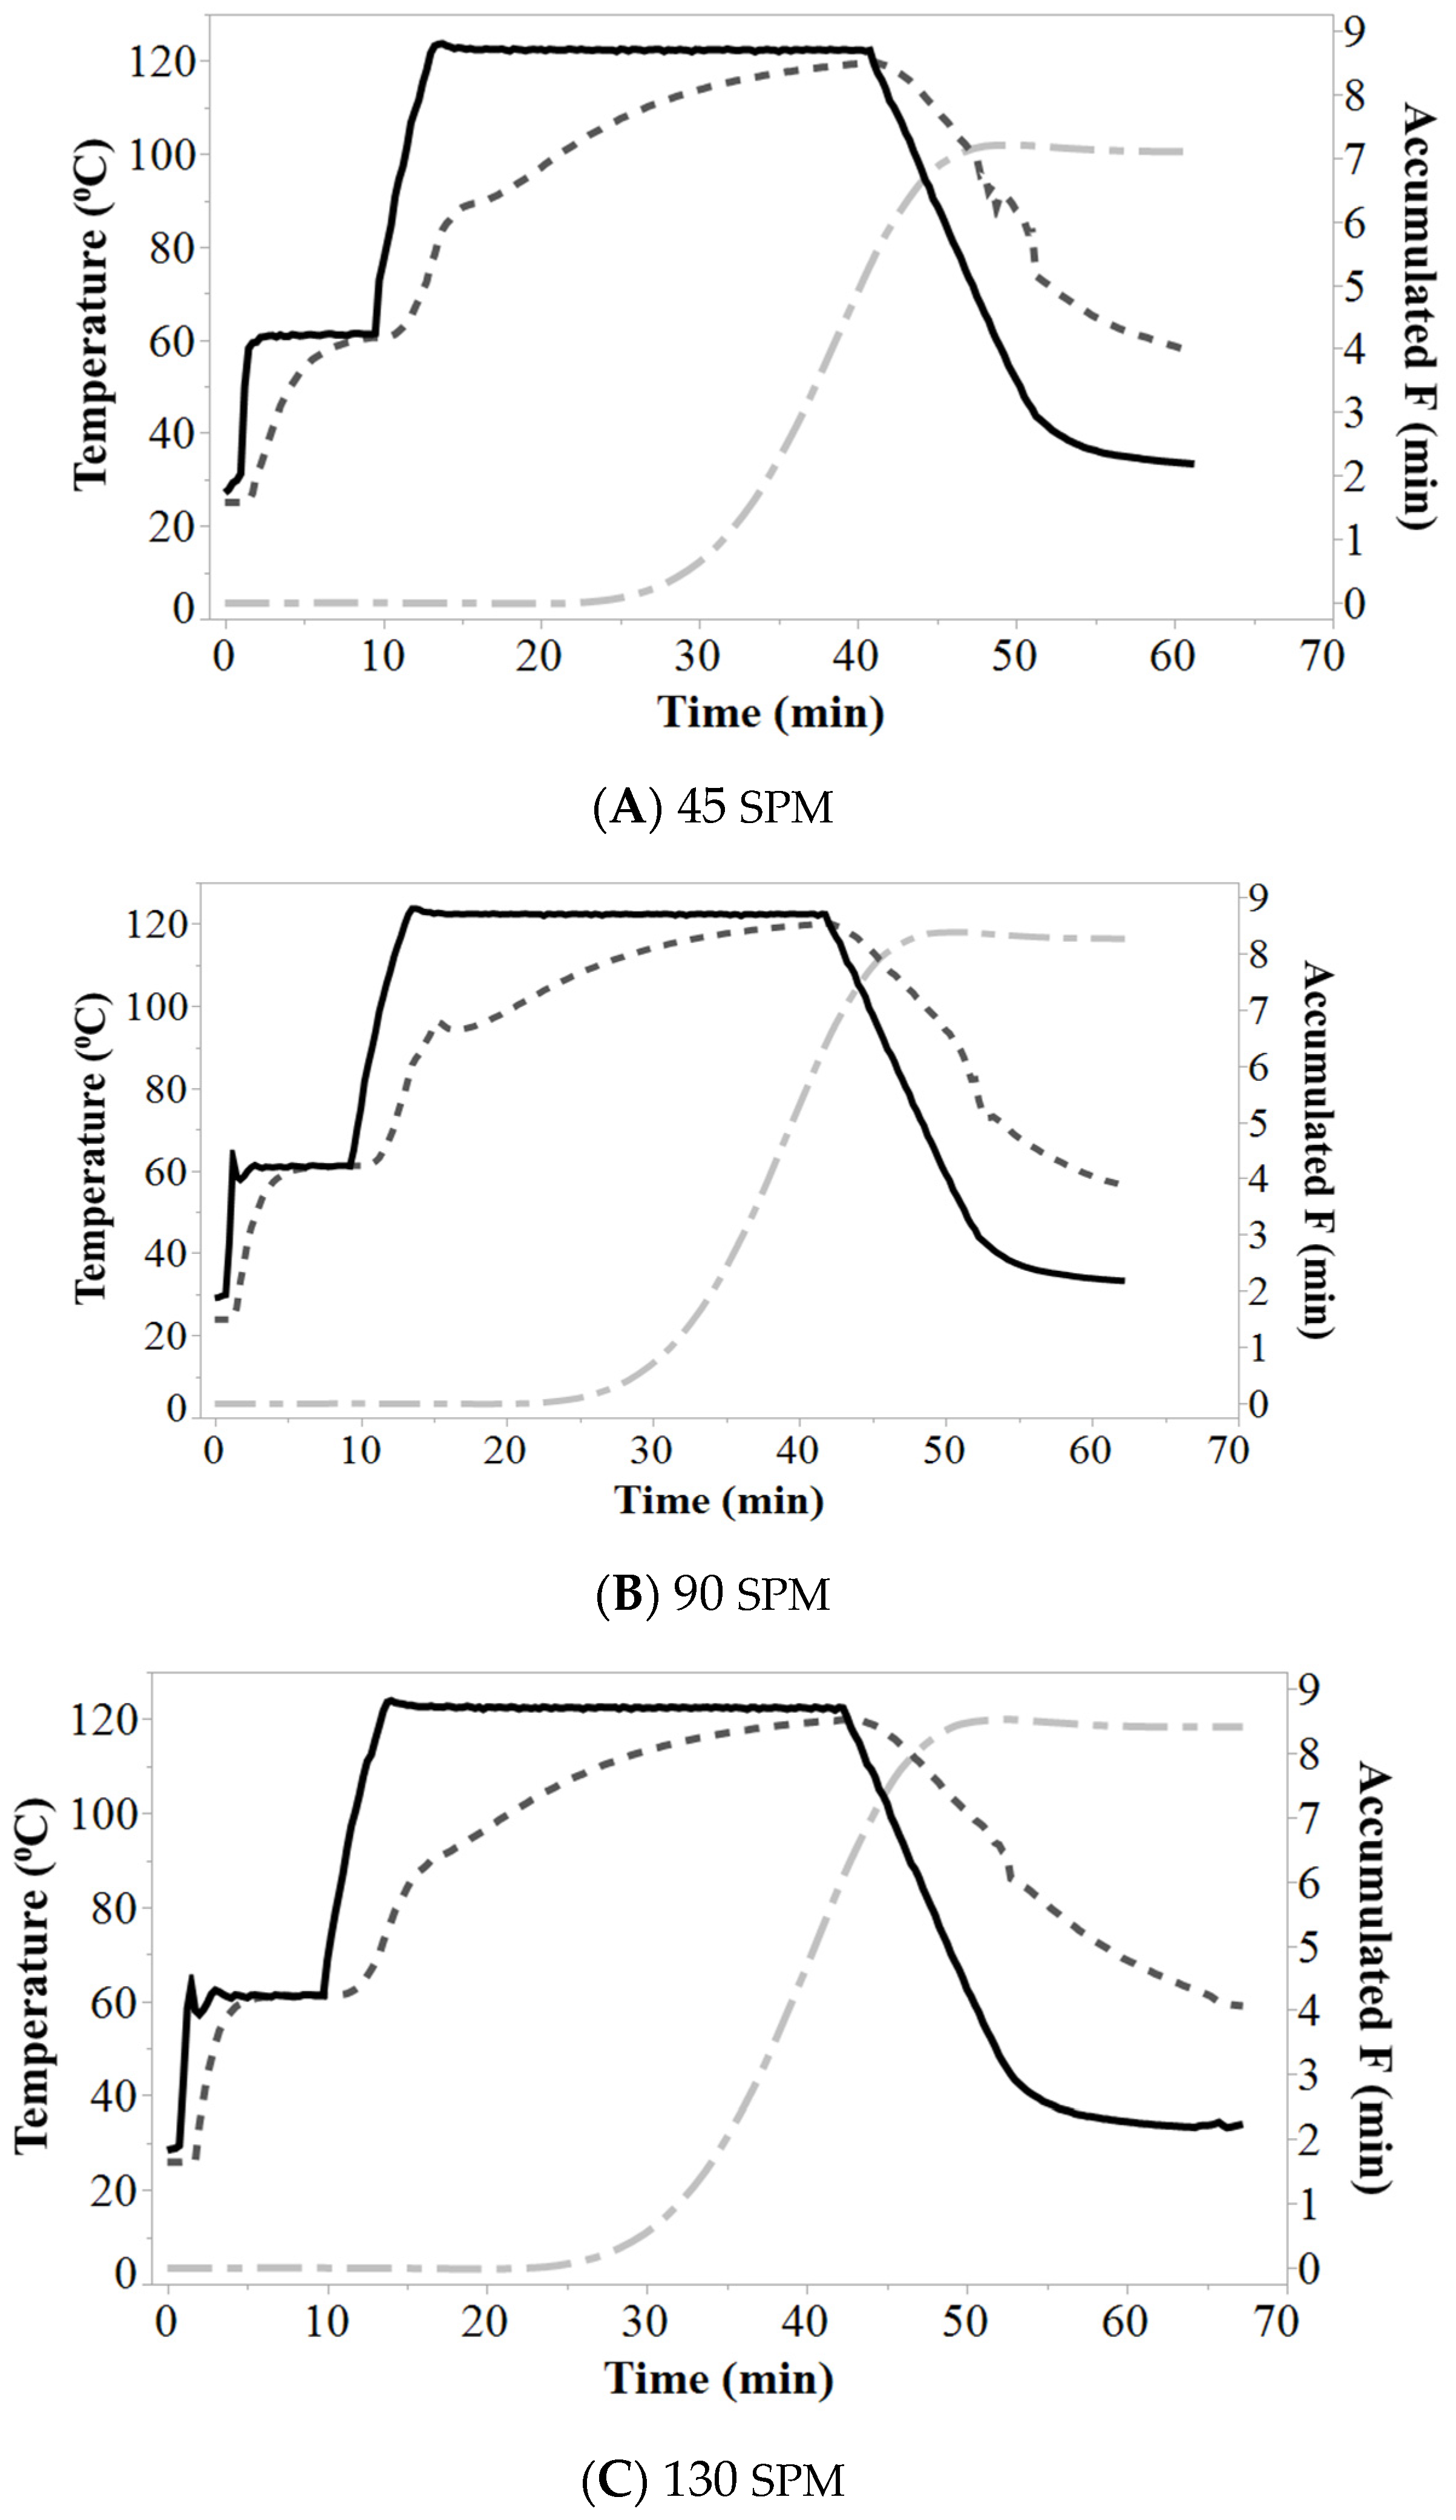
 ). shakes per min (SPM).
), heat penetration (), and accumulated F0 (). shakes per min (SPM).
). shakes per min (SPM).
), heat penetration (), and accumulated F0 (). shakes per min (SPM). ), heat penetration (), and accumulated F0 ().
), heat penetration (), and accumulated F0 ().
), heat penetration (), and accumulated F0 ().


| Slowest Heat Penetration Data | Ball Formula Factors | Process Time (min) at F0 = 6 | |||||||
|---|---|---|---|---|---|---|---|---|---|
| Rice | SPM | IT (°C) | Heat F (min) | Cool F (min) | Total F (min) | jh | fh | Bb | Pt |
| CJ | 0 | 25.0 | 6.14 | 2.73 | 8.87 | 1.19 | 18.6 | 32.8 | 27.1 |
| 45 | 25.0 | 5.22 | 1.88 | 7.10 | 0.98 | 21.7 | 34.9 | 29.2 | |
| 90 | 23.9 | 5.93 | 2.34 | 8.27 | 0.94 | 21.2 | 34.0 | 28.3 | |
| 130 | 25.9 | 5.92 | 2.49 | 8.40 | 0.95 | 22.3 | 35.3 | 29.7 | |
| TJ | 0 | 25.4 | 5.22 | 1.93 | 7.15 | 1.13 | 18.4 | 32.1 | 26.5 |
| 45 | 25.1 | 5.00 | 2.52 | 7.52 | 0.98 | 21.8 | 35.0 | 29.4 | |
| 90 | 24.7 | 6.40 | 1.96 | 8.35 | 1.21 | 18.9 | 33.3 | 27.7 | |
| 130 | 24.7 | 4.87 | 1.54 | 6.41 | 1.25 | 18.1 | 32.6 | 26.9 | |
| PB | 0 | 25.8 | 5.18 | 1.64 | 6.82 | 1.12 | 19.4 | 33.3 | 27.6 |
| 45 | 24.8 | 5.08 | 2.48 | 7.56 | 1.18 | 19.5 | 33.9 | 28.2 | |
| 90 | 25.5 | 5.81 | 1.94 | 7.75 | 1.08 | 19.4 | 33.0 | 27.3 | |
| 130 | 25.8 | 5.23 | 1.45 | 6.67 | 0.98 | 20.9 | 34.0 | 28.3 | |
| Sample | AML | RS | NRS | RS+NRS | TS | 2-AP |
|---|---|---|---|---|---|---|
| CJ–RC | 18.8 A ± 0.00 | 0.04 A ± 0.06 | 68.7 A ± 6.11 | 68.8 A ± 6.17 | 65.1 A ± 2.01 | 0.776 A ± 0.116 |
| CJ-0 | 18.3 A ± 0.01 | 0.13 A ± 0.02 | 64.3 A ± 1.86 | 64.5 A ± 1.84 | 71.3 A ± 1.96 | 0.083 ± 0.034 |
| CJ-45 | 21.2 A ± 0.01 | 0.70 A ± 0.78 | 69.6 A ± 9.90 | 70.3 A ± 10.68 | 63.1 ± 4.39 | 0.030 ± 0.000 |
| CJ-90 | 26.6 ± 0.01 | 0.06 A ± 0.03 | 70.0 A ± 4.67 | 70.1 A ± 4.64 | 63.9 A ± 1.18 | 0.035 ± 0.013 |
| CJ-130 | 34.7 ± 0.06 | 0.06 A ± 0.04 | 71.1 A ± 6.37 | 71.1 A ± 6.34 | 70.4 A ± 2.79 | 0.065 ± 0.077 |
| TJ–RC | 27.8 A ± 0.08 | 0.49 A ± 0.26 | 69.5 A ± 9.55 | 70.0 A ± 9.29 | 69.1 A ± 4.34 | 0.271 A ± 0.012 |
| TJ-0 | 38.2 A ± 0.06 | 0.15 A ± 0.04 | 71.6 A ± 4.34 | 71.8 A ± 4.38 | 69.8 A ± 3.27 | 0.030 ± 0.011 |
| TJ-45 | 21.9 A ± 0.04 | 0.21 A ± 0.17 | 72.6 A ± 6.13 | 72.8 A ± 6.29 | 61.2 A ± 3.12 | 0.006 ± 0.009 |
| TJ-90 | 26.1 A ± 0.00 | 0.16 A ± 0.02 | 70.7 A ± 9.20 | 70.9 A ± 9.22 | 62.2 A ± 3.02 | 0.007 ± 0.000 |
| TJ-130 | 28.5 A ± 0.06 | 0.10 A ± 0.07 | 73.0 A ± 7.67 | 73.1 A ± 7.73 | 65.0 A ± 2.95 | 0.007 ± 0.000 |
| PB–RC | 40.1 A ± 0.09 | 1.29 A ± 1.06 | 63.2 A ± 3.83 | 64.4 A ± 4.89 | 70.2 A ± 0.47 | |
| PB-0 | 32.6 A ± 0.03 | 1.52 A ± 0.40 | 59.9 A ± 10.43 | 61.4 A ± 10.83 | 68.4 A ± 0.62 | |
| PB-45 | 37.2 A ± 0.06 | 1.72 A ± 0.22 | 55.3 A ± 0.45 | 57.0 A ± 0.67 | 71.0 A ± 3.16 | |
| PB-90 | 38.8 A ± 0.02 | 1.58 A ± 0.026 | 60.8 A ± 16.62 | 62.4 A ± 16.36 | 68.2 A ± 1.09 | |
| PB-130 | 37.4 A ± 0.01 | 1.86 A ± 0.30 | 61.9 A ± 10.39 | 63.7 A ± 10.09 | 79.2 ± 0.37 |
| Samples 1 | L*2 | a*2 | b*2 | h*2 | C2 | ΔERC | ΔE0SPM |
|---|---|---|---|---|---|---|---|
| CJ–RC | 71.7 A ± 1.13 | −1.3 A ± 0.26 | 14.2 A ± 0.53 | −84.8 A ± 1.20 | 14.2 A ± 0.50 | − | − |
| CJ−0 | 75.5 A ± 0.76 | −1.3 A ± 0.04 | 13.2 A ± 0.93 | −84.3 A ± 0.58 | 13.2 A ± 0.92 | 4.1 ± 0.7 | − |
| CJ−45 | 76.3 A ± 0.55 | −1.0 A ± 0.06 | 14.8 A ± 0.24 | −86.2 A ± 0.17 | 14.9 A ± 0.24 | 4.7 ± 0.5 | 1.9 ± 0.2 |
| CJ−90 | 75.7 A ± 0.23 | −0.9 A ± 0.22 | 15.5 A ± 0.22 | −86.6 A ± 0.86 | 15.5 A ± 0.20 | 4.3 ± 0.5 | 2.4 ± 0.3 |
| CJ−130 | 74.4 A ± 3.03 | −1.0 A ± 0.03 | 14.8 A ± 0.20 | −86.1 A ± 0.15 | 14.9 A ± 0.19 | 4.1 ± 1.0 | 1.9 ± 0.3 |
| TJ−RC | 76.0 A ± 0.31 | −2.3 A ± 0.05 | 8.3 A ± 0.06 | −74.5 A ± 0.19 | 8.5 A ± 0.15 | − | − |
| TJ−0 | 78.7 ± 0.75 | −2.2 A ± 0.41 | 9.7 A ± 0.32 | −77.2 A ± 2.71 | 10.0 ± 0.22 | 2.8 ± 0.8 | − |
| TJ−45 | 77.1 A ± 0.10 | −1.9 A ± 0.08 | 10.3 ± 0.27 | −79.4 ± 0.70 | 10.5 ± 0.25 | 3.2 ± 0.3 | 1.9 ± 1.3 |
| TJ−90 | 77.6 A ± 0.12 | −1.8 A ± 0.10 | 10.7 ± 0.27 | −80.7 ± 0.74 | 10.9 ± 0.25 | 2.9 ± 0.7 | 1.0 ± 0.6 |
| TJ−130 | 78.1 ± 0.70 | −2.1 A ± 0.36 | 10.7 ± 0.81 | −79.0 A ± 1.03 | 10.9 ± 0.86 | 3.5 ± 0.6 | 1.1 ± 0.7 |
| PB−RC | 64.7 A ± 0.01 | 0.502 A ± 0.01 | 20.8 A ± 0.19 | 88.6 A ± 0.02 | 20.8 A ± 0.19 | − | − |
| PB−0 | 66.9 A ± 0.32 | 1.4 A ± 0.53 | 21.6 A ± 0.33 | 86.3 A ± 1.34 | 21.7 A ± 0.36 | 3.0 ± 0.8 | − |
| PB−45 | 65.9 A ± 1.73 | 1.9 ± 0.24 | 22.5 ± 0.71 | 85.2 ± 0.45 | 22.6 ± 0.72 | 2.3 ± 0.4 | 1.8 ± 0.4 |
| PB−90 | 66.9 A ± 0.86 | 1.8 ± 0.41 | 21.5 A ± 0.53 | 85.5 ± 0.64 | 21.6 A ± 0.55 | 3.0 ± 0.4 | 1.6 ± 0.3 |
| PB−130 | 70.6 A ± 4.58 | 1.6 A ± 0.10 | 21.9 A ± 0.03 | 86.0 ± 0.29 | 21.9 A ± 0.06 | 3.2 ± 0.9 | 1.4 ± 0.3 |
| A. Respondent Orientation Page. | |
| Rice is a staple food. Cooking rice at home takes about 40 min. There are new, pre-cooked rice products that can be stored in your pantry and are ready to microwave and eat in minutes. The pre-cooked rice is in packaging that looks like either a pouch or a bowl. The purpose of this study is to understand some of the factors that go into planning easy, family meals, and how ready-to-eat rice may contribute to healthier meals. | No individual names will be collected. All answers will be summarized only in aggregate form and no individual answers can be identified. You will see a statement and various combinations of phrases. The phrases may seem repetitive, but each combination is unique. Your participation is voluntary and by proceeding through the survey, you consent to participate. You may stop at any point in the survey. |
| B. Classification question. | |
| We want to develop more nutritious foods that you like to eat, that fit in your lifestyle, that are more sustainable, and to develop highly effective nutrition education programs. How likely are you to buy and use ready to heat and eat rice? | Answer: 9 (likely) to 1 (unlikely). |
| C. Additional optional question. | |
| How do you feel about cooking and eating at home during Covid?’ | I love having more time to plan and cook meals at home I like to cook, but I don’t always have what I need in my kitchen I cook at home more now but it is frustrating if no one likes it. I cook at home, but it takes a lot of planning and preparing; I prefer carry-out or restaurants. |
| Mindsets | |||||
|---|---|---|---|---|---|
| Mindsets: 1-PackagingPhiles; 2-Busy Rice Lovers; 3-Easy Meal Rice Cooks | Total | 1 | 2 | 3 | |
| Base Size | 199 | 62 | 68 | 68 | |
| Additive Constant | 52 | 50 | 52 | 52 | |
| Question A: Methods of cooking, preparation and keeping rice | |||||
| A1 | Cook methods: You cook rice for several meals and save cold left-overs to eat later | 0 | 5 | −12 | 6 |
| A2 | Cook methods: You cook rice for a single meal | 2 | 4 | −7 | 8 |
| A3 | Cook methods: You microwave cooked rice, just enough for each person | 1 | 0 | −8 | 12 |
| A4 | Cook methods: You cook rice for several meals and freeze leftovers to eat later | 2 | −2 | −6 | 13 |
| Question B: Reason for rice in meals | |||||
| B1 | RTB: Always have ready-to-eat rice in your pantry for a fast, easy meal for your hectic days | 4 | −2 | 13 | −2 |
| B2 | RTB: Rice fills you up when you are really hungry | 3 | −4 | 14 | −2 |
| B3 | RTB: Rice can be served with different recipes and never boring | 3 | −5 | 15 | −3 |
| B4 | RTB: Rice can be served to even the pickiest eater | 1 | −7 | 9 | −2 |
| Question C: Convenience of cooked, ready-to-eat rice | |||||
| C1 | Convenience: you can heat and eat in the same package, no cooking, no clean-up | 1 | −6 | 1 | 6 |
| C2 | Convenience: you can microwave rice, and the rice is never gummy | 2 | −1 | 1 | 7 |
| C3 | Convenience: you can microwave rice and dinner is ready in minutes | 3 | −4 | 2 | 9 |
| C4 | Convenience: you can microwave rice, add a stew and have a meal | 1 | −7 | 1 | 8 |
| Question D: Package | |||||
| D1 | Package: steel can, 100% recyclable, use your own bowl to re-heat | 0 | 12 | −2 | −9 |
| D2 | Package: plastic package, heat and eat, wash and use again | 0 | 14 | −5 | −8 |
| D3 | Package: plastic package, heat and eat, partially recyclable | 1 | 14 | −5 | −7 |
| D4 | Package: flexible pouches, heat and eat, dispose in trash | 1 | 14 | −5 | −6 |
Publisher’s Note: MDPI stays neutral with regard to jurisdictional claims in published maps and institutional affiliations. |
© 2020 by the authors. Licensee MDPI, Basel, Switzerland. This article is an open access article distributed under the terms and conditions of the Creative Commons Attribution (CC BY) license (http://creativecommons.org/licenses/by/4.0/).
Share and Cite
Dixon, W.R.; Morales-Contreras, B.E.; Kongchum, M.; Xu, Z.; Harrell, D.; Moskowitz, H.R.; Wicker, L. Aroma, Quality, and Consumer Mindsets for Shelf-Stable Rice Thermally Processed by Reciprocal Agitation. Foods 2020, 9, 1559. https://doi.org/10.3390/foods9111559
Dixon WR, Morales-Contreras BE, Kongchum M, Xu Z, Harrell D, Moskowitz HR, Wicker L. Aroma, Quality, and Consumer Mindsets for Shelf-Stable Rice Thermally Processed by Reciprocal Agitation. Foods. 2020; 9(11):1559. https://doi.org/10.3390/foods9111559
Chicago/Turabian StyleDixon, William R., Blanca E. Morales-Contreras, Manoch Kongchum, Zhimin Xu, Dustin Harrell, Howard R. Moskowitz, and Louise Wicker. 2020. "Aroma, Quality, and Consumer Mindsets for Shelf-Stable Rice Thermally Processed by Reciprocal Agitation" Foods 9, no. 11: 1559. https://doi.org/10.3390/foods9111559
APA StyleDixon, W. R., Morales-Contreras, B. E., Kongchum, M., Xu, Z., Harrell, D., Moskowitz, H. R., & Wicker, L. (2020). Aroma, Quality, and Consumer Mindsets for Shelf-Stable Rice Thermally Processed by Reciprocal Agitation. Foods, 9(11), 1559. https://doi.org/10.3390/foods9111559