Abstract
Anthocyanins with catechol (cyanidin) or pyrogallol (delphinidin) moieties on the B-ring are known to chelate metals, resulting in bluing effects, mainly at pH ≤ 6. Metal interaction with petunidin, an O-methylated anthocyanidin, has not been well documented. In this study, we investigated metal chelation of petunidin derivatives in a wide pH range and its effects on color and stability. Purple potato and black goji extracts containing >80% acylated petunidin derivatives (25 μM) were combined with Al3+ or Fe3+ at 0 μM to 1500 μM in buffers of pH 3–10. Small metal ion concentrations triggered bathochromic shifts (up to ~80nm) at an alkaline pH, resulting in vivid blue hues (hab 200°–310°). Fe3+ caused a larger bathochromic shift than Al3+, producing green colors at pH 8-9. Generally, metal ions increased the color stability and half-life of petunidin derivatives in a dose-dependent manner, particularly at pH 8. Petunidin derivative metal chelates produced a wide range of colors with enhanced stability.
1. Introduction
Anthocyanins are water-soluble pigments that provide brilliant red, purple and blue colors to vegetables and fruits [1]. They undergo characteristic pH-dependent structural transformations, exerting a diverse color appearance [2]. The consumption of fruits rich in anthocyanins is believed to benefit health and prevent the development of diabetes, cancer, and cardiovascular disease, based on epidemiological studies [3]. Given the fact that they possess potent antioxidant activity and are associated with health-promoting effects, anthocyanins have become an increasingly prevalent alternative to the current widely used synthetic food dyes which are suspected to cause activity problems in children [1,4,5].
Anthocyanin color and stability could be influenced by metal complexation [6]. It was reported that anthocyanins with at least two free hydroxyl groups on the B-ring could chelate multivalent metal ions, including, but not limited to, Fe2+, Fe3+, Ga3+, Al3+, Mg2+, Sn2+, Ti2+, and Cu2+ [7,8,9,10]. The metal ion acts in competition with H+ to attach to the catechol or pyrogallol moieties on the B-ring, triggering anthocyanin transformation from a red flavylium cation form to a purple-blue quinoidal base anion form. This transformed molecule could then stack with other flavylium cation molecules to form a stable complex, leading to a bathochromic shift in the spectrum and a bluing effect [11]. Although various types of anthocyanin–Mn+ complexes exhibiting blue colors have been reported, most of these studies mainly focused on cyanidin (two hydroxyl groups on the B-ring) and delphinidin derivatives (three hydroxyl groups on the B-ring) in acidic or mildly acidic conditions (pH ≤ 6) [8,11,12,13,14,15]. A recent study demonstrated that peonidin and cyanidin derivatives from purple sweet potato could bind Fe2+ and Al3+ via the anthocyanin chromophore and caffeoyl residues at a neutral pH [16]. Besides, ion traces were found to initiate caffeoyl residue autoxidation, leading to color loss, while anthocyanins carrying two caffeoyl residues were relatively invulnerable to the Fe2+ pro-oxidation effect due to a rigid iron chelation [16]. Anthocyanin–Mn+ chelation has been studied in foods such as strawberry puree [17], cranberry juice cocktail [6], crowberry juice [6], and in food model systems with sugar beet pectin [18], isolated pectin fractions [18], and polysaccharides [12] as a practical method to stabilize anthocyanin color. Metal chelation of anthocyanins has been reported to cause bathochromic shifts and favor anthocyanin expression of blue colors in cyanidin-, delphinidin-, and peonidin-rich materials [15,19]. To our knowledge, metal chelation with petunidin derivatives has not been previously reported. It remains to be explored if the metal chelation and the bluing effect could be observed in petunidin derivatives which possess two hydroxyl groups and one methoxy group on the B-ring (Figure 1). It is important to the food industry, as the elucidation of the anthocyanin–metal interaction would bring innovative technologies to obtain a wide range of vivid colors from natural sources, fulfilling the current clean label trend.
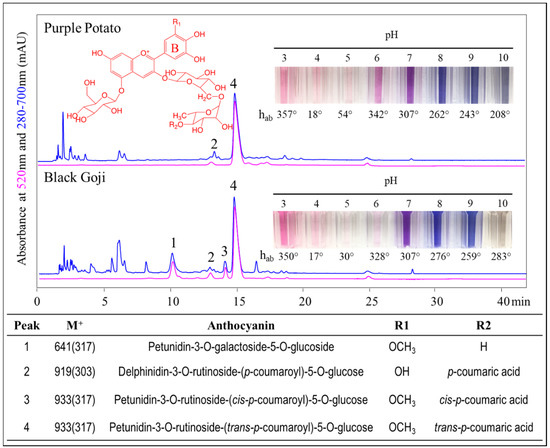
Figure 1.
Purple potato and black goji anthocyanin extracts chromatograms at 520 nm and 280–700 nm, and their color expression at different pH.
Purple potato (Solanum tuberosum L. subsp. andigenum) and black goji (Lycium ruthenicum Murr.) are two sources rich in petunidin derivatives. Purple potato has been increasingly popular among consumers during the past few years because of its potential health benefits [20]. Compared to white and yellow flesh potatoes, purple potato contains plentiful polyphenols, anthocyanins, and phenolic acids [21]. There are up to 1.5 g anthocyanins/kg DW in purple potato, and petunidin derivative was the predominant (~63%) pigment [20]. An average of 4.68 g of gallic acid (GA) equivalent polyphenols per kg DW were found, 3–4-folds of that in white flesh cultivars [20,22]. The Chinese herb black goji commonly grows on the Qinghai–Tibet Plateau. Its fruit, black goji berry, contains abundant anthocyanins (up to 5.5 g/kg FW) [3,23,24]. There are four major anthocyanins reported in the literature, and petunidin derivatives were the predominant (95%) pigments [3,23,24]. Black goji berry is rich in polyphenols (~13.1 g GA equivalents/kg FW) and possesses strong antioxidant activity (~10.60 g GA equivalents/kg FW) [23]. Our previous study showed that the petunidin-3-trans-p-coumaroyl-rutinoside-5-glucoside isolate contributed most of the color expression of the black goji extract. It also showed superior stability compared to crude extracts over time [24,25].
This study aimed to investigate the colorimetric and spectrophotometric properties of petunidin derivatives from purple potato and black goji, and to examine the impact of their metal chelation on the color expression and stability. We hypothesize that the metal chelation and the bluing effect can be observed in petunidin derivatives. This study adds to our knowledge of anthocyanin–metal chelation and provides the food industry with additional alternatives for producing a wider variety of colors derived from nature.
2. Materials and Methods
2.1. Materials & Reagents
Pigments were extracted from purple potatoes (cultivar Purple Majesty) purchased from a local grocery store (Whole Foods Market) in Columbus, Ohio, and black goji berries were obtained from LianHua Supermarket in Shanghai, China.
The chemicals and reagents used were obtained from Fisher Scientific (Fair Lawn, NJ, USA) as either ACS or HPLC grade: acetone, chloroform, methanol, citric acid, Na2HPO4, NaH2PO4, Na2CO3, NaHCO3, KCl, CH3COONa, lab-grade aluminum sulfate hydrate, reagent-grade ferric chloride hexahydrate, and LC/MS-grade acetonitrile. In addition, ACS grade ethyl acetate (C4H8O2) and formic acid (HCO2H) were acquired from Mallinckrodt Chemicals (Bedminster Township, NJ, USA) and Honeywell (Morris Plains, NJ, USA), respectively.
2.2. Pigment Extraction
Purple potato and black goji pigments were extracted by using acetone, and partitioned with chloroform. Approximately 100 g purple potato or black goji berry were sliced and mingled with liquid nitrogen before being powdered in a food blender. Acidified acetone (0.01% HCl) was blended with the powders, and then the pigment slurry was filtered through Whatman No. 4 filter paper (Whatman Incorporation, Florham Park, NJ, USA). Re-extraction was conducted using 70% (v/v) acidified (1% HCl) aqueous acetone that was used to re-wash the slurry until the filtrate was clear. The filtrate was then transferred to a separatory funnel, and gently mixed with chloroform. After that, the separatory funnel was stored in refrigerated dark conditions overnight, so that the pigments were concentrated in the upper aqueous phase. It was collected the next day in a round flask to remove the acetone and chloroform by a rotary evaporator.
2.3. Pigment Purification
The purification of pigment crude extracts was performed based on the method proposed by [26]. The aqueous anthocyanin extracts were forced to pass through a Sep-Pak® C18 cartridge (Waters Corporation, Milford, MA, USA) which had been activated with methanol. Two volumes of acidified water (0.01% v/v HCl) were then pumped to wash the column, followed by one volume of ethyl acetate. Next, the purple potato or black goji anthocyanins were recovered by flushing the column with acidified methanol (0.01% v/v HCl) and collected in a round flask. After the removal of methanol in a rotary evaporator at 40 °C, the purified anthocyanin was dissolved in acidified distilled water (0.01% v/v HCl).
2.4. Pigment Identification
Anthocyanins from purple potato and black goji extracts were identified by high-performance liquid chromatography (HPLC) (Shimadzu, Columbia, MD) using an SP-M20A photodiode array detector and an LCMS-2010EV liquid chromatograph mass spectrometer. A reverse phase Symmetry C-18 column with 5μm particle size and 4.6 × 150 mm column size (Phenomenex, Torrance, CA, USA) was used to separate pigments. Extracts were forced through a 0.22 um syringe filter (Phenomenex, Torrance, CA, USA) before HPLC injection. The mobile phase was solvent A (4.5% (v/v) formic acid) and solvent B (100% acetonitrile). The flow rate was set to be 0.8 ml/min. The linear gradient in this study was programmed as follows: 7% B 0–1 min, 7–20% B 1–30 min, 20–40% B 30–36 min, 40% B 36–40 min, 40–7% B 40–42 min, 7% B 42–52 min. Anthocyanin and phenolic compound elutions were monitored at 500–530 nm and 280–700 nm, respectively. Total ion scan and selected ion monitoring (positive mode with mass/charge ratio of 271, 287, 303, 301, 317, and 331, corresponding to the six most common anthocyanin aglycones) were used to analyze the pigment composition in samples.
2.5. Pigment Quantification
The monomeric anthocyanin content was quantified by the pH differential method adopted from [27]. Purified anthocyanin samples were dissolved in 0.025 M potassium chloride buffer (pH 1) and 0.4 M sodium acetate buffer (pH 4.5). After 15 min equilibrium, the absorbances at λvis-max (524 nm) and at 700 nm were measured by a UV–Vis spectrophotometer (Shimadzu Corporation, Tokyo, Japan). The quantification was accomplished in triplicate, and the monomeric anthocyanin contents of the extracts were expressed as cyanindin-3-glucoside equivalents (MW = 449.2, molar absorptivity = 26,900). Anthocyanin purity was defined as: the area under the curve (AUC) at 520 nm / AUC at max absorbance at 280–700 nm in the HPLC chromatograph.
2.6. Buffer System and Sample Preparation
A series of buffer solutions ranging from pH 3 to 10 were prepared (citric acid-Na2HPO4 buffer solutions for pH 3–7; Na2HPO4-NaH2PO4 buffer solution for pH 8; Na2CO3-NaHCO3 buffer solutions for pH 9–10) [28]. Purple potato and black goji anthocyanin extracts (25 μM) were diluted in the above buffers and the final mixtures’ pH environment was confirmed by a pH meter (Mettler Toledo Inc., Columbus, OH, USA). For the metal chelation study, metal ion solutions (Al3+ or Fe3+) were prepared at a concentration of 0.06 M before mixing with 25 μM purple potato or black goji anthocyanin extracts based on specific target anthocyanin to metal ion molar ratios (1:0.1, 1:0.5, 1:1, 1:2, 1:5, 1:10, 1:30, 1:60) in buffers of pH 3–9 (namely, the metal ion concentrations were 2.5, 12.5, 25, 50, 125, 250, 750, and 1500 μM). The final pH condition in each combination was also confirmed by a pH meter. Although the pH differential method is a widely used method for quantifying anthocyanins, the absorbance maximum and molar extinction coefficient for cyanidin 3-O-glucoside are much different than those of the petunidin anthocyanins presented here. Therefore, the “molar ratios” reflect the relative amount of anthocyanins (in cyanindin-3-glucoside equivalents) and metal ions.
The initial spectrophotometric and colorimetric measurements were collected after 60 min of equilibration. Anthocyanin samples chelated with metal ions were stored in refrigerated (4 °C) conditions in the dark for 4 weeks for the stability test. Experiments were done in triplicate.
2.7. Spectrophotometric Analysis
Anthocyanin samples with or without metal ions were mixed with different buffer systems before being transferred (250 μL) to poly-D-lysine-coated polystyrene 96-well plates. The spectra of these samples from 380 to 700 nm (1nm interval) were collected by using a SpectraMax 190 Microplate Reader (Molecular Devices, Sunnyvale, CA, USA). Samples were sealed in a well plate with parafilm to prevent evaporation, and were stored refrigerated (4 °C) in the dark.
2.8. Half-Life Calculation
The absorbance at the λmax from t0 (60 min) of the sealed samples (described in Section 2.7. Spectrophotometric Analysis) were measured at 60 min and at 1, 2, and 3 days. Linear regressions (R2 > 0.8) were modeled from the natural logarithm of the absorbances at each time point based on the formula ln(At) = −kt + ln(A60min). The half-lives were calculated as t1/2 = ln2/k.
2.9. Colorimetric Analysis
The color characteristics of each mixture were measured by using a Hunter ColorQuest XE spectrophotometer (HunterLab, Reston, VA, USA) using total transmission mode; the data were presented in a CIELab system (L*, C*ab, hab, a*, and b*) using a 10° observer angle and D65 illuminant spectral distribution. Color was monitored over 4 weeks under refrigerated storage in the dark (60 min after mixing, and on day 1, 2, 3, 4, 5, 7, 14, 21, and 28). The color changes were calculated as ΔE*ab using the 60 min colorimetric data as a control (formula is listed below). All the samples were sealed in cell culture flasks throughout the study.
2.10. Statistical Analysis
Statistical analysis was conducted by Prism software (GraphPad, La Jolla, CA, USA). One-way ANOVA (two-tailed, α = 0.05) was conducted to compare the differences among each treatment group. In case of significance, a post hoc Tukey’s test with family-wise α = 0.05 was performed.
3. Results and Discussion
3.1. Anthocyanin Profiles in Purple Potato and Black Goji
Anthocyanins from purple potatoes (cultivar Purple Majesty) and black goji were separated as shown in Figure 1, with 82% and 70% purity, respectively. In purple potato, one anthocyanin accounted for 91% of the total peak area at 520nm and was identified as petunidin-3-rutinoside-(p-coumaroyl)-5-glucose (peak 4, Figure 1). A second minor peak (peak 2) representing ~4% of the total peak area was delphinidin-3-rutinoside-(p-coumaroyl)-5-glucoside. The same pigments were identified in purple potato varieties by previous researchers [20,29,30] although their proportions varied widely.
Three major black goji anthocyanins accounted for 96% of the total peak area at 520nm (Figure 1). The peak areas of these pigments (peaks 1, 3, and 4) were approximately 18%, 7%, and 71%, respectively. According to the MS data and acid hydrolysis, all major anthocyanins in black goji were petunidin derivatives and ~80% of the total pigments were acylated. The minor peak (peak 2) was identified as a delphinidin derivative and represented less than 5% of the anthocyanins. The pigments were petunidin-3-galactoside-5-glucoside (peak 1), delphinidin-3-trans-p-coumaroyl-rutinoside-5-glucoside (peak 2), petunidin-3-cis-p-coumaroyl-rutinoside-5-glucoside (peak 3), and petunidin-3-trans-p-coumaroyl-rutinoside-5-glucoside (peak 4), agreeing with a previous study [23]. Interestingly, two black goji anthocyanins (peaks 2 and 4) matched two of the pigments found in purple potato.
The extracts were purified by a C18 cartridge with a wash of ethyl acetate, which removed the less polar phenolic compounds [26]. By using the max absorbance at 280–700 nm and mass spectrometry data and comparing to previous references [20,31,32], we have identified other phenolics, such as 5-O-caffeoylquinic acid (355 m/z), 4-O-caffeoylquinic acid (355 m/z), and caffeic acid (181 m/z) in purple potato, and dihydrocaffeoyl-caffeoyl spermidine derivatives in black goji. Our previous study showed no significant differences in the colorimetric and spectrophotometric properties between the black goji crude extracts and C-18 cartridge-purified extracts [24]. Therefore, the anthocyanin purity in that study did not affect the color considerably.
3.2. Spectrophotometric and Colorimetric Properties of Purple Potato and Black Goji Extracts
Generally, both extracts displayed vivid red, purple, and violet-blue hues in acidic, neutral, and alkaline pH, respectively (Figure 1). Anthocyanins undergo pH-dependent structure transformation [2,33], and under acidic pH, the flavylium cation predominates. Purple potato and black goji extracts exhibited hue angles (h) around 355° in CIE L* C*ab hab color space at pH 3, corresponding to red-purple hues (Table 1). When the pH increases to a mildly acidic environment, hydration of the flavylium cation is expected with the formation of the colorless carbinol pseudobase form. As a result, at pH 4 and 5, the chroma (C*ab) decreased and the color of the extracts became pale and dull (Table 1 and Figure 1). At neutral pH, the quinoidal base is formed, and it starts to carry negative charges as the pH reaches more alkaline conditions, leading to blue colors. The hue angles of the purple potato extracts turned from 341.6° at pH 6 to 207.8° at pH 10. Similarly, black goji extracts experienced the same changes in hue angles, but to a lesser degree (327.7° at pH 6 to 282.6° at pH 10). Remarkably, petunidin derivatives displayed various vivid blue hues in neutral and alkaline conditions, with corresponding hue angles ranging from 242.6° and 306.6° (Table 1). The chroma of both extracts also was enlarged in these neutral–alkaline pHs.

Table 1.
Colorimetric (CIE-L*, C*ab, hab) and spectrophotometric (λvis-max) data of purple potato and black goji anthocyanin extracts over pH 3–10. Data are presented as means (n = 3) followed by standard deviations (in parentheses). NM: not measurable due to color loss.
The increase in pH and the resulting color changes toward the blue region were a result of the bathochromic changes in the visible spectra of the pigments (Table 1). The λmax of both extracts at acidic pH was ~524 nm and it was boosted to 578 nm at pH 8 and 9. The visible spectra of purple potato and black goji extracts at alkaline pH presented a distinctive peak shoulder (~630 nm) next to the λmax (Figure 2).
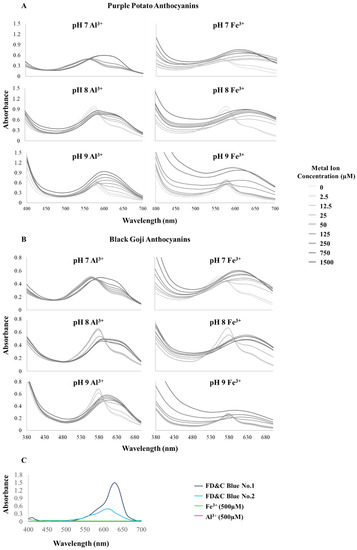
Figure 2.
Spectral characteristics of purple potato (A) and black goji (B) anthocyanin metal chelates at neutral and alkaline pH. The control groups including FD&C Blue colorants and metal ions (500 μM) were shown in (C). Data were collected 1 hr after the anthocyanins were mixed with metal ions and pH adjustment with the buffers. The spectra at acidic pHs are not presented due to no impact of metal addition.
3.3. Colorimetric Properties of Petunidin-Rich Extracts after Metal Addition
Bluing responses with vivid colors were found in the petunidin–M3+ chelates (abbreviated as Pt-M3+) (Figure 3). The color hues of Pt-M3+ were dependent upon the metal ion source, pH, and Pt-M3+ ratio.
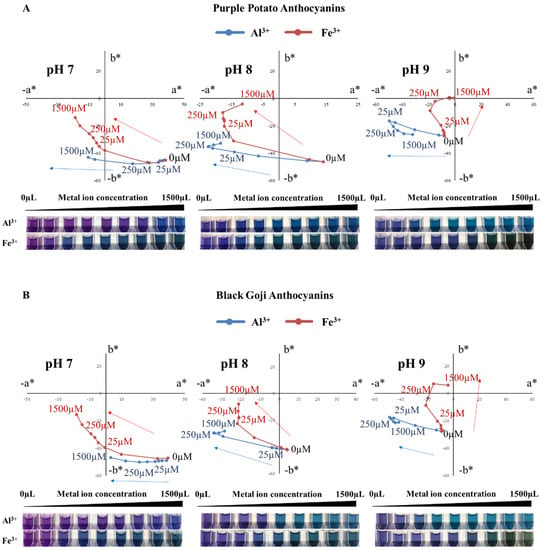
Figure 3.
Colorimetric changes of the purple potato (A) and black goji (B) anthocyanin extracts chelated with metals. Data were collected 1 hr after the anthocyanins were mixed with metal ions and pH adjustment with the buffers.
With the increase in [Al3+], purple potato extracts developed a variety of blue colors. At pH 7, brilliant blue with a hue angle of ~261° appeared, starting from [Al3+] of 750 μM. Darker blue (~240°) and greenish blue (~200°) were obtained when [Al3+] was 50 μM at pH 8 and pH 9, respectively. Fe3+ also triggered bluing shifts, as the increasing [Fe3+] led to the transition of Pt-Fe3+ from quadrant IV (purple to blue region) to quadrant III (green to blue region) in the CIELAB color space (Figure 3). Larger concentrations of Fe3+ resulted in the expression of a yellow hue, likely due to oxidation. These yellow tones mixed with the blue colors, producing green colorations when [Fe3+] exceeded 750 μM, with hue angles of ~216°, 210°, and 167° at pH 7, 8, and 9, respectively (Figure 3). Similar results were found with black goji Pt-M3+ chelates, where various blue and greenish blue colors were obtained in neutral and alkaline pH (Figure 3).
The ratio between petunidin derivatives and M3+ needed for blue color formation was closely related to the pH of the buffer and M3+ source. Less [Al3+] was required to induce blue hue formation when the pH increased from 7 to 9, supporting the theory of the competition between metal ions and hydrogen ions for attachment to B-ring catechol moiety [34]. However, increasing [Fe3+] was essential for the blue-green hue development regardless of pH. This could be due to the aggregation and precipitation of anthocyanin pigment by the excess addition of Fe3+, as well as the poor solubility of Fe3+ in alkaline pH [8,16,18,35].
In order to measure the minimum [M3+] necessary to trigger a color change in purple potato and black goji extracts, ΔE*ab was calculated. Typically, ΔE*ab = 5 is believed to be noticeable by untrained observers. Both metal ions tested at all pH values were able to cause color changes in Pt-colored solutions even when [M3+] was less than or equal to 25 μM. As the pH increased from 7 to 9, Pt-M3+ required less [Al3+] to achieve a noticeable color change (ΔE*ab ≥ 5), while more [Fe3+] was needed. In purple potato extracts, Al3+ in small concentrations ([Al3+] = 12.5 μM) could produce blue colors at pH 8 and 9, and it was the same for Fe3+ at pH 7 and 8 (Figure 3 and Table 2). These low-threshold properties are desirable since there are some concerns regarding the neurotoxicity associated with metals [36]. However, both aluminum sulfate (21 CFR section 182.1125) and ferric chloride (21 CFR section 184.1297) are considered by the FDA as Generally Regarded as Safe (GRAS), with no limits to usage. In addition, a metallic salt is an important ingredient in FD&C lake pigments, e.g., Red 40 Aluminum Lake and Blue #1 and #2 Aluminum Lake. The metal ion concentrations used in this study were lower than those in FD&C lake pigments. Therefore, the Pt-M3+ could be a potential method to decrease metal usage in food pigments in neutral and alkaline pH.
Table 2.
Color changes (ΔE*ab) of the petunidin derivatives with increased metal ion concentration in alkaline conditions (pH 7–9) after 60 minutes of equilibration. Data are presented as the mean and standard deviations (in parentheses).
At pH 3–6, however, Pt-Al3+ and Pt-Fe3+ ([M3+] was up to 1500 μM) seemed to have limited impact on Pt colorimetric properties, as the ΔE*ab were all smaller than 5 (data not shown). In addition, the color of petunidin derivatives faded quickly at pH 10. Therefore, our following analysis focused on the Pt-M3+ at pH 7–9.
3.4. Spectrophotometric Properties of Petunidin Derivatives Chelated with Metals
The visible absorbance spectra, λmax, and absorbance at the λmax of Pt-M3+, are shown in Figure 2 and Figure 4. Generally, bathochromic and hyperchromic shifts were perceived for Pt-M3+ at pH 7–9, similar to the findings in previous studies on cyanidin or delphinidin–M3+ chelates at acidic pHs [8,15,17,35]. Pt-M3+ chelation was greatly influenced by pH and metal ion source.
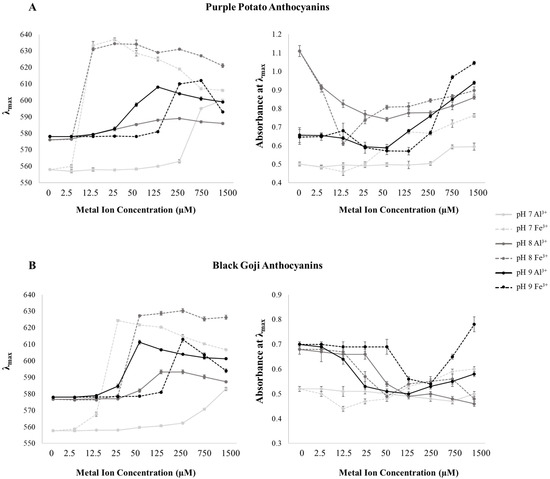
Figure 4.
Quantification of spectrophotometric changes in purple potato (A) and black goji (B) anthocyanin metal chelates. Data were collected 1 hr after the anthocyanins were mixed with metal ions and pH adjustment with the buffers.
The addition of Al3+ to purple potato petunidin derivatives introduced the most pronounced bathochromic shift (Δλmax = 42 nm) at pH 7 and the maximum hyperchromic response (ΔA = 0.282) at pH 9, while Fe3+ chelates experienced their maximum shifts in larger magnitudes (Δλmax = 79 nm and ΔA = 0.399, respectively) at the same pH as that of Al3+ (Figure 4). Black goji petunidin derivatives exerted the maximum bathochromic shifts with Al3+ (Δλmax = 33 nm) and Fe3+ (Δλmax = 66 nm) at pH 9 and 7, respectively (Figure 4). Additionally, in purple potato extracts, the largest λmax and absorbance achieved by Pt-Al3+ were 609 nm and 0.939 at pH 9, respectively; and Pt-Fe3+ reached its maximum λmax (637 nm) and absorbance (1.046) at pH 7 and pH 9, respectively. In black goji extracts, the maximum λmax of Pt-M3+ was 611 nm (Pt-Al3+) and 630 nm (Pt-Fe3+). Overall, Pt-Fe3+ showed higher bathochromic and hyperchromic responses than Pt-Al3+, similar to previous reported results for cyanidin-M3+ [8]. It was proposed by Sigurdson et al. (2016) that the outer electrons of Fe3+ appeared to be in a high spin configuration (with one electron in each 5d orbital), resulting in an enhanced overlapping with anthocyanin and a stronger association. This unique electron arrangement was expected to be responsible for the pronounced shifts in visible spectra. Thus, Fe3+ in a lower concentration was able to produce a large bathochromic response.
The [M3+] that resulted in maximum λmax and absorbance at each pH level was closely related to the M3+ source. In purple potato extracts, the largest λmax of Pt-Al3+ was accomplished when [Al3+] equaled 1500 μM, 250 μM, and 125 μM at pH 7, 8, and 9, respectively; while it was 25 μM, 50 μM, and 750 μM in Pt-Fe3+ at these same pH levels (Figure 4). Similar trends could be found in black goji extracts (Figure 4). Actually, the [Al3+] that produced the maximum λmax dropped as pH increased, aligning with the idea that M3+ acts in competition with H+ for B-ring attachment in anthocyanins [34]. However, the level of [Fe3+] that produced the largest λmax increased when pH increased, which might be explained by the aggregation and precipitation of anthocyanin pigment triggered by the addition of Fe3+, as well as the poor stability of Fe3+ at an alkaline pH [8,16,18,35].
Another interesting phenomenon was that when [M3+] increased, we observed a hypsochromic effect after the bathochromic effect, indicating an apparent saturation at the turning point (Figure 4). However, this apparent saturation was not found in Pt-Al3+ at pH 7, which could suggest that the concentration of [Al3+] tested in this study was not high enough to reach saturation. Similarly, the hypochromic response appeared before the hyperchromic effect and the turning point in λmax corresponded to that in absorbance (Figure 4).
Fe3+ in high concentrations expressed yellow colors in aqueous systems, documented by the higher absorbance in the spectral region of 380-450 nm. Similarly, Pt-Fe3+ gradually developed higher absorbance in a [Fe3+] dose-dependent manner in this region at pH 7–9 (Figure 2 and Figure 4). A combination of the blue color from petunidin derivatives and the bluing effect introduced by metal chelation with the yellow hues of Fe3+ resulted in a greenish blue color (Figure 3) despite the high absorbance around 610 nm (more typical of blue hues).
3.5. Impact of Metal Chelation on the Stability of Petunidin Derivatives
Pt-M3+ was stored in a dark refrigerated condition for 28 days. The color changes expressed as total color change (ΔE*ab) are shown in Figure 5 and Figure 6. Pt-M3+ generally exhibited enhanced color stability in a [M3+] dose-dependent manner. Higher [Al3+] produced bluer hues that were significantly better retained over time for ~7 days at all pH values tested (pH 7–9), while petunidin derivatives without metal chelation started losing color rapidly, with the blue color only formed at pH 9 and gone in less than 1 day. Interestingly, brown hues steadily formed in higher [Fe3+] chelates after mixing with petunidin derivatives and were more severe at pH 9. Fe3+ is known for its reductive–oxidative capabilities, and has been reported to catalyze the oxidative degradation of flavonoids [37]. Fenger et al. reported that anthocyanin caffeoyl residue autoxidation is initiated by Fe2+, forming electrophilic/oxidizing o-quinones at a neutral pH [16]. They also showed that free caffeoylquinic acids could facilitate the anthocyanin degradation. Although there were no caffeoyl residues in the petunidin derivatives in this study, the surrounding free caffeoylquinic acids in the extracts were expected to promote the autoxidation. Therefore, the brown color could have developed due to the degradation of anthocyanin, especially in the alkaline pH range. In addition, Fe3+ in large concentrations expressed yellow-brown colors, which could mask the blue color produced by purple potato anthocyanins, exhibiting green hues. However, when the blue color vanished, the yellow hues would dominate the mixture, which would also partially explain the browning phenomenon.
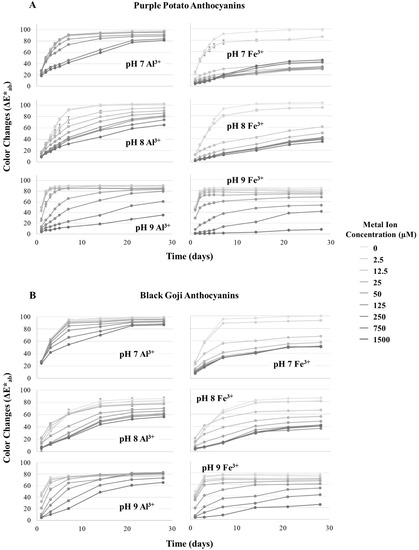
Figure 5.
Color changes (ΔE*ab) of purple potato (A) and black goji (B) anthocyanin metal chelates at pH 7–9 over 28 days. Samples were stored under refrigerated conditions in the dark.
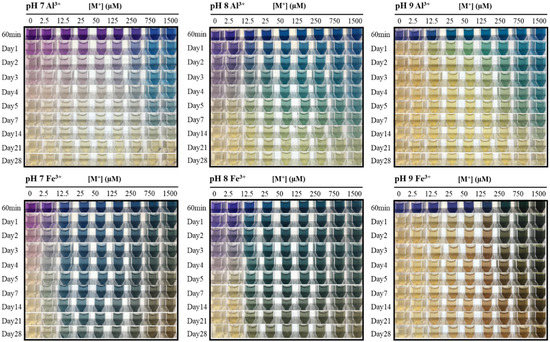
Figure 6.
Color stability of purple potato anthocyanin metal chelates at pH 7–9 over 28 days. Samples were stored under refrigerated conditions in the dark.
The half-lives (h) of the pigments and their metal chelates at pH 7–9 were calculated and are presented in Table S1. Similar to ΔE*ab, metal ions increased the pigment half-life in a dose-dependent manner over time, particularly at pH 8 (144 h in [Al3+] = 1500 μM and 98.5 h in [Fe3+] = 50 μM). Because of its reductive–oxidative capabilities, excessive Fe3+ started to reduce the half-life of Pt-Fe3+ chelates at pH 7–9.
Among the pH values (pH 7–9) in the stability study, petunidin derivatives and their metal chelates displayed the highest color stability at pH 8. At this pH, a lower concentration of M3+ still showed a promising stabilization capability. At neutral and alkaline pH, anthocyanin is supposed to exist predominantly in quinoidal base forms, and would take on increasingly negative charges with further increases in pH [38]. This process could be determined by pKa2 and pKa3, the disassociation constant for the transition from the quinoidal base configuration to that with one negative charge, and the transformation from one negative charge to two negative charges. A previous study reported that the pKa2 and pKa3 of petunidin aglycone were 6.99 and 8.27, respectively [39]. Although the true pKa for petunidin-3-rutinoside-(p-coumaroyl)-5-glucose would be different, it is reasonable to postulate that the purple potato anthocyanin carries negative charges at pH 8 and thus is more stable, compared to other close neutral and alkaline pHs.
Overall, metal ions helped to stabilize petunidin derivatives in a dose-dependent manner, and significantly slowed down the escalation of ΔE*ab and increased the pigments half-life, though this stabilization effect is dependent on the metal source and pH. Fe3+ in high concentrations, because of its oxidative capability, accelerated the color degradation and promoted the browning effect.
4. Conclusions
Purple potato and black goji extracts contained abundant petunidin derivatives, with petunidin-3-(trans-p-coumaroyl)-rutinoside-5-glucoside as the predominant pigment. The extracts displayed vivid red, purple, violet-blue colors from acidic, neutral, to alkaline pH, respectively. In the presence of metal ions, Al3+ and Fe3+, the petunidin derivatives experienced bathochromic (up to 79 nm) and hyperchromic shifts (increased up to 0.399 in absorbance at λmax), resulting in various blue to green hues and intensified colors in neutral and alkaline conditions. The magnitudes of the metal chelation effect were dependent on metal ions, pH, and M3+ concentration. Fe3+, with a higher spin configuration in the outer electrons, triggered further bathochromic shifts than Al3+, and its unique yellow color in the aqueous system led to green hues when combined with petunidin derivatives’ blue colors. The oxidative capability of Fe3+ towards flavonoids limited its application in larger concentrations (>125 μM). Al3+, in low concentrations (~12.5 μM), was able to chelate Pt and produce blue colors at pH 8 and 9. The concentration of Al3+ needed for blue color production decreased upon the increase in pH. The chelation of metal ions significantly enhanced the color stability of petunidin derivatives in neutral and alkaline conditions.
This study demonstrated that petunidin derivatives could chelate with metal ions, Al3+ and Fe3+, in neutral and alkaline pH, resulting in enhanced color and stabilities. Purple potato and black goji, containing abundant petunidin derivatives, are promising sources for natural colorants over a wide range of pH. Chelated with metals, these pigments could provide the food industry with various vivid violet, blue, and green colors with enhanced stability. They could be potentially applied in food products with neutral or slightly higher pH, such as milk, milkshakes, ice cream, and creamers. This is important to the food industry, as the elucidation of the anthocyanin–metal interaction can bring innovative technologies to obtain a wide range of vivid colors from natural sources, fulfilling the current clean label trend.
Supplementary Materials
The following are available online at https://www.mdpi.com/2304-8158/9/10/1426/s1, Table S1: Half-lives (hr) of purple potato petunidin derivatives chelated with Al3+ and Fe3+ ions at pH 7–9.
Author Contributions
Conceptualization, P.T. and M.M.G.; methodology, P.T. and M.M.G.; software, P.T. and M.M.G.; validation, P.T. and M.M.G.; formal analysis, P.T. and M.M.G.; investigation, P.T. and M.M.G.; resources, P.T. and M.M.G.; data curation, P.T. and M.M.G.; writing—original draft preparation, P.T. and M.M.G.; writing—review and editing, P.T. and M.M.G.; visualization, P.T. and M.M.G.; supervision, M.M.G.; project administration, M.M.G.; funding acquisition, M.M.G. All authors have read and agreed to the published version of the manuscript.
Funding
This work was funded in part by the USDA National Institute of Food and Agriculture, Hatch Project OHO01423, Accession Number 1014136.
Conflicts of Interest
The authors declare no conflict of interest.
References
- He, J.; Giusti, M.M. Anthocyanins: Natural Colorants with Health-Promoting Properties. Annu. Rev. Food Sci. Technol. 2010, 1, 163–187. [Google Scholar] [CrossRef] [PubMed]
- Brouillard, R.; Dubois, J.E. Mechanism of the Structural Transformations of Anthocyanins in Acidic Media. J. Am. Chem. Soc. 1977, 99, 1359–1364. [Google Scholar] [CrossRef]
- Tang, P.; Giusti, M.M. Black Goji (Lycium ruthenicum Murr.) PolyphenolsPotent Antioxidants and Natural Colorants. In Phytochemicals in Goji Berries; CRC Press: Boca Raton, FL, USA, 2020; pp. 109–134. [Google Scholar]
- Sharma, V.; McKone, H.T.; Markow, P.G. A Global Perspective on the History, Use, and Identification of Synthetic Food Dyes. J. Chem. Educ. 2010, 88, 24–28. [Google Scholar] [CrossRef]
- Sigurdson, G.T.; Tang, P.; Giusti, M.M. Natural Colorants: Food Colorants from Natural Sources. Annu. Rev. Food Sci. Technol. 2017, 8, 261–280. [Google Scholar] [CrossRef] [PubMed]
- Cavalcanti, R.N.; Santos, D.T.; Meireles, M.A.A. Non-thermal stabilization mechanisms of anthocyanins in model and food systems—An overview. Food Res. Int. 2011, 44, 499–509. [Google Scholar] [CrossRef]
- Cortez, R.; Luna-Vital, D.A.; Margulis, D.; Gonzalez de Mejia, E. Natural Pigments: Stabilization Methods of Anthocyanins for Food Applications. Compr. Rev. Food Sci. Food Saf. 2017, 16, 180–198. [Google Scholar] [CrossRef]
- Sigurdson, G.T.; Robbins, R.J.; Collins, T.M.; Giusti, M.M. Evaluating the role of metal ions in the bathochromic and hyperchromic responses of cyanidin derivatives in acidic and alkaline pH. Food Chem. 2016, 208, 26–34. [Google Scholar] [CrossRef]
- Yoshida, K.; Kitahara, S.; Ito, D.; Kondo, T. Ferric ions involved in the flower color development of the Himalayan blue poppy, Meconopsis grandis. Phytochemistry 2006, 67, 992–998. [Google Scholar] [CrossRef]
- Yoshida, K.; Mori, M.; Kondo, T. Blue flower color development by anthocyanins: From chemical structure to cell physiology. Nat. Prod. Rep. 2009, 26, 884–915. [Google Scholar] [CrossRef]
- Schreiber, H.D.; Swink, A.M.; Godsey, T.D. The chemical mechanism for Al3+ complexing with delphinidin: A model for the bluing of Hydrangea sepals. J. Inorg. Biochem. 2010, 104, 732–739. [Google Scholar] [CrossRef]
- Tachibana, N.; Kimura, Y.; Ohno, T. Examination of molecular mechanism for the enhanced thermal stability of anthocyanins by metal cations and polysaccharides. Food Chem. 2014, 143, 452–458. [Google Scholar] [CrossRef] [PubMed]
- Pyysalo, H.; Kuusi, T. The role of iron and tin in discoloration of berry and red beet juices. Z. Lebensm. Unters. Forch. 1973, 153, 224–233. [Google Scholar] [CrossRef]
- Sigurdson, G.T.; Giusti, M.M. Bathochromic and hyperchromic effects of aluminum salt complexation by anthocyanins from edible sources for blue color development. J. Agric. Food Chem. 2014, 62, 6955–6965. [Google Scholar] [CrossRef] [PubMed]
- Sigurdson, G.T.; Robbins, R.J.; Collins, T.M.; Giusti, M.M. Effects of hydroxycinnamic acids on blue color expression of cyanidin derivatives and their metal chelates. Food Chem. 2017, 234, 131–138. [Google Scholar] [CrossRef]
- Fenger, J.-A.; Roux, H.; Robbins, R.J.; Collins, T.M.; Dangles, O. The influence of phenolic acyl groups on the color of purple sweet potato anthocyanins and their metal complexes. Dye. Pigment. 2020, 108792. [Google Scholar]
- Wrolstad, R.E.; Erlandson, J.A. Effect of metal ions on the color of strawberry puree. J. Food Sci. 1973, 38, 460–463. [Google Scholar] [CrossRef]
- Buchweitz, M.; Carle, R.; Kammerer, D.R. Bathochromic and stabilising effects of sugar beet pectin and an isolated pectic fraction on anthocyanins exhibiting pyrogallol and catechol moieties. Food Chem. 2012, 135, 3010–3019. [Google Scholar] [CrossRef]
- Sigurdson, G.T.; Robbins, R.J.; Collins, T.M.; Giusti, M.M. Spectral and colorimetric characteristics of metal chelates of acylated cyanidin derivatives. Food Chem. 2017, 221, 1088–1095. [Google Scholar] [CrossRef]
- Giusti, M.M.; Polit, M.F.; Ayvaz, H.; Tay, D.; Manrique, I. Characterization and quantitation of anthocyanins and other phenolics in native andean potatoes. J. Agric. Food Chem. 2014, 62, 4408–4416. [Google Scholar] [CrossRef]
- Shiroma-Kian, C.; Tay, D.; Manrique, I.; Giusti, M.M.; Rodriguez-Saona, L.E. Improving the screening process for the selection of potato breeding lines with enhanced polyphenolics content. J. Agric. Food Chem. 2008, 56, 9835–9842. [Google Scholar] [CrossRef]
- Lachman, J.; Hamouz, K.; Orsák, M.; Pivec, V.; Dvořák, P. The influence of flesh colour and growing locality on polyphenolic content and antioxidant activity in potatoes. Sci. Hortic. 2008, 117, 109–114. [Google Scholar] [CrossRef]
- Zheng, J.; Ding, C.; Wang, L.; Li, G.; Shi, J.; Li, H.; Wang, H.; Suo, Y. Anthocyanins composition and antioxidant activity of wild Lycium ruthenicum Murr. from Qinghai-Tibet Plateau. Food Chem. 2011, 126, 859–865. [Google Scholar] [CrossRef]
- Tang, P.; Giusti, M.M. Black goji as a potential source of natural color in a wide pH range. Food Chem. 2018, 269, 419–426. [Google Scholar] [CrossRef] [PubMed]
- Sigurdson, G.T.; Tang, P.; Giusti, M.M. Cis-trans configuration of coumaric acid acylation affects the spectral and colorimetric properties of anthocyanins. Molecules 2018, 23. [Google Scholar] [CrossRef]
- Rodriguez-Saona, L.E.; Wrolstad, R.E. Extraction, Isolation, and Purification of Anthocyanin. Curr. Protoc. Food Anal. Chem. 2001, F1.1.1–F1.1.11. [Google Scholar] [CrossRef]
- Mónica Giusti, M.; Wrolstad, R.E. Characterization and Measurement of Anthocyanins by UV-visible Spectroscopy. In Handbook of Food Analytical Chemistry; Wiley: Hoboken, NJ, USA, 2005; Volume 2, pp. 19–31. ISBN 9780471709084. [Google Scholar]
- Dawson, R.M.C.; Elliott, D.C.; Elliott, W.H.; Jones, K.M. Data for Biochemical Research; Oxford Science Publications: Oxford, UK, 1986. [Google Scholar]
- Stushnoff, C.; Holm, D.; Thompson, M.D.; Jiang, W.; Thompson, H.J.; Joyce, N.I.; Wilson, P. Antioxidant properties of cultivars and selections from the Colorado potato breeding program. In Proceedings of the American Journal of Potato Research; The Potato Association of America: Washington, DC, USA, 2008; Volume 85, pp. 267–276. [Google Scholar]
- Nayak, B.; Berrios, J.D.J.; Powers, J.R.; Tang, J. Thermal degradation of anthocyanins from purple potato (Cv. Purple Majesty) and impact on antioxidant capacity. J. Agric. Food Chem. 2011, 59, 11040–11049. [Google Scholar] [CrossRef]
- Wu, T.; Lv, H.; Wang, F.; Wang, Y. Characterization of Polyphenols from Lycium ruthenicum Fruit by UPLC-Q-TOF/MSE and Their Antioxidant Activity in Caco-2 Cells. J. Agric. Food Chem. 2016. [Google Scholar] [CrossRef]
- Zhang, G.; Chen, S.; Zhou, W.; Meng, J.; Deng, K.; Zhou, H.; Hu, N.; Suo, Y. Rapid qualitative and quantitative analyses of eighteen phenolic compounds from Lycium ruthenicum Murray by UPLC-Q-Orbitrap MS and their antioxidant activity. Food Chem. 2018. [Google Scholar] [CrossRef]
- Brouillard, R.; Delaporte, B.; Dubois, J.E. Chemistry of Anthocyanin Pigments. 3.1 Relaxation Amplitudes in pH-Jump Experiments. J. Am. Chem. Soc. 1978, 100, 6202–6205. [Google Scholar] [CrossRef]
- Dangles, O.; Elhabiri, M.; Brouillard, R. Kinetic and Thermodynamic Investigation of the Aluminium-Anthocyanin Complexation in Aqueous Solution. J. Chem. Soc. Perkin Trans. 2 1994, 2587–2596. [Google Scholar] [CrossRef]
- Buchweitz, M.; Brauch, J.; Carle, R.; Kammerer, D.R. Application of ferric anthocyanin chelates as natural blue food colorants in polysaccharide and gelatin based gels. Food Res. Int. 2013, 51, 274–282. [Google Scholar] [CrossRef]
- Becaria, A.; Campbell, A.; Bondy, S.C. Aluminum as a toxicant. Toxicol. Ind. Health 2002, 18, 309–320. [Google Scholar] [CrossRef] [PubMed]
- Makris, D.P.; Rossiter, J.T. Heat-induced, metal-catalyzed oxidative degradation of quercetin and rutin (quercetin 3-O-rhamnosylglucoside) in aqueous model systems. J. Agric. Food Chem. 2000, 48, 3830–3838. [Google Scholar] [CrossRef] [PubMed]
- Brouillard, R.; Delaporte, B. Chemistry of Anthocyanin Pigments. 2.1 Kinetic and Thermodynamic Study of Proton Transfer, Hydration, and Tautomeric Reactions of Malvidin 3-Glucoside. J. Am. Chem. Soc. 1977, 99, 8461–8468. [Google Scholar] [CrossRef]
- León-Carmona, J.R.; Galano, A.; Alvarez-Idaboy, J.R. Deprotonation routes of anthocyanidins in aqueous solution, pKa values, and speciation under physiological conditions. RSC Adv. 2016, 6, 53421–53429. [Google Scholar] [CrossRef]
© 2020 by the authors. Licensee MDPI, Basel, Switzerland. This article is an open access article distributed under the terms and conditions of the Creative Commons Attribution (CC BY) license (http://creativecommons.org/licenses/by/4.0/).