Article

Bud-Derivatives, a Novel Source of Polyphenols and How Different Extraction Processes Affect Their Composition

1
Department of Pharmacy, University of Genoa, Viale Cembrano 4, 16148 Genoa, Italy
2
Department of Agriculture, Forestry and Food Science, University of Torino, Largo Braccini 2, 10095 Grugliasco (TO), Italy
*
Author to whom correspondence should be addressed.
Foods 2020, 9(10), 1343; https://doi.org/10.3390/foods9101343
Submission received: 10 September 2020 / Revised: 18 September 2020 / Accepted: 20 September 2020 / Published: 23 September 2020
(This article belongs to the Special Issue The Benefits of Plant Extracts for Human Health)

Abstract

:
The use of herbal food supplements, as a concentrate form of vegetable extracts, increased so much over the past years to count them among the relevant sources of dietetic polyphenols. Bud-derivatives are a category of botanicals perceived as a “new entry” in this sector since they are still poorly studied. Due to the lack of a manufacturing process specification, very different products can be found on the market in terms of their polyphenolic profile depending on the experimental conditions of manufacturing. In this research two different manufacturing processes, using two different protocols, and eight species (Carpinus betulus L., Cornus mas L., Ficus carica L., Fraxinus excelsior L., Larix decidua Mill., Pinus montana Mill., Quercus petraea (Matt.) Liebl., Tilia tomentosa Moench), commonly used to produce bud-derivatives, have been considered as a case study. An untargeted spectroscopic fingerprint of the extracts, coupled to chemometrics, provide to be a useful tool to identify these botanicals. The targeted phytochemical fingerprint by HPLC provided a screening of the main bud-derivatives polyphenolic classes highlighting a high variability depending on both method and protocol used. Nevertheless, ultrasonic extraction proved to be less sensitive to the different extraction protocols than conventional maceration regarding the extract polyphenolic profile.

Graphical Abstract

1. Introduction

In recent decades, food supplements have an important impact on the consumers showing a significant expectation for their health and well-being [1]. They are concentrated sources of nutrients or bioactive compounds endowed with nutritional or physiological effects and, due to their presumed health benefits, they can supplement the common diet [2,3].
In particular, the interest in herbal food supplements (botanicals) is exponentially grown and consequently the relative market has increased in all the world [4]. Botanicals are become among the most popular into the food supplements category, due to the general belief which “natural” is better, healthier and safer than synthetic drugs, although this is not always true [4]. In Italy, more than 20% of the Italian population is considered “regular” consumer of these herbal products, as highlighted from the recent European PlantLibra (Plant Food Supplements: Levels of Intake, Benefit and Risk Assessment) consumer survey [5]. The wide range of herbal food supplements on the market and the non-attendance of effective legislation to guarantee the safety and quality aspects make these products vulnerable for fraud, falsification and adulteration [6,7].
Bud-derivatives (BDs) are a relatively new category of herbal food supplements and they represent one of the supply chains investigated in the FINNOVER project (Innovative strategies for the development of cross-border green supply chains), an European Interreg Alcotra Italy/France project (2017–2020) whose aim is the green innovation of several agro-industrial chains [8]. BDs are conventionally produced, according to the European Pharmacopoeia VIII edition [9], by cold maceration of the fresh meristematic tissues of trees and herbaceous plants (i.e., buds and young sprouts) using as extraction solvent mixtures of water, ethanol and glycerol [10,11]. These natural products are already marketed, and a long history of use as dietary supplements for human well-being and health is reported in traditional medicine. No health claims are yet approved by the European Food Safety Authority (EFSA) and just for some of these botanicals pharmacognostic findings supported their use as adjuvants in several diseases. In fact, some in-vitro/in-vivo biological studies for human and veterinary use have been already reported in the literature. For examples, Allio et al. (2015) investigated whether Tilia tomentosa bud extracts affect hippocampal Gamma-aminobutyric acid (GABA) ergic synapses [12]. In other studies, bud extracts from Salix caprea L. have been demonstrated to inhibit voltage gated calcium channels and catecholamines secretion in mouse chromaffin cells [13]. Moreover, different patents have also been registered on the veterinary use of bud-extracts (e.g., Composition of Salix caprea bud-extract and its use in the treatment of animal endometritis, patent n. TO2015A000193) [14] and several studies are carried out on several bud-derivative biological effects [15,16,17].
Although gemmotherapy has been used since ancient times because of the peculiar content of buds in bio-active compounds, especially polyphenols, nowadays BDs are still a little studied “niche” production [18,19]. The lack of detailed scientific information and a clear and unique regulation, as well as for the category of herbal food supplements in overall [6,7,20], it makes these products high risk and there is an increase request for efficient quality control to ensure the proper identification of the botanical source and their content [21].
With regards to BDs, a first problem it is accidentally confusing the raw material: fresh buds must be collected, generally from spontaneous grown, in a very limited period in the late winter and/or in the early spring, corresponding to the annual germination of the plant [18]. During this period, plants may not show their distinctive characteristics and sometimes the attribution of the botanical species may be difficult for the collector. A second problem concerns the manufacturing process and the extraction protocols whose parameters are not strictly defined, and production rules are often loose and deficient [22,23,24].
Polyphenols play key roles in plant development processes and their synthesis increases when plants are under conditions of abiotic stress, thus helping the plant to cope with environmental constraints [25]. They form an integral part of the human diet and they are very abundant in plant-based foods, such as fruits and vegetables, tea, wine, and coffee [26]. Their chemical structure is based on at least one aromatic ring with one or more hydroxyl groups, which explains their known antioxidant and anti-inflammatory properties [27].
In recent years, many health benefits of dietetic polyphenol supplementation have been described in humans i.e., against aging and cardiovascular disease [28,29], to prevent obesity and diabetes [30,31], to modulate human gut microbiota [32] and to improve the brain cognition skills [33,34]. This knowledge guides the choice of consumers not only towards plant foods but also towards herbal food supplements, whose polyphenol content is often even more concentrated and responsible for their bioactivity [12,13]. Nevertheless, polyphenols content is strongly influenced by the manufacturing methods whose parameters are often not strictly defined (e.g., solvent ratios in the extraction mixtures, raw material/extraction mixture ratios, extraction time) and thus they could affect the final compositions [35].
In previous articles, the polyphenolic pattern of some BDs prepared starting from different botanical species have been studied [10,11,21,36].
In this research, eight species spontaneously grown and commonly used to produce BDs, i.e., Carpinus betulus L., Cornus mas L., Ficus carica L., Fraxinus excelsior L., Larix decidua Mill., Pinus montana Mill., Quercus petraea (Matt.) Liebl., Tilia tomentosa Moench, have been taken into account as case study. Two different manufacturing methods, one conventional (maceration) and one innovative (direct sonication), as well as two different extraction protocols have been taken into account and the corresponding polyphenolic extracts’ profiles have been investigated.
Pulsed Ultrasound-Assisted Extraction (PUAE), according to the six principles of the green extraction [37] and the twelve principles of green chemistry [38], has been employed as an innovative technique to quickly produce BDs comparing to the long conventional maceration [39]. Even if, the positive impacts of the ultrasound-assisted extraction, i.e., reduction of the extraction time, diminution of solvent and energy used, improvement in yield and selectivity, high reproducibility, intensification of diffusion and eliminating wastes, are known in the scientific literature [40,41,42], this technique is still underused in this sector.
Moreover, two different BDs manufacturing protocols, which used different extraction mixture of solvents and different solid/liquid ratio, have also been studied to evaluate both the proper identification of the botanical species and the traceability of these vegetal products regardless of extraction method and experimental conditions.
A strategy based on the untargeted UV-Visible fingerprinting coupled to chemometrics (Principal Component Analysis—PCA) has been proposed for the screening of the polyphenolic BDs profile in order to obtain a rapid control tool [43]. Finally, HPLC methods were used to obtain a targeted chromatographic profile [7,44] of the main polyphenol classes (i.e., flavonols, benzoic acids, catechins, cinnamic acids). Polyphenols are correlated with their potential health-promoting activity [45], even if they are strongly influenced both by the methods and protocols used [35].

2. Materials and Methods

2.1. Raw Samples

Buds, belonging to eight different vegetable species (Carpinus betulus L., Cornus mas L., Ficus carica L., Fraxinus excelsior L., Larix decidua Mill., Pinus montana Mill., Quercus petraea (Matt.) Liebl., Tilia tomentosa Moench) were collected from plants spontaneously grown in the Turin Province (Italy) and were immediately authenticated by an agronomist. Sampling has been performed in two years (2018–2019), from February to April, during the bud break (“balsamic period”).
Table 1 reports the geo-localization coordinates of the different collection sites and the scientific naturalistic illustrations (specifically achieved during the Finnover project) of all the eight vegetable species investigated.

2.2. Chemicals

MilliQ ultrapure water, obtained by means of a Millipore equipment (Bedford, MA, USA) was used throughout. All chemicals employed for the extract preparations and for the subsequent analysis were HPLC-grade. They were supplied by VWR International S.r.l (Milan, Italy) and Sigma-Aldrich (St. Louis, MO, USA). Purity of all the used standards for HPLC analysis of BDs has been reported in the Supplementary Materials (Table S1).

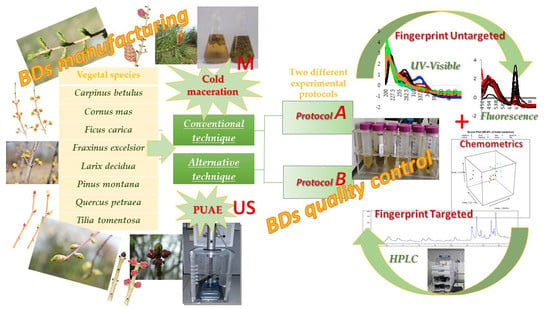
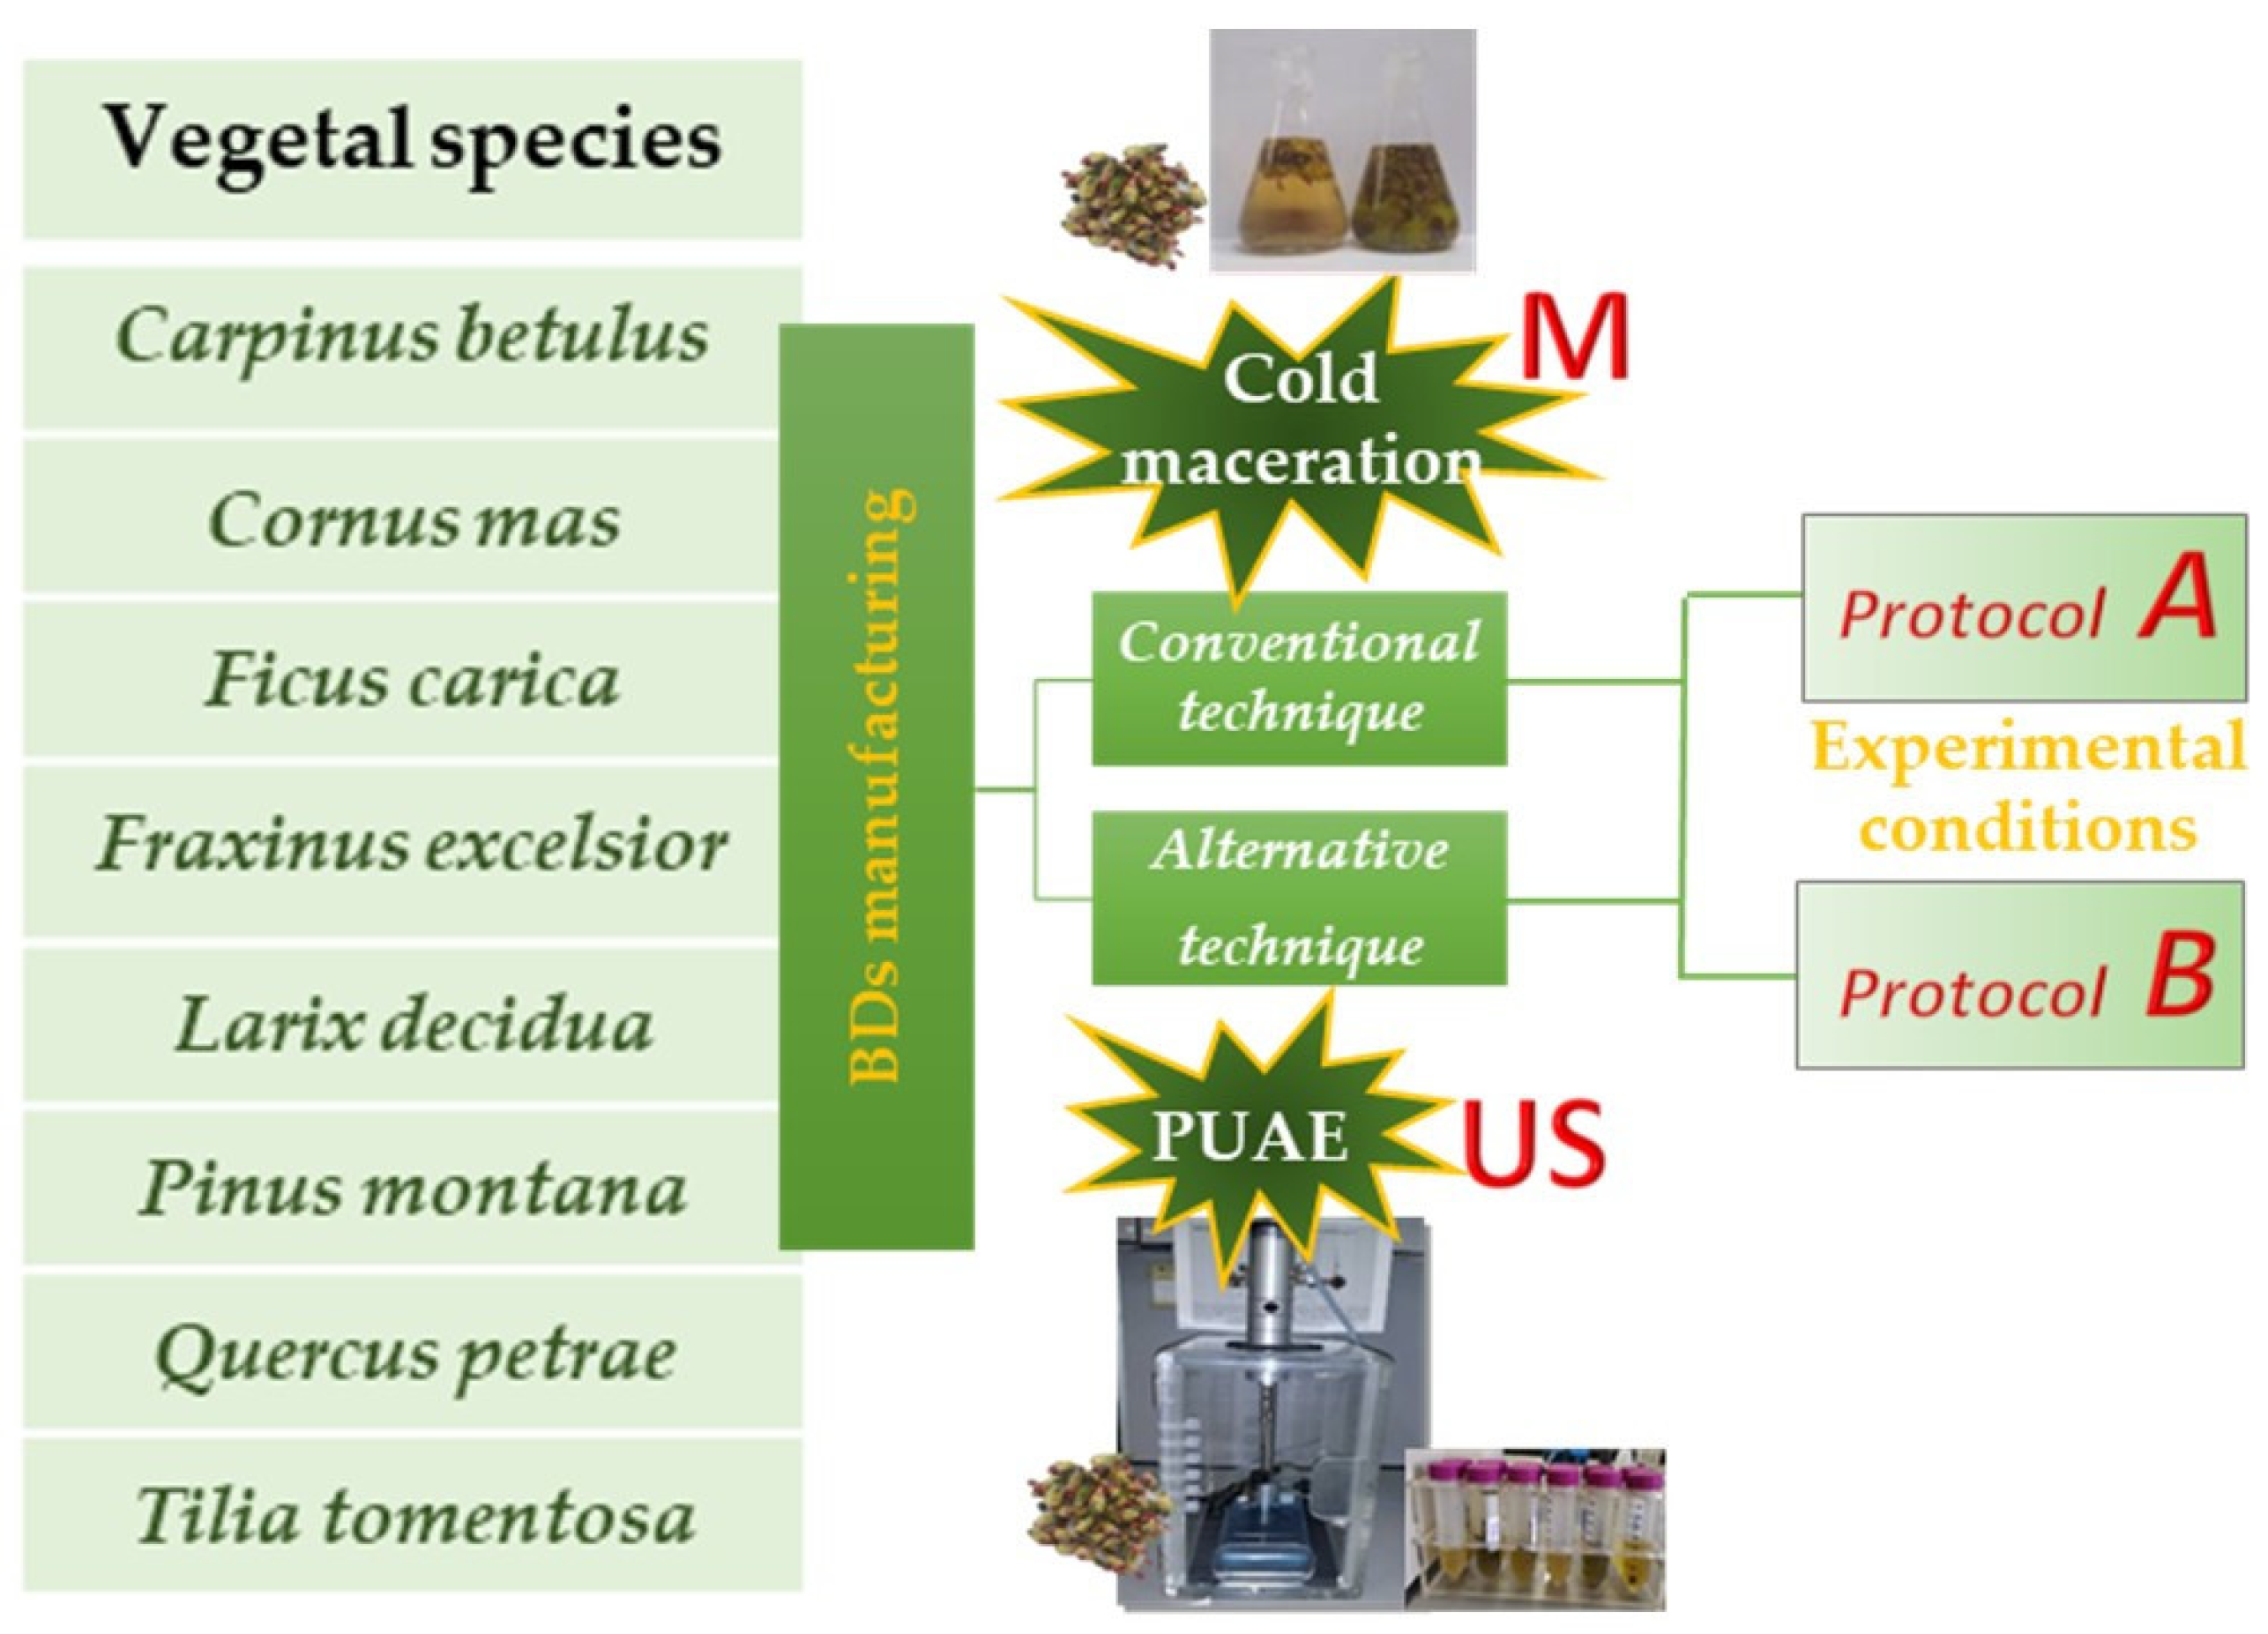
2.3. Bud-Derivatives Manufacturing Applying Two Different Methods

Fresh buds, after their collection, were immediately processed to prepare the corresponding BDs in order to minimize any degradation preserving the peculiar phytocomplex as much undamaged as possible. The manufacturing was performed both in an Italian company (Geal Pharma Turin, Italy) and by the Authors in the analytical laboratory of the University of Genoa (Department of Pharmacy).
The following two different preparation methods of BDs were investigated: the conventional cold Maceration (M) [9], and a more rapid and innovative procedure by Ultrasounds (US) recently described by the Authors [11]. Moreover, for both preparation methods two different extraction solvents and different sample/solvent ratios were investigated too (“Protocol A” and “Protocol B”, see Figure 1), in order to evaluate both the proper identification of the botanical species and the traceability of the BDs independently from their manufacturing process (Table 2). Each extraction was performed in duplicate.

2.3.1. Conventional Cold Maceration (M) as Traditional Method

BDs were prepared using a cold maceration by an Italian Company of botanicals (Geal Pharma, Bricherasio, Turin) following two different experimental manufacturing protocols, reported in Table 2:
(A)
A 21 days maceration of buds in glycerol/ethanol 96% (1/1 w/w) with a 1:20 bud/solvent ratio (considering the dry weight) has been performed, according to the official method of glyceric macerates reported in the European Pharmacopoeia VIII edition [9] (“M_A”).
(B)
A 3 months maceration of buds in a mixture of water/glycerol/ethanol 96% (50/20/30 w/w/w) as extraction solvent with a bud/solvent ratio variable (considering the fresh weight) depending on the botanical species (see Table 2) has been used, according to the method optimized and used by the Company to produce glyceric macerates (“M_B”).
In both methods, after the maceration step, the extracts, namely BDs, have been obtained by a preliminary filtration, a manual pressing and a second filtration after two days of decanting. The so obtained BDs were stored at 4 °C in the dark until their further analysis.

2.3.2. Green Extraction: Pulsed Ultrasound-Assisted Extraction (US) as Alternative Method

Fresh buds were finely ground by a Grindomix 200 M (Retsch, Haan, Germany) for 20 s at 5000 rpm, and then sieved by a 150 µm sieve, in order to improve the efficiency of the following extraction step [46]. PUAE was performed directly by an Hielscher UP200St sonicator (Teltow, Germany) equipped with an ultrasonic titanium sonotrode (7 mm of diameter), at a constant frequency of 26 kHz. The pulsed mode, referring to an alternation of “on” time and “off” time of the sonicator, guarantees a lowering increase in temperature, which better preserve the phytocomplex, and greater energy savings compared to continuous treatments [47]. The experimental sonication conditions (amplitude 30%, duty cycle 65%, extraction time 20 min) were previously optimized by the Authors on the same raw materials [11].
The same two experimental extraction conditions described in the paragraph 2.3.1 (“Protocol A” and “Protocol B”, see Figure 1) were employed (“US_A” and “US_B”, see Table 2). The extracts obtained were filtered for Buchner (Whatman n. 1 paper), centrifuged at 3000 rpm for 10 min and then stored at 4 °C in the dark until analysis.

2.4. Spectroscopic Analysis: UV-Visible Fingerprint

UV–Visible absorption spectra (200 nm–900 nm) were recorded by a spectrophotometer Agilent Cary 100 (Varian Co., Santa Clara, CO, USA) with 0.5 nm resolution, using rectangular quartz cuvettes with 1 cm path length. BDs, before the spectroscopic analysis, were suitably diluted in the corresponding extraction solvent (glycerol/ethanol 1/1 w/w or water/glycerol/ethanol 50/20/30 w/w/w) depending on the followed experimental protocol (“Protocol A” and “Protocol B”, respectively). Dilution was necessary to avoid signal saturation but was subsequently considered in order to make a comparison between the different spectra achieved. BDs spectra were acquired in duplicate and then averaged. The collection was performed at room temperature (25 ± 1 °C), against a blank solution represented by the corresponding extraction solvent.

2.5. HPLC Analysis

In this study, effective HPLC–DAD methods were used for fingerprint analysis and phytochemical identification of samples. Four polyphenolic classes were considered: benzoic acids (ellagic and gallic acids), catechins ((+)catechin and (-)epicatechin), cinnamic acids (caffeic, chlorogenic, coumaric, and ferulic acids), and flavonols (hyperoside, isoquercitrin, quercetin, quercitrin, and rutin). Total bioactive compound content (TBCC) was determined as the sum of the most important bioactive compounds with positive effects on human organism (“multimarker approach”) [48].
The external standard method was used for quantitative determination of bioactive compounds. Stock solutions of cinnamic acids and flavonols with a concentration of 1.0 mg·mL−1 were prepared in methanol: five calibration standards were prepared by dilution with methanol; stock solutions of benzoic acids and catechins with a concentration of 1.0 mg·mL−1 were prepared in 95% methanol and 5% water. In this case, five calibration standards were prepared by dilution with 50% methanol–water.
An Agilent 1200 High-Performance Liquid Chromatograph coupled to an Agilent UV-Vis diode array detector (Agilent Technologies, Santa Clara, CA, USA) was used for the chromatographic analysis. Four chromatographic methods were used to separate the bioactive molecules on a Kinetex C18 column (4.6 × 150 mm, 5 μm, Phenomenex, Torrance, CA, USA). Several mobile phases were used for bioactive compound identification and UV spectra were recorded at different wavelengths, based on HPLC methods, previously tested and validated [10,40], with some modifications: (i) a solution of 10 mM KH2PO4/H3PO4 (A) and acetonitrile (B) with a flow rate of 1.5 mL·min−1 (method A—analysis of cinnamic acids and flavonols, gradient analysis: 5% B to 21% B in 17 min + 21% B in 3 min + 2 min of conditioning time); (ii) a solution (A) of methanol/water/formic acid (5:95:0.1 v/v/v) and a mix (B) of methanol/formic acid (100:0.1 v/v) with a flow rate of 0.6 mL·min−1 (method B—analysis of benzoic acids and catechins, gradient analysis: 3% B to 85% B in 22 min + 85% B in 1 min + 2 min of conditioning time). UV spectra were recorded at 330 nm (A); 280 nm (B).
Biomarkers were selected for their demonstrated positive healthy properties and antioxidant capacity by literature in relation to the use of this plant-derived products. All single compounds were identified in samples by comparison and combination of their retention times and UV spectra with those of authentic standards in the same chromatographic conditions. Each sample was analyzed in triplicate and results were reported as mean value ± standard deviation to assess the repeatability of the employed methods.

2.6. Data Analysis

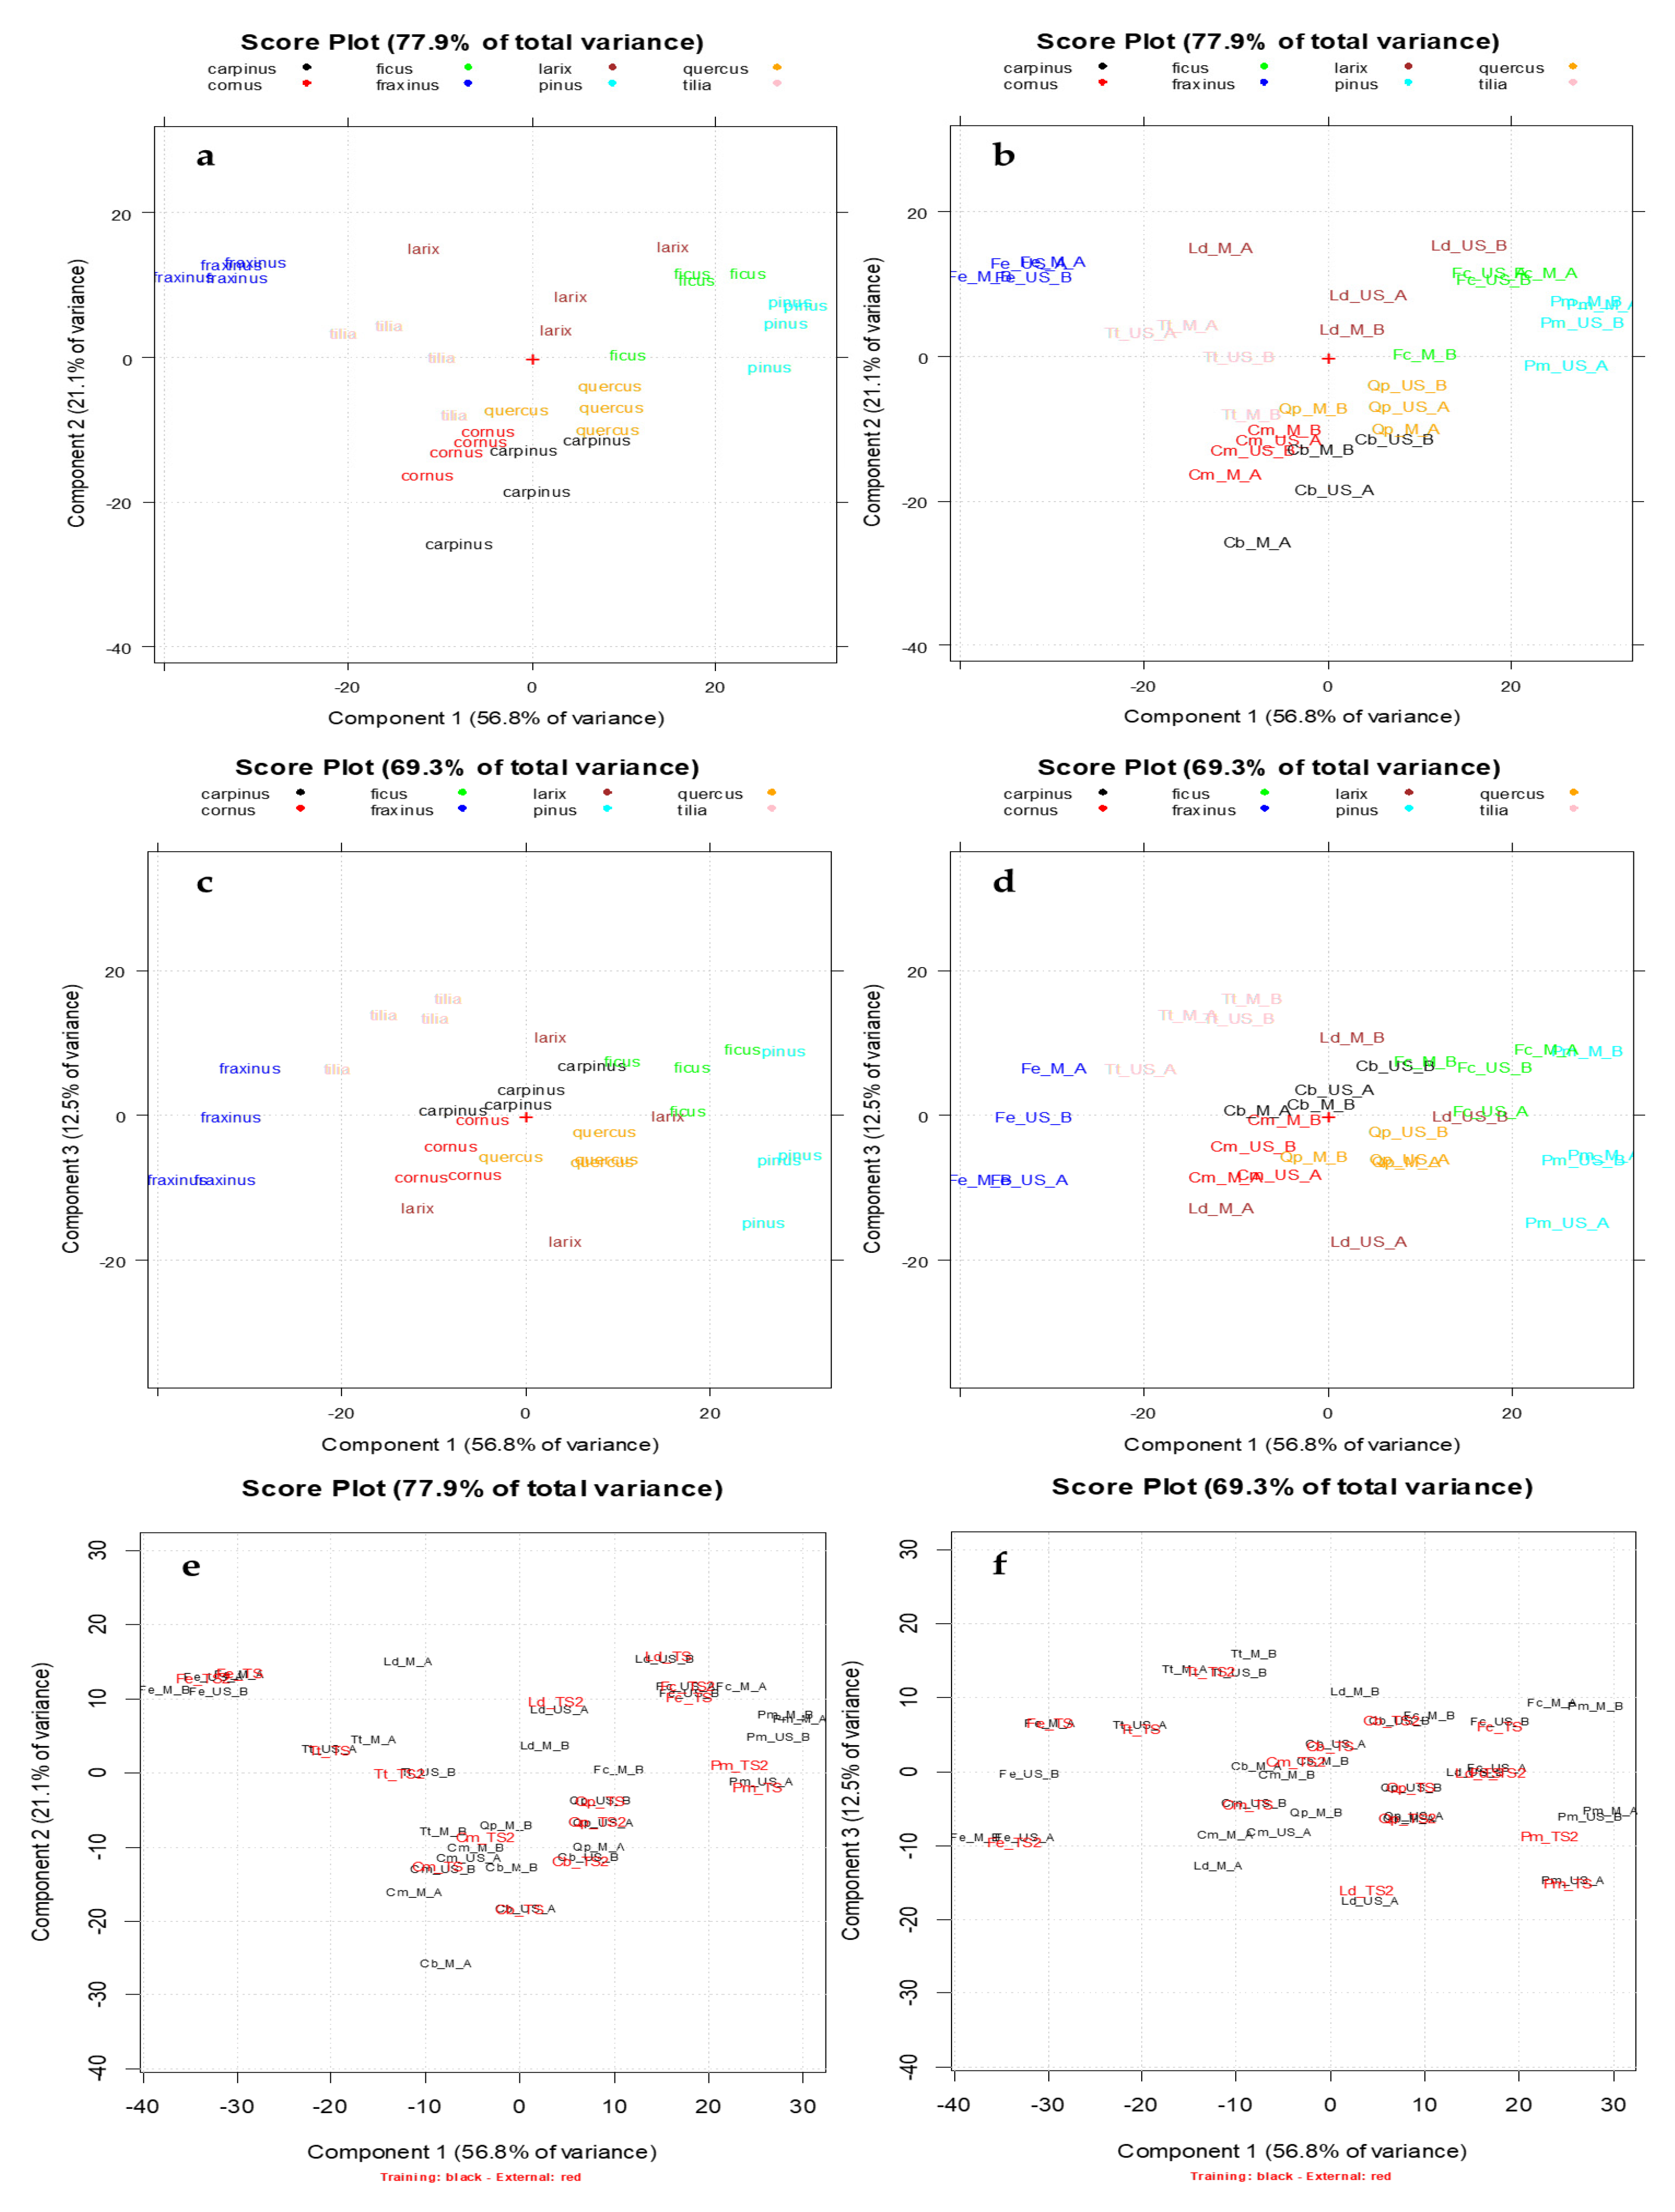
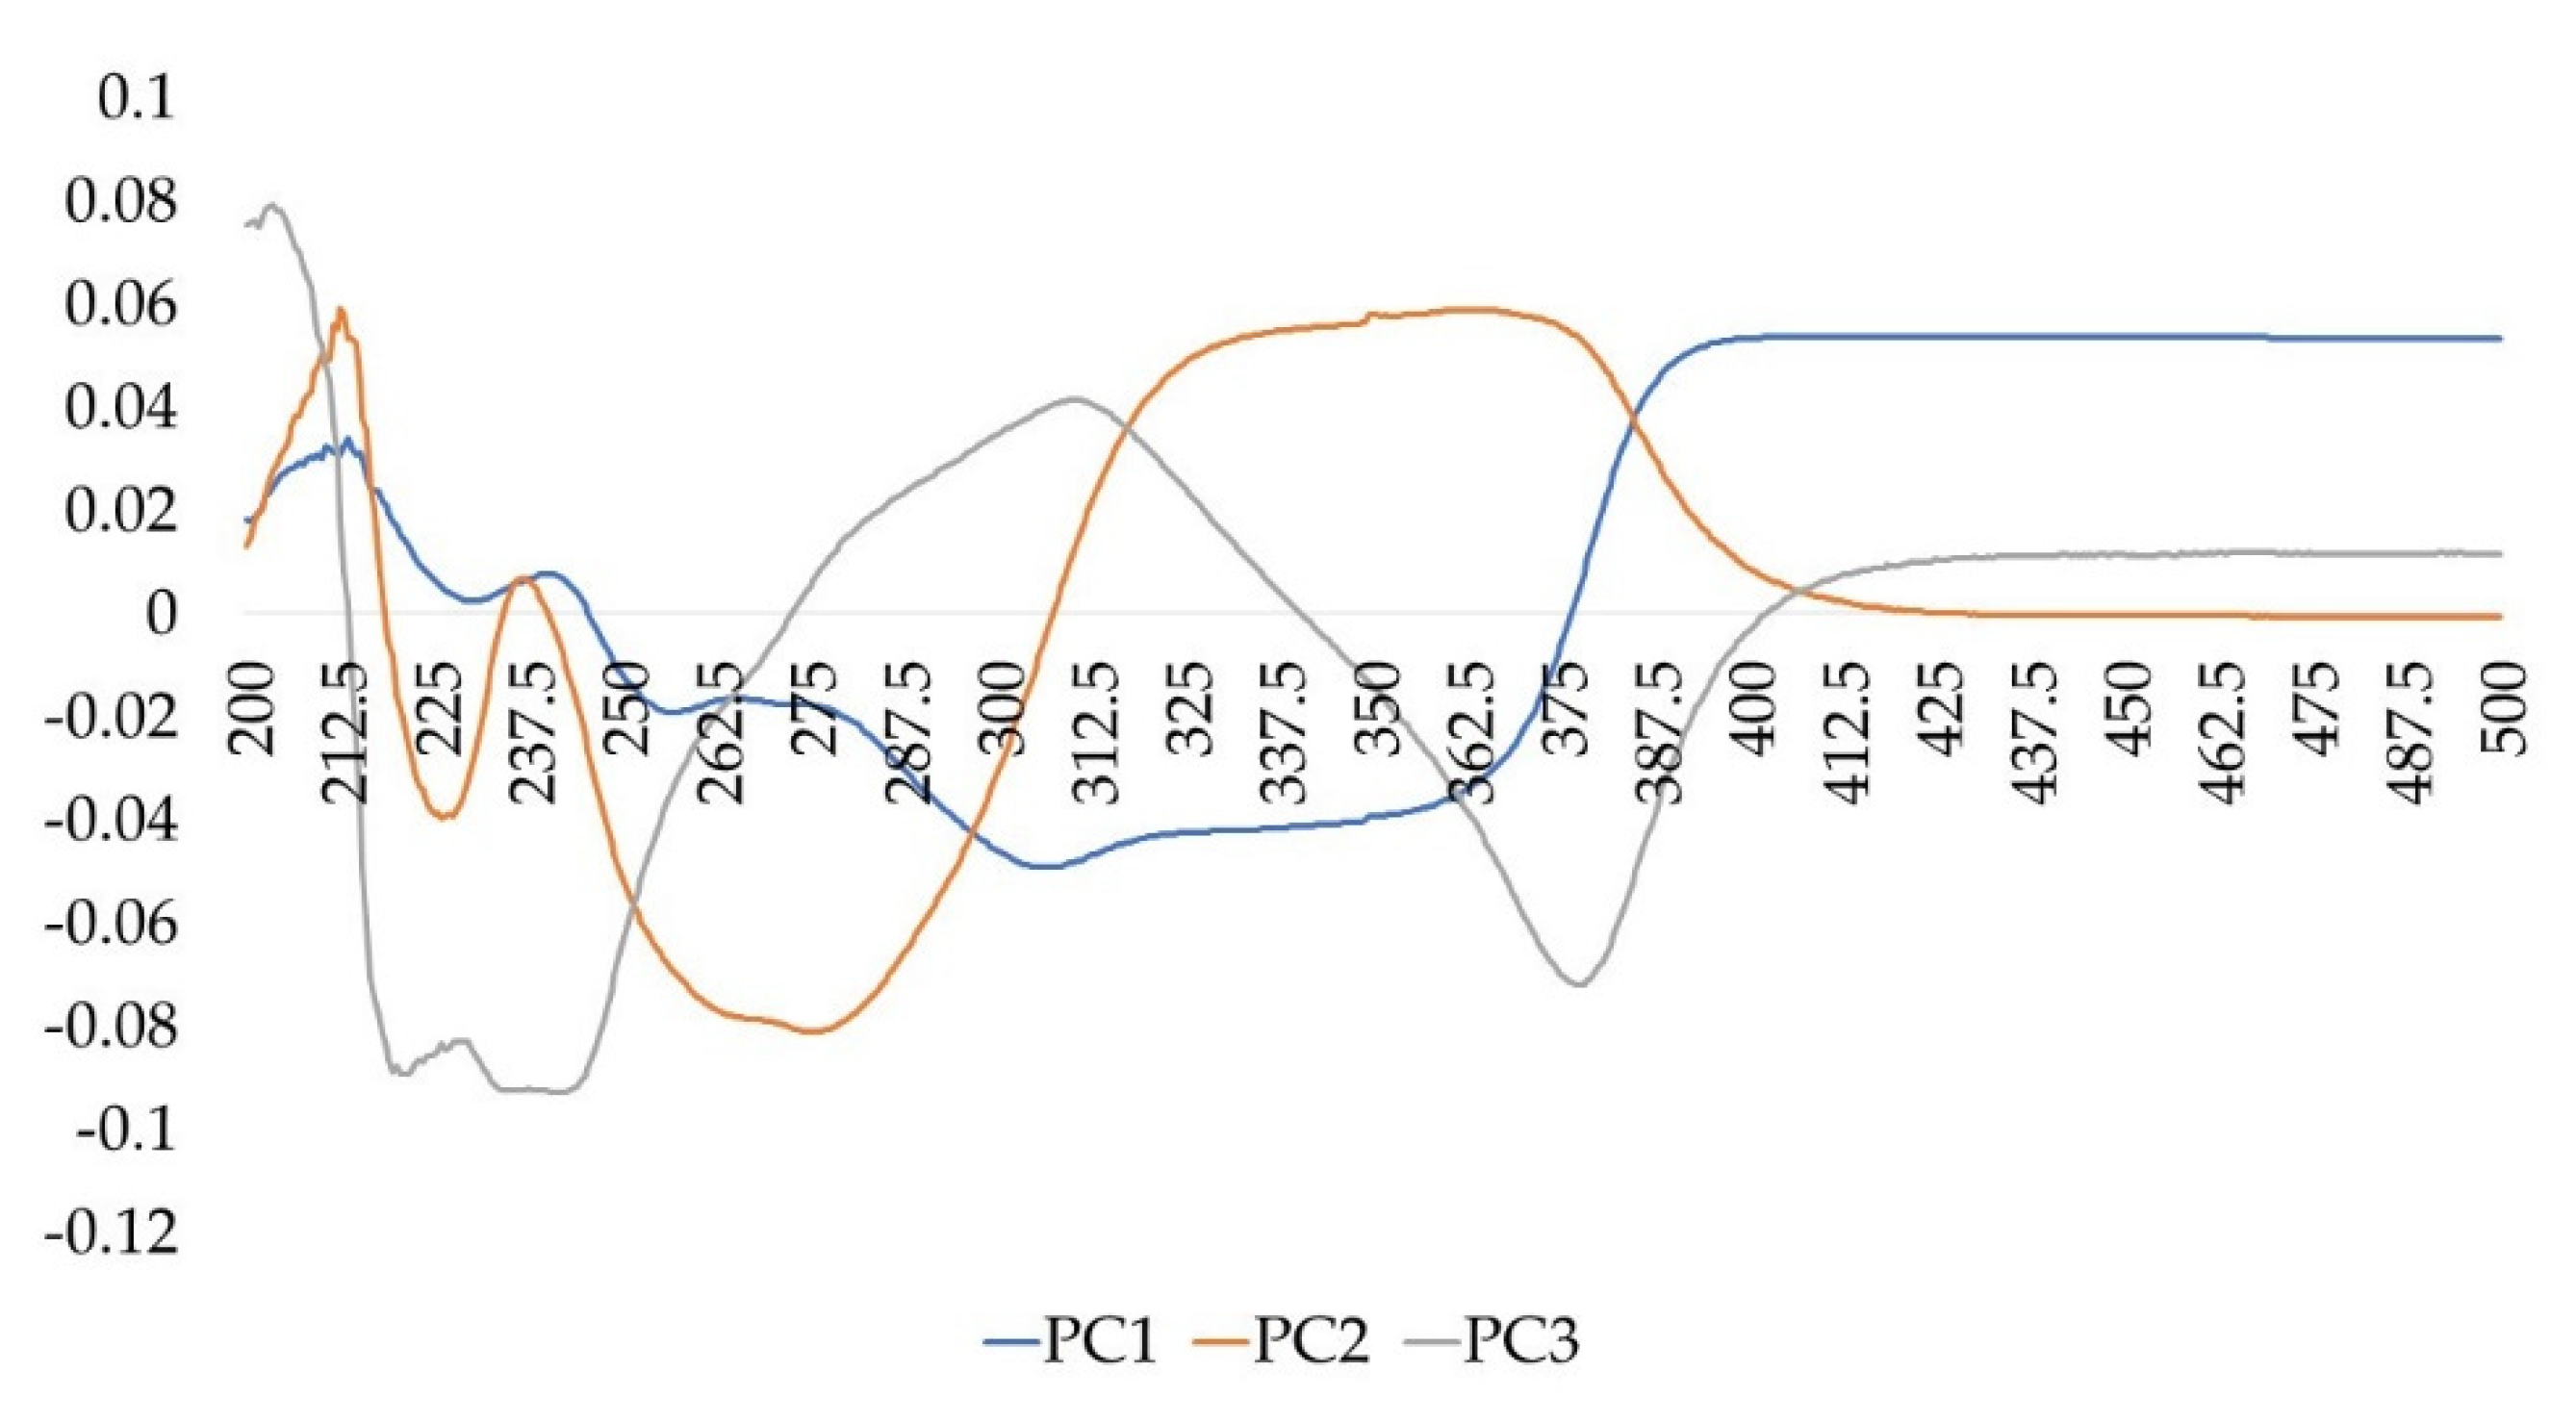
2.6.1. Chemometric Analysis

Multivariate data analysis has been performed by CAT (Chemometric Agile Tool) software, one advanced chemometric multivariate analysis tool based on R, developed by the Chemistry Group of the Italian Chemical Society [49].
PCA was applied as common multivariate statistical method of unsupervised pattern recognition. Its aim is extracting important information from the data and decreasing the high-dimensional dataset volume by maintaining the important information [50,51].

2.6.2. Data Matrices Organization

A data matrix A32,601 consisting of 32 rows (corresponding to the BDs analyzed, 4 samples for each of the eight botanical species investigated) and 601 columns (the absorbance values in the range of 200–500 nm of the UV-Visible spectra, with 0.5 nm of resolution) was prepared and further analyzed by PCA. Standard normal variate (SNV) transform and column autoscaling were previously performed on the spectral data to remove multiplicative effects of scattering and to scale the data, respectively [52].
Available sample were divided in two different subsets: a calibration (or training) set and a test (or evaluation) set in order to build and validate the statistical model, respectively [53]. For a reliable validation strategy, it is important that data used as test set were not used to build the model in order to avoid the overestimations of the prediction ability [53]. 32 samples, previously reported in Table 2, were selected for the construction and identification of the model (Calibration set). The representative calibration data set consisted of 4 extracts (M_A, M_B, US_A, US_B) for each botanical species investigated (Carpinus betulus L., Cornus mas L., Ficus carica L., Fraxinus excelsior L., Larix decidua Mill., Pinus montana Mill., Quercus petraea (Matt.) Liebl., Tilia tomentosa Moench). Furthermore 16 BDs, obtained both by conventional maceration and ultrasound extraction respectively from the same eight vegetal species, were randomly selected and used as an independent set to test the model and assess its validity (Test set, Table 3).
All the pre-treated UV-Visible absorption spectra, in the range 200–500 nm, are reported in Figure 2. For each species, the four averaged spectral profiles corresponding to the Calibration set (Table 2) are highlighted in grey while in red have been reported the Test set samples (TS/TS2) belonging to the same class.
Then, a data matrix B32,620 consisting of 32 rows and 620 columns was prepared and analogously analyzed by PCA. B32,620 rows correspond to the 32 BDs analyzed (Calibration set), and columns are the absorbance values of the UV-Visible spectra after SNV in the range 200–500 nm coupled to the chromatographic quantifications by HPLC (4 polyphenolic classes and 13 bioactive compounds). The data set was previously scaled by using a block scaling procedure [54], with the aim to give to the spectroscopic and chromatographic variables a comparable influence in the data analysis. In fact, this pretreatment allows to divide variables in different blocks whose values will be scaled to attain the same block-variance after pretreatment. Moreover, the variables belonging to the same block are equally weighted.

3. Results and Discussion

The quality control of vegetal material is critical both if the botanical product is to be used as a drug or as an herbal food supplement. For consumer safety and the protection of who operate in this industrial field, quality control should be applied throughout the different processing steps, from the raw material to the final product. Scientific-naturalistic illustrations of the most common buds used in BDs production (Table 1) have been realized within the Finnover project by an expert botanical graphic designer, in order to provide a useful first tool for the operators in the BDs manufacturing. In fact, this peculiar raw material is generally spontaneously collected and mistakes in the attribution of some botanical species may be possible. For this, bud illustrations could represent a preliminary control of these vegetable materials after their collection in the point of view of a controlled manufacturing chain of BDs.
Moreover, a strategy based on the untargeted UV-Visible fingerprinting coupled to chemometrics allows rapid screening of the polyphenolic BDs profile to obtain a preliminary control tool to identify the botanical species.

3.1. Bud-Derivatives Identification: UV-Visible Fingerprint

Figure 2 show the UV–Visible spectral profiles, after SNV pretreatment of the data, recorded for the eight vegetable species investigated: Carpinus betulus L., Cornus mas L., Ficus carica L., Fraxinus excelsior L., Larix decidua Mill., Pinus montana Mill., Quercus petraea (Matt.) Liebl., Tilia tomentosa Moench. The extracts were obtained by the conventional maceration and the innovative green extraction (M or US) respectively, using the two experimental protocols (A or B) as described in detail in Table 2. Ultrasounds represent one of the innovative processing techniques of officinal plants [39]. In fact, several companies already exploit innovative applications of ultrasound to obtain liquid foods, beverages, and alcoholic drinks [55,56]. Previously, the Authors described PUAE as an alternative time-saving method to the conventional maceration for the extraction of the polyphenolic fraction from buds [11]. Particularly, PUAE on a lab pilot reactor demonstrated to be an excellent approach for a rapid (20 min vs. 21 days or 3 months of maceration, depending on the Protocol applied) and efficient extraction of phenolic compounds.
Looking at Figure 2, the spectra of the different vegetable species are quite different, highlighting as the pattern of absorbances in the UV–Visible region is strictly connected with the botanical origin of the plants. On the contrary, for each botanical species the spectral differences due to the extraction method (M or US) and to the extraction solvent (Protocol A or B), are minimal. The 501–900 nm interval has been preliminarily removed because there were none interesting absorptions in this spectral region at the assayed concentrations.
PCA, an unsupervised pattern recognition technique [50,51], was applied in order to explore and to analyze the data set using a multivariate approach since the analytical information contained in each spectrum was considered as a multivariate fingerprint. Particularly, the data matrix A32,601, whose rows are the extracts (Calibration set) and the columns are the absorbances recorded in the spectral range 200–500 nm, was considered. PCA was performed on the pretreated and autoscaled data matrix. The first two principal components (PCs) of the data set (A32,601), which together explained the 77.9% of the total information of the data set since they visualize almost the 80% of the total variance, were firstly taken into account. Figure 3a,b shows the PCA score plots on the 1st–2nd principal components (PC1-PC2) obtained from the above-mentioned data matrix. In Figure 3a the extracts are categorized according to the vegetable species and each one is visualized with a different color (Carpinus betulus L.: black, Cornus mas L.: red, Ficus carica L: green., Fraxinus excelsior L.: blue, Larix decidua Mill.: brown, Pinus montana Mill.: light blue, Quercus petraea (Matt.) Liebl.: orange, Tilia tomentosa Moench: pink). In Figure 3b, for each vegetable class all the extracts belonging to the calibration set were indicated with their identification code (see Table 2). PC1, the direction of maximum variance which explains almost the 60% of the total information, allows good discrimination between the botanical class regardless of the extraction method (M or US) and the experimental preparation protocol (A or B). Particularly, the Fraxinus class (blue, lowest scores on PC1) separates from Ficus (green) and Pinus (light blue) which have higher scores on PC1. PC2, which explains the 21.1% of the remaining variance, allows to mainly separate Larix class (brown, highest scores on PC2) from Quercus (orange) and Carpinus (black, lowest scores on PC2).
Figure 3c,d show the PCA score plots on the PC1-PC3, which explain together the 69.3% of the total variance of the data set. A good separation among the above cited botanical classes is also highlighted except for Larix and Carpinus ones. In fact, these latter separate on PC2 (Figure 3a,b) and since PCs are orthogonal, they are uncorrelated and no duplicate information are shown in their plots [50].
In Figure 3e,f, the projections of the external test set (red samples) were reported on the PC1-PC2 and PC1-PC3 score plots respectively, showing a good correspondence with the calibration set for each botanical species.
The spectral variables having greater importance (loading values) on the first three PCs are represented by spectral areas near the following absorbances (in ascending order): 200 nm, 212 nm, 240 nm, 275 nm, 310 nm, 360 nm, 420 nm, as highlighted in the Loading plot on PC1-PC2-PC3 (Figure 4).
Several of them could be related to some secondary metabolites largely distributed in plant material (even in buds) such as tannins, whose structural variability depends on the vegetal species and even among organs of the same plant species [57]. The chemotaxonomic values of tannins have been recognized in the literature for several botanical species [58,59] and, the distribution of hydrolysable tannins has been used as chemotaxonomic markers by several authors [60].
It is well known that the different classes of tannins present characteristic absorption bands in the UV spectral region. Particularly as far as hydrolysable tannins are concerned, gallotannins show two characteristic absorption maximums, λ max around 212 nm and λ max around 275 nm, with an inflection point (λ min) around 242 nm; ellagitannins present strong absorption near 200 nm and a shoulder around 277 nm and another absorption near 360 nm. Instead condensed tannins (or proanthocyanidins), chemically defined as flavonoid polymers in which the phenolic hydroxyls are partially or totally esterified with gallic acid, present an absorption around 200 nm, a λ min between 258–259 nm and λ max between 279–281 nm [57]. Nevertheless, also other polyphenols, such as hydroxycinnamic acids and flavonoids, could contribute to the UV-Visible fingerprints, even if some of them are more ubiquitarians and lesser species-specific [61,62]. Furthermore, as far as flavonoids are concerned, it is important to underline that their absorptions in the Visible are almost negligible at the measured concentrations, which are instead useful to avoid saturation of the UV region.
The fingerprint UV-Visible, at least in a preliminary screening step, seems to discriminate the peculiar polyphenols composition of BDs and could be a simple and quick method to confirm the proper identification of the botanical source after the botanic check by a professional botanist.

3.2. Bud-Derivatives Identification: UV-Visible and HPLC Fingerprints

Figure 5 shows the PCA plots of the data matrix B32,620 on PC1-PC2, which together explained the 76.2% of the total variance.
PCA was performed on the pretreated and autoscaled data matrix, after the block scaling treatment in order to consider in the data analysis the same importance for the spectroscopic and chromatographic variables [63]. The PC1-PC2 score plot (Figure 5a) highlights a good separation between the vegetal species. Particularly PC1, which represents the direction of maximum variance explaining the 55.4% of the total information, allows good discrimination between Fraxinus class (blue, highest scores on PC1), Ficus (green) and Pinus (light blue) classes, which have lowest scores on this PC. As highlighted in the Biplot (Figure 5b) the variables having greater importance (loading value) on this separation are represented by total cinnamic acids, caffeic acid, coumaric acid and hyperoside content which are high in Fraxinus species and very low in Pinus one (as reported in Table 4). Instead PC2, which explains the 20.7% of the remaining information, allows mainly to separate Carpinus (black) and Cornus (red) classes from all the other ones. These species result particularly rich in tannins (catechins and benzoic acids).
In the Supplementary materials an example (Larix decidua) of chromatographic pattern was reported. As shown in Figure 5, the addition of chromatographic variables does not greatly improve the taxonomic separation previously obtained by the only UV-Visible fingerprint (Figure 3). However, these results show that the main polyphenols evaluated could be useful markers for identifying the botanical species regardless of the extraction method and the experimental preparation protocol.

3.3. Phenolic Composition of BDs

In this study, the health-promoting compounds were grouped into four different polyphenolic classes in order to assess the contribution of each class to the phytocomplex composition of buds belonging to the eight different species: cinnamic acids (as sum of caffeic acid, chlorogenic acid, coumaric acid, ferulic acid), flavonols (as sum of hyperoside, isoquercitrin, quercetin, quercitrin and rutin), benzoic acids (ellagic and gallic acids) and catechins ((+)catechin and (-)epicatechin). The identification and quantification of each single bioactive compound, expressed in mg/100 g FW, is reported in the Supplementary Materials (Table S2). For a better data visualization, Figure 6 shows the radar plot, made considering for each botanical species the mean values obtained from the 4 different extracts (M_A, M_B, US_A, US_B) for each marker compound quantified.
Several markers of cinnamic acids were considered but not detected in all the extracts. Fraxinus excelsior BDs showed the highest content in cinnamic acids (ranged from 113.53 ± 6.70 to 829.03 ± 2.26 mg/100 g FW), and as shown in Table S2, ferulic and chlorogenic acids were the most abundant. Cornus mas and Tilia tomentosa species showed very low amounts of ferulic acid (respectively 12.14 and 11.73 mg/100 g FW), while in the other species it was not detected. In recent years, several physiological functions of ferulic acid have been demonstrated [64]. Particularly, its free radical scavenging activity and its cholesterol-lowering activity, together with the low toxicity, suggested its chemo preventive effects on heart diseases [65]. Chlorogenic acid is also involved in beneficial effects on human health due to its anti-inflammatory, antioxidative, anti-aging and anticancer activities [66]. Chlorogenic acid was detected only in Fraxinus excelsior BDs (ranges from 43.88 to 489.94 mg/100 gFW), in all the other species it was not detectable. Li et al. 2013 reported that chlorogenic acid and flavonols may be considered the main phenolic compounds responsible for in vitro anti-cancer property (i.e., against breast, colon, liver and lung cancer) [66]. As regards the total flavonol content, it was highly variable among species. The highest content was quantified in Cornus mas species (mean value: 705.71 mg/100 g FW) while the lowest value in Pinus montana (mean value: 25.31 mg/100 g FW). As highlighted in Figure 6, quercetin represented the phenolic marker of BDs belonged to Larix decidua species (in orange), while hyperoside was more abundant in Fraxinus excelsior ones (in light blue).
Benzoic acids are known to be very important in the human diet because of their relation to many biological and functional activities including antioxidative, anti-inflammatory, anticancer and antihepatotoxic properties [67]. Gallic acid, due to its antioxidant activity, has been shown to be effective against oxidative stress (OS), and many other properties have been reported (i.e., anti-mutagenic, anti-carcinogenic, antiviral, antibacterial, anti-inflammatory, antithrombotic and anti-atherosclerotic activities) [68]. A multi-target activity of ellagic acid, mainly ascribed to its antioxidant property and free radical trapping ability, has been reported too. In particular anti-angiogenic, anti-atherogenic, anti-carcinogenic, anti-obesity, anti-inflammatory, antioxidant, anti-thrombotic and anti-neurodegenerative properties have been demonstrated [69]. Ellagic acid was very abundant in almost all the described species (Table S2) while gallic acid was not detectable in Ficus carica, Fraxinus excelsior, Larix decidua and Pinus montana species. The highest content in ellagic acid was identified in Cornus mas extracts, followed by Larix decidua and Quercus petraea BDs (Figure 6, in red).
Catechins have important effects on human health thanks to its antioxidant, anti-inflammatory, antidiabetic, and antimicrobial properties [67]. The intake of foods and dietary supplements rich in catechins could have an important role in the prevention of various diseases (i.e., cardiovascular diseases), inhibition of lipid peroxidation, improvement of blood flow, elimination of several toxins and inhibition of human cancer cell line proliferation and cyclooxygenase enzymes [70]. All the vegetal species considered in this research were a good source of catechins (catechin and epicatechin) as shown in Table 3 and Table S2. Particularly, as highlighted in Figure 6, catechin represented the phenolic marker of Pinus montana BDs (in violet), while epicatechin was more abundant in Carpinu betulus and Quercus petraea extracts (in light green).
All BDs analyzed showed a good content of phenolics although there was a high variability both between the different vegetal species and between the extracts obtained by the different manufacturing method and experimental conditions starting from the same botanical species. Figure 7 showed the radar plots of each botanical species in order to better highlight the phenolic composition of the 4 different extracts (M_A, M_B, US_A, US_B).
As showed in Figure 7, the manufacturing methods (conventional maceration or sonication) and the experimental conditions used for the preparation of BDs (i.e., extraction solvent, extraction time, solid/ solvent ratio, extraction time) strongly influenced the phenolic extraction yield despite having removed the variability of the raw material (same batch of buds for each vegetal species). Generally US_A (green line) and US_B (red line) appears more similar in terms of phenolic composition respect to M extracts (M_A and M_B), except for some species, such as Pinus montana and Larix decidua, in which there is a greater homogeneity in the polyphenolic profile of the final products. In almost all species, the M_B extract (yellow line) is the most different from the others. In example, the M_B extract of Cornus mas was rich in catechin which was not detected in extracts obtained by different extraction conditions (M_A, US_A, US_B). Analogously, rutin represents a phenolic marker of the M_B extract of Fraxinus excelsior, while it was poorly detectable in the other extracts of the same species. Surely Protocol A, according to the European Pharmacopoeia, provided a higher alcoholic concentration of the extraction solvent than protocol B and it is known that a higher solvent polarity allows a higher phenolic extraction from plant materials [71]. Moreover, Protocol A used an higher solid/solvent ratio because it is evaluated on the dry weight of the raw material while following the industrial Protocol (B), the fresh weight of buds was taken into account. Regarding the effect of ultrasounds, the implosion of cavitation bubbles on the material surface results in micro-jetting which generates several effects such as surface peeling, detexturation, erosion and cell breakdown [40]. Probably, the destruction of vegetal cells allowed to increase the extraction yield making up for the lower alcohol content of protocol B.
Due to the lack of a single regulation and an unique preparation protocol for these botanicals, very different products can be found on the market in terms of their polyphenolic fraction depending on both the raw materials (i.e., taking into account their specific agro-environmental and biological traits) and on the experimental conditions of manufacturing (method of preparation, extraction solvent, solid/solvent ratio, extraction time).

4. Conclusions

Although BDs have been widely used in traditional medicine because of the peculiar content of buds in phenolic compounds, nowadays they are a category of botanicals still poorly studied. The lack of detailed scientific information and a clear and unique regulation, it makes these products high risk and vulnerable for accidental mistakes in the attribution of the botanical species, but also frauds and adulterations. Moreover, the polyphenols content of BDs is strongly influenced by the manufacturing processes whose parameters are often not strictly defined (e.g., solvent ratios in the extraction mixtures, raw material/extraction mixture ratios, extraction time) and thus they affect their final compositions.
This research, within the Finnover project, aims to answer to the growing demand for efficient quality control in the BDs field to guarantee the proper attribution of the botanical source and their content. Moreover, a manufacturing process specification should be advisable to monitor the bioactive contents.
UV-Visible spectroscopy and HPLC-DAD analysis have been employed to obtain an untargeted and a targeted phytochemical fingerprint of BDs, respectively. UV-Visible coupled with an appropriate chemometric data processing is a simple, rapid and low-cost technique proved to be very useful to identify the botanical source regardless the manufacturing method and the experimental conditions used. Moreover, the targeted phytochemical fingerprint by HPLC-DAD allowed to obtain a detailed screening of the BDs polyphenolic profile which highlighted an high variability due to the different vegetal species and to the manufacturing method and protocol. The ultrasonic extraction of buds compared to conventional maceration proved less sensitive to the different extraction protocols.
The proposed strategy offers to those operating in this industrial sector an untargeted method for the identification of the bud’s botanical species and a green extraction strategy (PUAE) which is more robust with respect to the different extractive protocols that can be used. The same approach, described for BDs, could be analogously applied to other botanical productions.

Supplementary Materials

The following are available online at https://www.mdpi.com/2304-8158/9/10/1343/s1, Figure S1: Larix decidua chromatographic pattern. Table S1: Purity of all the used standards for HPLC analysis of BDs. Table S2: Single phenolic compound fingerprint of BDs.

Author Contributions

Conceptualization, G.L.B., P.Z. and R.B.; Data curation, F.T. and D.D.; Formal analysis, R.B.; Funding acquisition, G.L.B., A.P. and R.B.; Investigation, F.T., D.D. and M.G.; Project administration, G.L.B. and R.B.; Software, F.T. and R.B.; Supervision, G.L.B., A.P., P.Z. and R.B.; Writing—original draft, F.T. and D.D.; Writing—review & editing, G.L.B. and R.B. All authors have read and agreed to the published version of the manuscript.

Funding

This research was funded by an European Union project called FINNOVER (n° 1198), http://www.interreg-finnover.com/.

Acknowledgments

The authors acknowledge GEAL Pharma (Bricherasio, Torino, Italy) for providing the samples of plant materials and Teresa Fior for the scientific-naturalistic illustrations of buds.

Conflicts of Interest

The authors declare no conflict of interest.

References

  1. Czepielewska, E.; Makarewicz-Wujec, M.; Różewski, F.; Wojtasik, E. Kozłowska-Wojciechowska, M. Drug adulteration of food supplements: A threat to public health in the European Union? Regul. Toxicol. Pharmacol. 2018, 97, 98–102. [Google Scholar] [CrossRef]
  2. Italian Ministry of Health. Available online: http://www.salute.gov.it/portale/temi/p2_5.jsp?lingua=italiano&area=Alimentiparticolarieintegratori&menu=integratori (accessed on 20 March 2020).
  3. European Commission. Food Supplements. Available online: https://ec.europa.eu/food/safety/labelling_nutrition/supplements_en (accessed on 21 May 2020).
  4. Colombo, F.; Restani, P.; Biella, S.; Di Lorenzo, C. Botanicals in Functional Foods and Food Supplements: Tradition, Efficacy and Regulatory Aspects. Appl. Sci. 2020, 10, 2387. [Google Scholar] [CrossRef]
  5. Restani, P.; Di Lorenzo, C.; Garcia-Alvarez, A.; Frigerio, G.; Colombo, F.; Maggi, F.M.; Milà-Villarroel, R.; Serra-Majem, L. The PlantLIBRA consumer survey: Findings on the use of plant food supplements in Italy. PLoS ONE 2018, 13, e0190915. [Google Scholar] [CrossRef] [Green Version]
  6. Deconinck, E.; Vanhamme, M.; Bothy, J.L.; Courselle, P. A strategy based on fingerprinting and chemometrics for the detection of regulated plants in plant food supplements from the Belgian market: Two case studies. J. Pharm. Biomed. Anal. 2019, 166, 189–196. [Google Scholar] [CrossRef]
  7. Fibigr, J.; Šatínský, D.; Solich, P. Current trends in the analysis and quality control of food supplements based on plant extracts. Anal. Chim. Acta 2018, 1036, 1–15. [Google Scholar] [CrossRef]
  8. FINNOVER Interreg Alcotra Project 2017–2020. Available online: http://www.interreg-finnover.com/ (accessed on 20 May 2020).
  9. Pharmacopée Française. Codex Medicamentarius Gallicus, Codex Français: Monographie, Préparations Homéopathiques; Ordre National des Pharmaciens: Paris, France, 1965; Available online: http://ansm.sante.fr/Mediatheque/Publications/Pharmacopee-francaise-Plan-Preambule-index (accessed on 21 May 2020).
  10. Turrini, F.; Donno, D.; Boggia, R.; Beccaro, G.L.; Zunin, P.; Leardi, R.; Pittaluga, A.M. An innovative green extraction and re-use strategy to valorize food supplement by-products: Castanea sativa bud preparations as case study. Food Res. Int. 2019, 115, 276–282. [Google Scholar] [CrossRef]
  11. Turrini, F.; Donno, D.; Beccaro, G.L.; Zunin, P.; Pittaluga, A.; Boggia, R. Pulsed Ultrasound-Assisted Extraction as an Alternative Method to Conventional Maceration for the Extraction of the Polyphenolic Fraction of Ribes nigrum Buds: A New Category of Food Supplements Proposed by The FINNOVER Project. Foods 2019, 8, 466. [Google Scholar] [CrossRef] [Green Version]
  12. Allio, A.; Calorio, C.; Franchino, C.; Gavello, D.; Carbone, E.; Marcantoni, A. Bud extracts from Tilia tomentosa Moench inhibit hippocampal neuronal firing through GABAA and benzodiazepine receptors activation. J. Ethnopharmacol. 2015, 172, 288–296. [Google Scholar] [CrossRef]
  13. Calorio, C.; Donno, D.; Franchino, C.; Carabelli, V.; Marcantoni, A. Bud extracts from Salix caprea L. inhibit voltage gated calcium channels and catecholamines secretion in mouse chromaffin cells. Phytomedicine 2017, 36, 168–175. [Google Scholar] [CrossRef]
  14. Nervo, T.; Bergamini, L.; Guido, M.; Ferraro, F. Composizione e Relativo Uso Nel Trattamento Dell’endometrite Animale. U.S. Patent n. TO2015A000193, 2 April 2015. [Google Scholar]
  15. Olivero, G.; Turrini, F.; Vergassola, M.; Boggia, R.; Zunin, P.; Donno, D.; Beccaro, G.L.; Grilli, M.; Pittaluga, A. The 3Rs: Reduction and refinement through a multivariate statistical analysis approach in a behavioural study tounveil anxiolytic effects of natural extracts of Tilia tomentosa. Biomed. Sci. Eng. 2019, 3, 116. [Google Scholar] [CrossRef] [Green Version]
  16. Antonaci, I. Effetto Di Un Trattamento Fitoterapico Su Alcuni Parametri Ematologici Dell’asina Da Latte. Bachelor’s Thesis, Degree-granting Produzioni e Gestione degli Animali in Allevamento e Selvatici University of Turin, Turin, Italy, 2017. [Google Scholar]
  17. Guerra, C.; Nury, C. Utilizzo Di Una Soluzione Fitoterapica Per Un Trattamento Alternativo Dell’endometrite Equina. Bachelor’s Thesis, Degree-Granting Medicina Veterinaria University of Turin, Turin, Italy, 2015. [Google Scholar]
  18. Donno, D.; Beccaro, G.L.; Cerutti, A.K.; Mellano, M.G.; Bounous, G. Bud Extracts as New Phytochemical Source for Herbal Preparations-Quality Control and Standardization by Analytical Fingerprint. In Phytochemicals—Isolation, Characterisation and Role in Human Health, 1st ed.; Rao, A.V., Rao, L.G., Eds.; InTech: Rijeka, Croatia, 2015; pp. 187–218. [Google Scholar] [CrossRef] [Green Version]
  19. Donno, D.; Mellano, M.G.; Cerutti, A.K.; Beccaro, G.L. Biomolecules and Natural Medicine Preparations: Analysis of New Sources of Bioactive Compounds from Ribes and Rubus spp. Buds. Pharmaceuticals 2016, 9, 7. [Google Scholar] [CrossRef]
  20. Sanzini, E.; Badea, M.; Dos Santos, A.; Restani, P.; Sievers, H. Quality control of plant food supplements. Food Funct. 2011, 2, 740–746. [Google Scholar] [CrossRef]
  21. Donno, D.; Boggia, R.; Zunin, P.; Cerutti, A.K.; Guido, M.; Mellano, M.G.; Prgomet, Z.; Beccaro, G.L. Phytochemical fingerprint and chemometrics for natural food preparation pattern recognition: An innovative technique in food supplement quality control. J. Food Sci. Technol. 2016, 53, 1071–1083. [Google Scholar] [CrossRef] [Green Version]
  22. Directive 2002/46/EC of the European Parliament and of the Council of 10 June 2002 on the Approximation of the Laws of the Member States Relating to Food Supplements. Available online: https://eur-lex.europa.eu/eli/dir/2002/46/2017-07-26 (accessed on 5 September 2020).
  23. Decreto Legislativo 21 Maggio 2004, n.169, Attuazione Della Direttiva 2002/46/CE Relativa Agli Integratori Alimentari. Available online: https://www.gazzettaufficiale.it/eli/id/2004/07/15/004G0201/sg (accessed on 5 September 2020).
  24. European Federation of Associations of Health Product Manufacturers (EHPM). Available online: https://www.ehpm.org/attachments/article/117/EHPM%20Quality%20Guide%20101214.pdf (accessed on 5 September 2020).
  25. Watson, R.R. Polyphenols in Plants: Isolation, Purification and Extract Preparation, 2nd ed.; Academic Press: London, UK, 2018. [Google Scholar]
  26. Ma, G.; Chen, Y. Polyphenol supplementation benefits human health via gut microbiota: A systematic review via meta-analysis. J. Funct. Foods 2020, 66, 103829. [Google Scholar] [CrossRef]
  27. Tsao, R. Chemistry and biochemistry of dietary polyphenols. Nutrients 2010, 2, 1231–1246. [Google Scholar] [CrossRef]
  28. Tresserra-Rimbau, A.; Rimm, E.B.; Medina-Remón, A.; Martínez-González, M.A.; de la Torre, R.; Corella, D.; Salas-Salvadó, J.; Gómez-Gracia, E.; Lapetra, J.; Arós, F.; et al. Inverse association between habitual polyphenol intake and incidence of cardiovascular events in the PREDIMED study. Nutr. Metab. Cardiovasc. Dis. 2014, 24, 639–647. [Google Scholar] [CrossRef]
  29. Kwok, C.S.; Boekholdt, S.M.; Lentjes, M.A.H.; Loke, Y.K.; Luben, R.N.; Yeong, J.K.; Wareham, N.J.; Myint, P.K.; Khaw, K.T. Habitual chocolate consumption and risk of cardiovascular disease among healthy men and women. Heart 2015, 101, 1279–1287. [Google Scholar] [CrossRef] [Green Version]
  30. Wang, P.Y.; Fang, J.C.; Gao, Z.H.; Zhang, C.; Xie, S.Y. Higher intake of fruits, vegetables or their fiber reduces the risk of type 2 diabetes: A meta-analysis. J. Diabetes Investig. 2016, 7, 56–69. [Google Scholar] [CrossRef]
  31. Wang, S.; Moustaid-Moussa, N.; Chen, L.; Mo, H.; Shastri, A.; Su, R.; Bapat, P.; Kwun, I.; Shen, C.L. Novel insights of dietary polyphenols and obesity. J. Nutr. Biochem. 2014, 25, 1–18. [Google Scholar] [CrossRef] [Green Version]
  32. Serra, D.; Almeida, L.M.; Dinis, T.C.P. Dietary polyphenols: A novel strategy to modulate microbiota-gut-brain axis. Trends Food Sci. Technol. 2018, 78, 224–233. [Google Scholar] [CrossRef]
  33. Vauzour, D. Dietary polyphenols as modulators of brain functions: Biological actions and molecular mechanisms underpinning their beneficial effects. Oxidative Med. Cell. Longev. 2012, 2012, 914273. [Google Scholar] [CrossRef] [Green Version]
  34. Liu, X.; Du, X.; Han, G.; Gao, W. Association between tea consumption and risk of cognitive disorders: A dose-response meta-analysis of observational studies. Oncotarget 2017, 8, 43306–43321. [Google Scholar] [CrossRef]
  35. Brglez Mojzer, E.; Knez Hrnčič, M.; Škerget, M.; Knez, Ž.; Bren, U. Polyphenols: Extraction Methods, Antioxidative Action, Bioavailability and Anticarcinogenic Effects. Molecules 2016, 21, 901. [Google Scholar] [CrossRef]
  36. Donno, D.; Beccaro, G.L.; Mellano, M.G.; Bonvegna, L.; Bounous, G. Castanea spp. buds as a phytochemical source for herbal preparations: Botanical fingerprint for nutraceutical identification and functional food standardization. J. Sci. Food Agric. 2014, 94, 2863–2873. [Google Scholar] [CrossRef]
  37. Chemat, F.; Vian, M.A.; Cravotto, G. Green extraction of natural products: Concept and principles. Int. J. Mol. Sci. 2012, 13, 8615–8627. [Google Scholar] [CrossRef] [Green Version]
  38. Green Chemistry’s 12 Principles, United States Environmental Protection Agency. Available online: https://www.epa.gov/greenchemistry/basics-green-chemistry#twelve (accessed on 19 March 2020).
  39. Ministero Delle Politiche Agricole Alimentari E Forestali. Piano Di Settore Della Filiera Delle Piante Officinali 2014–16. Available online: https://www.politicheagricole.it/flex/cm/pages/ServeBLOB.php/L/IT/IDPagina/7562 (accessed on 21 May 2020).
  40. Chemat, F.; Rombaut, N.; Sicaire, A.G.; Meullemiestre, A.; Fabiano-Tixier, A.S.; Abert-Vian, M. Ultrasound assisted extraction of food and natural products. Mechanisms, techniques, combinations, protocols and applications. A review. Ultrason. Sonochem. 2017, 34, 540–560. [Google Scholar] [CrossRef]
  41. Vinatoru, M.; Mason, T.J.; Calinescu, I. Ultrasonically assisted extraction (UAE) and microwave assisted extraction (MAE) of functional compounds from plant materials. Trends Anal. Chem. 2017, 97, 159–178. [Google Scholar] [CrossRef]
  42. Vernès, L.; Vian, M.; Chemat, F. Chapter 12—Ultrasound and Microwave as Green Tools for Solid-Liquid Extraction. In Handbooks in Separation Science, Liquid-Phase Extraction, 1st ed.; Poole, C.F., Ed.; Elsevier: Amsterdam, The Netherlands, 2020; pp. 355–374. [Google Scholar] [CrossRef]
  43. Boggia, R.; Turrini, F.; Anselmo, M.; Zunin, P.; Donno, D.; Beccaro, G.L. Feasibility of UV-VIS-Fluorescence Spectroscopy combined with pattern recognition techniques to authenticate a new category of plant food supplements. J. Food Sci. Technol. 2017, 54, 2422–2432. [Google Scholar] [CrossRef]
  44. Donno, D.; Mellano, M.G.; Riondato, I.; De Biaggi, M.; Andriamaniraka, H.; Gamba, G.; Beccaro, G.L. Traditional and Unconventional Dried Fruit Snacks as a Source of Health-Promoting Compounds. Antioxidants 2019, 8, 396. [Google Scholar] [CrossRef] [Green Version]
  45. Li, A.N.; Li, S.; Zhang, Y.J.; Xu, X.R.; Chen, Y.M.; Li, H.B. Resources and Biological Activities of Natural Polyphenol. Nutrients 2014, 6, 6020–6047. [Google Scholar] [CrossRef]
  46. Vilkhu, K.; Mawson, R.; Simons, L.; Bates, D. Applications and opportunities for ultrasound assisted extraction in the food industry—A review. Innov. Food Sci. Emerg. Technol. 2008, 9, 161–169. [Google Scholar] [CrossRef]
  47. Pan, Z.; Qu, W.; Ma, H.; Atungulu, G.G.; McHugh, T.H. Continuous and pulsed ultrasound-assisted extractions of antioxidants from pomegranate peel. Ultrason. Sonochem. 2011, 18, 1249–1257. [Google Scholar] [CrossRef]
  48. Mok, D.K.W.; Chau, F.T. Chemical information of Chinese medicines: A challenge to chemist. Chemom. Intell. Lab. Syst. 2006, 82, 210–217. [Google Scholar] [CrossRef]
  49. Italian Chemical Society. Division of Analytical Chemistry-Group of Chemometrics. CAT Chemometric Agile Tool. Available online: http://www.gruppochemiometria.it/index.php/software (accessed on 25 May 2020).
  50. Wold, S.; Esbensen, K.; Geladi, P. Principal Component Analysis. Chemom. Intell. Lab. Syst. 1987, 2, 37–52. [Google Scholar] [CrossRef]
  51. Jolliffe, I.T. Principal Component Analysis, 2nd ed.; Springer Series in Statistics; Springer: New York, NY, USA, 2002. [Google Scholar]
  52. Barnes, R.J.; Dhanoa, M.S.; Lister, S.J. Standard normal variate transformation and de-trending of near-infrared diffuse reflectance spectra. Appl. Spectrosc. 1989, 43, 772–777. [Google Scholar] [CrossRef]
  53. Oliveri, P. Class-modelling in food analytical chemistry: Development, sampling, optimisation an validation issues—A tutorial. Anal. Chim. Acta 2017, 982, 9–19. [Google Scholar] [CrossRef]
  54. Wold, S.; Johansson, E.; Cocchi, M. 3D QSAR in Drug Design: Theory, Methods and Applications; Hugo, K., Ed.; ESCOM Science Publishers: Leiden, The Netherlands, 1993; p. 523. [Google Scholar]
  55. Chemat, F.; Ashokkumar, M. Preface: Ultrasound in the processing of liquid foods, beverages and alcoholic drinks. Ultrason. Sonochem. 2017, 38, 753. [Google Scholar] [CrossRef]
  56. Paniwnyk, L. Applications of ultrasound in processing of liquid foods: A review. Ultrason. Sonochem. 2017, 38, 794–806. [Google Scholar] [CrossRef]
  57. Falcão, L.; Araújo, M.E.M. Vegetable Tannins Used in the Manufacture of Historic Leathers. Molecules 2018, 23, 1081. [Google Scholar] [CrossRef] [Green Version]
  58. Okuda, T.; Yoshida, T.; Hatano, T.; Iwasaki, M.; Kubo, M.; Orime, T.; Yoshizaki, M.; Naruhashi, N. Hydrolysable tannins as chemotaxonomic markers in the rosaceae. Phytochemistry 1992, 31, 3091–3096. [Google Scholar] [CrossRef]
  59. Yoshida, T.; Amakura, Y.; Yoshimura, M. Structural features and biological properties of ellagitannins in some plant families of the order Myrtales. Int. J. Mol. Sci. 2010, 11, 79–106. [Google Scholar] [CrossRef] [Green Version]
  60. Moilanen, J.; Koskinen, P.; Salminen, J.P. Distribution and content of ellagitannins in Finnish plant species. Phytochemistry 2015, 116, 188–197. [Google Scholar] [CrossRef]
  61. Rocha, L.D.; Monteiro, M.C.; Teodoro, A.J. Anticancer properties of hydroxycinnamic acids—A Review. Cancer Clin. Oncol. 2012, 1, 109–121. [Google Scholar] [CrossRef]
  62. Zelber-Sagi, S.; Salomone, F.; Mlynarsky, L. The Mediterranean dietary pattern as the diet of choice for non-alcoholic fatty liver disease: Evidence and plausible mechanisms. Liver Int. 2017, 37, 936–949. [Google Scholar] [CrossRef] [Green Version]
  63. Brereton, R.G. Applied Chemometrics for Scientists; John Wiley & Sons, Ltd.: Chichester, UK, 2007. [Google Scholar] [CrossRef]
  64. De Biaggi, M.; Donno, D.; Mellano, M.G.; Gamba, G.; Riondato, I.; Rakotoniaina, E.N.; Beccaro, G.L. Emerging species with nutraceutical properties: Bioactive compounds from Hovenia dulcis pseudofruits. Food Chem. 2020, 310, 125816. [Google Scholar] [CrossRef]
  65. Kim, H.K.; Jeong, T.-S.; Lee, M.-K.; Park, Y.B.; Choi, M.-S. Lipid-lowering efficacy of hesperetin metabolites in high-cholesterol fed rats. Clin. Chim. Acta 2003, 327, 129–137. [Google Scholar] [CrossRef]
  66. Li, F.; Li, S.; Li, H.-B.; Deng, G.-F.; Ling, W.-H.; Wu, S.; Xu, X.-R.; Chen, F. Antiproliferative activity of peels, pulps and seeds of 61 fruits. J. Funct. Foods 2013, 5, 1298–1309. [Google Scholar] [CrossRef]
  67. Beccaro, G.L.; Donno, G.; Lione, G.G.; De Biaggi, M.; Gamba, G.; Rapalino, S.; Riondato, I.; Gonthier, P.; Mellano, M.M. Castanea spp. Agrobiodiversity Conservation: Genotype Influence on Chemical and Sensorial Traits of Cultivars Grown on the Same Clonal Rootstock. Foods 2020, 9, 1062. [Google Scholar] [CrossRef]
  68. Alfei, S.; Signorello, M.G.; Schito, A.; Catena, S.; Turrini, F. Reshaped as polyester-based nanoparticles, gallic acid inhibits platelet aggregation, reactive oxygen species production and multi-resistant Gram-positive bacteria with an efficiency never obtained. Nanoscale Adv. 2019, 1, 4148–4157. [Google Scholar] [CrossRef] [Green Version]
  69. Alfei, S.; Turrini, F.; Catena, S.; Zunin, P.; Grilli, M.; Pittaluga, A.M.; Boggia, R. Ellagic acid a multi-target bioactive compound for drug discovery in CNS? A narrative review. Eur. J. Med. Chem. 2019, 183, 111724. [Google Scholar] [CrossRef]
  70. Ananingsih, V.K.; Sharma, A.; Zhou, W. Green tea catechins during food processing and storage: A review on stability and detection. Food Res. Int. 2013, 50, 469–479. [Google Scholar] [CrossRef]
  71. Franco, D.; Sineiro, J.; Rubilar, M.; Sánchez, M.; Jerez, M.; Pinelo, M.; Costoya, N.; Núñez, M.J. Polyphenols from plant materials: Extraction and antioxidant power. Electron. J. Environ. Agric. Food Chem. 2008, 7, 3210–3216. [Google Scholar]
Figure 1. The global scheme of the experimental manufacturing of BDs: two methods (cold maceration, namely M, and ultrasounds, namely US) have been used. Each method has been applied following two different protocols (A and B).
Foods 09 01343 g001
Figure 2. Averaged UV-Visible spectra of the 8 botanical species after SNV pre-treatment of data. For each species, the four averaged spectral profiles of the Calibration set (Table 2) are highlighted in grey while in red are reported the External Test set samples (Table 3).
Foods 09 01343 g002
Figure 3. The scores plots of the UV–Visible absorbances data matrix A32,601. Each vegetable species is reported with a different color (Carpinus betulus L.: black, Cornus mas L.: red, Ficus carica L: green., Fraxinus excelsior L.: blue, Larix decidua Mill.: brown, Pinus montana Mill.: light blue, Quercus petraea (Matt.) Liebl.: orange, Tilia tomentosa Moench: pink). (a) PC1-PC2 score plot with BDs categorized according to the vegetable species; (b) PC1-PC2 score plot with BDs categorized according to their identification code (Table 2); (c) PC1-PC3 score plot with BDs categorized according to the vegetable species; (d) PC1-PC3 score plot with BDs categorized according to their identification code (Table 2); (e) PC1-PC2 score plot obtained projecting the external test set samples (highlighted in red); (f) PC1-PC3 score plot obtained projecting the external test set samples (highlighted in red).
Foods 09 01343 g003
Figure 4. Loading plot on PC1, PC2, PC3.
Foods 09 01343 g004
Figure 5. The PC1–PC2 plots of the UV–Visible absorbances coupled to the HPLC data (data matrix B32,620): (a) Score plot; (b) Biplot.
Foods 09 01343 g005
Figure 6. The mean content of each phenolic marker (caffeic acid, chlorogenic acid, coumaric acid, ferulic acid, hyperoside, isoquercitrin, quercetin, quercitrin and rutin, ellagic acid, gallic acid, (+)catechin and (-)epicatechin) for the eight botanical species investigated.
Foods 09 01343 g006
Figure 7. For each botanical species the phenolic composition (caffeic acid, chlorogenic acid, coumaric acid, ferulic acid, hyperoside, isoquercitrin, quercetin, quercitrin and rutin, ellagic acid, gallic acid, (+)catechin and (-)epicatechin) of the 4 different extracts (M_A: blue line, M_B: yellow line, US_A: green line, US_B: red line) was reported.
Foods 09 01343 g007
Table 1. The collection sites, the corresponding geo-localization coordinates, and the scientific naturalistic illustrations of the eight different bud species.
Vegetable
Species
Family
(Order)
Collection SiteGeo-Localization CoordinatesIllustrations
Carpinus betulusBetulacee
(Fagales)
Bricherasio
Prarostino
San Germano Rostino
44.821, 7.285; 44.831, 7.272;
44.825, 7.275
44.913, 7.237
44.868, 7.253
Foods 09 01343 i001
Cornus masCornaceae
(Cornales)
Bricherasio
Torre Pellice
Villar Pellice
44.854, 7.250; 44.855, 7.250;
44.823, 7.307
44.813, 7.181
44.804, 7.154
Foods 09 01343 i002
Ficus caricaMoraceae
(Rosales)
Brondello
Pagno
44.604, 7.422; 44.603, 7.419;
44.603, 7.418
44.598, 7.424; 44.597, 7.424; 44.598, 7.425
Foods 09 01343 i003
Fraxinus excelsiorOleacee
(Lamiales)
Angrogna
Bricherasio
Massello
Paesana
Pagno
San Germano Chisone
44.869, 7.173
44.822, 7.284
44.964, 7.031
44.656, 7.261; 44.651, 7.257
44.597, 7.424; 44.598, 7.425; 44.598, 7.424
44.888, 7.261
Foods 09 01343 i004
Larix deciduaPinacee
(Pinales)
Praly44.902, 7.055 Foods 09 01343 i005
Pinus montanaPinacee
(Pinales)
Masello
Pramollo
44.948, 7.065; 44.948, 7.068;
44.947, 7.063
44.918, 7.193
Foods 09 01343 i006
Quercus petraeaFagaceae
(Malvales)
Bricherasio44.848, 7.275;
44.850, 7.274;
44.842, 7.282;
44.831, 7.270
Foods 09 01343 i007
Tilia tomentosaMalvaceae
(Malvales)
Angrogna
Bobbio Pellice
Bricherasio
Perrero
44.849, 7.223
44.799, 7.131
44.832, 7.265; 44.816, 7.282; 44.821, 7.273; 44.821, 7.285; 44.822, 7.283; 44.818, 7.279
44.936, 7.139
Foods 09 01343 i008
Table 2. BDs obtained starting from the eight vegetable species (raw materials). Two different methods (cold maceration-M and Pulsed Ultrasound-Assisted Extraction US) and two different experimental protocol (Protocol A and B) are taken into account.
Sample
Identification Code
Vegetable SpeciesExtraction MethodExperimental ProtocolBud/Solvent Ratio
1Cb_M_ACarpinus betulusMProtocol A1/20 DW
2Cb_US_ACarpinus betulusUSProtocol A1/20 DW
3Cb_M_BCarpinus betulusMProtocol B1/15 FW
4Cb_US_BCarpinus betulusUSProtocol B1/15 FW
5Cm_M_ACornus masMProtocol A1/20 DW
6Cm_US_ACornus masUSProtocol A1/20 DW
7Cm_M_BCornus masMProtocol B1/20 FW
8Cm_US_BCornus masUSProtocol B1/20 FW
9Fc_M_AFicus caricaMProtocol A1/20 DW
10Fc _US_AFicus caricaUSProtocol A1/20 DW
11Fc _M_BFicus caricaMProtocol B1/10 FW
12Fc_US_BFicus caricaUSProtocol B1/10 FW
13Fe_M_AFraxinus excelsiorMProtocol A1/20 DW
14Fe_US_AFraxinus excelsiorUSProtocol A1/20 DW
15Fe_M_BFraxinus excelsiorMProtocol B1/10 FW
16Fe_US_BFraxinus excelsiorUSProtocol B1/10 FW
17Ld_M_ALarix deciduaMProtocol A1/20 DW
18Ld_US_ALarix deciduaUSProtocol A1/20 DW
19Ld_M_BLarix deciduaMProtocol B1/20 FW
20Ld_US_BLarix deciduaUSProtocol B1/20 FW
21Pm_M_APinus montanaMProtocol A1/20 DW
22Pm_US_APinus montanaUSProtocol A1/20 DW
23Pm_M_BPinus montanaMProtocol B1/10 FW
24Pm_US_BPinus montanaUSProtocol B1/10 FW
25Qp_M_AQuercus petraeaMProtocol A1/20 DW
26Qp_US_BQuercus petraeaUSProtocol A1/20 DW
27Qp_M_BQuercus petraeaMProtocol B1/15 FW
28Qp_US_BQuercus petraeaUSProtocol B1/15 FW
29Tt_M_ATilia tomentosaMProtocol A1/20 DW
30Tt_US_ATilia tomentosaUSProtocol A1/20 DW
31Tt_M_BTilia tomentosaMProtocol B1/15 FW
32Tt_US_BTilia tomentosaUSProtocol B1/15 FW
DW: dry weight; FW: fresh weight.
Table 3. External test set. 16 BDs obtained starting from the eight vegetable species using two different methods (cold maceration M and Pulsed Ultrasound-Assisted Extraction US) and two different experimental protocol (Protocol A and B) are taken into account as independent set to test the statistical model.
Sample
Identification Code
Vegetable SpeciesExtraction MethodExperimental Protocol
1Cb_TSCarpinus betulusUSProtocol A
2Cb_TS2Carpinus betulusUSProtocol B
3Cm_TSCornus masUSProtocol A
4Cm_TS2Cornus masUSProtocol B
5Fc_TSFicus caricaUSProtocol A
6Fc _TS2Ficus caricaUSProtocol B
7Fe_TSFraxinus excelsiorMProtocol A
8Fe_TS2Fraxinus excelsiorUSProtocol A
9Ld_TSLarix deciduaUSProtocol A
10Ld_TS2Larix deciduaUSProtocol B
11Pm_TSPinus montanaMProtocol A
12Pm_TS2Pinus montanaUSProtocol A
13Qp_TSQuercus petraeaMProtocol A
14Qp_TS2Quercus petraeaUSProtocol A
15Tt_TSTilia tomentosaUSProtocol A
16Tt_TS2Tilia tomentosaUSProtocol B
Table 4. Bioactive classes and total phenolics in the analyzed samples.
Cinnamic AcidsFlavonolsBenzoic AcidsCatechinsTotal Phenolics
Sample IDMean ValueSDMean ValueSDMean ValueSDMean ValueSDMean ValueSD
(mg/100 gFW **)(mg/100 gFW **)(mg/100 gFW **)(mg/100 gFW **)(mg/100 gFW **)
Tt_M_A5.300.7351.642.6622.980.7952.171.46132.095.64
Tt_M_B23.871.0690.795.026.621.0450.681.03171.978.16
Tt_US_A5.331.3971.265.92132.561.68156.461.78365.6110.77
Tt_US_B12.435.20100.2314.8496.288.4181.1510.16290.1038.61
Pm_M_An.d./31.131.45n.d./171.381.65202.513.10
Pm_M_Bn.d./n.d./n.d./49.362.2949.362.29
Pm_US_An.d./31.363.863.671.56378.902.54413.937.96
Pm_US_Bn.d./38.744.35n.d./325.884.77364.629.12
Ld_M_An.d./275.150.9197.070.31112.090.67484.311.88
Ld_M_Bn.d./151.572.23137.230.8870.902.62359.705.72
Ld_US_A2.401.02810.863.32190.250.95152.122.121155.637.42
Ld_US_Bn.d./941.6213.22219.283.66127.087.331287.9824.21
Fe_M_A829.032.26499.082.52214.490.69328.251.681870.857.15
Fe_M_B119.440.98223.613.4340.811.2598.752.52482.618.18
Fe_US_A151.002.32378.934.62115.820.93225.262.21871.0110.07
Fe_US_B113.536.70551.0710.0677.402.30215.965.28957.9624.34
Cm_M_A23.970.401055.031.87577.480.37104.700.531761.193.18
Cm_M_B24.591.55310.992.06541.342.351161.652.482038.588.45
Cm_US_A14.871.04672.043.57276.381.3398.831.211062.127.15
Cm_US_Bn.d./784.7912.98329.552.85167.034.671281.3720.50
Cb_M_A47.040.83442.452.04286.401.25523.931.141299.835.26
Cb_M_Bn.d./203.201.18418.852.56248.732.73870.786.47
Cb_US_An.d./230.162.8280.561.04297.571.07608.294.92
Cb_US_Bn.d./198.985.89206.424.05227.603.00633.0012.95
Fc_M_A62.210.84287.894.3567.290.89267.352.16684.748.25
Fc_M_Bn.d./123.283.6545.861.0868.422.11237.576.83
Fc_US_A6.492.62116.684.3126.331.18138.272.64287.7710.76
Fc_US_B10.775.54155.0211.3952.183.49183.917.34401.8827.76
Qp_M_A5.080.65223.631.97283.591.28294.750.85807.064.75
Qp_M_Bn.d./59.402.7584.022.16109.812.18253.237.09
Qp_US_A1.761.2955.984.96223.322.35253.812.23534.8710.83
Qp_US_Bn.d./72.098.5058.435.70161.814.89292.3219.08
SD: standard deviation; ** FW: fresh weight

