Biological Effects of Food Coloring in In Vivo and In Vitro Model Systems


Abstract

1. Introduction
- Riboflavin (E-101) is part of the vitamin B group. It is a yellow-orange solid substance with poor solubility in water. This food coloring is present in a wide range of foods, with liver, milk, meat, and fish being the most important sources [5]. Riboflavin can be obtained by controlled fermentation using a genetically modified strain of Bacillus subtilis or the fungus Ashbya gossypii [6]. Riboflavin was evaluated by the Joint FAO/WHO Expert Committee on Food Additives (JECFA) in 1969, which established an acceptable daily intake (ADI) of 0.5 mg/kg·body weight (bw)/day on the basis of limited data [5]. No adverse toxic, genotoxic, cytotoxic, or allergic effects have been related to Riboflavin in different organisms [7,8].
- Tartrazine (E-102) is a synthetic lemon-yellow azo dye primarily used as a food coloring. Its presence is allowed in various foodstuffs and beverages [9]. Both the JECFA and the EU Scientific Committee for Food (SCF) established an ADI of 7.5 mg/kg·bw/day in 1996 [10]. Controversial studies about the effects of Tartrazine on health have been reported. The most adverse effects have been related to DNA damage [11], hyperactivity [12], changes in the central nervous system [13], and allergic reactions [14,15,16,17,18].
- Carminic Acid (E-120) is a natural red colorant which comes from Datylopius coccus, an insect which lives on Opuntia coccinellifer. In order to obtain this dye, it is necessary to dry and spray the body of pregnant females of these insects [19]. The JECFA and SCF committees established an ADI of 5 mg/kg·bw/day for Carminic Acid [20]. This dye is called by the FDA “cochineal extract” or “carmine” and is classified as exempt from certification. According to the FDA, it is used in food, drugs, and cosmetics [1]. Despite the absence of genotoxic or cytotoxic effects described for Carminic Acid, it has been related to anaphylactic reactions, asthma, urticaria, and angioedema [19,21,22,23]. Furthermore, impairment in renal function has been demonstrated in male albino rats [24].
- Erythrosine (E-127) is a cherry-pink synthetic food colorant with a polyiodinated xanthene structure [25]. It is widely used to color children’s sweets [26], as well as to determine the presence of dental plate in Odontology [27]. The ADI of Erythrosine was established by the JECFA and SCF in 0.1 mg/kg·bw/day [28]. Regarding the FDA, it allows the use of Erythrosine both for food and drugs [1]. Some studies suggested a relationship between Erythrosine consumption and altered cognition and behavior in children, which could be due to the inhibition of dopamine receptors [29]. Moreover, different studies suggested the induction of chromosome aberrations and an increase in the incidence of thyroid tumors by Erythrosine consumption [11,30,31].
- Indigotine (E-132) is one of the earliest known natural dyes. Originally, it was obtained from the leaves of the plants Indigofera tinctoria, Indigofera suifruticosa, and Isatis tinctoria, where it occurs as indican, a glycoside of indoxyl [32]. In 1975, the JECFA and SCF established an ADI of 5 mg/kg·bw/day for this blue additive [33]. Only a subacute toxicity study performed with adult male Swiss albino mice showed severe adverse effects of Indigotine on the testis [34].
- Brilliant Blue FCF (E-133) is a triarylmethane synthetic food coloring authorized as a food additive. In 2017, the JECFA revised the ADI to 6 mg/kg·bw/day for this blue additive [35]. Brilliant Blue FCF has recently been evaluated and approved as a cosmetic colorant by the Scientific Committee on Cosmetic Products (SCCP) [35]. Current databases show no adverse effects of Brilliant Blue FCF in any organism assayed for any biological test carried out [11,36,37,38,39].
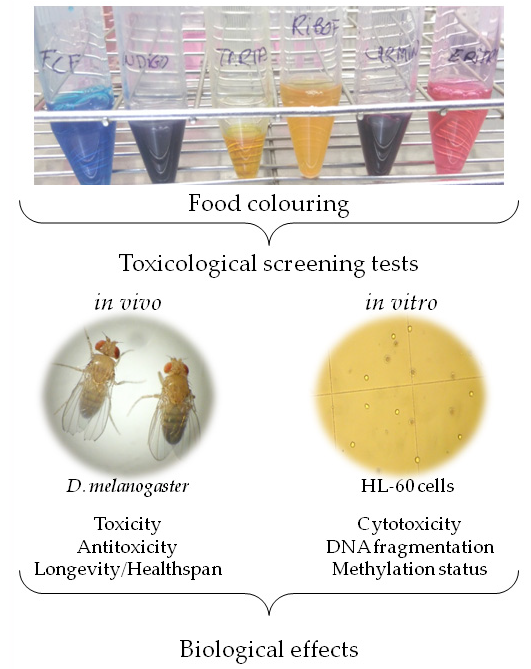
2. Materials and Methods
2.1. Samples
2.2. In Vivo Assays
2.2.1. Toxicity and Antitoxicity Assays
2.2.2. Lifespan Assays
2.3. In Vitro Assays
2.3.1. Cytotoxicity Assays
2.3.2. Determination of DNA fragmentation
2.3.3. Methylation Status
- -
- CT of the target gene was normalized with respect to the referent gene (ΔCT).
- -
- ΔCT of each experimental sample or reference (ΔCT,r) were compared with ΔCT of the calibrator sample (ΔCT,cb), ΔΔCT.
- -
- The relative value of each sample was defined using the formula:2−(ΔCT,r−ΔCT,cb) = 2−ΔΔCT
3. Results
3.1. In Vivo
3.1.1. Toxicity and Antitoxicity
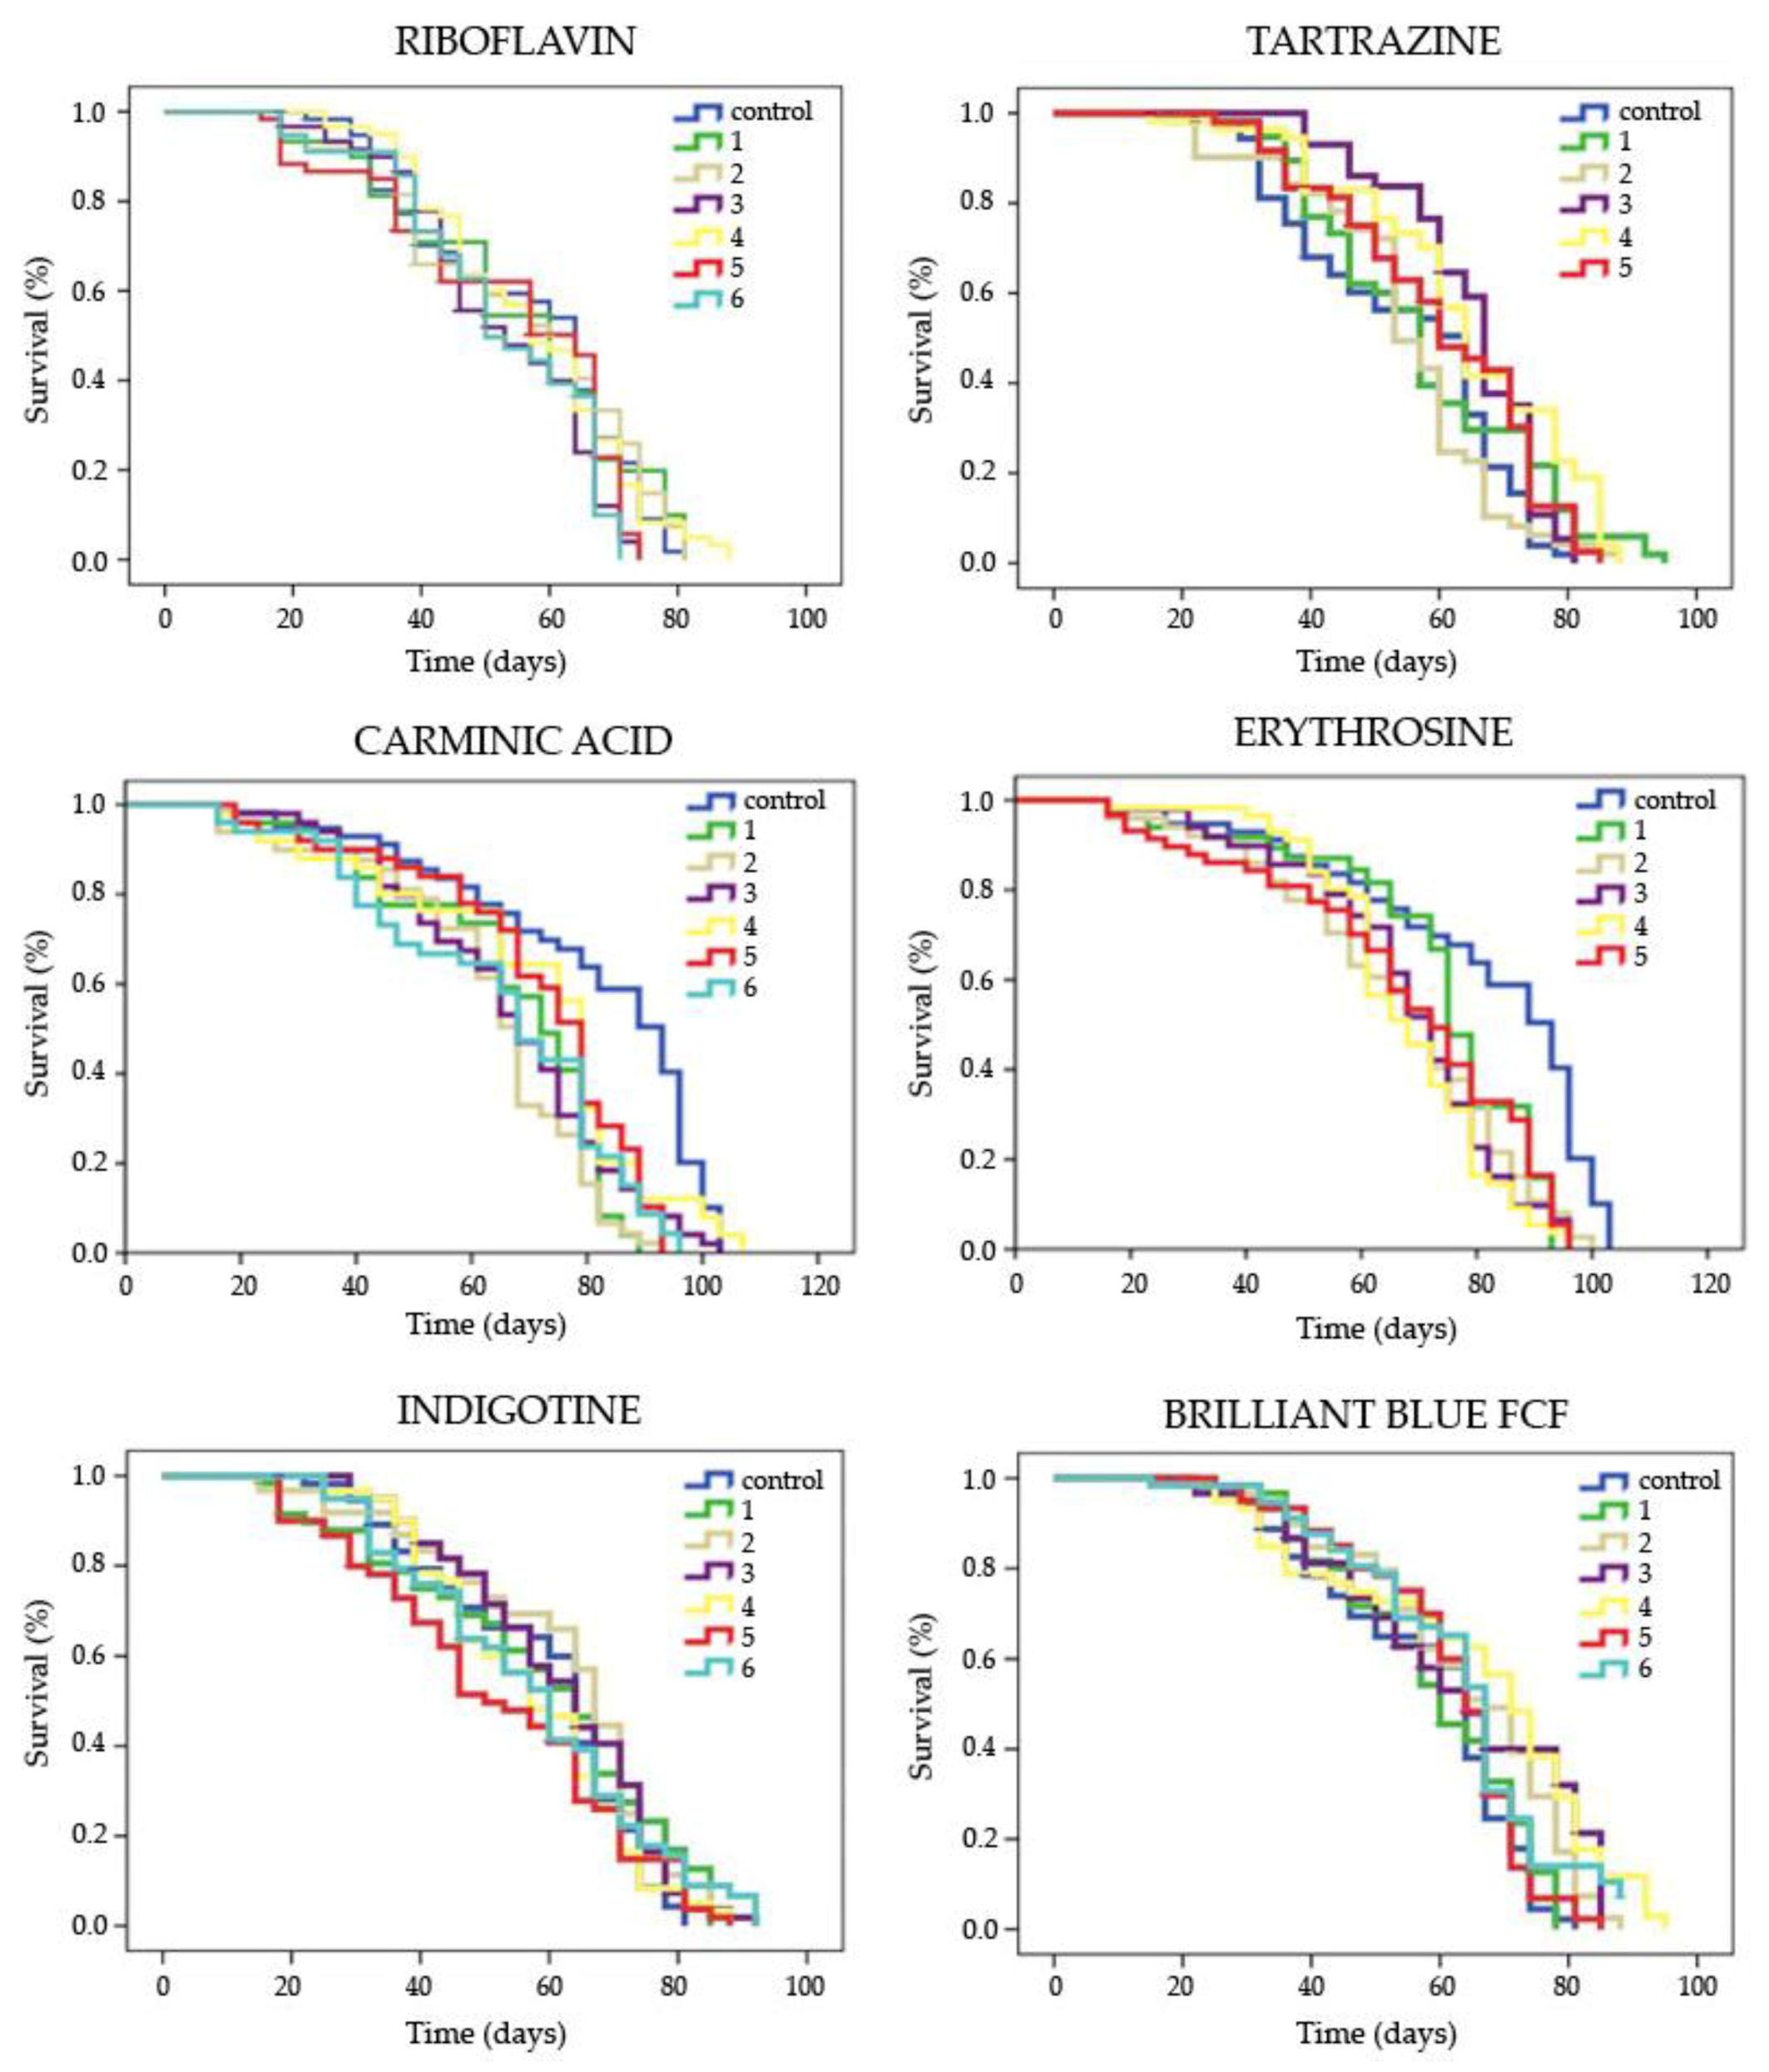
3.1.2. Lifespan
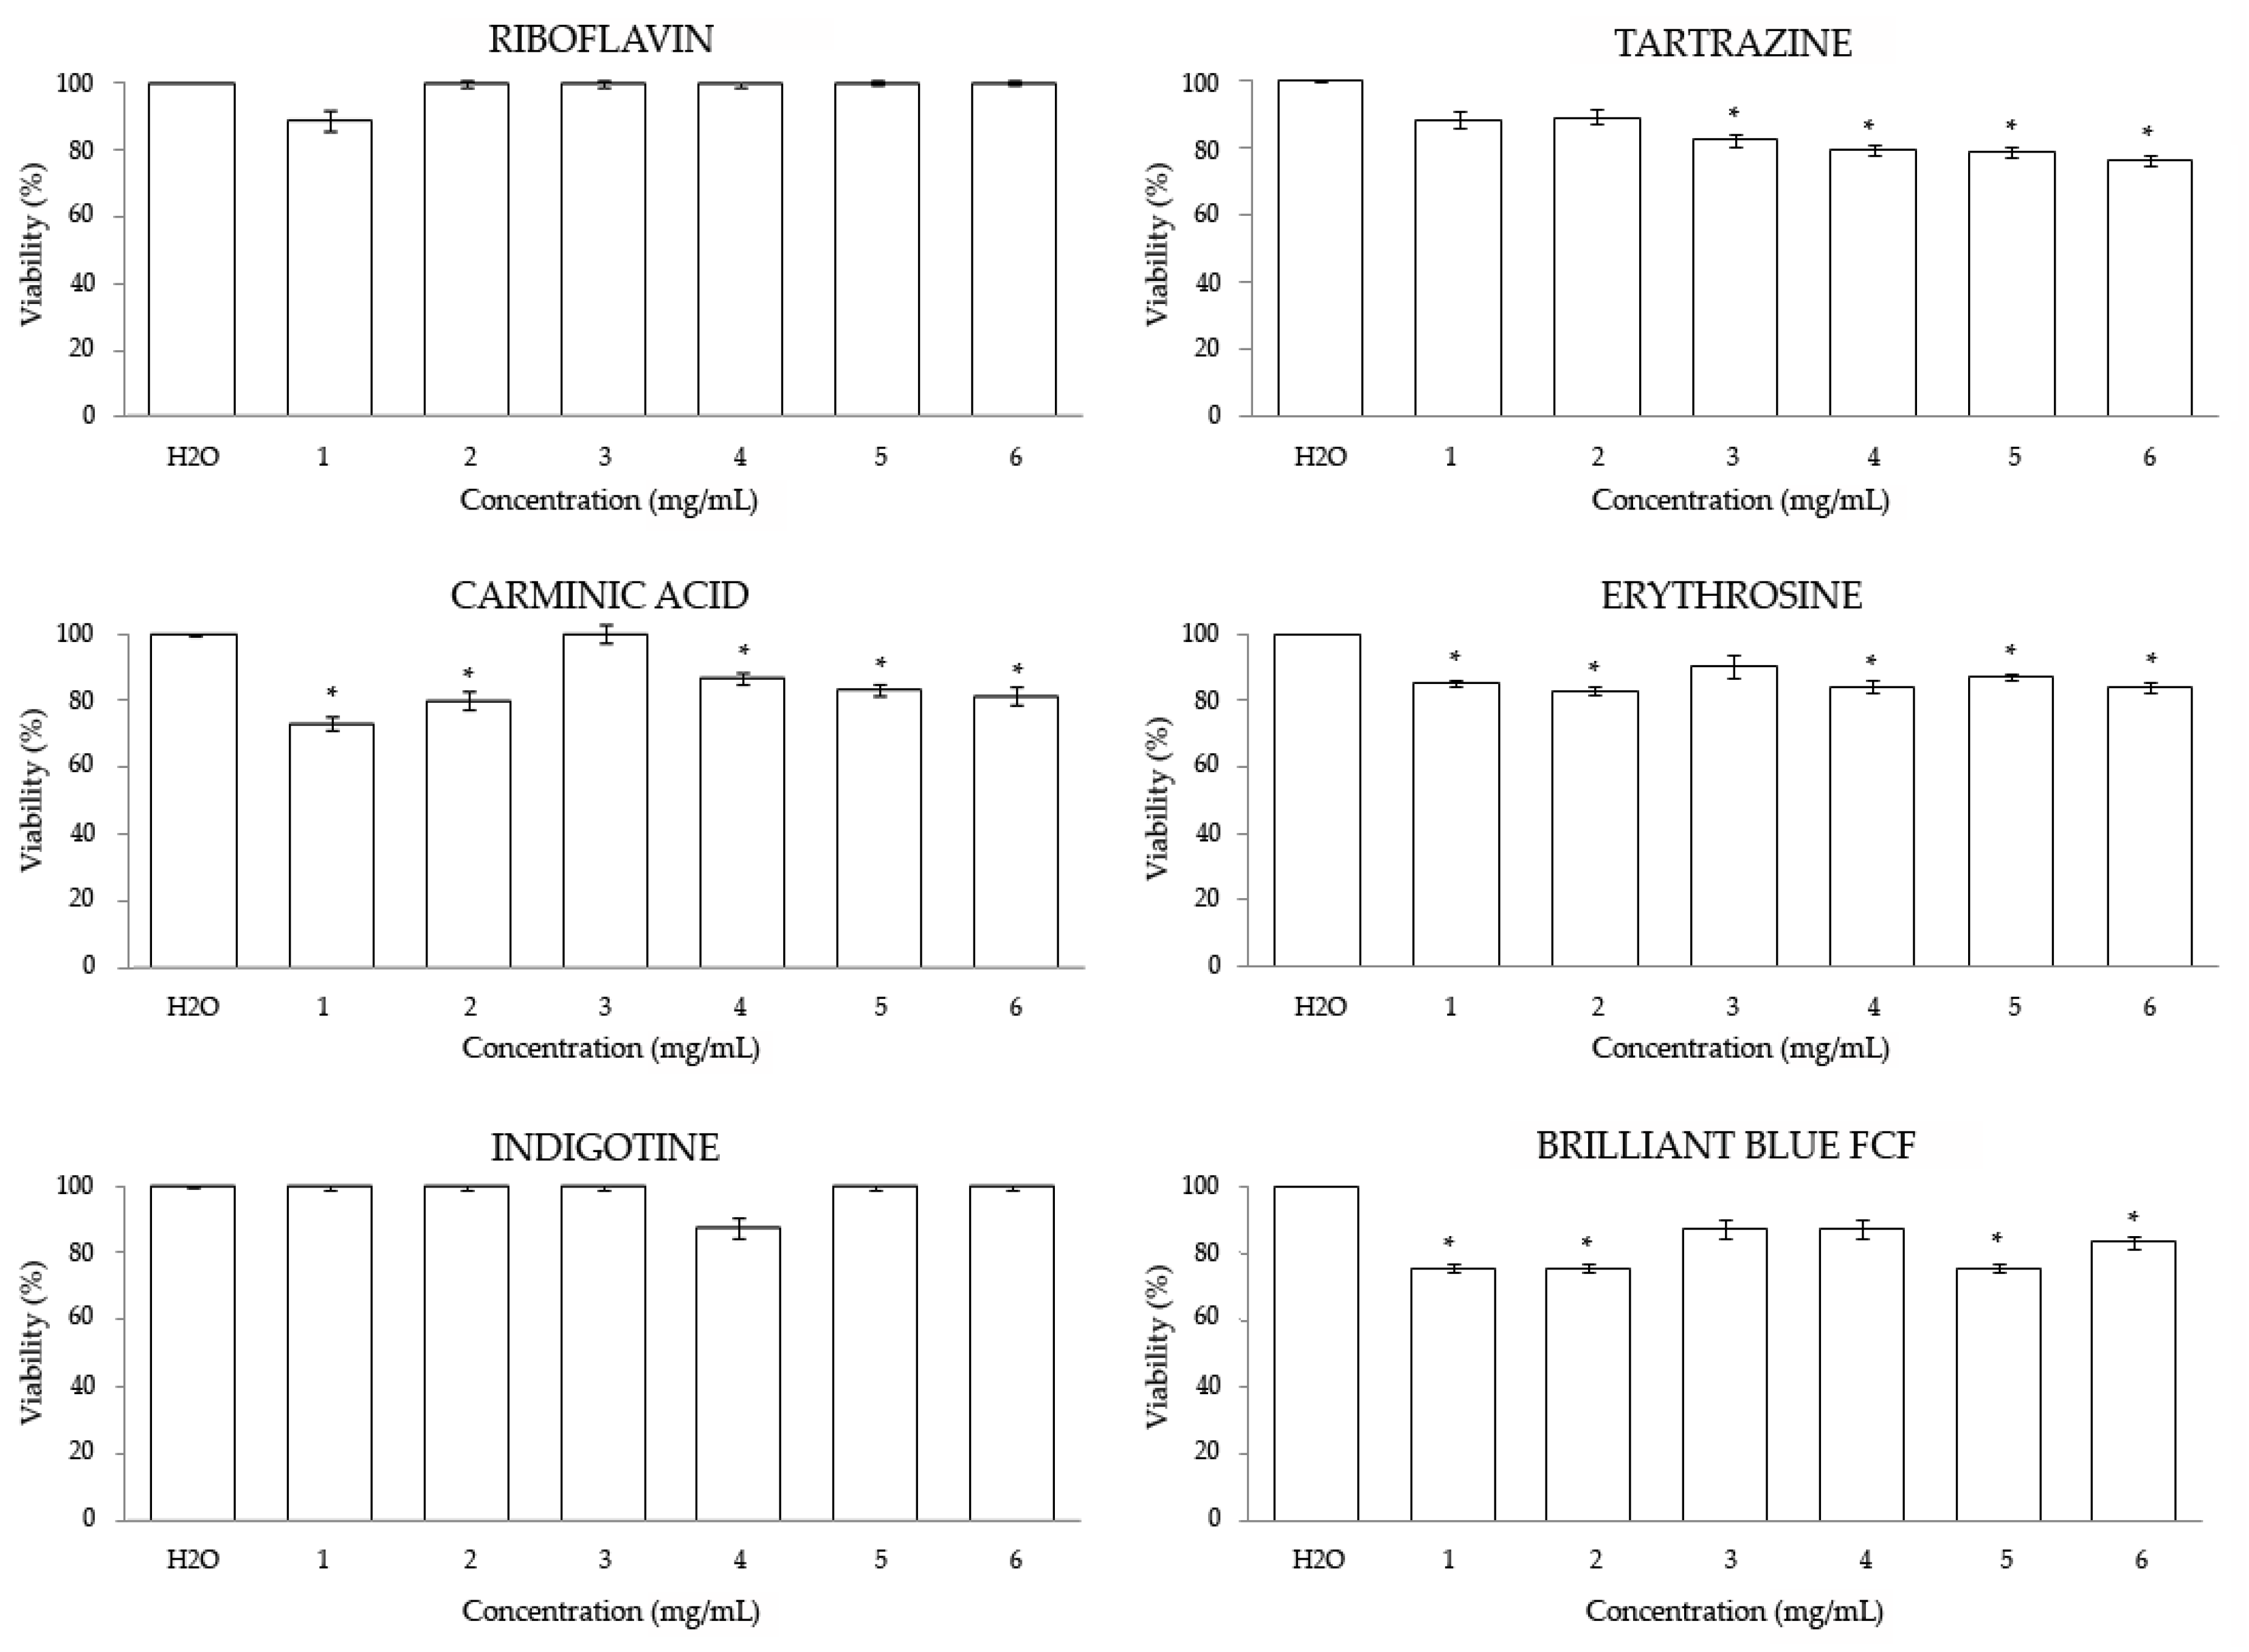
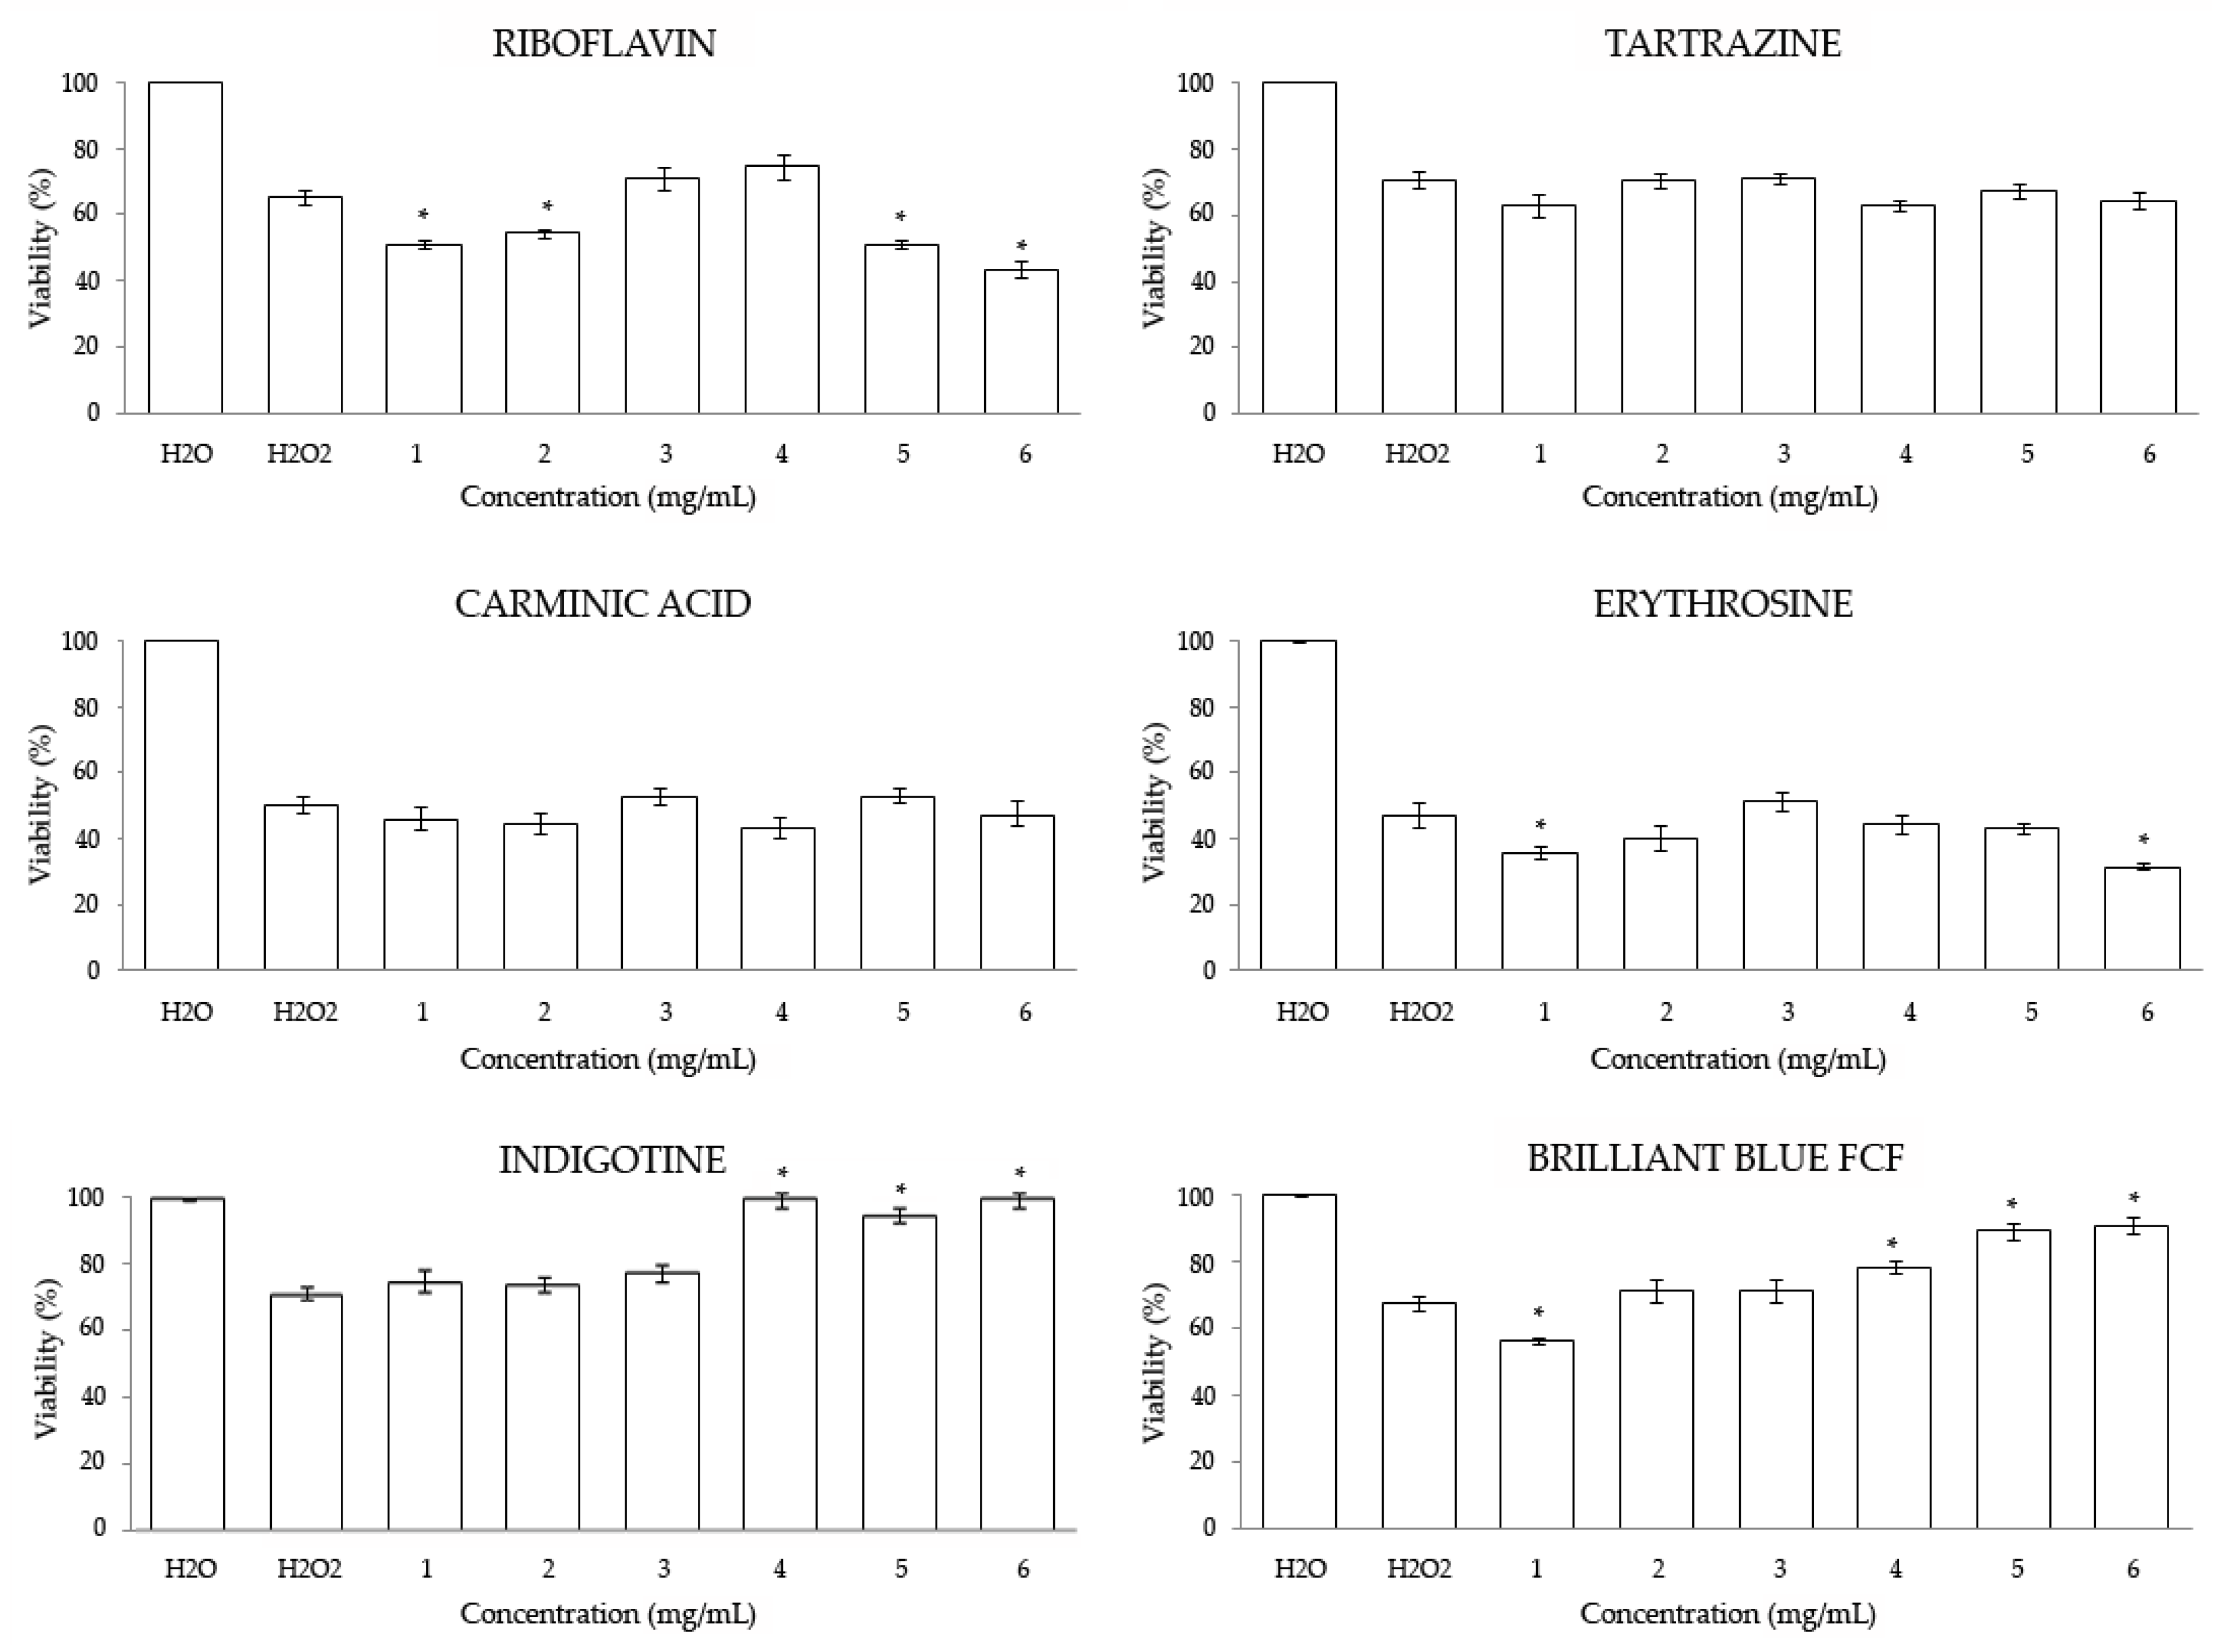
3.2. In Vitro
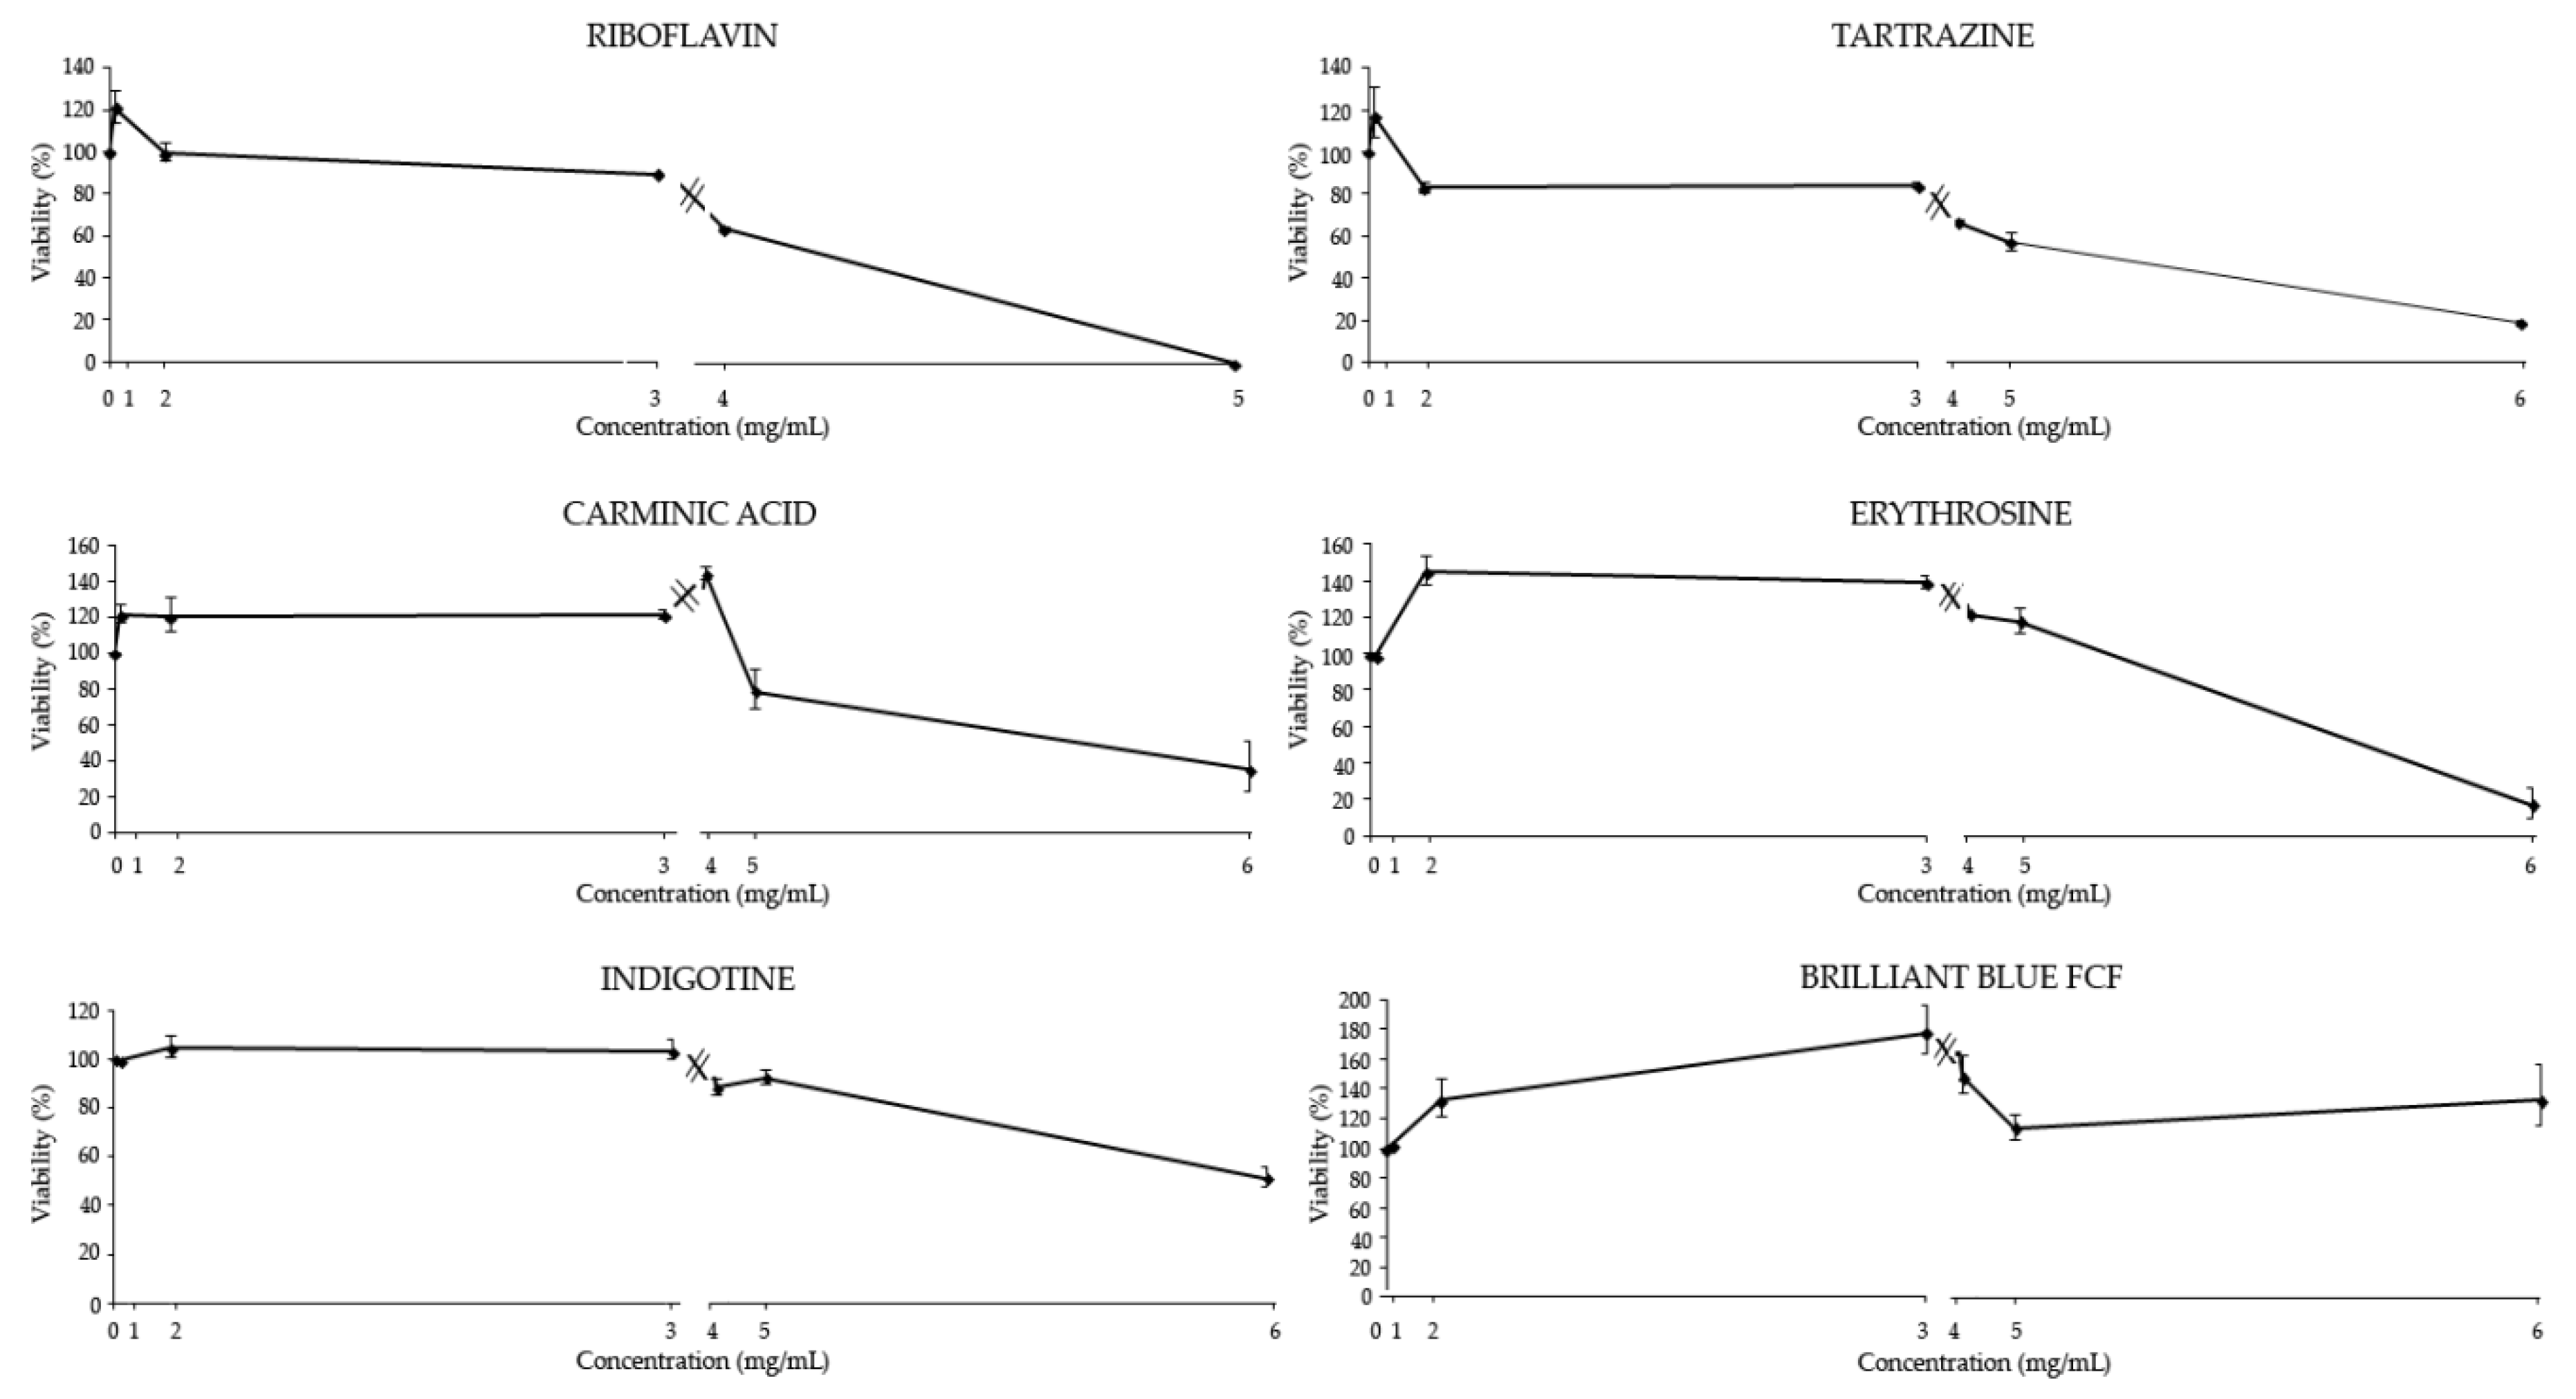
3.2.1. Cytotoxicity
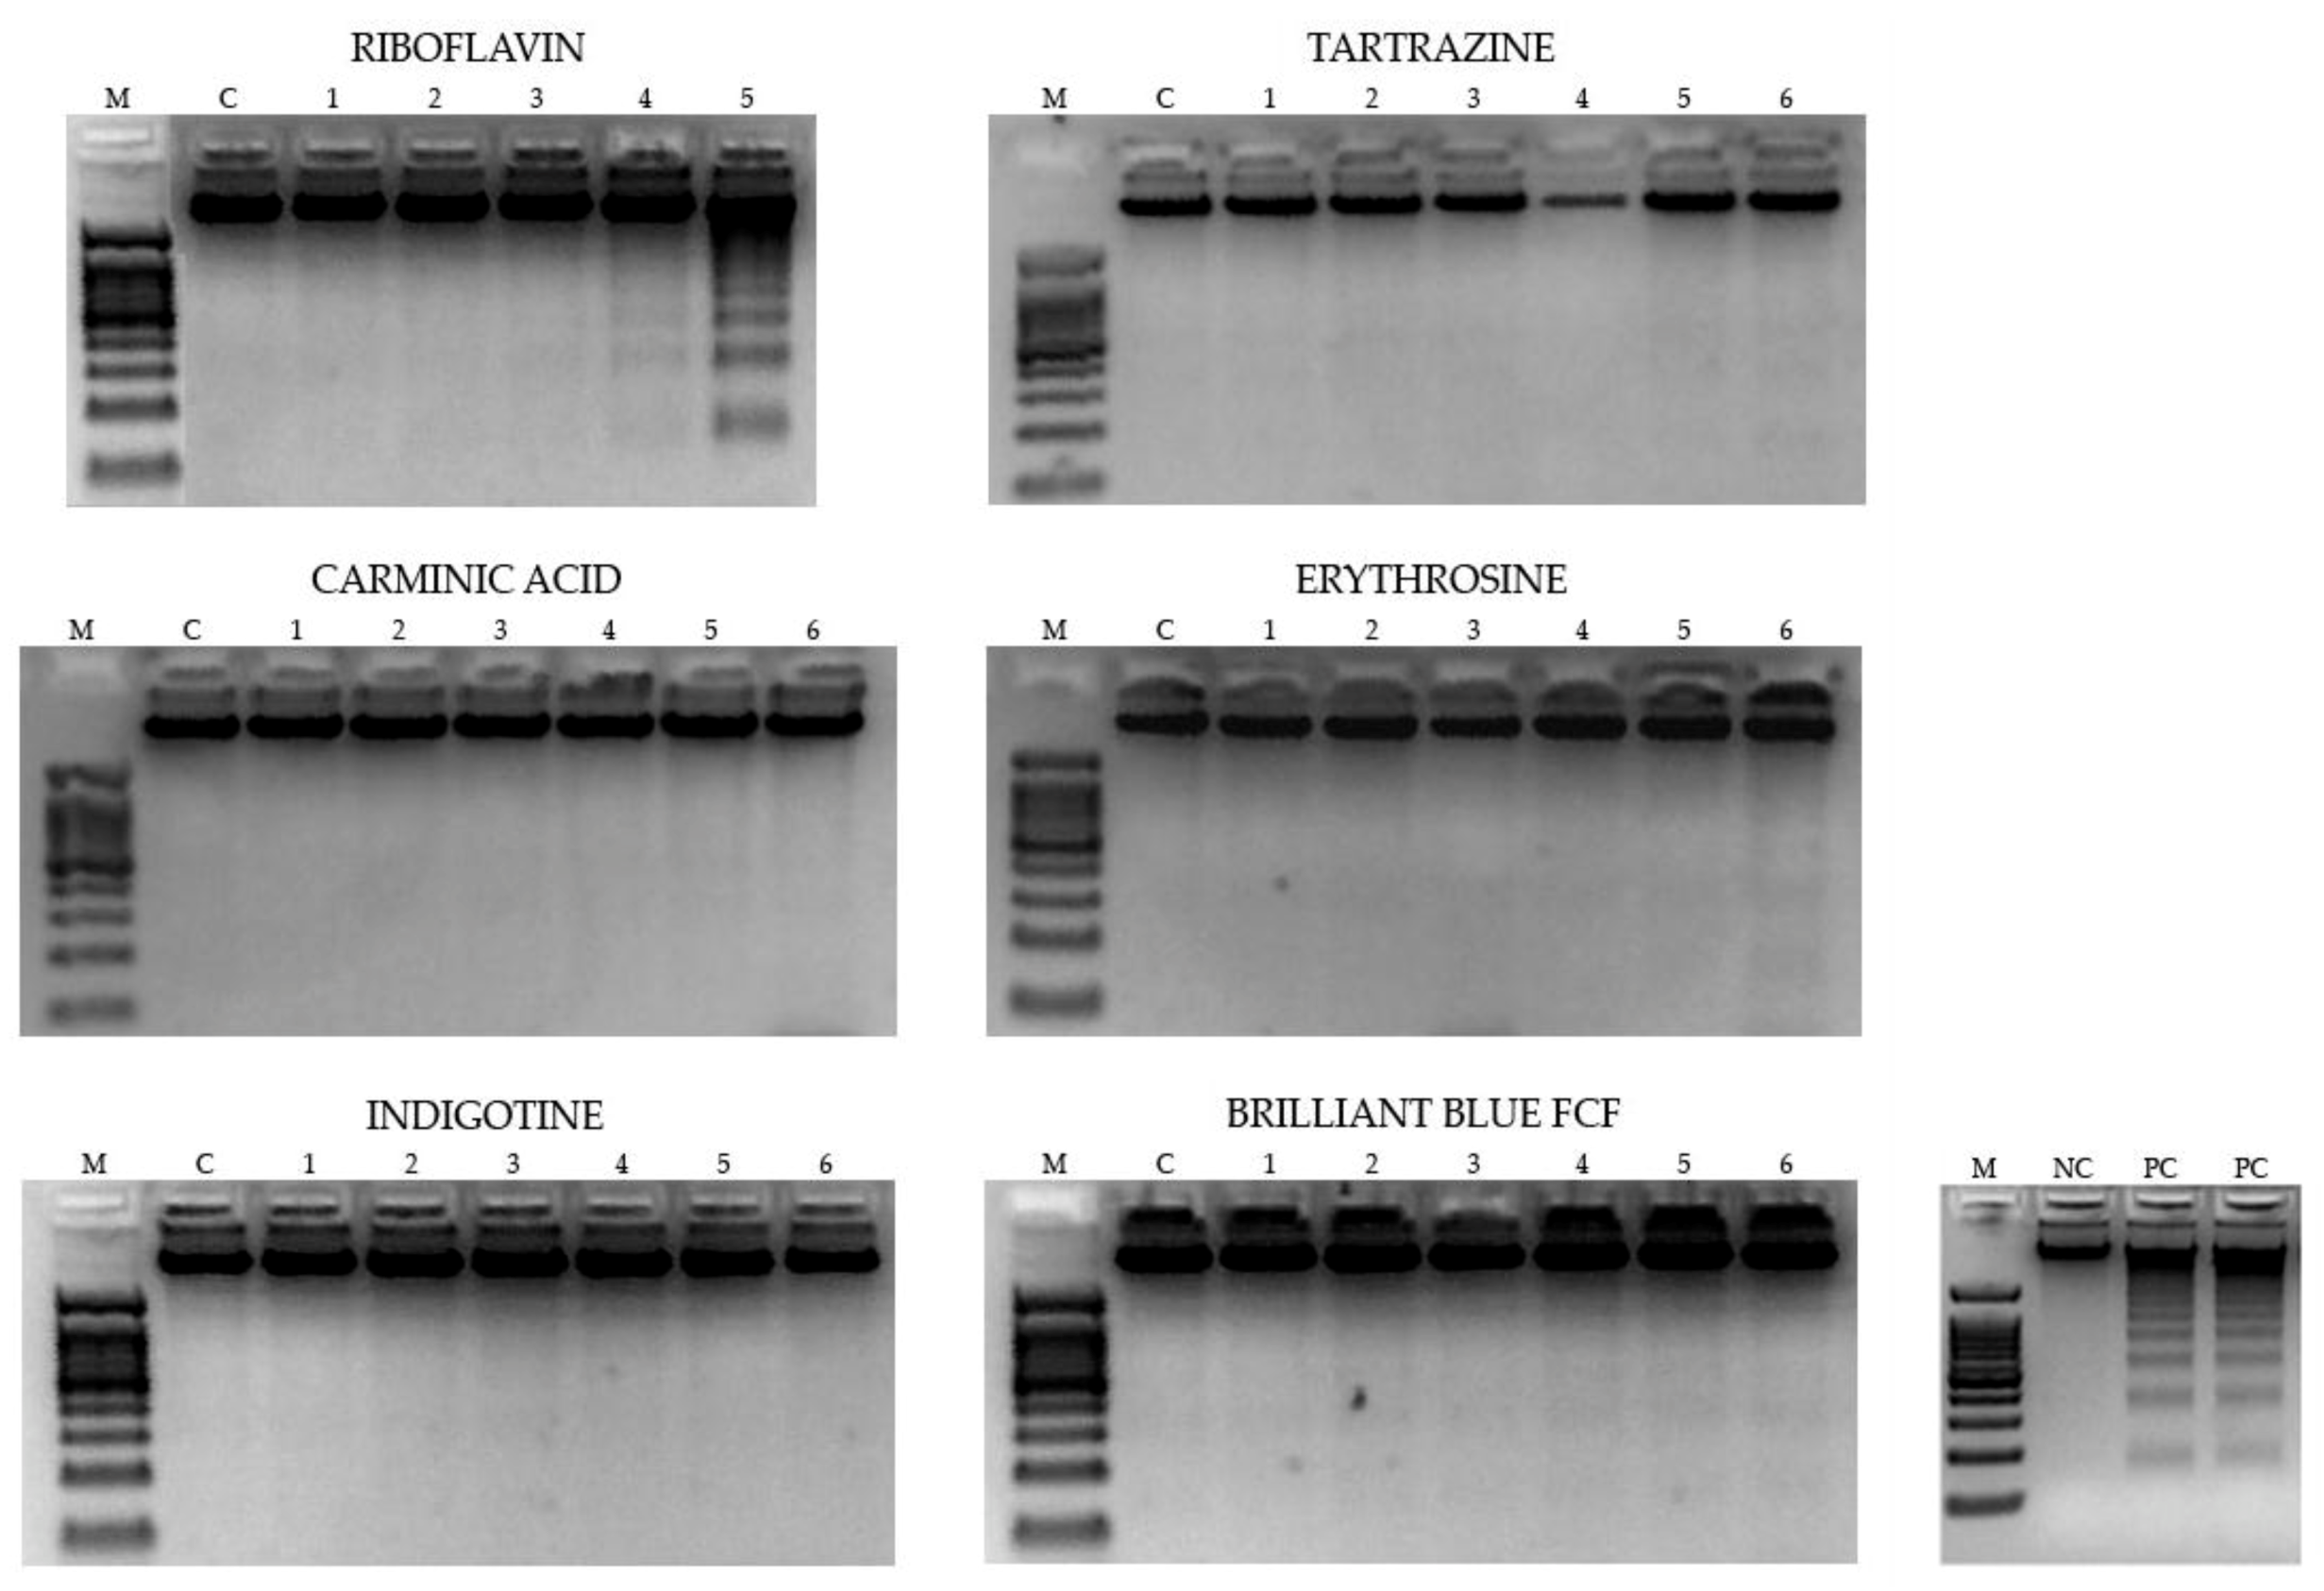
3.2.2. DNA Fragmentation
3.2.3. Methylation Status
4. Discussion
4.1. In Vivo
4.2. In Vitro
5. Conclusions
Author Contributions
Funding
Conflicts of Interest
References
- Food and Drug Administration (FDA). Available online: https://www.fda.gov/1 (accessed on 1 May 2019).
- Swaroop, V.; Roy, D.D.; Vijayakumar, T. Genotoxicity of synthetic food colorants. J. Food Sci. Eng. 2011, 1, 128. [Google Scholar]
- Juhlin, L.; Michaëlsson, G.; Zetterström, O. Urticaria and asthma induced by food-and-drug additives in patients with aspirin hypersensitivity. J. Allergy Clin. Immunol. 1972, 50, 92–98. [Google Scholar] [CrossRef]
- Vedanthan, P.K.; Menon, M.M.; Bell, T.D.; Bergin, D. Aspirin and tartrazine oral challenge: Incidence of adverse response in chronic childhood asthma. J. Allergy Clin. Immunol. 1977, 60, 8–13. [Google Scholar] [CrossRef]
- EFSA. Scientific Opinion on the Re-Evaluation of Riboflavin (e 101 (i)) and Riboflavin-5′-Phosphate Sodium (e 101 (ii)) as Food Additives. EFSA J. 2013, 11, 3357. [Google Scholar]
- Elmadfa, I. European Nutrition and Health Report 2009; Karger Medical and Scientific Publishers: Vienna, Austria, 2009; Volume 62. [Google Scholar]
- Kale, H.; Harikumar, P.; Kulkarni, S.; Nair, P.; Netrawali, M. Assessment of the genotoxic potential of riboflavin and lumiflavin: B. Effect of light. Mutat. Res. Genet. Toxicol. 1992, 298, 17–23. [Google Scholar] [CrossRef]
- Unna, K.; Greslin, J.G. Studies on the toxicity and pharmacology of riboflavin. J. Pharmacol. Exp. Ther. 1942, 76, 75–80. [Google Scholar]
- Komisyonu, A. European parliament and council directive 94/36/ec of 30 june 1994 on colours for use in foodstuffs. Off. J. Eur. Union L 1994, 237, 13–29. [Google Scholar]
- EFSA. Scientific opinion on the re-evaluation tartrazine (e 102). EFSA J. 2009, 7, 1331. [Google Scholar] [CrossRef]
- Sasaki, Y.F.; Kawaguchi, S.; Kamaya, A.; Ohshita, M.; Kabasawa, K.; Iwama, K.; Taniguchi, K.; Tsuda, S. The comet assay with 8 mouse organs: Results with 39 currently used food additives. Mutat. Res. Genet. Toxicol. Environ. Mutagenesis 2002, 519, 103–119. [Google Scholar] [CrossRef]
- McCann, D.; Barrett, A.; Cooper, A.; Crumpler, D.; Dalen, L.; Grimshaw, K.; Kitchin, E.; Lok, K.; Porteous, L.; Prince, E. Food additives and hyperactive behaviour in 3-year-old and 8/9-year-old children in the community: A randomised, double-blinded, placebo-controlled trial. Lancet 2007, 370, 1560–1567. [Google Scholar] [CrossRef]
- Novembre, E.; Dini, L.; Bernardini, R.; Resti, M.; Vierucci, A. Unusual reactions to food additives. Pediatr. Med. Chir. Med. Surg. Pediatrics 1992, 14, 39–42. [Google Scholar]
- Elhkim, M.O.; Héraud, F.; Bemrah, N.; Gauchard, F.; Lorino, T.; Lambré, C.; Frémy, J.M.; Poul, J.M. New considerations regarding the risk assessment on tartrazine: An update toxicological assessment, intolerance reactions and maximum theoretical daily intake in france. Regul. Toxicol. Pharmacol. 2007, 47, 308–316. [Google Scholar] [CrossRef]
- Bhatia, M.S. Allergy to tartrazine in psychotropic drugs. J. Clin. Psychiatry 2000, 61, 473–476. [Google Scholar] [CrossRef] [PubMed]
- Nettis, E.; Colanardi, M.; Ferrannini, A.; Tursi, A. Suspected tartrazine-induced acute urticaria/angioedema is only rarely reproducible by oral rechallenge. Clin. Exp. Allergy 2003, 33, 1725–1729. [Google Scholar] [CrossRef] [PubMed]
- Worm, M.; Vieth, W.; Ehlers, I.; Sterry, W.; Zuberbier, T. Increased leukotriene production by food additives in patients with atopic dermatitis and proven food intolerance. Clin. Exp. Allergy 2001, 31, 265–273. [Google Scholar] [CrossRef] [PubMed]
- Inomata, N.; Osuna, H.; Fujita, H.; Ogawa, T.; Ikezawa, Z. Multiple chemical sensitivities following intolerance to azo dye in sweets in a 5-year-old girl. Allergol. Int. 2006, 55, 203–205. [Google Scholar] [CrossRef][Green Version]
- Wüthrich, B.; Kägi, M.; Stücker, W. Anaphylactic reactions to ingested carmine (e120). Allergy 1997, 52, 1133–1137. [Google Scholar] [CrossRef] [PubMed]
- EFSA. Scientific opinion on the re-evaluation of cochineal, carminic acid, carmines (e 120) as a food additive. EFSA J. 2015, 13, 4288. [Google Scholar]
- Sarıkaya, R.; Selvi, M.; Erkoç, F. Evaluation of potential genotoxicity of five food dyes using the somatic mutation and recombination test. Chemosphere 2012, 88, 974–979. [Google Scholar] [CrossRef]
- DiCello, M.C.; Myc, A.; Baker, J.R., Jr.; Baldwin, J.L. Anaphylaxis after Ingestion of Carmine Colored Foods: Two Case Reports and a Review of the Literature, Allergy and Asthma Proceedings; OceanSide Publications: East Providence, RI, USA, 1999. [Google Scholar]
- Ferrer, Ð.; Marco, F.M.; Andreu, C.; Sempere, J.M. Occupational asthma to carmine in a butcher. Int. Arch. Allergy Immunol. 2005, 138, 243–250. [Google Scholar] [CrossRef]
- Helal, E.G.; Zaahkouk, S.A.; Mekkawy, H.A. Effect of some food colorants (synthetic and natural products) of young albino rats. I–liver and kidney functions. Egypt. J. Hosp. Med. 2000, 1, 103–113. [Google Scholar]
- Chequer, F.M.D.; de Paula Venâncio, V.; Bianchi, M.d.L.P.; Antunes, L.M.G. Genotoxic and mutagenic effects of erythrosine b, a xanthene food dye, on hepg2 cells. Food Chem. Toxicol. 2012, 50, 3447–3451. [Google Scholar] [CrossRef] [PubMed]
- Tuormaa, T.E. The adverse effects of food additives on health: A review of the literature with a special emphasis on childhood hyperactivity. J. Orthomol. Med. 1994, 9, 225. [Google Scholar]
- Mpountoukas, P.; Pantazaki, A.; Kostareli, E.; Christodoulou, P.; Kareli, D.; Poliliou, S.; Mourelatos, C.; Lambropoulou, V.; Lialiaris, T. Cytogenetic evaluation and DNA interaction studies of the food colorants amaranth, erythrosine and tartrazine. Food Chem. Toxicol. 2010, 48, 2934–2944. [Google Scholar] [CrossRef] [PubMed]
- EFSA. Scientific opinion on the re-evaluation of erythrosine (e 127) as a food additive. EFSA J. 2011, 9, 1854. [Google Scholar] [CrossRef]
- Ganesan, L.; Margolles-Clark, E.; Song, Y.; Buchwald, P. The food colorant erythrosine is a promiscuous protein–protein interaction inhibitor. Biochem. Pharmacol. 2011, 81, 810–818. [Google Scholar] [CrossRef] [PubMed]
- Hagiwara, M.; Watanabe, E.; Barrett, J.C.; Tsutsui, T. Assessment of genotoxicity of 14 chemical agents used in dental practice: Ability to induce chromosome aberrations in syrian hamster embryo cells. Mutat. Res. Genet. Toxicol. Environ. Mutagenesis 2006, 603, 111–120. [Google Scholar] [CrossRef]
- Mekkawy, H.A.; Massoud, A.; El-Zawahry, A. Mutagenic effects of the food color erythrosine in rats. Probl. Forensic Sci. 2000, 43, 184–191. [Google Scholar]
- Steingruber, E. Indigo and indigo colorants. In Ullmann’s Encyclopedia of Industrial Chemistry; Wiley-VCH Verlag GmbH & Co. KGaA: Weinheim, Germany, 2000. [Google Scholar]
- EFSA. Scientific opinion on the re-evaluation of indigo carmine (e 132) as a food additive. EFSA J. 2014, 12, 3768. [Google Scholar] [CrossRef]
- Dixit, A.; Goyal, R. Evaluation of reproductive toxicity caused by indigo carmine on male swiss albino mice. Pharmacology 2013, 1, 218–224. [Google Scholar]
- EFSA. Scientific opinion on the re-evaluation of brilliant blue fcf (e 133) as a food additive. EFSA J. 2010, 8, 1853. [Google Scholar] [CrossRef]
- Aboel-Zahab, H.; El-Khyat, Z.; Sidhom, G.; Awadallah, R.; Abdel-Al, W.; Mahdy, K. Physiological effects of some synthetic food colouring additives on rats. Boll. Chim. Farm. 1997, 136, 615–627. [Google Scholar] [PubMed]
- Lau, K.; McLean, W.G.; Williams, D.P.; Howard, C.V. Synergistic interactions between commonly used food additives in a developmental neurotoxicity test. Toxicol. Sci. 2005, 90, 178–187. [Google Scholar] [CrossRef] [PubMed]
- Borzelleca, J.; Depukat, K.; Hallagan, J. Lifetime toxicity/carcinogenicity studies of fd & c blue no. 1 (brilliant blue fcf) in rats and mice. Food Chem. Toxicol. 1990, 28, 221–234. [Google Scholar]
- Lucarelli, M.R.; Shirk, M.B.; Julian, M.W.; Crouser, E.D. Toxicity of food drug and cosmetic blue no. 1 dye in critically ill patients. Chest 2004, 125, 793–795. [Google Scholar] [CrossRef]
- Bier, E. Drosophila, the golden bug, emerges as a tool for human genetics. Nat. Rev. Genet. 2005, 6, 9. [Google Scholar] [CrossRef]
- Graf, U.; Würgler, F.; Katz, A.; Frei, H.; Juon, H.; Hall, C.; Kale, P. Somatic mutation and recombination test in Drosophila melanogaster. Environ. Mutagenesis 1984, 6, 153–188. [Google Scholar] [CrossRef]
- Ja, W.W.; Carvalho, G.B.; Mak, E.M.; de la Rosa, N.N.; Fang, A.Y.; Liong, J.C.; Brummel, T.; Benzer, S. Prandiology of Drosophila and the cafe assay. Proc. Natl. Acad. Sci. USA 2007, 104, 8253–8256. [Google Scholar] [CrossRef]
- Gonzalez, C. Drosophila melanogaster: A model and a tool to investigate malignancy and identify new therapeutics. Nat. Rev. Cancer 2013, 13, 172–183. [Google Scholar] [CrossRef]
- Lints, F.A.; Soliman, M.H. Drosophila as a Model Organism for Ageing Studies; Springer: Boston, MA, USA, 1988. [Google Scholar]
- Rudrapatna, V.A.; Cagan, R.L.; Das, T.K. Drosophila cancer models. Dev. Dyn. 2012, 241, 107–118. [Google Scholar] [CrossRef]
- Yan, J.; Huen, D.; Morely, T.; Johnson, G.; Gubb, D.; Roote, J.; Adler, P.N. The multiple-wing-hairs gene encodes a novel gbd-fh3 domain-containing protein that functions both prior to and after wing hair initiation. Genetics 2008, 180, 219–228. [Google Scholar] [CrossRef] [PubMed]
- Ren, N.; Charlton, J.; Adler, P.N. The flare gene, which encodes the aip1 protein of Drosophila, functions to regulate f-actin disassembly in pupal epidermal cells. Genetics 2007, 176, 2223–2234. [Google Scholar] [CrossRef] [PubMed]
- Anter, J.; Campos-Sanchez, J.; Hamss, R.E.; Rojas-Molina, M.; Munoz-Serrano, A.; Analla, M.; Alonso-Moraga, A. Modulation of genotoxicity by extra-virgin olive oil and some of its distinctive components assessed by use of the Drosophila wing-spot test. Mutat. Res. 2010, 703, 137–142. [Google Scholar] [CrossRef] [PubMed]
- Merinas-Amo, T.; Tasset-Cuevas, I.; Díaz-Carretero, A.M.; Alonso-Moraga, A.; Calahorro, F. Role of choline in the modulation of degenerative processes: In vivo and in vitro studies. J. Med. Food 2017, 20, 223–234. [Google Scholar] [CrossRef]
- López, A.; Xamena, N.; Marcos, R.; Velázquez, A. Germ cells microsatellite instability: The effect of different mutagens in a mismatch repair mutant of Drosophila (spel1). Mutat. Res. Genet. Toxicol. Environ. Mutagenesis 2002, 514, 87–94. [Google Scholar] [CrossRef]
- Allen, R.; Tresini, M. Oxidative stress and gene regulation. Free Radic. Biol. Med. 2000, 28, 463–499. [Google Scholar] [CrossRef]
- Veal, E.A.; Day, A.M.; Morgan, B.A. Hydrogen peroxide sensing and signaling. Mol. Cell 2007, 26, 1–14. [Google Scholar] [CrossRef] [PubMed]
- Fitzpatrick, F.A. Inflammation, carcinogenesis and cancer. Int. Immunopharmacol. 2001, 1, 1651–1667. [Google Scholar] [CrossRef]
- Burcham, P.C. Genotoxic Lipid Peroxidation Products: Their DNA Damaging Properties and Role in Formation of Endogenous DNA Adducts; Oxford University Press: Oxford, UK, 1998. [Google Scholar]
- Feig, D.I.; Reid, T.M.; Loeb, L.A. Reactive oxygen species in tumorigenesis. Cancer Res. 1994, 54, 1890–1894. [Google Scholar]
- Vivancos, A.P.; Castillo, E.A.; Biteau, B.; Nicot, C.; Ayte, J.; Toledano, M.B.; Hidalgo, E. A cysteine-sulfinic acid in peroxiredoxin regulates h2o2-sensing by the antioxidant pap1 pathway. Proc. Natl. Acad. Sci. USA 2005, 102, 8875–8880. [Google Scholar] [CrossRef]
- Cerda, S.; Weitzman, S. Influence of oxygen radical injury on DNA methylation. Mutat. Res. Rev. Mutat. Res. 1997, 386, 141–152. [Google Scholar] [CrossRef]
- Ghosh, R.; Mitchell, D.L. Effect of oxidative DNA damage in promoter elements on transcription factor binding. Nucleic Acids Res. 1999, 27, 3213–3218. [Google Scholar] [CrossRef] [PubMed]
- Hu, J.J.; Dubin, N.; Kurland, D.; Ma, B.L.; Roush, G.C. The effects of hydrogen peroxide on DNA repair activities. Mutat. Res. 1995, 336, 193–201. [Google Scholar] [CrossRef]
- Romero-Jiménez, M.; Campos-Sánchez, J.; Analla, M.; Muñoz-Serrano, A.; Alonso-Moraga, Á. Genotoxicity and anti-genotoxicity of some traditional medicinal herbs. Mutat. Res. Genet. Toxicol. Environ. Mutagenesis 2005, 585, 147–155. [Google Scholar] [CrossRef] [PubMed]
- Tasset-Cuevas, I.; Fernandez-Bedmar, Z.; Lozano-Baena, M.D.; Campos-Sanchez, J.; de Haro-Bailon, A.; Munoz-Serrano, A.; Alonso-Moraga, A. Protective effect of borage seed oil and gamma linolenic acid on DNA: In vivo and in vitro studies. PLoS ONE 2013, 8, e56986. [Google Scholar] [CrossRef] [PubMed]
- Soh, J.W.; Hotic, S.; Arking, R. Dietary restriction in Drosophila is dependent on mitochondrial efficiency and constrained by pre-existing extended longevity. Mech. Ageing Dev. 2007, 128, 581–593. [Google Scholar] [CrossRef] [PubMed]
- Gallagher, R.; Collins, S.; Trujillo, J.; McCredie, K.; Ahearn, M.; Tsai, S.; Metzgar, R.; Aulakh, G.; Ting, R.; Ruscetti, F.; et al. Characterization of the continuous, differentiating myeloid cell line (hl-60) from a patient with acute promyelocytic leukemia. Blood 1979, 54, 713–733. [Google Scholar]
- Merinas-Amo, T.; Tasset-Cuevas, I.; Díaz-Carretero, A.M.; Alonso-Moraga, Á.; Calahorro, F. In vivo and in vitro studies of the role of lyophilised blond lager beer and some bioactive components in the modulation of degenerative processes. J. Funct. Foods 2016, 27, 274–294. [Google Scholar] [CrossRef]
- Merinas-Amo, T.; Merinas-Amo, R.; Alonso-Moraga, A. A clinical pilot assay of beer consumption: Modulation in the methylation status patterns of repetitive sequences. Sylwan 2017, 161, 134–156. [Google Scholar]
- Deininger, P.L.; Moran, J.V.; Batzer, M.A.; Kazazian, H.H. Mobile elements and mammalian genome evolution. Curr. Opin. Genet. Dev. 2003, 13, 651–658. [Google Scholar] [CrossRef]
- Ehrlich, M. DNA hypomethylation, cancer, the immunodeficiency, centromeric region instability, facial anomalies syndrome and chromosomal rearrangements. J. Nutr. 2002, 132, 2424S–2429S. [Google Scholar] [CrossRef] [PubMed]
- Lee, C.; Wevrick, R.; Fisher, R.; Ferguson-Smith, M.; Lin, C. Human centromeric dnas. Hum. Genet. 1997, 100, 291–304. [Google Scholar] [CrossRef] [PubMed]
- Weiner, A.M. Sines and lines: The art of biting the hand that feeds you. Curr. Opin. Cell Biol. 2002, 14, 343–350. [Google Scholar] [CrossRef]
- Weisenberger, D.J.; Campan, M.; Long, T.I.; Kim, M.; Woods, C.; Fiala, E.; Ehrlich, M.; Laird, P.W. Analysis of repetitive element DNA methylation by methylight. Nucleic Acids Res. 2005, 33, 6823–6836. [Google Scholar] [CrossRef]
- Nikolaidis, G.; Raji, O.Y.; Markopoulou, S.; Gosney, J.R.; Bryan, J.; Warburton, C.; Walshaw, M.; Sheard, J.; Field, J.K.; Liloglou, T. DNA methylation biomarkers offer improved diagnostic efficiency in lung cancer. Cancer Res. 2012, 72, 5692–5701. [Google Scholar] [CrossRef]
- Liloglou, T.; Bediaga, N.G.; Brown, B.R.; Field, J.K.; Davies, M.P. Epigenetic biomarkers in lung cancer. Cancer Lett. 2014, 342, 200–212. [Google Scholar] [CrossRef] [PubMed]
- Anter, J.; Romero-Jimenez, M.; Fernandez-Bedmar, Z.; Villatoro-Pulido, M.; Analla, M.; Alonso-Moraga, A.; Munoz-Serrano, A. Antigenotoxicity, cytotoxicity, and apoptosis induction by apigenin, bisabolol, and protocatechuic acid. J. Med. Food 2011, 14, 276–283. [Google Scholar] [CrossRef]
- Roman-Gomez, J.; Jimenez-Velasco, A.; Agirre, X.; Castillejo, J.A.; Navarro, G.; San Jose-Eneriz, E.; Garate, L.; Cordeu, L.; Cervantes, F.; Prosper, F. Repetitive DNA hypomethylation in the advanced phase of chronic myeloid leukemia. Leuk. Res. 2008, 32, 487–490. [Google Scholar] [CrossRef] [PubMed]
- Fukuwatari, T.; Kuzuya, M.; Satoh, S.; Shibata, K. Effects of excess vitamin b1 or vitamin b2 on growth and urinary excretion of water-soluble vitamins in weaning rats. Shokuhin Eiseigaku Zasshi J. Food Hyg. Soc. Jpn. 2009, 50, 70–74. [Google Scholar] [CrossRef][Green Version]
- Oettel, H.; Frohberg, H.; Nothdurft, H.; Wilhelm, G. Die prüfung einiger synthetischer farbstoffe auf ihre eignung zur lebensmittelfärbung. Arch. Toxicol. 1965, 21, 9–29. [Google Scholar]
- Borzelleca, J.; Hogan, G. Chronic toxicity/carcinogenicity study of fd & c blue no. 2 in mice. Food Chem. Toxicol. 1985, 23, 719–722. [Google Scholar] [PubMed]
- Borzelleca, J.; Hallagan, J. Lifetime toxicity/carcinogenicity study of fd & c red no. 3 (erythrosine) in mice. Food Chem. Toxicol. 1987, 25, 735–737. [Google Scholar] [PubMed]
- Tsujita, J. Comparison of protective activity of dietafy fiber against the toxicities of various food colors in rats. Nutr. Rep. Int. 1979, 20, 635–642. [Google Scholar]
- Hansen, W.; Fitzhugh, O.; Nelson, A.; Davis, K. Chronic toxicity of two food colors, brilliant blue fcf and indigotine. Toxicol. Appl. Pharmacol. 1966, 8, 29–36. [Google Scholar] [CrossRef]
- Scotter, M.; Castle, L. Chemical interactions between additives in foodstuffs: A review. Food Addit. Contam. 2004, 21, 93–124. [Google Scholar] [CrossRef] [PubMed]
- Maekawa, A.; Matsuoka, C.; Onodera, H.; Tanigawa, H.; Furuta, K.; Kanno, J.; Jang, J.; Hayashi, Y.; Ogiu, T. Lack of carcinogenicity of tartrazine (fd & c yellow no. 5) in the f344 rat. Food Chem. Toxicol. 1987, 25, 891–896. [Google Scholar]
- Moutinho, I.; Bertges, L.; Assis, R. Prolonged use of the food dye tartrazine (fd&c yellow n° 5) and its effects on the gastric mucosa of wistar rats. Braz. J. Biol. 2007, 67, 141–145. [Google Scholar]
- Ford, G.; Gopal, T.; Grant, D.; Gaunt, I.; Evans, J.; Butler, W. Chronic toxicity/carcinogenicity study of carmine of cochineal in the rat. Food Chem. Toxicol. 1987, 25, 897–902. [Google Scholar] [CrossRef]
- Hiasa, Y.; Ohshima, M.; Kitahori, Y.; Konishi, N.; Shimoyama, T.; Sakaguchi, Y.; Hashimoto, H.; Minami, S.; Kato, Y. The promoting effects of food dyes, erythrosine (red 3) and rose bengal b (red 105), on thyroid tumors in partially thyroidectomized n-bis (2-hydroxypropyl)-nitrosamine-treated rats. Jpn. J. Cancer Res. 1988, 79, 314–319. [Google Scholar] [CrossRef]
- Collins, T.; Long, E. Effects of chronic oral administration of erythrosine in the mongolian gerbil. Food Cosmet. Toxicol. 1976, 14, 233–248. [Google Scholar] [CrossRef]
- Masannat, Y.A.; Hanby, A.; Horgan, K.; Hardie, L.J. DNA damaging effects of the dyes used in sentinel node biopsy: Possible implications for clinical practice. J. Surg. Res. 2009, 154, 234–238. [Google Scholar] [CrossRef]
- Davies, J.; Burke, D.; Olliver, J.; Hardie, L.; Wild, C.; Routledge, M. The Induction of DNA Damage by Methylene Blue but Not by Indigo Carmine in Human Colonocytes In Vitro and In Vivo, Mutagenesis; Oxford Univ Press Great Clarendon St: Oxford, UK, 2006. [Google Scholar]
- Tsuda, S.; Murakami, M.; Matsusaka, N.; Kano, K.; Taniguchi, K.; Sasaki, Y.F. DNA damage induced by red food dyes orally administered to pregnant and male mice. Toxicol. Sci. 2001, 61, 92–99. [Google Scholar] [CrossRef]
- Durnev, A.; Oreshchenko, A.; Kulakova, A. Analysis of cytogenetic activity of food dyes. Vopr. Meditsinskoi khimii 1995, 41, 50–53. [Google Scholar]
- Miyachi, T.; Tsutsui, T. Ability of 13 chemical agents used in dental practice to induce sister-chromatid exchanges in syrian hamster embryo cells. Odontology 2005, 93, 24–29. [Google Scholar] [CrossRef] [PubMed]
- Bhargav, D.; Singh, M.P.; Murthy, R.C.; Mathur, N.; Misra, D.; Saxena, D.K.; Chowdhuri, D.K. Toxic potential of municipal solid waste leachates in transgenic Drosophila melanogaster (hsp70-lacz): Hsp70 as a marker of cellular damage. Ecotoxicol. Environ. Saf. 2008, 69, 233–245. [Google Scholar] [CrossRef] [PubMed]
- Coulom, H.; Birman, S. Chronic exposure to rotenone models sporadic parkinson’s disease in Drosophila melanogaster. J. Neurosci. 2004, 24, 10993–10998. [Google Scholar] [CrossRef]
- Dean, B.J. Recent findings on the genetic toxicology of benzene, toluene, xylenes and phenols. Mutat. Res. Genet. Toxicol. 1985, 154, 153–181. [Google Scholar] [CrossRef]
- Hosamani, R. Acute exposure of Drosophila melanogaster to paraquat causes oxidative stress and mitochondrial dysfunction. Arch. Insect Biochem. Physiol. 2013, 83, 25–40. [Google Scholar] [CrossRef]
- Siddique, Y.H.; Fatima, A.; Jyoti, S.; Naz, F.; Khan, W.; Singh, B.R.; Naqvi, A.H. Evaluation of the toxic potential of graphene copper nanocomposite (gcnc) in the third instar larvae of transgenic rDosophila melanogaster (hsp70-lacz) bg 9. PLoS ONE 2013, 8, e80944. [Google Scholar] [CrossRef]
- Lloyd, T.E.; Taylor, J.P. Flightless flies: Drosophila models of neuromuscular disease. Ann. N. Y. Acad. Sci. 2010, 1184. [Google Scholar] [CrossRef]
- Collins, S.J. The hl-60 promyelocytic leukemia cell line: Proliferation, differentiation, and cellular oncogene expression. Blood 1987, 70, 1233–1244. [Google Scholar] [PubMed]


| Food Coloring | ADI (Mg/Kg) | Tested Concentrations in Drosophila (mg/mL) * | ||||||
|---|---|---|---|---|---|---|---|---|
| 1 | 2 | 3 | 4 | 5 | 6 | |||
| E-101 | Riboflavin | 0.5 | 0.0000025 | 0.000025 | 0.00025 | 0.0025 | 0.025 | 0.25 |
| E-102 | Tartrazine | 7.5 | 0.0000375 | 0.000375 | 0.00375 | 0.0375 | 0.375 | 3.75 |
| E-120 | Carminic Acid | 5 | 0.000025 | 0.00025 | 0.0025 | 0.025 | 0.25 | 2.5 |
| E-127 | Erythrosine | 0.1 | 0.0000005 | 0.000005 | 0.00005 | 0.0005 | 0.005 | 0.05 |
| E-132 | Indigotine | 5 | 0.000025 | 0.00025 | 0.0025 | 0.025 | 0.25 | 2.5 |
| E-133 | Brilliant Blue FCF | 6 | 0.0000005 | 0.000005 | 0.00005 | 0.0005 | 0.005 | 0.05 |
| Reaction ID | GenBank Number | Amplicon Start | Amplicon End | Forward Primer Sequence 5’ to 3’ (N) | Reverse Primer Sequence 5’ to 3’ (N) | GC Content (%) | |
|---|---|---|---|---|---|---|---|
| Forward Reverse | |||||||
| Alu C4 | Consensus Sequence | 1 | 98 | GGTTAGGTATAGTGGTTTATATTTGTAATTTTAGTA (36) | ATTAACTAAACTAATCTTAAACTCCTAACCTCA (33) | 25 | 27.3 |
| Alu M1 | Y07755 | 5059 | 5164 | ATTATGTTAGTTAGGATGGTTTCGATTTT (29) | CAATCGACCGAACGCGA (17) | 27.6 | 58.8 |
| LINE-1 | X52235 | 251 | 331 | GGACGTATTTGGAAAATCGGG (21) | AATCTCGCGATACGCCGTT (19) | 47.6 | 52.6 |
| Sat-α | M38468 | 139 | 260 | TGATGGAGTATTTTTAAAATATACGTTTTGTAGT (34) | AATTCTAAAAATATTCCTCTTCAATTACGTAAA (33) | 23.5 | 21.2 |
| Food coloring | Concentration | Mean Lifespan 1 (days) | Mean Healthspan 1 (days) | ||
|---|---|---|---|---|---|
| Riboflavin | Control | 55.985 | 31.399 | ||
| 1 | 55.019 | ns | 27.607 | ns | |
| 2 | 55.864 | ns | 29.110 | ns | |
| 3 | 52.534 | ns | 29.966 | ns | |
| 4 | 57.067 | ns | 32.714 | ns | |
| 5 | 53.341 | ns | 25.500 | ns | |
| 6 | 52.660 | ns | 27.222 | ns | |
| Tartrazine | Control | 54.375 | 31.399 | ||
| 1 | 57.664 | ns | 36.154 | * | |
| 2 | 54.037 | ns | 32.681 | ns | |
| 3 | 64.618 | * | 43.571 | * | |
| 4 | 63.860 | * | 35.760 | * | |
| 5 | 59.989 | * | 37.252 | * | |
| Carminic Acid | Control | 62.345 | 38.509 | ||
| 1 | 44.958 | * | 35.630 | ns | |
| 2 | 43.215 | * | 29.000 | ns | |
| 3 | 45.515 | * | 37.067 | ns | |
| 4 | 46.998 | * | 39.320 | ns | |
| 5 | 48.211 | * | 40.000 | ns | |
| 6 | 44.236 | * | 30.530 | ns | |
| Erythrosine | Control | 62.345 | 38.015 | ||
| 1 | 55.487 | ns | 27.614 | ns | |
| 2 | 49.589 | * | 34.276 | ns | |
| 3 | 49.847 | * | 35.051 | ns | |
| 4 | 50.011 | * | 43.333 | ns | |
| 5 | 50.214 | * | 22.501 | * | |
| Indigotine | Control | 58.433 | 32.988 | ||
| 1 | 57.791 | ns | 27.019 | * | |
| 2 | 61.547 | ns | 29.182 | ns | |
| 3 | 61.181 | ns | 33.857 | ns | |
| 4 | 57.067 | ns | 32.714 | ns | |
| 5 | 52.024 | ns | 27.189 | * | |
| 6 | 57.570 | ns | 31.068 | ns | |
| Brilliant Blue FCF | Control | 57.526 | 32.988 | ||
| 1 | 58.686 | ns | 34.333 | ns | |
| 2 | 63.513 | * | 31.286 | ns | |
| 3 | 62.664 | * | 33.000 | ns | |
| 4 | 65.095 | * | 32.877 | ns | |
| 5 | 61.074 | ns | 30.800 | ns | |
| 6 | 62.466 | ns | 31.984 | ns | |
© 2019 by the authors. Licensee MDPI, Basel, Switzerland. This article is an open access article distributed under the terms and conditions of the Creative Commons Attribution (CC BY) license (http://creativecommons.org/licenses/by/4.0/).
Share and Cite
Merinas-Amo, R.; Martínez-Jurado, M.; Jurado-Güeto, S.; Alonso-Moraga, Á.; Merinas-Amo, T. Biological Effects of Food Coloring in In Vivo and In Vitro Model Systems. Foods 2019, 8, 176. https://doi.org/10.3390/foods8050176
Merinas-Amo R, Martínez-Jurado M, Jurado-Güeto S, Alonso-Moraga Á, Merinas-Amo T. Biological Effects of Food Coloring in In Vivo and In Vitro Model Systems. Foods. 2019; 8(5):176. https://doi.org/10.3390/foods8050176
Chicago/Turabian StyleMerinas-Amo, Rocío, María Martínez-Jurado, Silvia Jurado-Güeto, Ángeles Alonso-Moraga, and Tania Merinas-Amo. 2019. "Biological Effects of Food Coloring in In Vivo and In Vitro Model Systems" Foods 8, no. 5: 176. https://doi.org/10.3390/foods8050176
APA StyleMerinas-Amo, R., Martínez-Jurado, M., Jurado-Güeto, S., Alonso-Moraga, Á., & Merinas-Amo, T. (2019). Biological Effects of Food Coloring in In Vivo and In Vitro Model Systems. Foods, 8(5), 176. https://doi.org/10.3390/foods8050176