Factors Influencing Consumers’ Perceptions of Food: A Study of Apple Juice Using Sensory and Visual Attention Methods
Abstract
1. Introduction
2. Materials and Methods
2.1. Apple Juice Samples
2.2. Consumer Studies
2.3. Data Analysis
3. Results
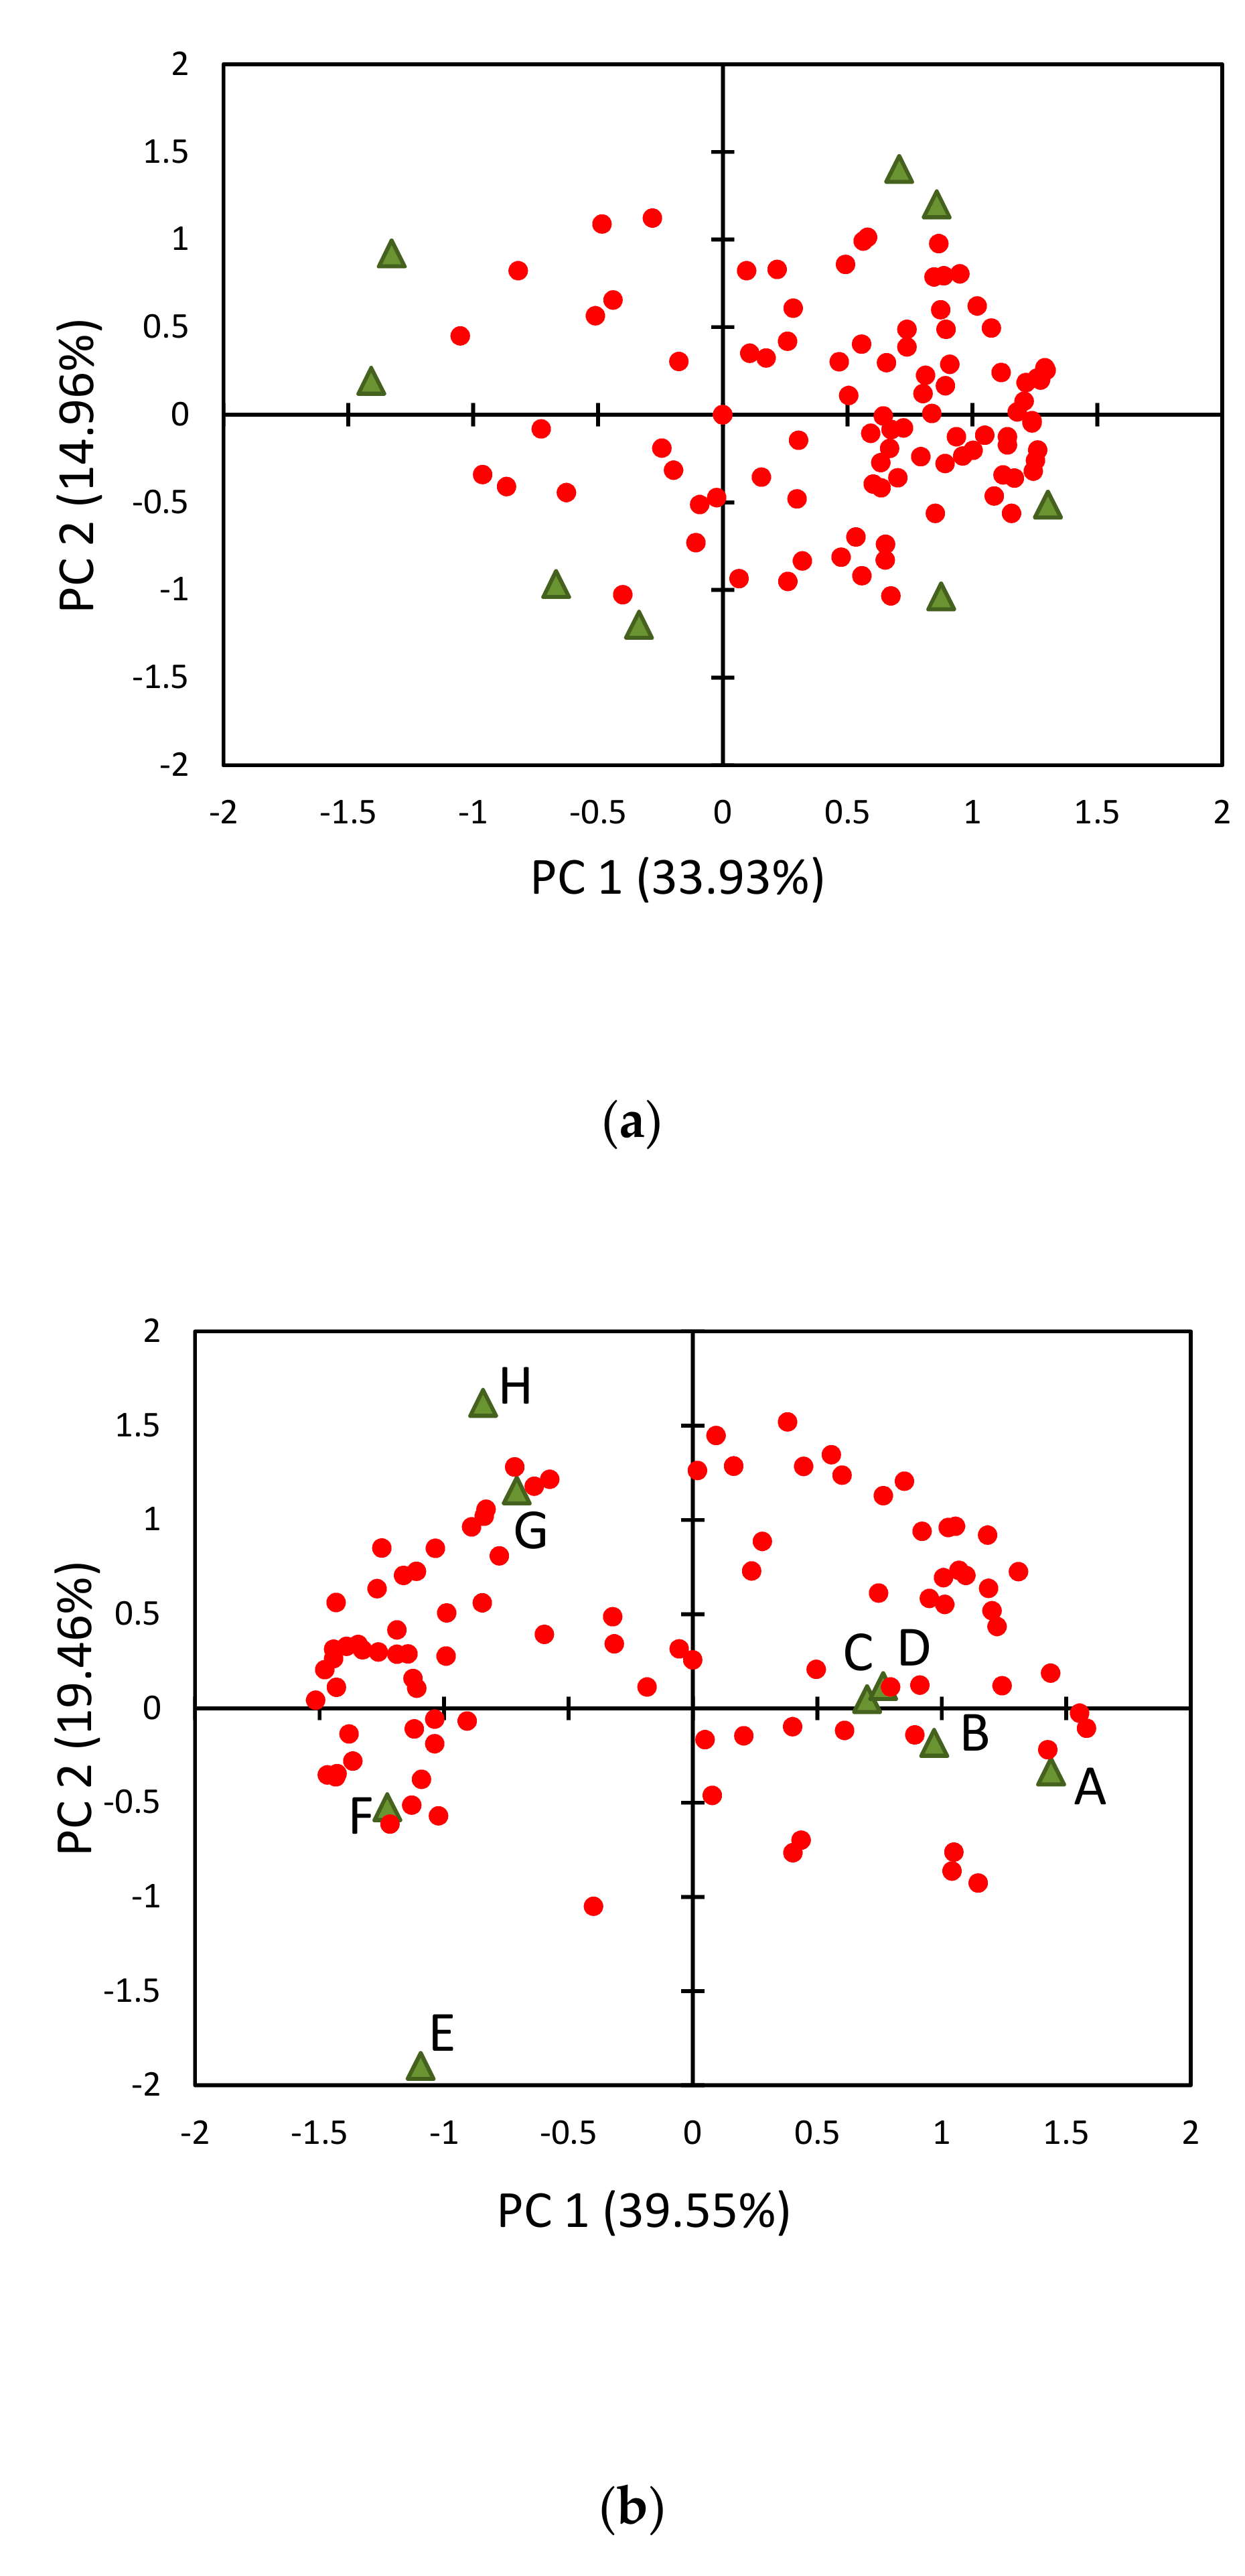
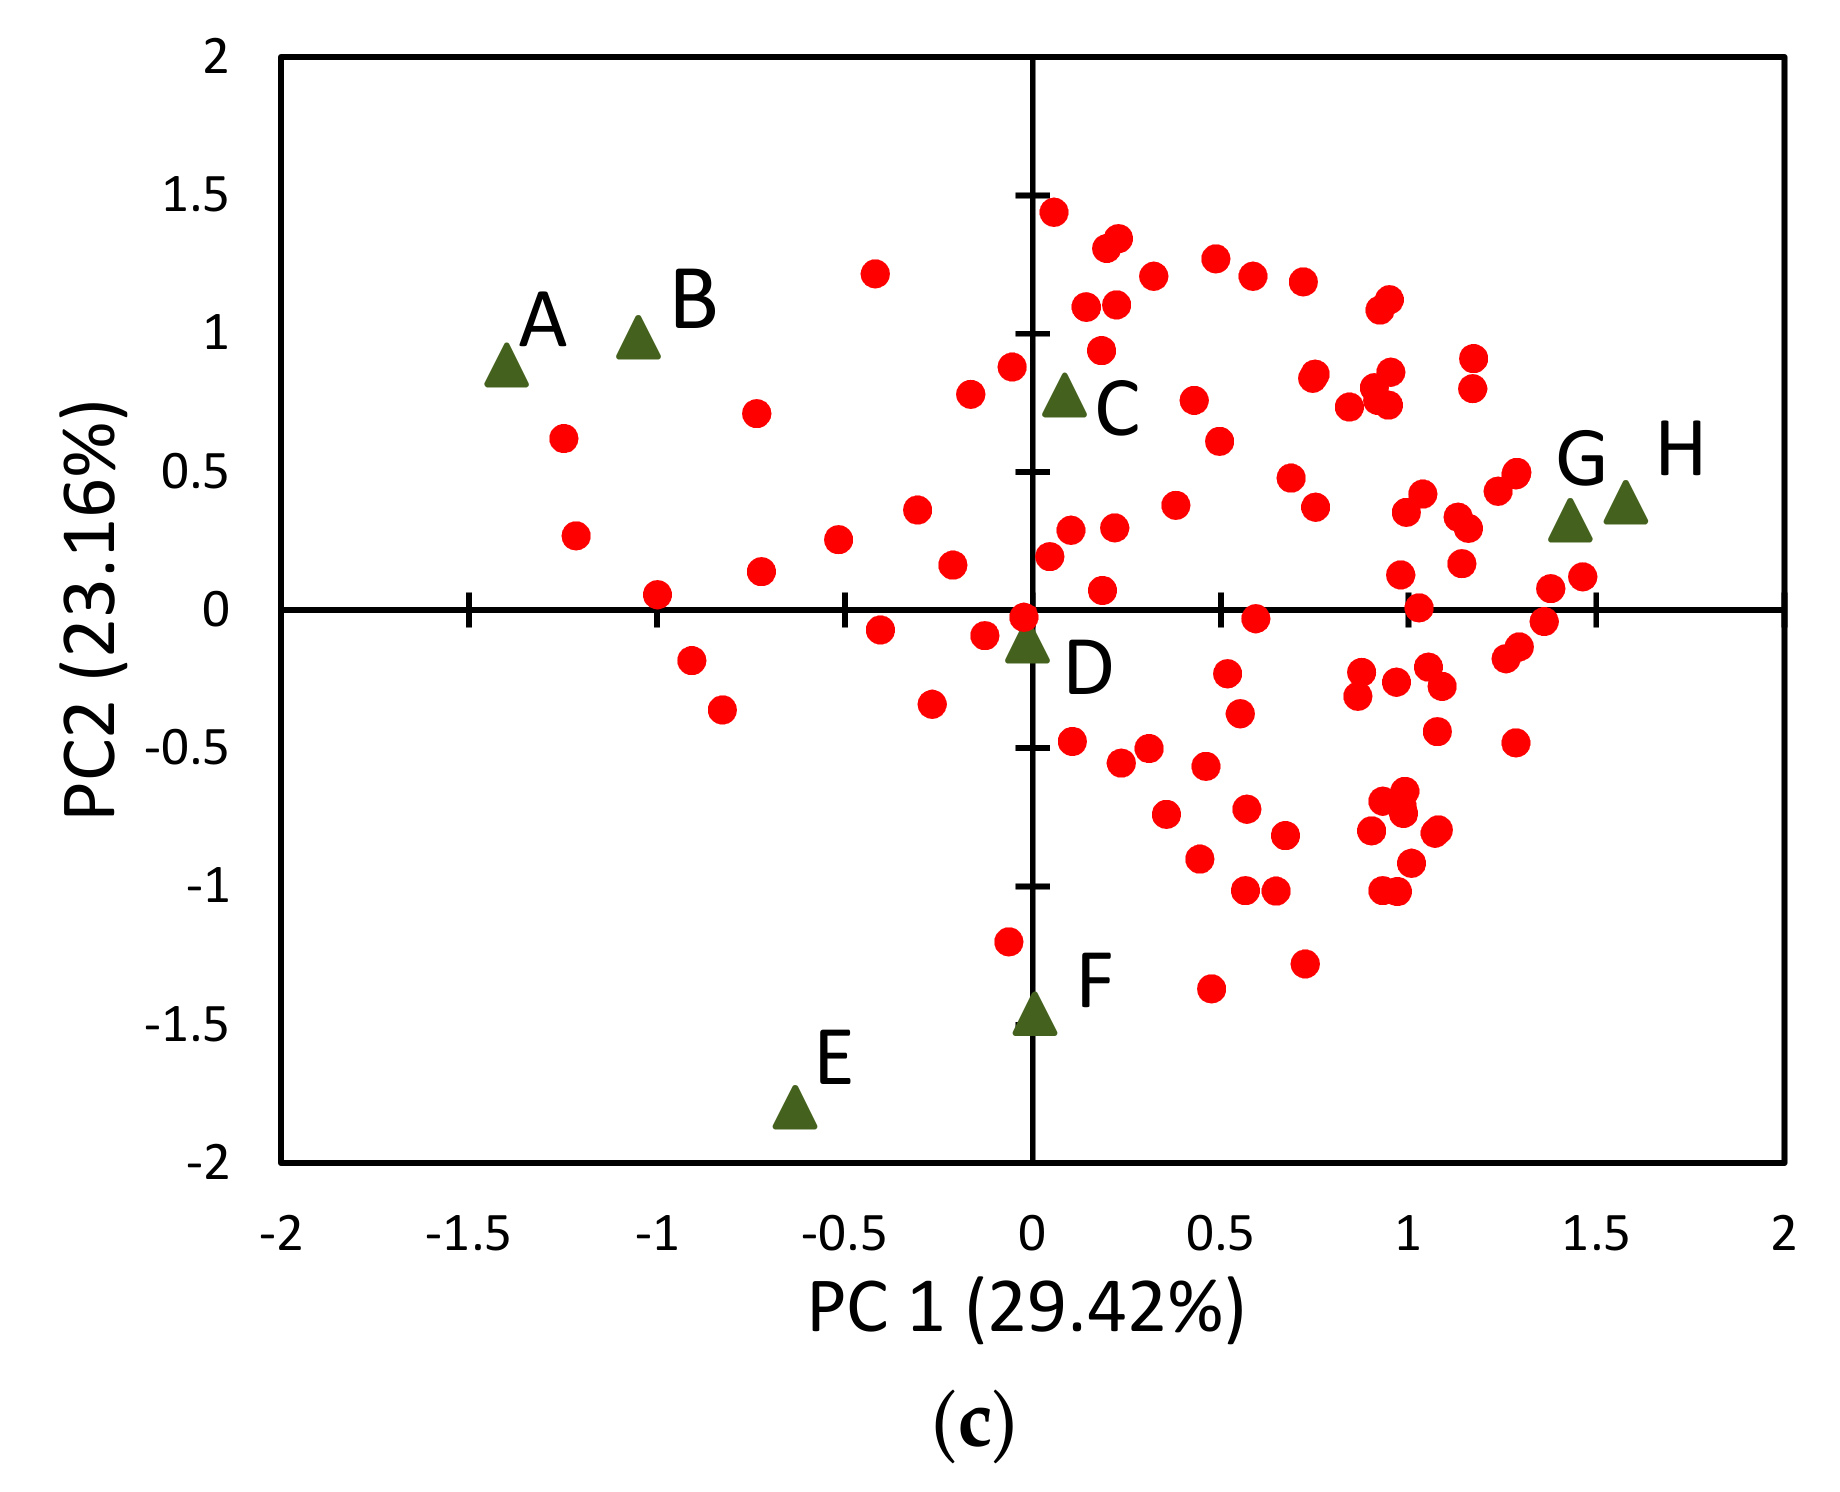
3.1. Consumer Liking of Apple Juices in Different Evaluation Conditions
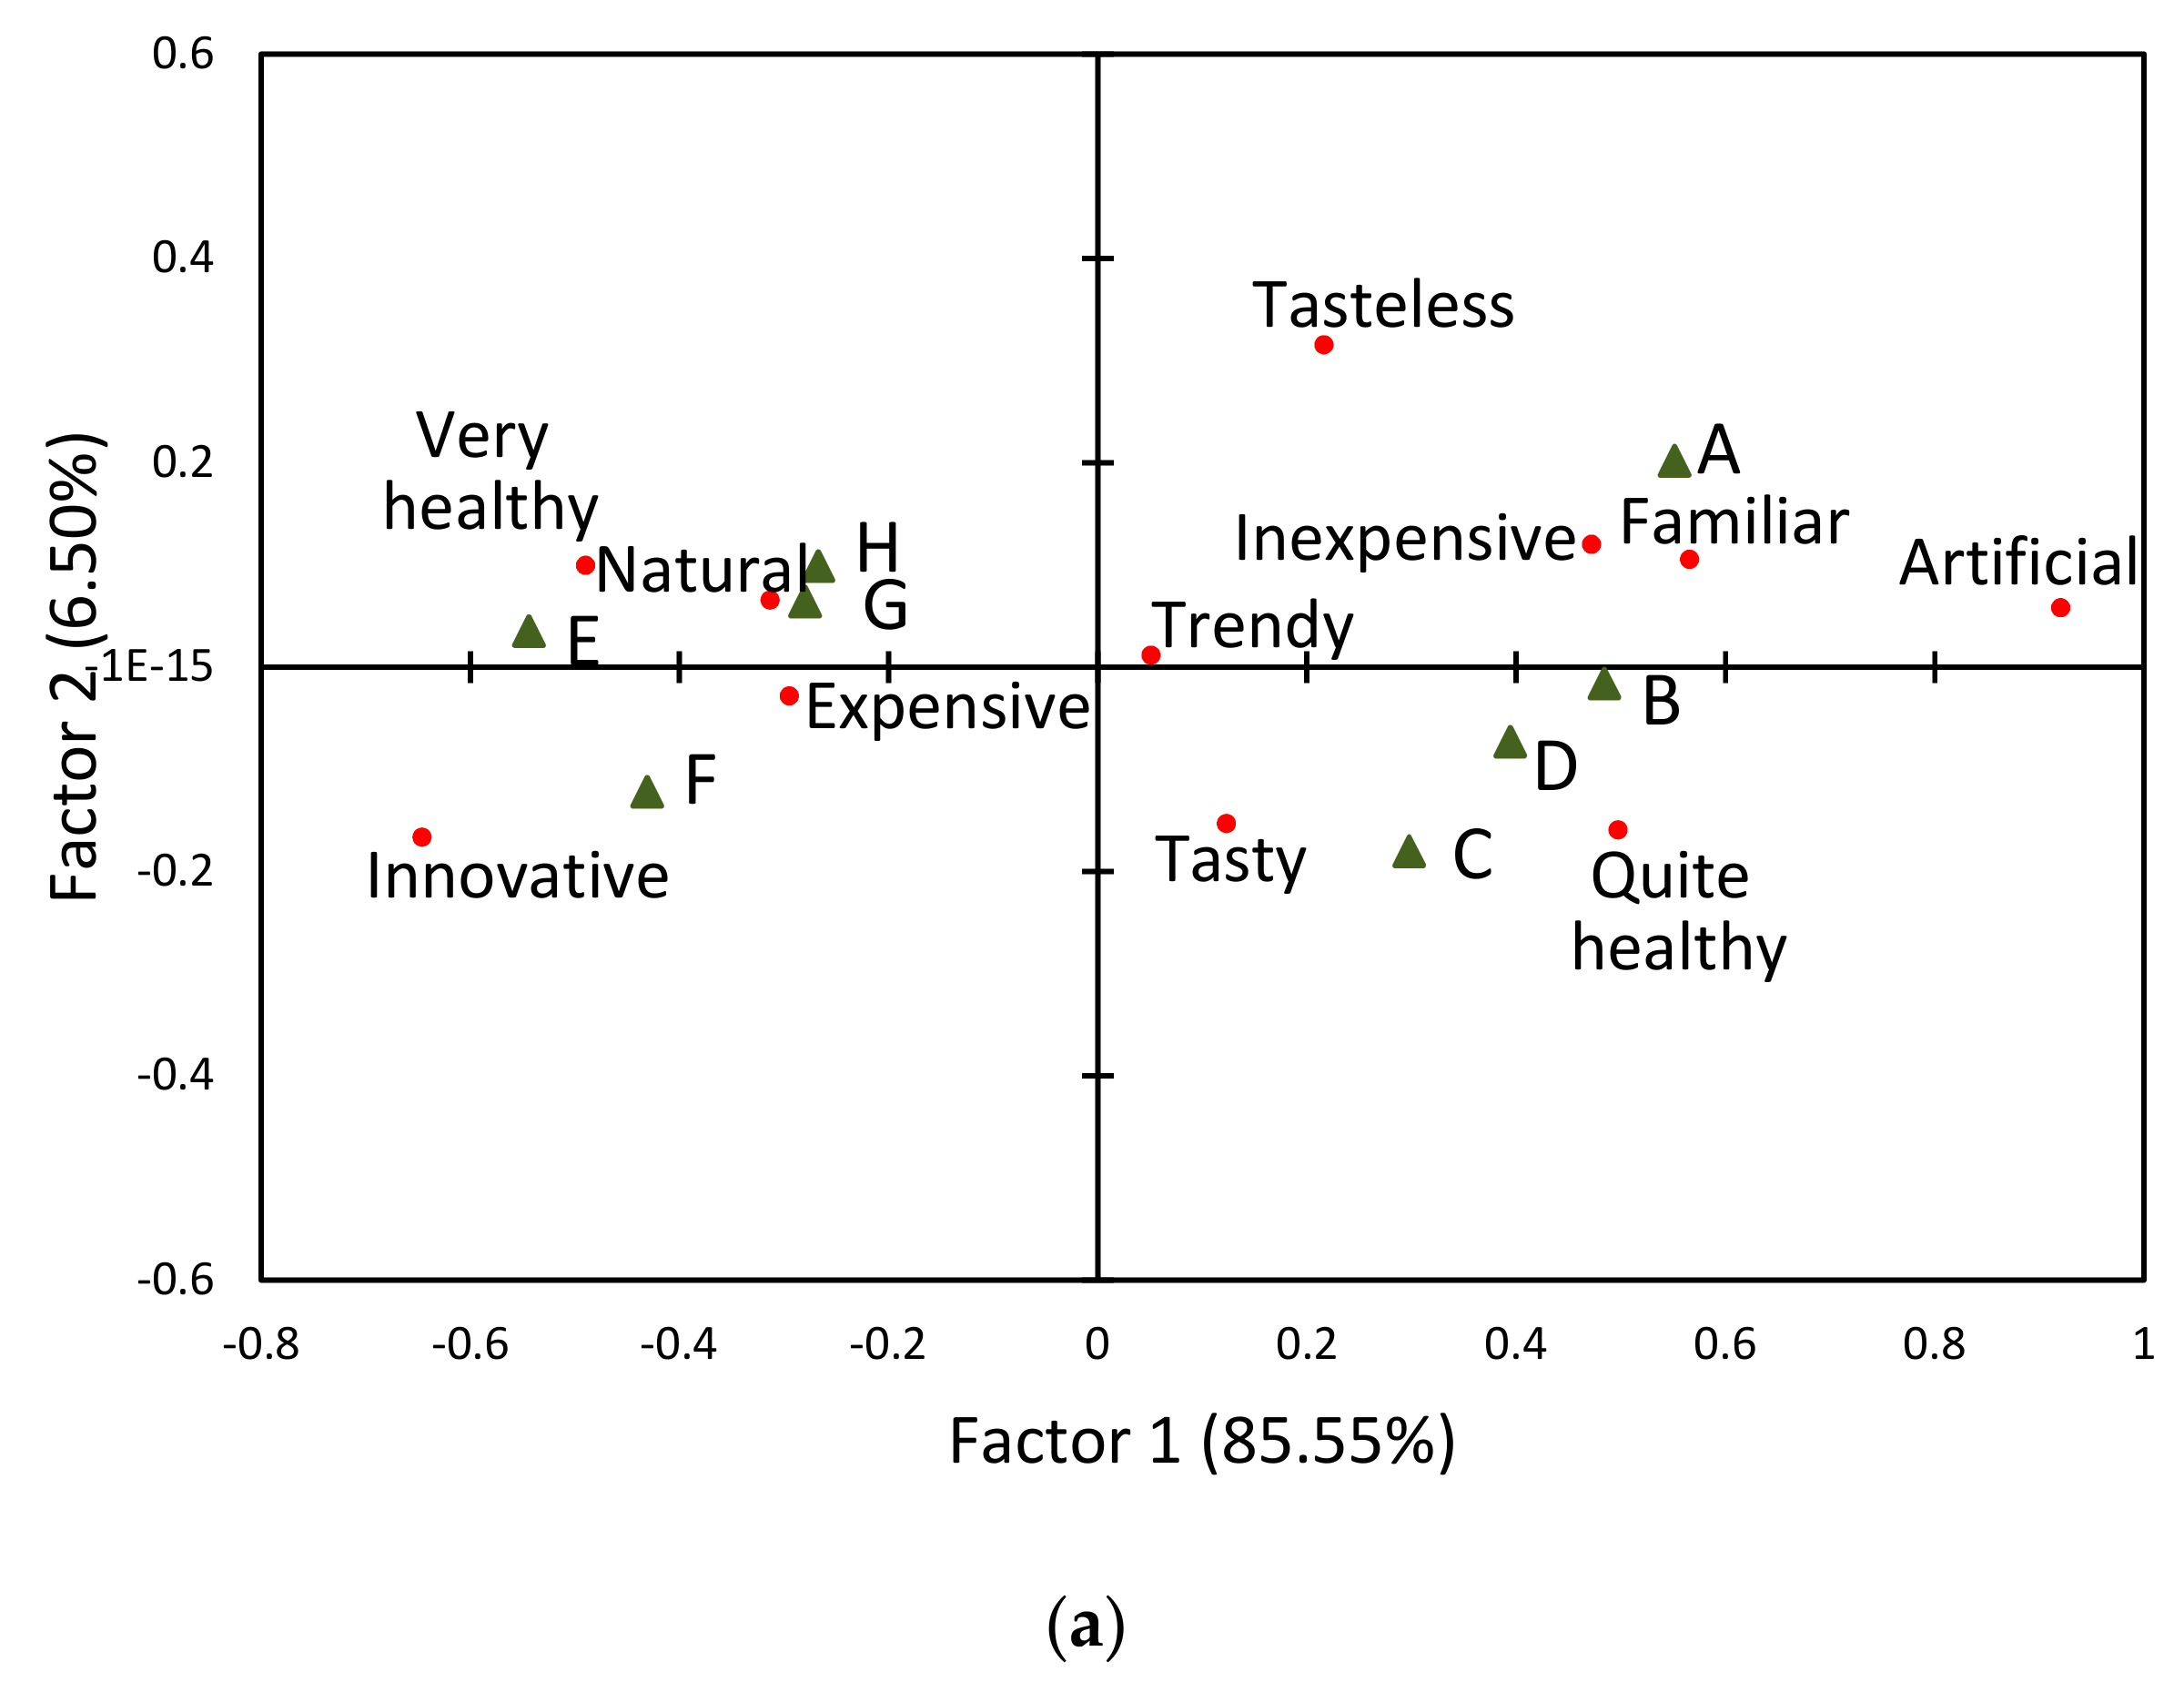
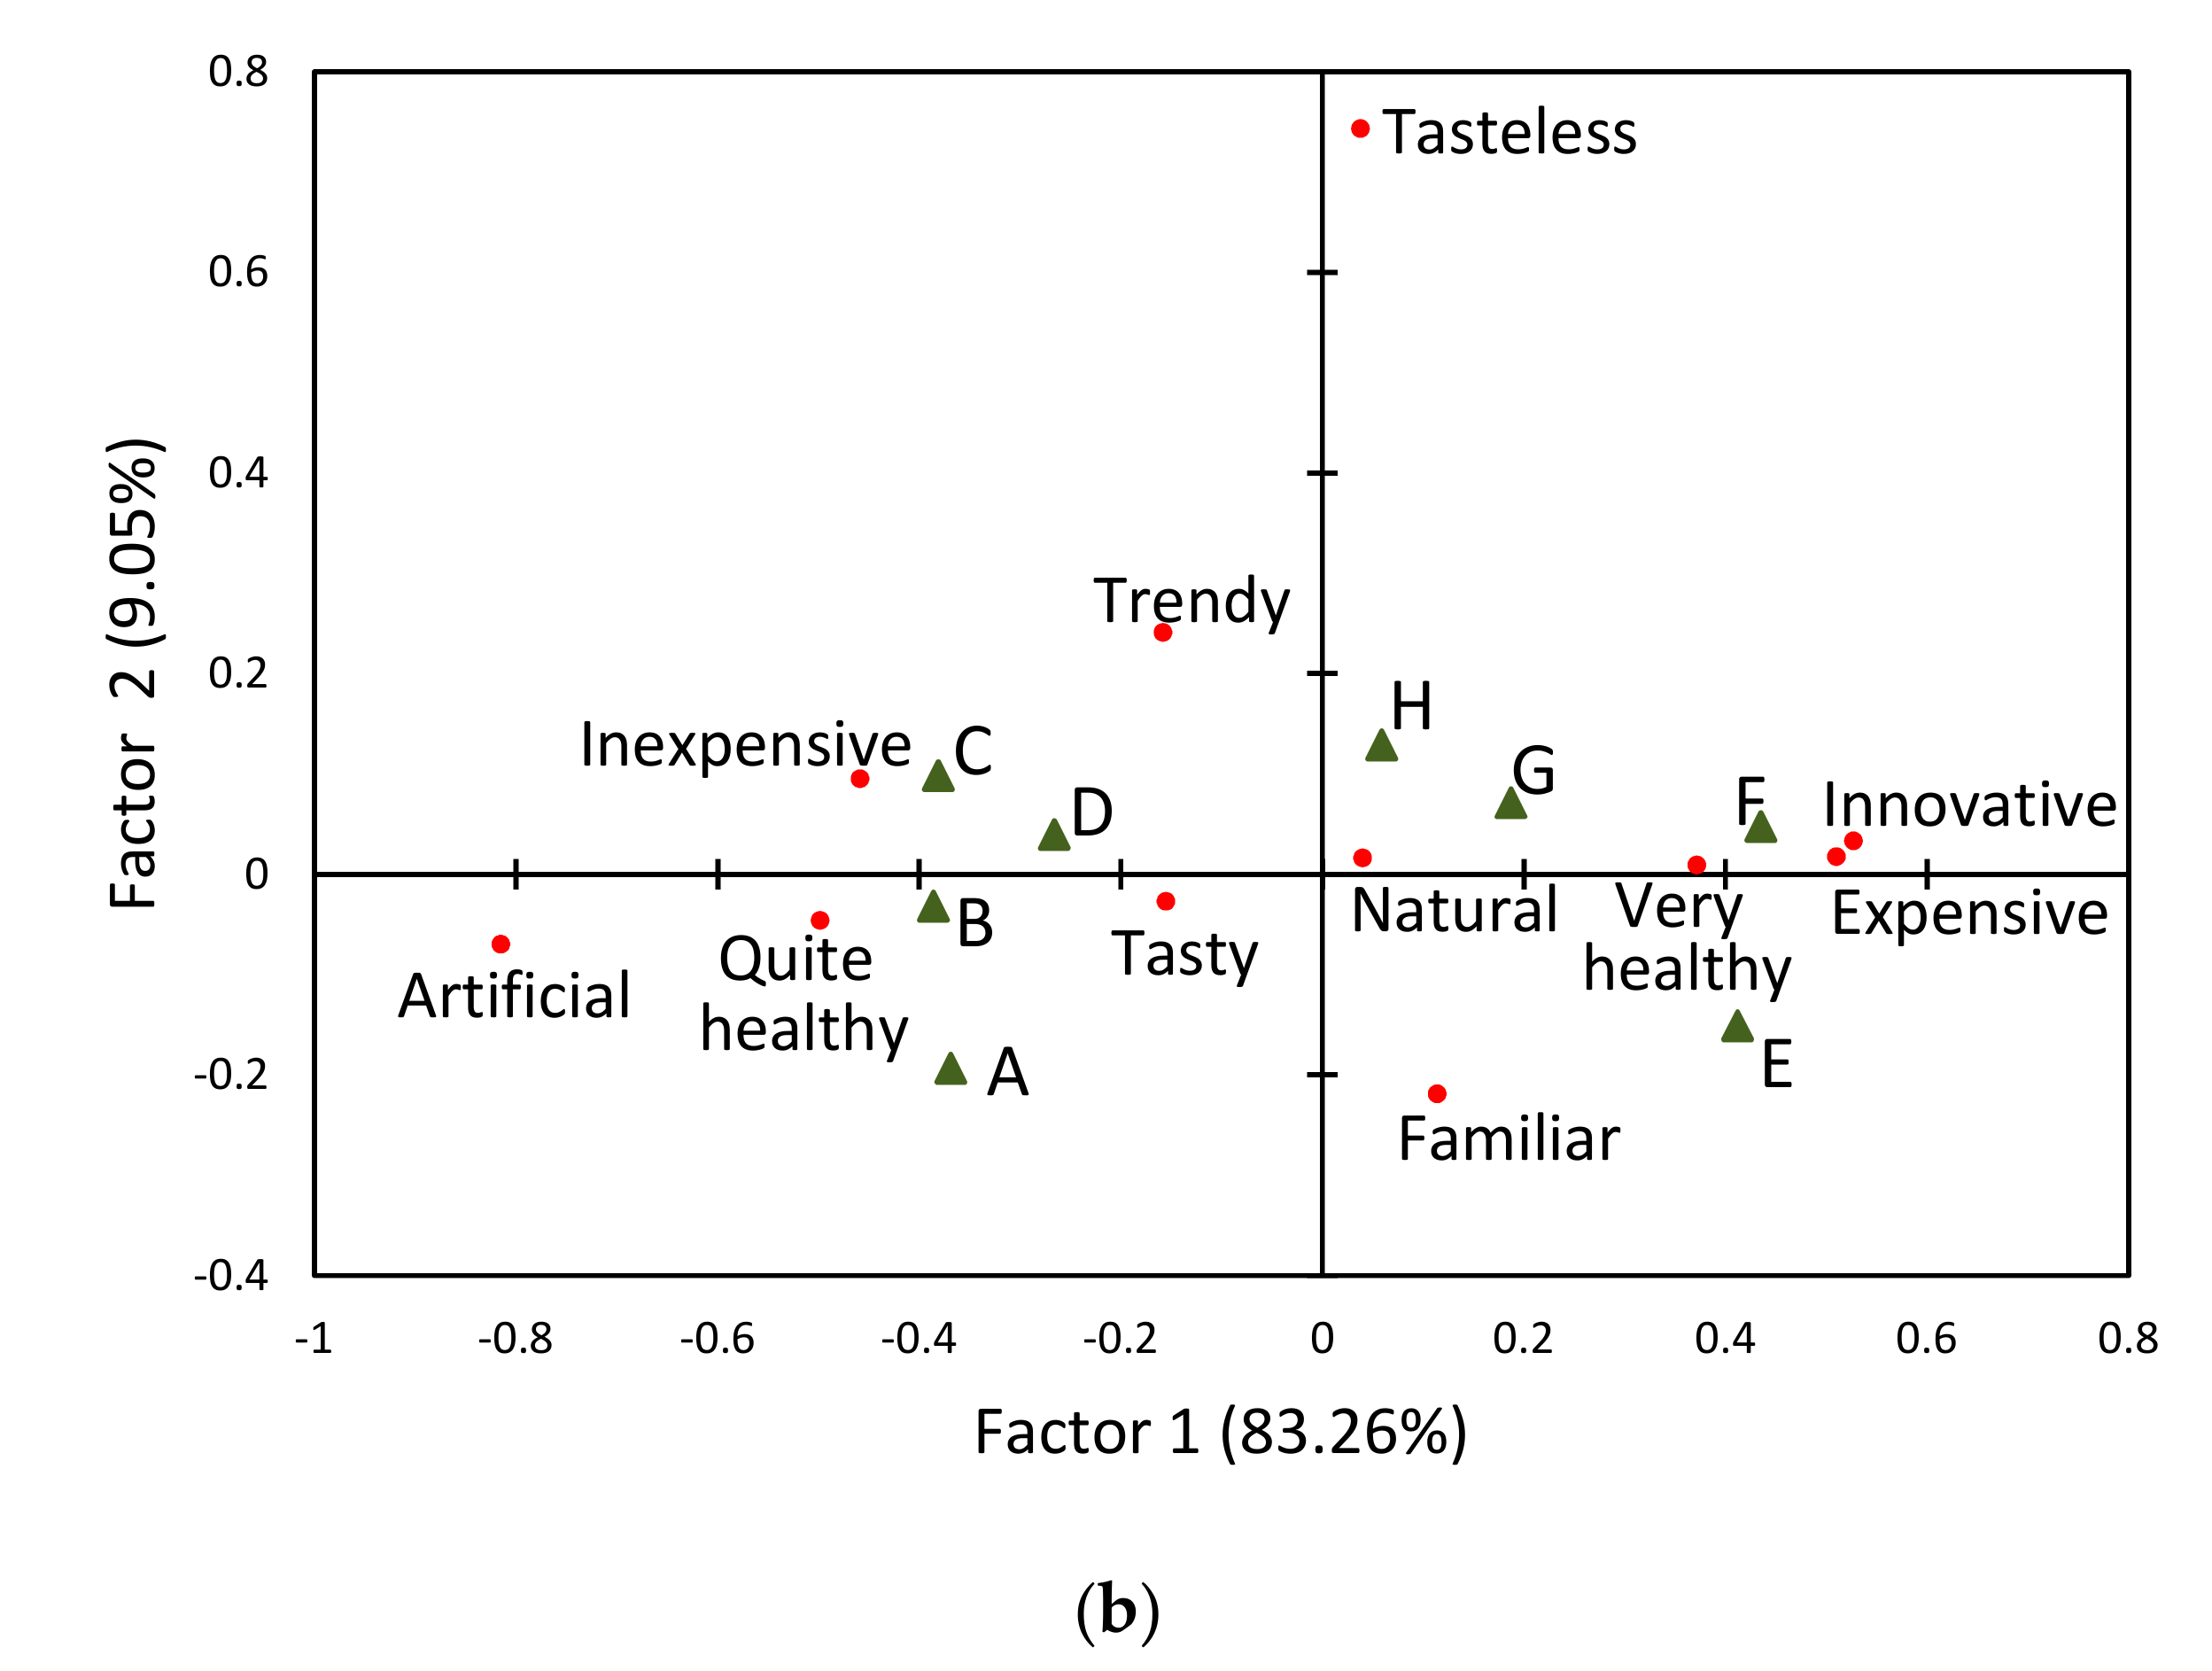
3.2. Perception of Apple Juices Based on External Attributes
3.3. Visual Attention to Product Labels
4. Conclusions
Author Contributions
Funding
Acknowledgments
Conflicts of Interest
References
- Grunert, K.G. Current issues in the understanding of consumer food choice. Trends Food Sci. Technol. 2002, 13, 275–285. [Google Scholar] [CrossRef]
- Piqueras-Fiszman, B.; Spence, C. Sensory expectations based on product-extrinsic food cues: An interdisciplinary review of the empirical evidence and theoretical accounts. Food Qual. Prefer. 2015, 40, 165–179. [Google Scholar] [CrossRef]
- Li, X.E.; Jervis, S.M.; Drake, M.A. Examining extrinsic factors that influence product acceptance: A review. J. Food Sci. 2015, 80, R901–R909. [Google Scholar] [CrossRef] [PubMed]
- Mueller, S.; Szolnoki, G. The relative influence of packaging, labelling, branding and sensory attributes on liking and purchase intent: Consumers differ in their responsiveness. Food Qual. Prefer. 2010, 21, 774–783. [Google Scholar] [CrossRef]
- Deliza, R.; MacFie, H.J.H. The generation of sensory expectation by extermal cues and its effect on sensory perception and hedonic ratings: A review. J. Sens. Stud. 1996, 11, 103–128. [Google Scholar] [CrossRef]
- Bartels, M.; Tillack, K.; Jordan Lin, C.-T. Communicating nutrition information at the point of purchase: An eye-tracking study of shoppers at two grocery stores in the United States. Int. J. Consum. Stud. 2018, 42, 557–565. [Google Scholar] [CrossRef]
- Menichelli, E.; Olsen, N.V.; Meyer, C.; Næs, T. Combining extrinsic and intrinsic information in consumer acceptance studies. Food Qual. Prefer. 2012, 23, 148–159. [Google Scholar] [CrossRef]
- Combris, P.; Bazoche, P.; Giraud-Héraud, E.; Issanchou, S. Food choices: What do we learn from combining sensory and economic experiments? Food Qual. Prefer. 2009, 20, 550–557. [Google Scholar] [CrossRef]
- Olsen, N.V.; Menichelli, E.; Meyer, C.; Næs, T. Consumers liking of private labels. An evaluation of intrinsic and extrinsic orange juice cues. Appetite 2011, 56, 770–777. [Google Scholar] [CrossRef]
- Wansink, B.; Payne, C.R.; North, J. Fine as North Dakota wine: Sensory expectations and the intake of companion foods. Physiol. Behav. 2007, 90, 712–716. [Google Scholar] [CrossRef]
- Sörqvist, P.; Marsh, J.E.; Holmgren, M.; Hulme, R.; Haga, A.; Seager, P.B. Effects of labeling a product eco-friendly and genetically modified: A cross-cultural comparison for estimates of taste, willingness to pay and health consequences. Food Qual. Prefer. 2016, 50, 65–70. [Google Scholar] [CrossRef]
- Orquin, J.L.; Bagger, M.P.; Lahm, E.S.; Grunert, K.G.; Scholderer, J. The visual ecology of product packaging and its effects on consumer attention. J. Bus. Res. 2019. [Google Scholar] [CrossRef]
- Graham, D.J.; Orquin, J.L.; Visschers, V.H.M. Eye tracking and nutrition label use: A review of the literature and recommendations for label enhancement. Food Policy 2012, 37, 378–382. [Google Scholar] [CrossRef]
- Fenko, A.; Nicolaas, I.; Galetzka, M. Does attention to health labels predict a healthy food choice? An eye-tracking study. Food Qual. Prefer. 2018, 69, 57–65. [Google Scholar] [CrossRef]
- Oliveira, D.; Machín, L.; Deliza, R.; Rosenthal, A.; Walter, E.H.; Giménez, A.; Ares, G. Consumers’ attention to functional food labels: Insights from eye-tracking and change detection in a case study with probiotic milk. LWT-Food Sci. Technol. 2016, 68, 160–167. [Google Scholar] [CrossRef]
- Gere, A.; Danner, L.; de Antoni, N.; Kovács, S.; Dürrschmid, K.; Sipos, L. Visual attention accompanying food decision process: An alternative approach to choose the best models. Food Qual. Prefer. 2016, 51, 1–7. [Google Scholar] [CrossRef]
- Rebollar, R.; Lidón, I.; Martín, J.; Puebla, M. The identification of viewing patterns of chocolate snack packages using eye-tracking techniques. Food Qual. Prefer. 2015, 39, 251–258. [Google Scholar] [CrossRef]
- Sonne, A.M.; Grunert, K.G.; Veflen, O.N.; Granli, B.S.; Szabó, E.; Banati, D. Consumers’ perceptions of HPP and PEF food products. Br. Food J. 2012, 114, 85–107. [Google Scholar] [CrossRef]
- Lee, P.Y.; Kebede, B.T.; Lusk, K.; Mirosa, M.; Oey, I. Investigating consumers’ perception of apple juice as affected by novel and conventional processing technologies. Int. J. Food Sci. Technol. 2017, 52, 2564–2571. [Google Scholar] [CrossRef]
- AIJN, E.F.J.A. Liquid Fruit Market Report. 2017. Available online: http://www.aijn.org/publications/facts-and-figures/aijn-market-reports/ (accessed on 15 April 2019).
- Stolzenbach, S.; Bredie, W.L.P.; Christensen, R.H.B.; Byrne, D.V. Impact of product information and repeated exposure on consumer liking, sensory perception and concept associations of local apple juice. Food Res. Int. 2013, 52, 91–98. [Google Scholar] [CrossRef]
- Lee, P.Y.; Lusk, K.; Mirosa, M.; Oey, I. Effect of information on Chinese consumers’ acceptance of thermal and non-thermal treated apple juices: A study of young Chinese immigrants in New Zealand. Food Qual. Prefer. 2016, 48, 118–129. [Google Scholar] [CrossRef]
- Han, J.-W.; Ruiz-Garcia, L.; Qian, J.-P.; Yang, X.-T. Food packaging: A comprehensive review and future trends. Compr. Rev. Food Sci. Food Saf. 2018, 17, 860–877. [Google Scholar] [CrossRef]
- Venter, K.; van der Merwe, D.; de Beer, H.; Kempen, E.; Bosman, M. Consumers’ perceptions of food packaging: An exploratory investigation in Potchefstroom, South Africa. Int. J. Consum. Stud. 2011, 35, 273–281. [Google Scholar] [CrossRef]
- Van Rompay, T.J.L.; Deterink, F.; Fenko, A. Healthy package, healthy product? Effects of packaging design as a function of purchase setting. Food Qual. Prefer. 2016, 53, 84–89. [Google Scholar] [CrossRef]
- Włodarska, K.; Pawlak-Lemańska, K.; Górecki, T.; Sikorska, E. Classification of commercial apple juices based on multivariate analysis of their chemical profiles. Int. J. Food Prop. 2017, 20, 1773–1785. [Google Scholar] [CrossRef]
- Włodarska, K.; Pawlak-Lemańska, K.; Sikorska, E. Prediction of key sensory attributes of apple juices by multivariate analysis of their physicochemical profiles. Br. Food J. 2019, 121, 2429–2441. [Google Scholar] [CrossRef]
- Włodarska, K.; Pawlak-Lemańska, K.; Górecki, T.; Sikorska, E. Perception of apple juice: A comparison of physicochemical measurements, descriptive analysis and consumer responses. J. Food Qual. 2016, 39, 351–361. [Google Scholar] [CrossRef]
- Berger, S.; Wagner, U.; Schwand, C. Assessing advertising effectiveness: The potential of goal-directed behavior. Psychol. Market. 2012, 29, 411–421. [Google Scholar] [CrossRef]
- Holmqvist, K.; Nyström, N.; Andersson, R.; Dewhurst, R.; Jarodzka, H.; Van de Weijer, J. Eye Tracking: A Comprehensive Guide to Methods and Measures; Oxford University Press: Oxford, UK, 2011. [Google Scholar]
- Aguiar, I.B.; Miranda, N.G.M.; Gomes, F.S.; Santos, M.C.S.; Freitas, D.d.G.C.; Tonon, R.V.; Cabral, L.M.C. Physicochemical and sensory properties of apple juice concentrated by reverse osmosis and osmotic evaporation. Innov. Food Sci. Emerg. Technol. 2012, 16, 137–142. [Google Scholar] [CrossRef]
- Beveridge, T. Opalescent and cloudy fruit juices: Formation and particle stability. Crit. Rev. Food Sci. 2002, 42, 317–337. [Google Scholar] [CrossRef]
- Carbonell, L.; Izquierdo, L.; Carbonell, I.; Costell, E. Segmentation of food consumers according to their correlations with sensory attributes projected on preference spaces. Food Qual. Prefer. 2008, 19, 71–78. [Google Scholar] [CrossRef]
- Van Kleef, E.; van Trijp, H.C.M.; Luning, P. Internal versus external preference analysis: An exploratory study on end-user evaluation. Food Qual. Prefer. 2006, 17, 387–399. [Google Scholar] [CrossRef]
- Varela, P.; Ares, G.; Giménez, A.; Gámbaro, A. Influence of brand information on consumers’ expectations and liking of powdered drinks in central location tests. Food Qual. Prefer. 2010, 21, 873–880. [Google Scholar] [CrossRef]
- Ares, G.; Jaeger, S.R. Check-all-that-apply questions: Influence of attribute order on sensory product characterization. Food Qual. Prefer. 2013, 28, 141–153. [Google Scholar] [CrossRef]
- Bruzzone, F.; Vidal, L.; Antúnez, L.; Giménez, A.; Deliza, R.; Ares, G. Comparison of intensity scales and CATA questions in new product development: Sensory characterisation and directions for product reformulation of milk desserts. Food Qual. Prefer. 2015, 44, 183–193. [Google Scholar] [CrossRef]
- Dooley, L.; Lee, Y.-S.; Meullenet, J.-F. The application of check-all-that-apply (CATA) consumer profiling to preference mapping of vanilla ice cream and its comparison to classical external preference mapping. Food Qual. Prefer. 2010, 21, 394–401. [Google Scholar] [CrossRef]
- Meyners, M.; Castura, J.C.; Carr, B.T. Existing and new approaches for the analysis of CATA data. Food Qual. Prefer. 2013, 30, 309–319. [Google Scholar] [CrossRef]
- Hempel, C.; Hamm, U. Local and/or organic: A study on consumer preferences for organic food and food from different origins. Int. J. Consum. Stud. 2016, 40, 732–741. [Google Scholar] [CrossRef]
- Rokka, J.; Uusitalo, L. Preference for green packaging in consumer product choices – Do consumers care? Int. J. Consum. Stud. 2008, 32, 516–525. [Google Scholar] [CrossRef]
- Zepeda, L.; Sirieix, L.; Pizarro, A.; Corderre, F.; Rodier, F. A conceptual framework for analyzing consumers’ food label preferences: An exploratory study of sustainability labels in France, Quebec, Spain and the US. Int. J. Consum. Stud. 2013, 37, 605–616. [Google Scholar] [CrossRef]
- Ares, G.; Giménez, A.; Bruzzone, F.; Vidal, L.; Antúnez, L.; Maiche, A. Consumer visual processing of food labels: Results from an eye-tracking study. J. Sens. Stud. 2013, 28, 138–153. [Google Scholar] [CrossRef]


| Juice 1 | Product Category 2 | Package | Market Segment |
|---|---|---|---|
| A | FC, clear | 1.00 L box | Standard |
| B | FC, clear | 1.00 L light plastic bottle | Standard |
| C | FC, cloudy | 1.00 L box | Standard |
| D | FC, cloudy | 0.70 L light glass bottle | Standard |
| E | NFC, cloudy, pasteurized | 0.25 L dark glass bottle | Premium |
| F | NFC, cloudy, pasteurized | 0.25 L light glass bottle | Premium |
| G | NFC, freshly squeezed | 0.25 L light glass bottle | Premium |
| H | NFC, freshly squeezed | 0.25 L light glass bottle | Premium |
| Juice | Evaluation Conditions 1 | ||
|---|---|---|---|
| Blind 2 | Expected | Informed | |
| A | 4.5 c,d,C | 5.8 c,A | 5.1 e,B |
| B | 4.9 b,c,C | 6.1 b,c,A | 5.4 d,eB |
| C | 5.8 a,A | 6.4 a,b,c,A | 6.3 b,c,A |
| D | 5.6 a,bB | 6.6 a,b,A | 6.1 b,c,d,A,B |
| E | 4.1 d,C | 5.8 c,A | 5.3 d,e,B |
| F | 4.2 c,d,C | 6.4 b,c,A | 5.7 c,d,e,B |
| G | 6.2 a,B | 6.7 a,b,A,B | 6.9 a,b,A |
| H | 5.7 a,B | 7.1 a,A | 7.3 a,A |
| Juice | Average Percentage of Consumers (%) | Average Time of Attention (s) | ||||
|---|---|---|---|---|---|---|
| Brand | Nutritional Label | Type of Product | Brand | Nutritional Label | Type of Product | |
| A | 87 | 94 | 74 | 0.3 | 2.2 | 1.2 |
| B | 87 | 100 | 100 | 0.6 | 0.8 | 0.8 |
| C | 85 | 97 | 70 | 0.6 | 2.1 | 0.7 |
| D | 76 | 84 | 84 | 0.5 | 0.9 | 1.0 |
| E | 93 | 83 | 91 | 0.7 | 0.4 | 0.7 |
| F | 95 | 97 | 86 | 0.2 | 1.2 | 0.7 |
| G | 99 | 100 | 100 | 0.4 | 0.3 | 1.0 |
| H | 95 | 95 | 87 | 0.4 | 1.4 | 0.7 |
| Mean | 89.6 | 93.8 | 86.5 | 0.5 | 1.2 | 0.8 |
© 2019 by the authors. Licensee MDPI, Basel, Switzerland. This article is an open access article distributed under the terms and conditions of the Creative Commons Attribution (CC BY) license (http://creativecommons.org/licenses/by/4.0/).
Share and Cite
Włodarska, K.; Pawlak-Lemańska, K.; Górecki, T.; Sikorska, E. Factors Influencing Consumers’ Perceptions of Food: A Study of Apple Juice Using Sensory and Visual Attention Methods. Foods 2019, 8, 545. https://doi.org/10.3390/foods8110545
Włodarska K, Pawlak-Lemańska K, Górecki T, Sikorska E. Factors Influencing Consumers’ Perceptions of Food: A Study of Apple Juice Using Sensory and Visual Attention Methods. Foods. 2019; 8(11):545. https://doi.org/10.3390/foods8110545
Chicago/Turabian StyleWłodarska, Katarzyna, Katarzyna Pawlak-Lemańska, Tomasz Górecki, and Ewa Sikorska. 2019. "Factors Influencing Consumers’ Perceptions of Food: A Study of Apple Juice Using Sensory and Visual Attention Methods" Foods 8, no. 11: 545. https://doi.org/10.3390/foods8110545
APA StyleWłodarska, K., Pawlak-Lemańska, K., Górecki, T., & Sikorska, E. (2019). Factors Influencing Consumers’ Perceptions of Food: A Study of Apple Juice Using Sensory and Visual Attention Methods. Foods, 8(11), 545. https://doi.org/10.3390/foods8110545


