Article

Volatile Profile and Physico-Chemical Analysis of Acacia Honey for Geographical Origin and Nutritional Value Determination

by
Niculina M. Mădaş
1,2,
Liviu A. Mărghitaş
1,
Daniel S. Dezmirean
1,
Victorita Bonta
3,
Otilia Bobiş
3,*,
Marie-Laure Fauconnier
4,
Frédéric Francis
2,
Eric Haubruge
2 and
Kim B. Nguyen
2
1
Department of Apiculture and Sericulture, University of Agricultural Sciences and Veterinary Medicine, Mănăştur st, 3-5, 400372 Cluj-Napoca, Romania
2
Department of Functional and Evolutionary Entomology, University of Liège, Gembloux Agro-Bio Tech, Passage des Déportés, 2, 5030 Gembloux, Belgium
3
Life Science Institute, University of Agricultural Sciences and Veterinary Medicine Cluj-Napoca, Manastur st. 3-5, 400372 Cluj-Napoca, Romania
4
Laboratory of Chemistry of Natural Molecules, University of Liège, Gembloux Agro-Bio Tech, Passage des Déportés, 2, 5030 Gembloux, Belgium
*
Author to whom correspondence should be addressed.
Foods 2019, 8(10), 445; https://doi.org/10.3390/foods8100445
Submission received: 25 August 2019 / Revised: 20 September 2019 / Accepted: 24 September 2019 / Published: 27 September 2019
(This article belongs to the Section Food Quality and Safety)

Abstract

:
Honey composition and color depend greatly on the botanical and geographical origin. Water content, water activity and color of 50 declared acacia samples, collected from three different geographical zones of Romania, together with chromatographic determination of sugar spectrum were analyzed. A number of 79 volatile compounds from the classes of: Alcohols, aldehydes, esters, ketones, sulphur compounds, aliphatic hydrocarbons, nitrogen compounds, carboxylic acids, aromatic acids and ethers were identified by solid-phase micro-extraction and gas-chromatography mass spectrometry. The overall volatile profile and sugar spectrum of the investigated honey samples allow the differentiation of geographical origin for the acacia honey samples subjected to analysis. The statistical models of the chromatic determination, physicochemical parameters and volatile profile was optimal to characterize the honey samples and group them into three geographical origins, even they belong to the same botanical origin.

Graphical Abstract

1. Introduction

Nutritional value of honey [1] is due to the chemical composition of simple sugars and all the substances (vitamins, enzymes, minerals, free amino-acids, phenolic and volatile organic compounds—VOCs), that have been described in many studies made over the time [2,3,4,5].
The bioactive properties of honey are related to the botanical and geographical origin, being influenced mainly by the plants from where the bees collect the nectar, and thus by the place where these plants grow [2,5,6,7,8,9]. When talking about botanical origin, honey may be classified as floral (derived from nectar of melliferous plants) or non-floral (honeydew) (derived from sweet substances released by aphids on different plant parts which bees collect and transform similarly to floral nectar). Botanical and geographical authentication of honey is a market feature, and for this reason different research groups and specialized laboratories have established a list of methods and parameters to be determined, for the correct classification of honey samples.
Monofloral honey is characterized by a required percentage of specific pollen, different in every national standard, ranging between 10 and 20% (orange honey) to 70–90% for eucalyptus honey [10,11,12,13]. Establishing the monoflorality of honey have also economic importance, because specific honey, with nectar and pollen belonging predominantly to a certain species, may have higher selling price and beekeepers have higher incomes obtained from its marketing.
However, only pollen analysis may cause classification problems, due to the fact that certain plants are underrepresented in pollen (lavender, citrus) and additional analysis are needed to complement the uniflorality decision. These analysis may be physico-chemical [14,15], spectrophotometric and chromatographic techniques for possible markers determination (sugars, phenols or volatiles) [9,16,17,18,19,20,21,22].
Honey aroma is given by volatile organic compounds coming from plant nectar, developed through different biosynthetic pathways, thus is closely related to botanical origin [20]. Additionally, some of the flavor constituents may come from the bees in the enzymatic process of transforming the nectar into honey [20].
Different classes of volatile compounds are reported in honey, the main classes being: furans, alcohols, aldehydes, ketones, terpenes, nor-isoprenoids, acids and pyrene derivatives [9,19,20,22].
Having different landforms and a very rich flora, Romania have the possibility to produce many types of honey, from monofloral (acacia, linden, rape, sunflower, raspberry, heather, mint, etc.), to multifloral (mountain, meadow) and last but not least honeydew honey [5,14,16,21,23,24,25,26].
Romanian honey volatiles were studied until now [21,27,28], but the comparative analysis of volatiles of the same type of declared honey, from different geographical origins of Romania, was not made until now. The main purpose of the present study was to assess the volatile composition on the creation of aroma present in acacia samples from different geographical regions of Romania, using solid phase micro-extraction; gas chromatography, mass spectrometry (SPME/GC/MS) technique.

2. Materials and Methods

Most of the physico-chemical methods used in honey analysis are mainly used for quality control, but some of them, like electrical conductivity and sugar spectrum determination, may be used for botanical or geographical origin determination.

2.1. Honey Samples

Based on the main objective of this study, the strategy was to collect honey samples from different meliferous areas, in order to study the typicity of Robinia pseudoacacia honey from Romania. Fifty honey samples were collected directly from beekeepers; the selection was made in three distinct geographic regions with different pedological characteristics (diverse landforms, proportionally distributed and concentrically arranged around Transylvania Plateau), and climate (temperate-continental, with regional climatic variation due to the variated topography), with predominant Robinia pseudoacacia trees as nectar sources. Zone 1 was represented by Transilvania region (Alba, Cluj, Covasna, Harghita, Mures and Satu Mare counties), Zone 2 was the southern part of Romania (Călăraşi, Dolj, Giurgiu, Teleorman and Vȃlcea counties) and Zone 3 were mainly eastern part of Romania (Bacău, Botoşani, Buzău, Galaţi, Suceava, Tulcea and Vaslui counties) (Figure 1). Samples were kept in glass jars, at 4 °C, in dark places until analysis.

2.2. Chemicals and Reagents

All chemicals and reagents were analytically grade purity. Ultrapure water was made with MilliQ Integral SG Wasseraufbreitung (Darmstadt, Germany). Sigma Aldrich (Steinheim, Germany) provided fructose, glucose, sucrose, maltose, isomaltose, trehalose and erlose. A mixture of homologues n-alkanes (C7–C30) (Sigma, Darmstadt, Germany) was used for gas chromatographic determinations of VOCs.

2.3. Physico-Chemical Analysis

Selective physicochemical parameters were determined according to Romanian standard [29] and Harmonized Methods of International Honey Commission [30]. Water content was determined refractometrically (Abbe digital refractometer, WYA-S, Selecta, km. 585, ABRERA Barcelona, Spain) Spain). The respective content was expressed as mg/100 g; the water activity was measured using a water activity meter Decagon, AquaLab CX-3 (Pullman, WA, USA). Measuring cells were placed minimul 2 h into a thermostatated chambre “Zanotti” type at 20 °C and measured afterwards. Equipment etalonation was made by measuring distilled water activity (aw = 1.000 ± 0.003 La 20 °C) and a standard of lithium chloride (aw 0.120 ± 0.003 La 20 °C). Color has been determined using refractrometric method in uniform color space CIELAB (Supplementary Figure S1), where any color may be specified by using rectangular coordinates L*, a*, b*. Axes a* and b* represent color tonality, and L* axis represent the luminosity.
Measurement principle is placing the sample in a three-dimensional space, in a position in three-axis rapping as follows:
  • L* which place the sample on the axis that has black and white;
  • a* which place the sample on the axis that has green and red;
  • b* which place the sample on the axis that has blue and green.
Measuring equipment, HUNTERLAB miniscan XE (Reston, VA, USA), measures by spectrophotometry the reflectance of the sample color.
L* value indicate the degree of brightness, positive values of a* indicates red zone, negative values of a*, green component; positive values of b* indicates yellow zone and negative values of b* indicates blue component.
The HPLC analysis of the carbohydrates is carried out on a modified Alltima Amino 100Å stainless steel column (Hicrom, Berkshire, UK) (4.6 mm diameter, 250 mm length, particle size 5 μm) following IHC method modified in APHIS-DIA Laboratory [16]. The SHIMADZU instrument (LC–10AD VP model, Shimadzu, Kyoto, Japan) was equipped with degasser, two pumps, autosampler, thermostat oven, controller and refractive index detector. The injection volume was 10 μL and the flow rate 1.3 mL/min. The mobile phase is a solution of HPLC purity acetonitrile and ultrapure water (80/20 v/v). Briefly, 5 g of honey were dissolved in water (40 mL) and transferred quantitatively into a 50 mL volumetric flask, containing 25 mL methanol HPLC grade purity and filled up to the mark with water. The solution was filtered through a 0.45 µm membrane filter, collected in sample vials and placed in autosampler for analysis. For the quantification of main sugars, different calibration curves in the range 50–0.25 g/100 g (fructose 50–20 g/100 g; glucose 10-40 g/100 g; sucrose 0.3–15 g/100 g; turanose, maltose, isomaltose, erlose 0.25–5 g/100 g), with regression coefficients (R2) higher of 0.998 were obtained. The results are expressed in g/100 g honey.

2.4. Solid-Phase Microextraction and GC-MS Analysis

For the evaluation of the VOC profile in honey, a SPME automatic support was used, equipped with a fiber type 50/30 divinylbenzene/carboxen/polydimethylsiloxane (DVB/CAR/PDMS) (Supelco, Bellefonte, PA, USA). Thus, 4 g of each honey sample in a 30 mL headspace vial, sealed afterwards with a screwed cap with PTFE/silicon septa. Samples were homogenized and heated to 40 °C for 30 min. After equilibration, the fiber was introduced into the vial headspace through the septum and exposed to the sample for 30 min.
Volatile analyses were performed using a GC Agilent 7890A system (Wilmington, DE, USA) with injectors both with and without mobile phase flux dividers and an AGILENT 5675C inert XLEO/CI MSD mass spectrometry with a triple-axis detector. The SPME fiber was desorbed at 250 °C for 5 min without dividing of the mobile phase. The separation of VOC was performed on a Hewlett-Packard SP-5-DBWAX (30 m × 0.25 mm i.d. and 0.25 µm film thickness) (Bellefonte, PA, USA).
The column temperature was maintained in the column oven following the gradient: the initial temperature of 35 °C was kept constant for 5 min, raised with 3 °C/min until it reached 50 °C. After this, it raised with 5 °C/min until 180 °C, with 6 °C/min up to 250 °C and held at this value for 10 min. The temperatures of the injector and detector were set at 250 °C and 230 °C, respectively. Helium was used as carrier gas (>90% purity).

2.5. Data Analysis

The identification of the compounds was made by retention time and by comparing the mass spectra obtained with standard mass spectra from the “Pal 600” spectra library. Also, the retention indices (RI) were calculated by injecting a mixture of homologues n-alkanes (C7–C30) under the same chromatographic conditions (Sigma, Darmstadt, Germany) [31]. Furthermore, the indices calculated for the selected compounds were compared with the literature data (www.pherobase.com). For a better quantification of the results, the method of normalization area was used, each compound’s concentration being calculated according to the following expression:
X% = (AX/ƩAi)
where: Ax: The compounds surface, ƩAi: The sum of all identified compound’s surface.

2.6. Statistical Analysis

Physico-chemical analysis were performed in triplicate, data being expressed as mean ± SD. Differences between means were determined using one-way ANOVA test (IBM SPSS Statistics for Windows, Version 25.0, IBM Corp., Armonk, NY, USA). Variance analysis, ANOVA, calculates the ratio between the variation caused by intergroup and intragroup differences and establishes whether this ratio is large enough in order to distinguish the groups.

3. Results and Discussion

3.1. Physicochemical Parameter Values for Acacia Honeys

Acacia honey in general has a low water content [14,32,33,34,35], which can be observed also in this study. The values obtained are within the limits pertaining to the honeys found in the temperate climate, especially in Europe.
In order to carry out a primary interpretation of the data obtained for this parameter and to have a clear image of its variability in accordance with the geographical origin, a box plot graph of these values was constructed for each zone. The box plot diagram summarizes the charts for the five values specific to their spread in each zone (the minimum, the first quartile, the median, the third quartile and the maximum) and the extreme values. In this chart, one can observe a central line for each box plot, representing the median of the values measured for each zone. If the median is closer to the lower margin, the value spread leans towards the left, and if it is closer to the higher margin, the spread leans towards the right. For Zone 1, the maximum of the median was found to be 16.704, for Zone 2, 17.416, and for zone 3, the median value was 17.088. The box plot shows 50% of the values, and its size shows result variability. The horizontal lines above and below the box are traced from between the minimum and the maximum for each zone, so that the minimum values are 15.4, 15.8 and 17.1 for zones 1, 2, 3, respectively. The extreme values are placed outside the box plot and are marked with “*”, accompanied by the sample number. In the case of water content determination, two extreme values have been found, samples S15 (belonging to Zone 1) and S25 (Zone 2) (Supplementary Figure S2).
The values obtained for water activity ranged between 0.540 (S51, Zone 1) and 0.690 (S25, Zone 2) (Table 1).
A water activity value of 0.562 was recorded for Slovakian acacia honey [36], 0.490 for Czech honey [33] and 0.81 for Romanian honey [37].
The L* value shows the brightness level, positive values of the parameter a* show red zone, negative values for a* show the green component, positive values for b* show the yellow zone and negative values for b* indicate the blue component. The values for L* (Table 2) were between 50.19 and 62.70, and the average obtained after measuring all the samples was 58.96. These values are in accordance with those measured by Bertoncelj et al. [38] for Slovenian honey (64.4), some Spanish honeys (51.62–56.11) [38] but are much higher than those found for Slovakian honey (11.29) [36] and other Romanian acacia honeys (48.96) [37].
The value for parameter a* (Table 2) lies between –1.28 and 5.80. The average obtained by the measuring of all the samples was 0.08 ± 1.12. A wide distribution can be observed when determining this parameter, as samples were situated in the green zone (negative a*), as well as in the red zone (positive a*). Only positive values were found for this parameter by Kasperová et al. (4.07) [35] in the case of Slovakian honey, Romanian honey [37], whereas Bertoncelj et al. [38] found only negative values for Slovenian acacia honey (−2.82), as well as Karabagias et al. [8] for Portuguese honey. As it can be observed in Table 2, the positive and negative values obtained for this parameter cannot be linked to geographical origin or with the sample year of harvest. Each zone has shown both negative and positive values. The same characteristic presented Spanish honey [39].
As for b* parameter values (Table 2), the recorded minimum was 6.23, and the maximum 30.41. The measurement average for all zones was 15.70. Despite the fact that the zone between the minimum and maximum values of the b* parameter is relatively vast, the average obtained for acacia honey in correlated to the value found for Slovenian acacia honey [38] (17.95) and to that of Slovakian honey (14.66) [36], but much higher than other Romanian acacia honeys [37].
The highest median value for the L* parameter was recorded in the case of the samples from Zone 1 (59.315), a value close to the one from Zone 3 (59.062), while the value for Zone 2 has shown the lowest value (58.177). Variance values are higher than one and show a greater degree of variation. The results of the ANOVA p = 0.5662 and F = 0.575 test show that there are no significant differences between samples when measuring this parameter. Thus, the samples are homogenous (Table 3).
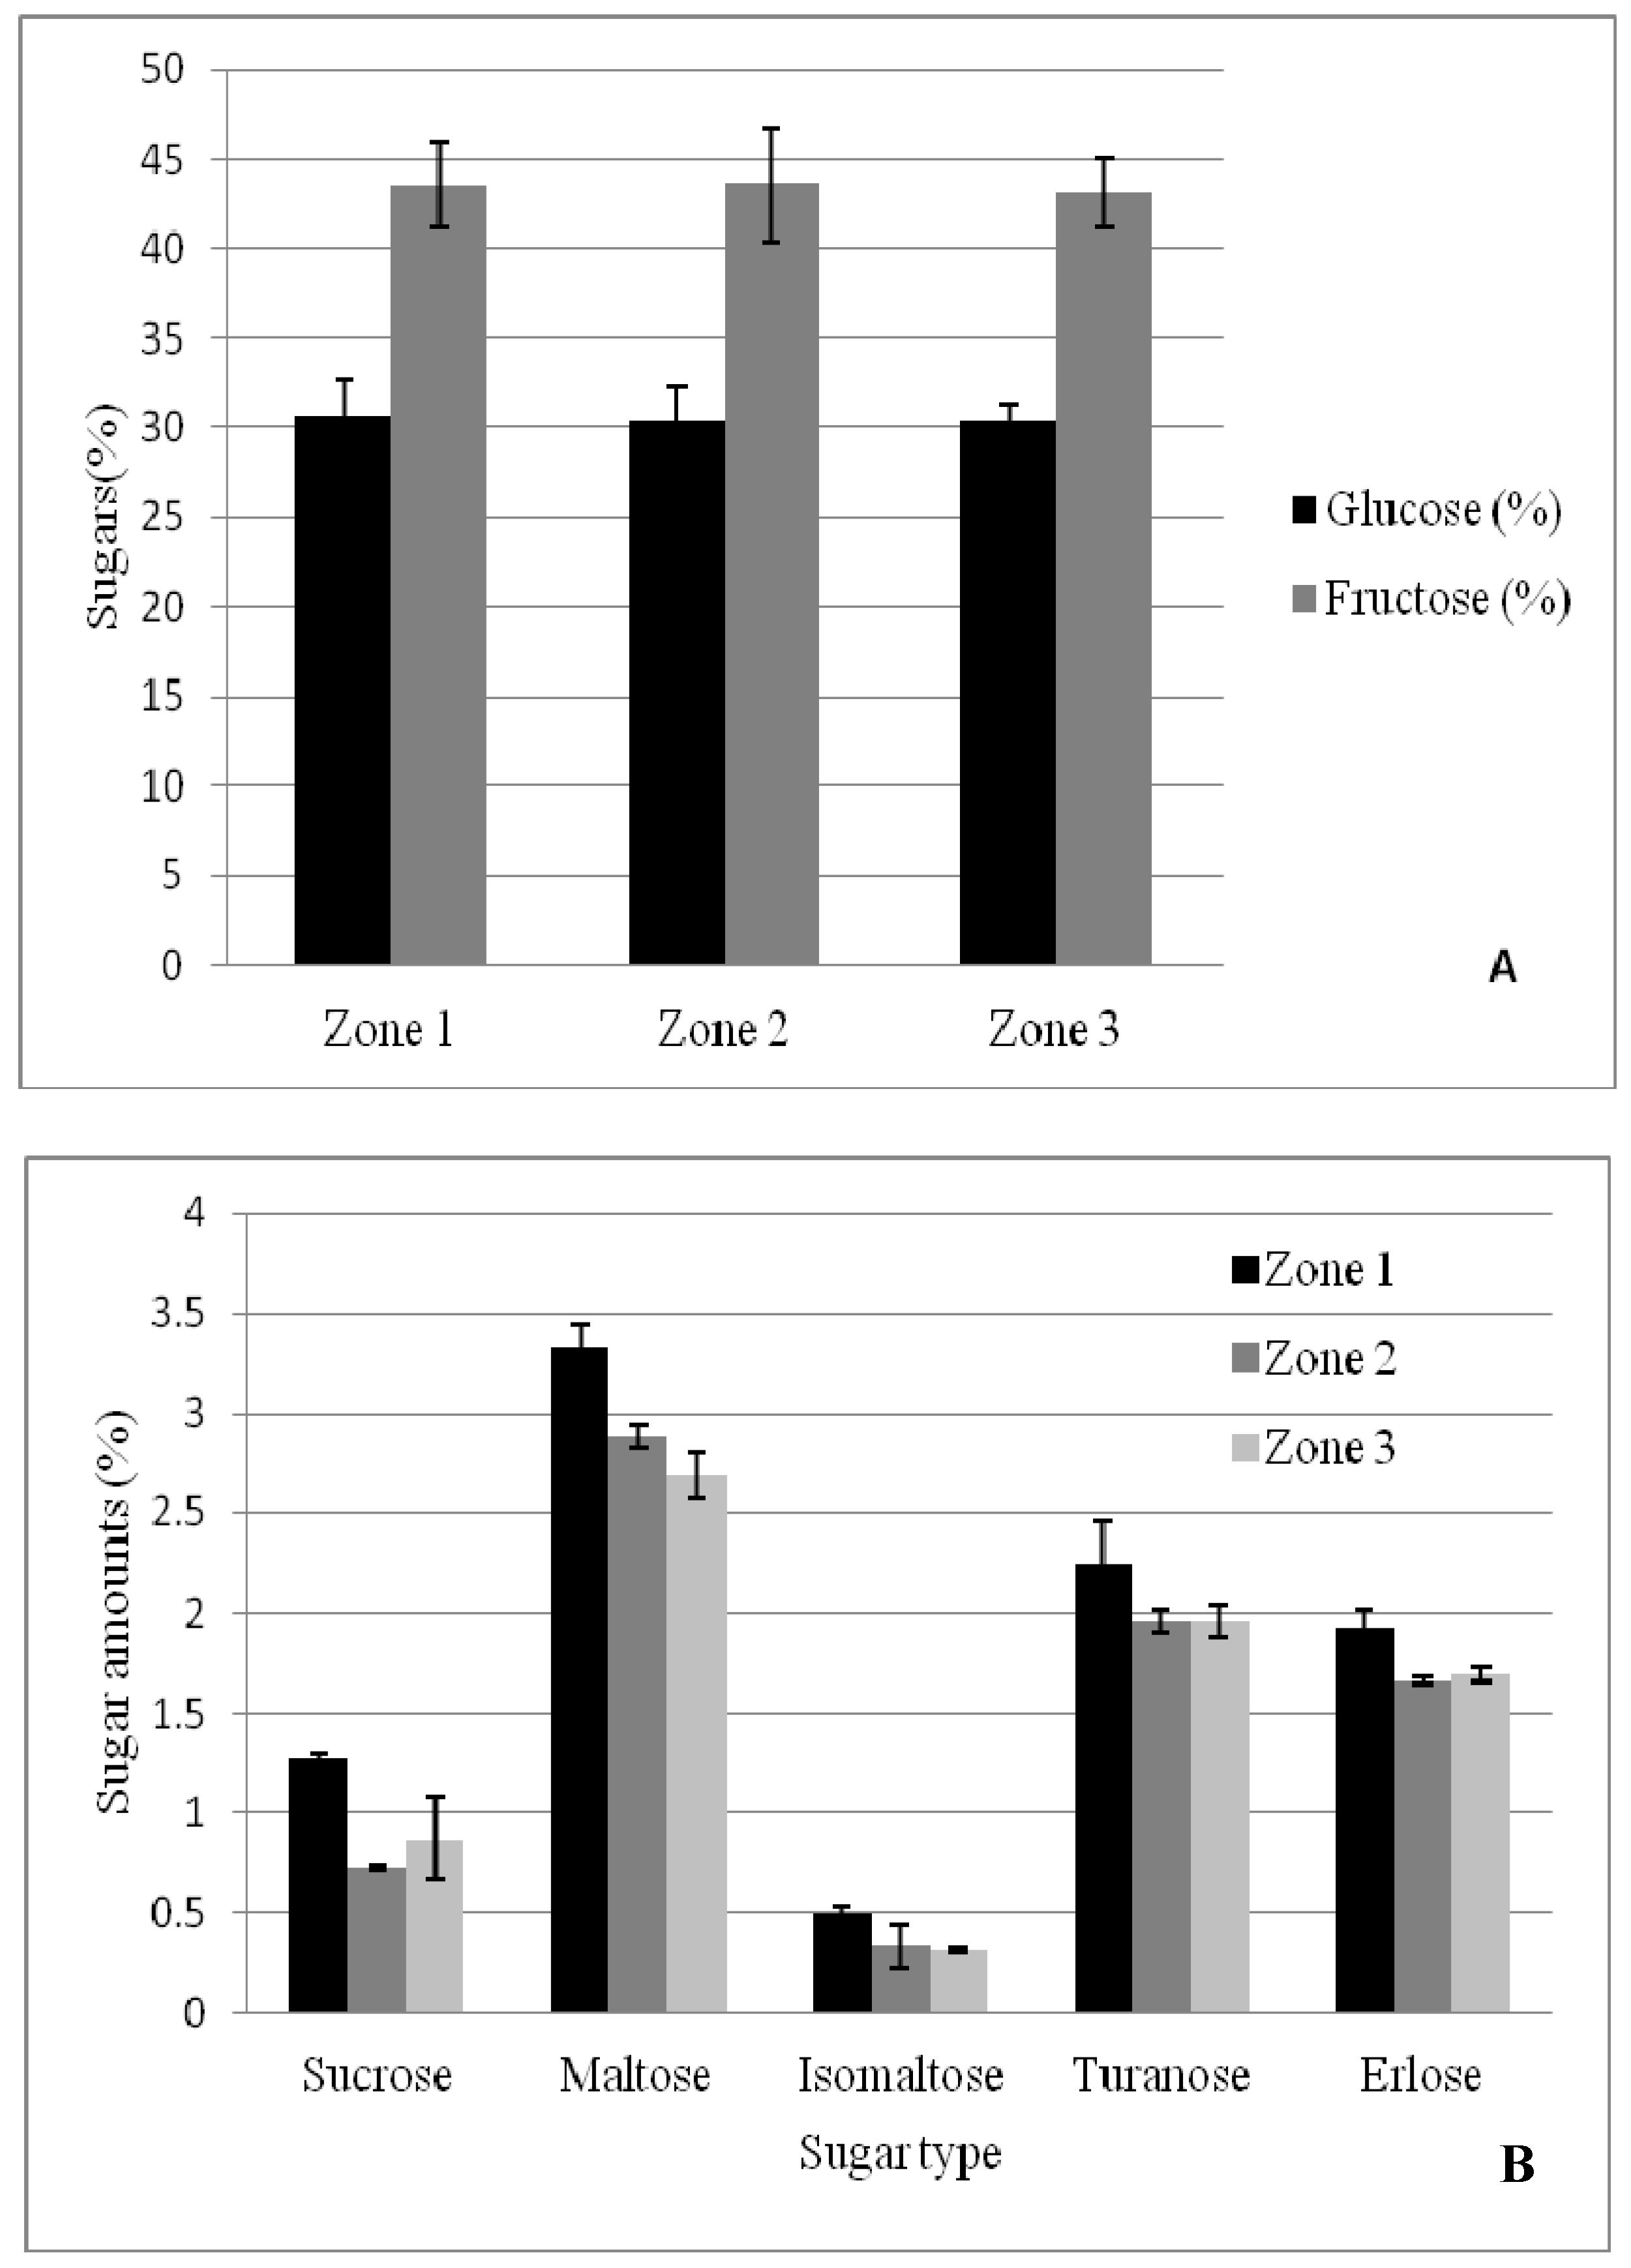
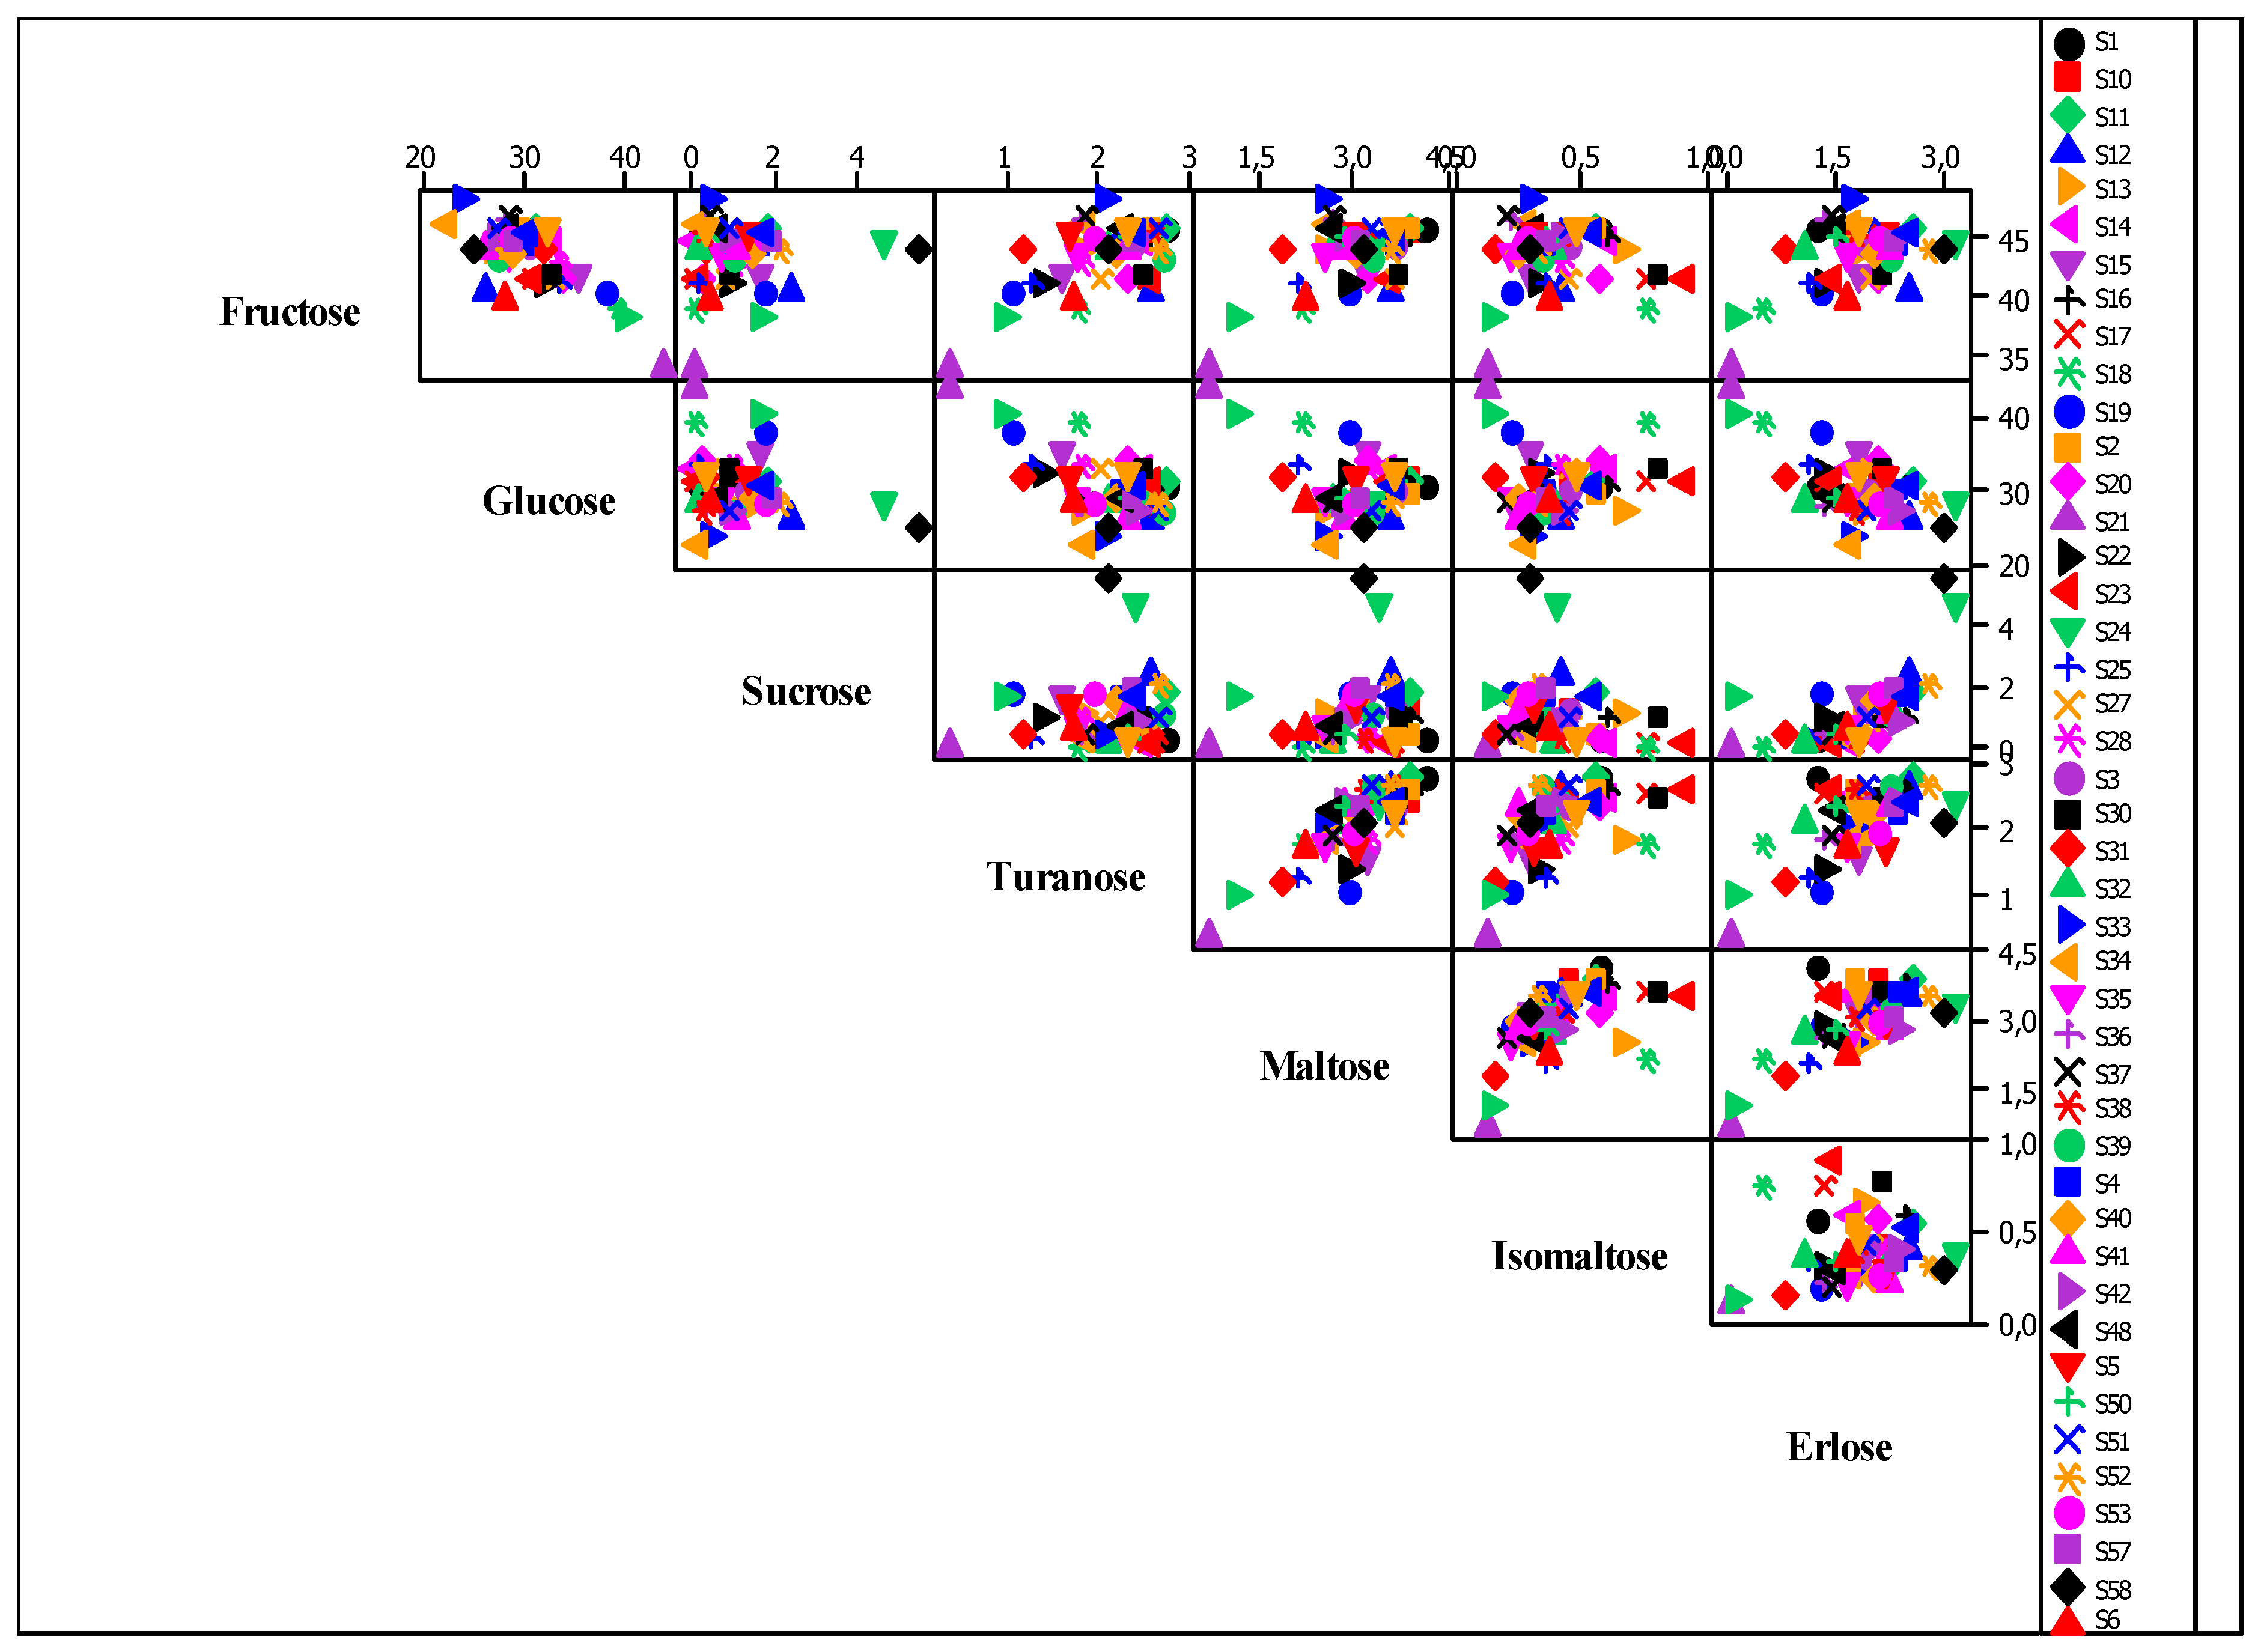
The results obtained for each sugar are presented in Figure 2A, B. Each identified and quantified sugar was individually discussed, as the values obtained are extremely important to determine and authenticate the botanical origin of the honey samples.
As far as the glucose content is concerned, the values obtained for the 50 analyzed samples ranged between 22.32% and 43.71%. The mean value obtained for every zone was: 30.57 (Zone 1), 30.40 (Zone 2) and 30.37% (Zone 3).
Generally, acacia honey has an average glucose content of 26.3% [40]. Romanian acacia honey has values ranging from 30.87% [41] and 32.58% [14]. The results obtained by analyzing these samples fell within these limits and proved to be very similar to other acacia honeys in Europe [42,43].
The fructose content is a very important parameter in analyzing acacia honey. The fluid state of this type of honey is due to a high fructose content and implicitly to a higher than 1.2 fructose/glucose ratio. The results obtained following the HPLC analysis of fructose in the honey samples (Figure 2A) ranged between 33.80% and 48.16%. The mean value of the fructose content for each zone was: 43.55 (Zone 1), 43.58 (Zone 2) and 43.15% (Zone 3). While determining this parameter, we could observe the fact that only 5 samples out of 50 had a lower than 40% fructose content. Similar values were obtained in the case of other acacia honey samples from Romania [14,41] or other acacia honey samples in Europe [42,43]. As it has already been mentioned, the fructose/glucose ratio is very important in acacia honey analysis. Sabatini et al. [40] found about a 1.66 ± 0.14 ratio in the case of acacia honey. The results obtained following the HPLC analysis of individual carbohydrates in the analyzed samples highlight (with three exceptions) the supraunitary values of this ratio, while 50% of the samples showed a > 1.5 ratio.
Sucrose is a very important indicator of honey authenticity, as standards require a maximum of 5% in authentic honey. The samples analyzed have significantly lower values, under no suspicion of falsification. The values registered ranged between 0.0 and 5.51%, with an average value of 1.0% (mean of all zones) (Figure 2B). Only one sample had a concentration higher than 5% (sample S58, Zone 1). Some of the analyzed samples had a sucrose content that proved to be under the detection limit of the method and device (0.02%). The results obtained in this study confirmed earlier studies [41,44,45,46,47].
The ANOVA analysis (the ratio between the variance produced by differences inside the groups and the variance produced by differences outside the group) shows that there are no statistic differences (p = 0.3010 > 0.05 and F = 1.23174 < Fcrit) between the samples harvested from the three production zones.
Maltose is an important disaccharide found in honey with determined values ranging between 1.3% [40], 1.9% [48] and 2.5% [49] or a medium value of 3.53% obtained by Mărghitaş et al. [14] for acacia honey in Romania (Transylvania). It is generally found in nectar honey and particularly in acacia honey.
The values obtained after analyzing the samples in this study varied between 0.68 and 4.16%. The ANOVA variance analysis shows that the value of p is lower than 0.05 (p = 0.012177), but F is bigger than Fcrit. (F = 4.848788 and Fcrit = 3.195056). Consequently, the hypothesis fails because there are significant differences between the samples.
Isomaltose is a disaccharide found in a relatively small quantity in honey, generally less than 1%. Depending on the carbohydrate determination method chosen (HPLC, GC or FTIR), but also on the botanical origin of honey, the quantity may differ, but remains low. The values obtained in the case of acacia honey varied between 0.14 and 0.79% and the mean value of the 50 samples was 0.39%. Similar values were obtained for the acacia honey in Italy [40], other acacia honeys in Romania [14] or the honey in Poland [49]. However, it was easy to observe that this disaccharide presented values two times higher for the samples collected in geographical Zone 1 (Figure 2B). The two other zones presented similar values, although geographically they are very different (Zone 2 being located on the south-west of the country, while Zone 3 represents the eastern part of the country).
Turanose is a sugar found in small quantities in honey. The use of high performance liquid chromatography, gas chromatography or nuclear magnetic resonance, made it possible for this disaccharide to be found by different researchers in small quantities in Portuguese heather honey [50], in Polish nectar honey [49], in 5 types of Italian honey [51], in Hungarian acacia honey [52] and in Turkish nectar and honeydew honey [53].
Turanose was quantified between 0.38 and 2.77%, with an average of 2.08% in the acacia honey samples used in this study. These values are generally higher than the ones found by the aforementioned authors who have analyzed acacia honey, but similar to other honey types analyzed.
Erlose is a trisaccharide found in honey in different quantities, in accordance with its botanical origin. The studies conducted at the APHIS Laboratory (USAMV Cluj-Napoca) have shown a rather high concentration of erlose in acacia honey, compared to other honey types [41].
Although Goldschmidt and Burckert [54] highlighted erlose as a honey component since 1955, many researchers did not report this trisaccharide when using high performance liquid chromatography as a determination method [49,52,55]. The values obtained for the analyzed honey samples ranged between 0.09 and 3.19%.
The glucidic spectrum analyzed by refractive index high performance liquid chromatography has shown the presence of seven saccharides specific to acacia honey. The samples fall between the limits established for this honey type, due to the high fructose content, >1.2 fructose/glucose (F/G) ratio, small sucrose content and higher than one maltose quantities [40,42,43].
In conclusion, the glucidic spectrum for acacia honey was established, and carbohydrate concentrations, especially fructose and F/G ratio, which show high values for this honey type. In order to illustrate the correlations between carbohydrates and to determine which samples are outliers, a graphical representation was made for all carbohydrates, called a matrix plot (Figure 3).
Due to the vast database, high sample and analysis number, it is fit to use a Pearson correlation matrix in order to identify the correlation indices. These indices have a value ranging between (–1 to 1). Table 4, Table 5 and Table 6 show positive values, which means that there is a positive association of parameters, while negative values show an inverse dependence of the two parameters. The values colored in blue are significant for the 0.01 level, while the ones in yellow are significant of the 0.05 level.
For Zone 1, the best correlation was established between ash content and color. Also, positive correlations were found between different sugars, 0.72 for turanose–maltose and 0.79 for saccharose–erlose. The most significant negative correlation found for Zone 1 was between water activity–color (−0.841).
For Zone 2, significant positive correlations were found between sugars, 0.93 for turanose–maltose and 0.90 for sucrose–erlose. The most significant negative correlation was identified between the color parameters L*–a* (−0.94).
For Zone 3, the best correlation was established between water content and water activity, 0.92. The negative correlation found for Zone 3 was between color parameters (−0.80).

3.2. Volatile Compounds

The GC-MS analysis method is a combination of two analytical techniques: capillary column GC, which separates the components of a mixture and mass spectrometry (MS), which supplies the information necessary in the structural determination of each constituent. The results obtained following the SPME/GC-MS analysis is shown as chromatograms (
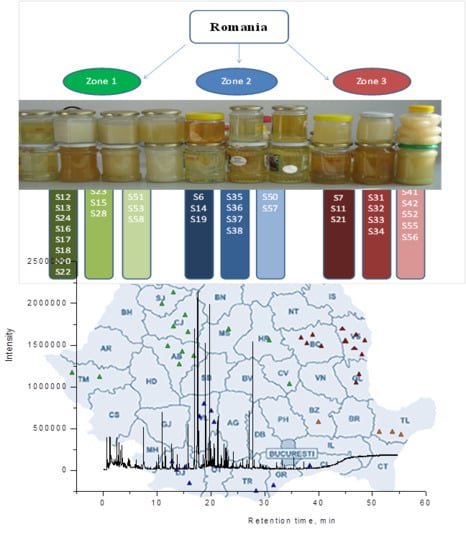
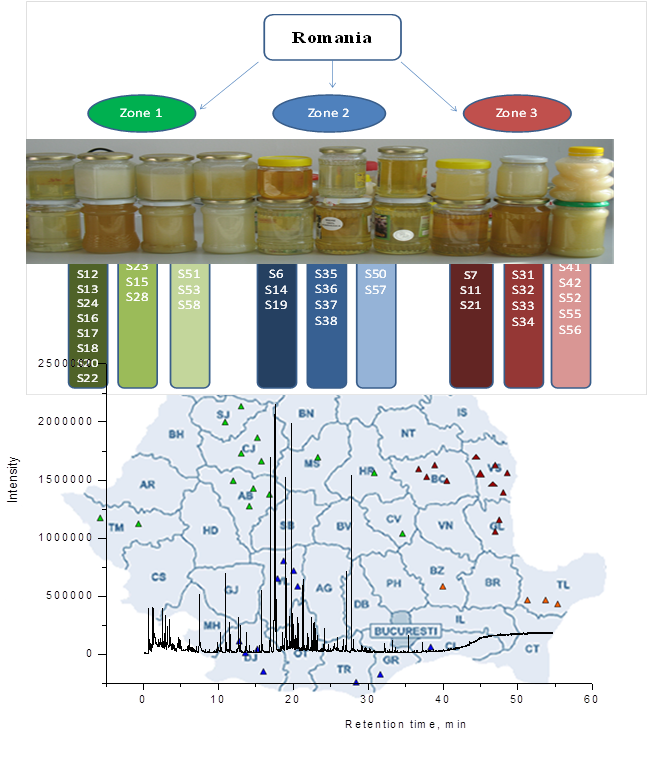
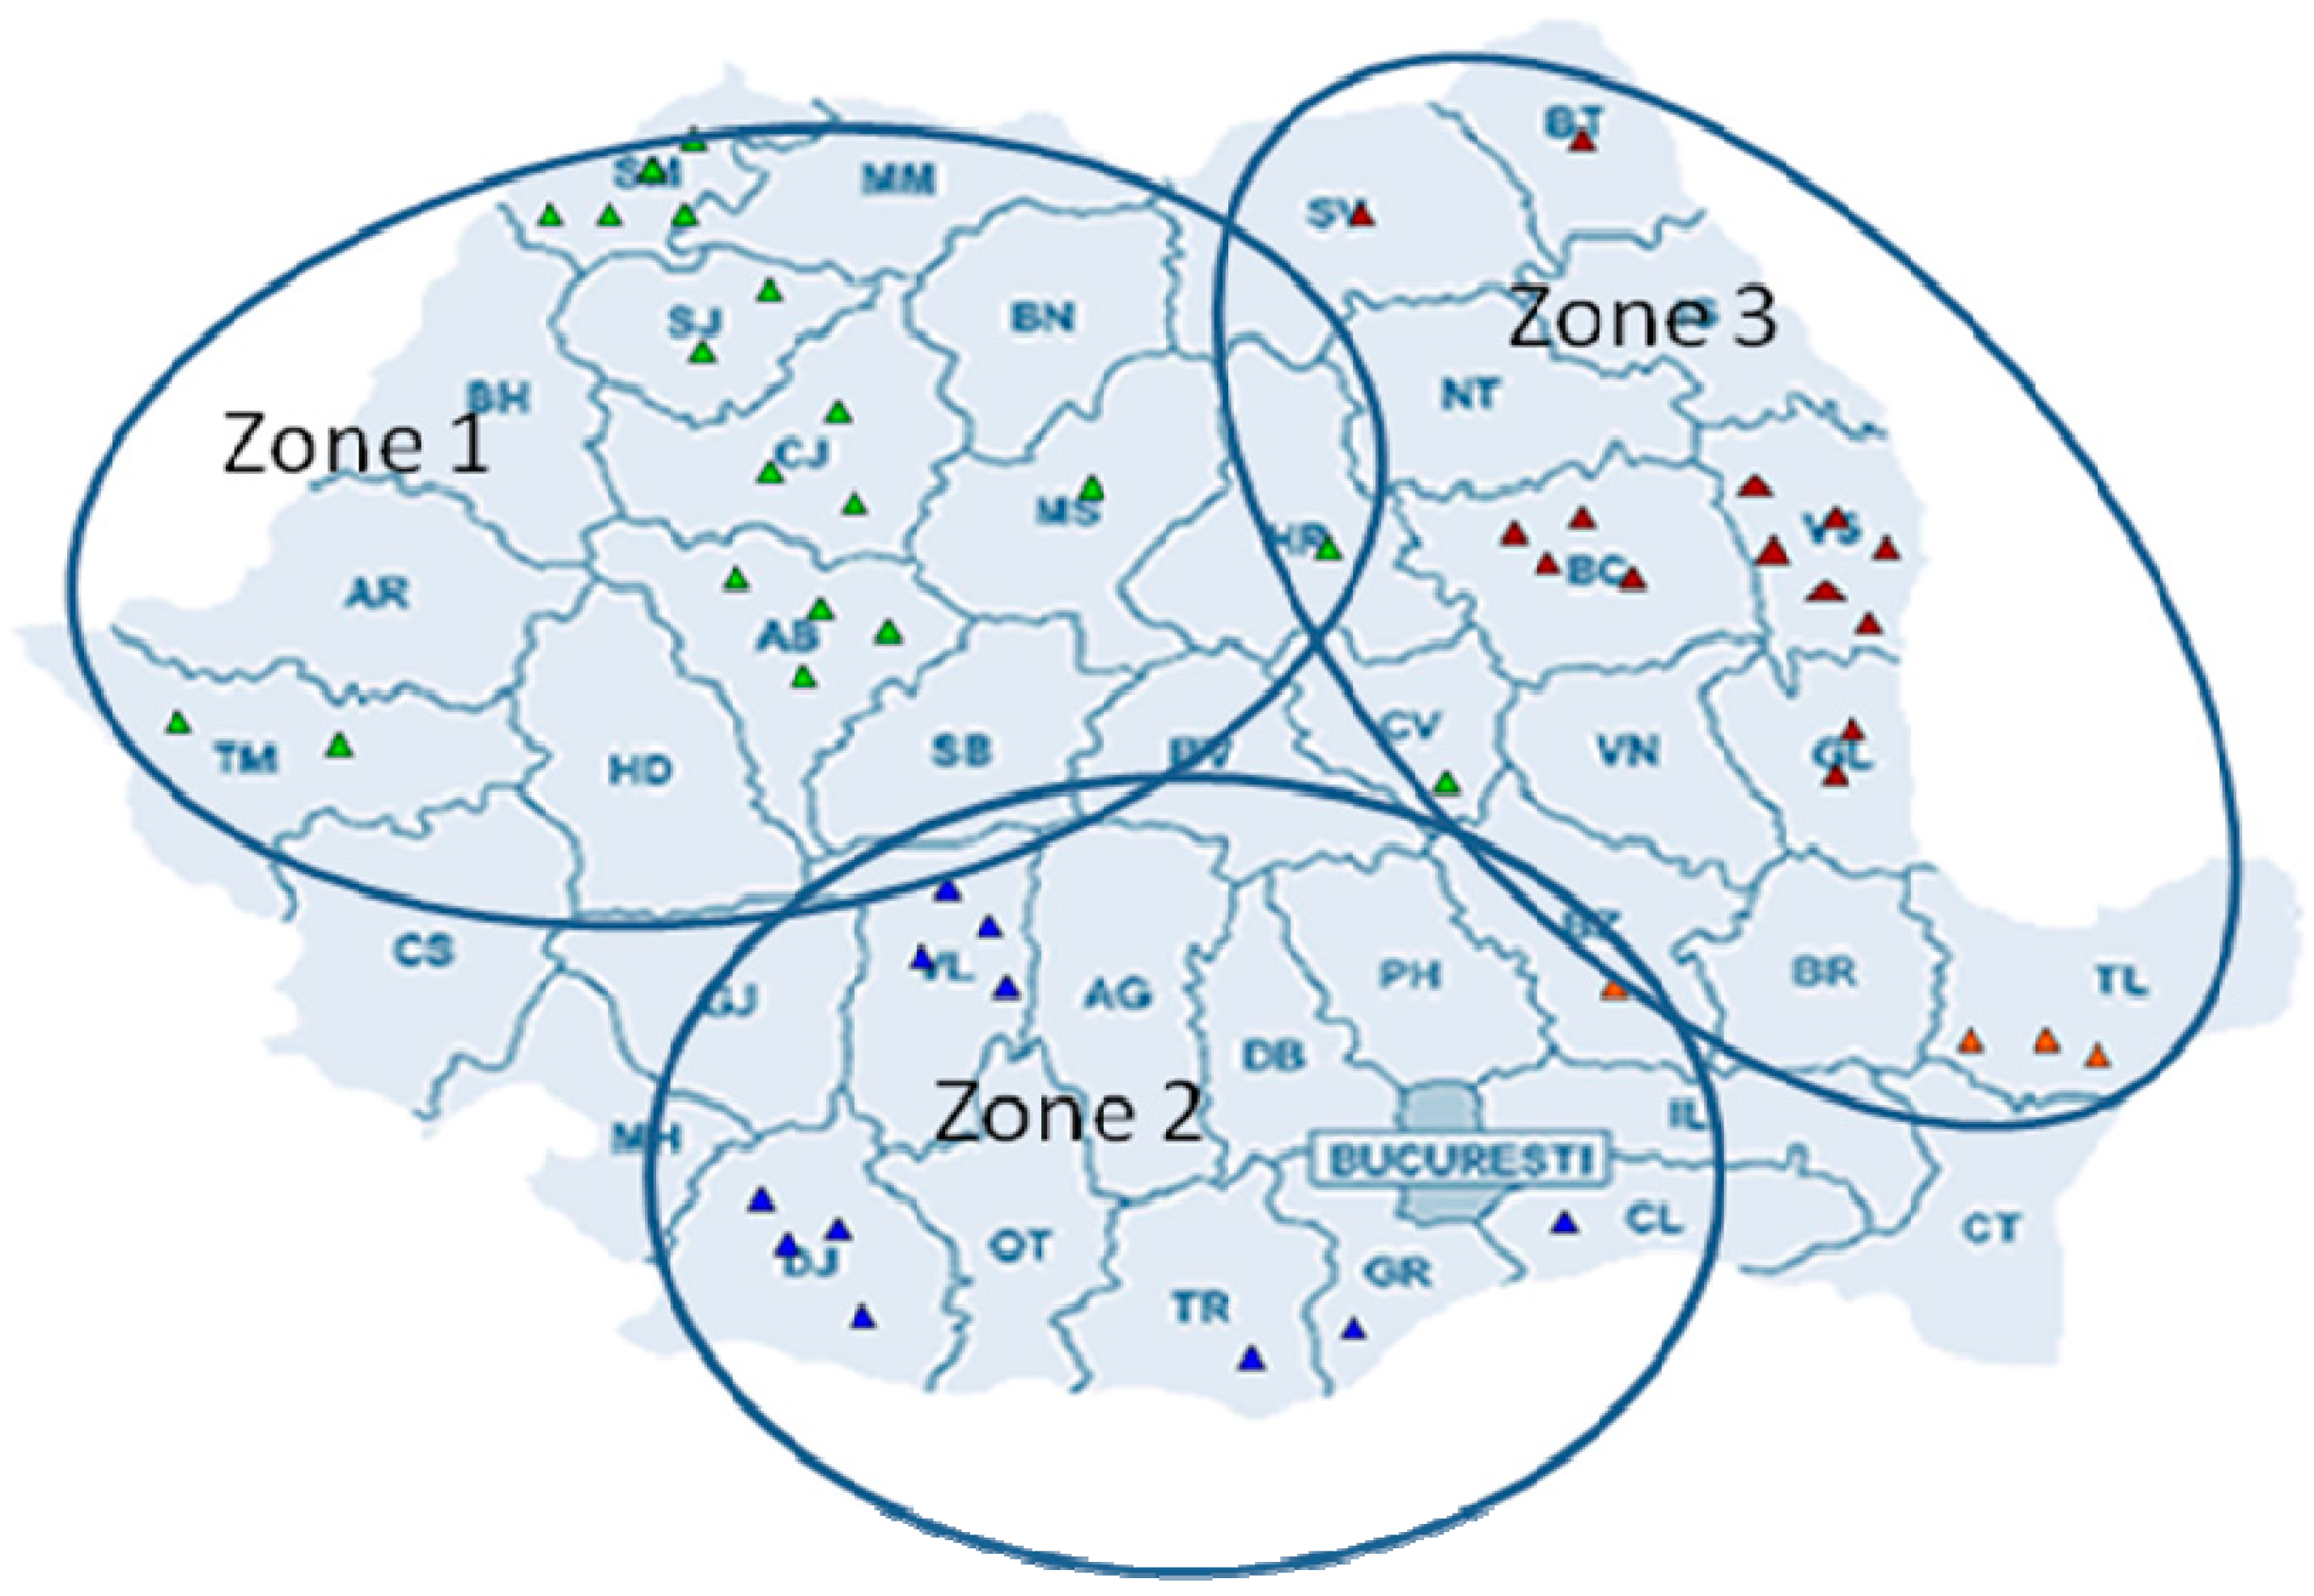
Supplementary Figure S3). Their interpretation is achieved by identifying mass spectrum and the retention time. These two parameters significantly contribute to the identification of each volatile compound found in honey. Also, retention time has a determining role in many cases where the constituents show identical mass spectra. Following the SPME/GC-MS analysis, 79 constituents were identified the honey samples: 72 compounds samples from Transylvania (Zone 1), 57 compounds in samples from Southern Romania (Zone 2) and 66 compounds in samples from Eastern Romania (Zone 3). From all identified compounds, only 54 are common to all 50 samples. The chemotype changes from one region to another, and the difference is constituted by the 6 compounds found only in one region and 9 compounds in two of the regions.
The interpretation of the chromatograms is achieved using the “Data Analysis” program. The noise level is set to 50 for the x-coordinate and the program goes over the chromatogram signal by signal according to this ratio. Identification of the compounds is achieved by comparing standard mass spectra from the “Pal 600” spectra library. The surface is calculated following the “apexing mass” model, which means measuring the surfaces in its entire mass.
The next stage in the qualitative analysis is the calculation of the Kovats indexes. We have used this retention index in order to eliminate the relativity of the retention parameters by inserting some reference points in order to compare the retention times of chromatographic separation for each volatile compound found in honey. In this respect, a mixture of homologues n-alkanes (C7–C30) was used under the same chromatographic conditions (Sigma, Darmstadt, Germany), whose retention indices showed values between 600 and 2200. The retention indices specific to each compound is calculated as follows:
RI = 100 ((log tri − log trn)/(log trn+1 − log trn)),
where: RI: compound retention index, tri: compound retention time, trn: retention time of the adjacent and anterior alkane, trn+1: retention time of the adjacent and subsequent alkane.
The expression of the retention index uses two reference points: the alkane with the same number of carbon atoms in its molecule (n) as the volatile compound identified as i, which will elute before the compound, and the second reference will be the alkane with n+1 carbon atoms in its molecule, which will elute after the i compound. Table 7 comparatively shows the retention indices calculated RIb and the retention indexes found in literature. RIa corresponds to each volatile compound found and the type of column used (polar column). The main bibliographical source used was the PHEROBASE database, which is one of the most comprehensive and up-to-date.
The main volatile compounds of acacia honey identified undoubtedly are: 3-methyl-3-buten-1-ol for Zone 1, ethanol, acetic acid, 5-ethenyldihydro-5-furanone for Zone 2, acetone, 3-methyl-3-buten-1-ol, trans-linalool oxide, benzemethanol for Zone 3. Among the secondary compounds identified in a percentage of 80–90% of the samples one can find:
Dimethyl sulfide, acetone, 3-hydroxy-2-butanone, linalool oxide, acetic acid, 2-furancarboxaldehyde, benzaldehyde, linalool L, ho-trienol, 4-ketoisophorone, epoxylinalool, benzenemethanol for Zone 1;
Dimethyl sulfide, acetone, 3-hydroxy-2-butanone, 2-methyl-2-buten-1-ol, nonanal, linalool, 2-furancarboxaldehyde, 5-methyl-2-furancarboxaldehyde, butanoic acid, epoxy-linalool, 3-hydroxy-2-butanone, methylpentanoic acid, benzenethanol for Zone 2;
Dimethyl sulfide, ethanol, isoamyl alcohol, 2-methyl-2-buten-1-ol, cis-3-hexen-1-ol, linalool oxide, acetic acid, 2-furancarboxaldehyde, benzaldehyde, propanoic acid, hotrienol, butyrolactone, benzeneacetaldehyde, phenol for Zone 3.
Thus, once the qualitative analysis was completed, the volatile profile of the Romanian acacia honey was outlined.
The results revealed that there is a remarkable influence of the production zone on the volatile profile of the honey samples. Of all the identified compounds, only 56 are common to all the 50 samples. The chemotype changes from one region to another, and the difference resides in the 23 compounds found only in certain regions. The compounds found only in Zone 1 are: 2-butanol, 5-methyl-2-hexanone, 2-heptanone, octanal, 2,2-dymethyl propanoic acid, naphthalene, nonanoic and octanoic acids. The origin of these compounds can be either vegetal (nectar and poliniferous plants) or animal, products secreted by the bee. For example, octanol is found in Houttuynia cordata and in Lavandula angustifolia [56]. The 2-heptanone compound was identified in the secretion of bees by Shearer [57], but it is also found in Artemisia dracunculus and Larrea tridentate [58,59]. In regard to Zone 2, borneol and HMF compounds have been identified. Borneol is a monoterpenic compound found in medicinal plants [60]. Borneol is used as an additive in cosmetic products due to its analgesic and antibacterial effects [61]. The presence of the HMF compound is a hint towards honey freshness [62]. In Zone 3, pentanoic acid was found. Also, it was found that Zone 1 shows a volatile profile similar to Zone 3, a relevant example being the existing common compounds, beta-damascenone, hotrienol, benzyl nitrile, 2,5-furancarboxaldehyde. Out of these compounds, beta-damascenone was found in Ipomoea pes caprae with an antispastic effect [63]. Additionally, hotrienol was found to be a component of many honey varieties, and of essential oils of many plants. This compound was found to be specific to citrus, lavender, and mint honey [64,65,66].
By using the peak area, it is possible to determine the percentage of each compound, compared to the total surface of the areas.
The calibration and concentration determination methods for volatile compounds are:
Gauging of the calibration curve method (area normalization);
Internal standard method [67].
For a better interpretation of the results, the first method was used, the concentration of each compound being calculated according to the following expression:
X% = (Ax/∑Ai),
where: Ax: compound surface, ∑Ai: the sum of all identified compound surfaces.
Table 8 shows the semi-quantification results for each product, as well as product chemical classification. The volatile compounds identified in the acacia honey samples stemming from the three geographical areas are classified into 10 chemical subclasses: Sulphur compounds, ketones, esters, aldehydes, alcohols, nitrate compounds, aliphatic hydrocarbons, carboxylic acids, aromatic acids and ethers. From the collected data, we can see that the honey samples harvested from Zone 1 (Transylvania) are the richest in volatile compounds, as all of these compound classes are present in the samples. Keeping in mind that the number of compounds was so high, only the majorities were discussed.
Regarding the presence of acetic acid, this compound was found in samples from all three zones, but in different quantities. Acetic and butyric acids could be produced by bee metabolism [68]. This is the main compound of the honey samples, and its percentages vary between 12.26% for Zone 3, 16.64% for Zone 1 and 24.73% for Zone 2. The previous studies show that the percentage of this compound can vary between 17.32% and 36.15% for different Chilean honey types [19], while having a percentage of 0.01% in Spanish honey [64]. We must mention that the two studies have used different extraction methods, ultrasound extraction and thermal desorption. Kadar et al. [21] have found that Romanian acacia honey has linalool oxide as the main compound, without having identified any acetic acid.
Ethanol is another important constituent of honey, all honey samples have shown a high ethanol content, especially those from Zone 2 and Zone 3, as their content reached 17.91% and 13.07%, respectively. In the case of Transylvanian honey (Zone 1), there was a relatively low ethanol content found, of 4.11%. Bastos and Alves [68] issue the hypothesis that the high ethanol content is due to the presence of ferments. Ethanol was found to be a marker for lavender honey [65]. Furthermore, ethanol was found in honeys of different geographical and botanical origins [8,9,22,64].
The volatile profile found depends on the extraction method. Therefore, the fiber used shows a great affinity for compounds with low molecular mass, like ethanol or acetic acid [69], which justifies the significant presence of all these compounds in the honey samples, from a quantitative point of view.
Another major compound was 2-propanone, present in a high concentration in Zone 3 (20.60%), as opposed to its presence in honey stemming from Zone 1 and Zone 2, where its values were 2.83% and 5.11%, respectively. Transylvanian honeys (Zone 1) have shown the lowest 2-propanone or acetone content, these differences being the result of the discrepancy between geographical, climatic and especially floral conditions. In a recent study, acetone concentration in Chilean honey was determined, according to geographical area. In the eastern part, the zone percentage was between 1.57–17.15%, in the central area, 7.8–9.63%, and in the western zone, 5.00–13.13% [19]. Acetone is considered a marker for pine honey (Albies spp.) [68]. Additionally, acetone was found to be a major compound in acacia and rosemary monofloral honey [65]. Linalool oxide and 2–furancarboxaldehyde are usually found in the honey samples collected from Zone 2 (8.61% and 9.73). Linalool oxide is a compound of floral origin (Pherobase) and is considered to be a secondary product of linalool. Jerkovic et al. [70] determined a 2.23% concentration of this product in acacia honey, whereas in chestnut honey, the concentration was of 0.40%.
Furfural is a compound derived from furan, which is considered to be an indicator of the thermal and storage processes [64]. On the other hand, furfural was identified as being a relevant compound in unifloral lime tree, lavender and acacia honey [65]. Furfural is present in all regions with an area percentage of 9.73% for Zone 2, 7.26% for Zone 1 and 5.24% for Zone 3. Radovic et al. [71] established furfural as being a marker for rape honey. These volatile compounds, furfural and 5-methyl-furfural were identified in fresh citrus honey. Moreover, the evolution of the concentration of these compounds was observed and it intensified during storage and temperature increase from 10 to 40 °C [64]. The mild heating of the samples during the SPME analysis recommended for the improvement of the extraction result and the reduction of the balance time, may be responsible for some of these compounds [72].
We can also observe a higher benzaldehyde content, especially in Zone 1 honey (7.23%), as compared to the one in Zone 2 (3.89%) and Zone 3 (4.68%). Benzaldehyde was identified as being a relevant compound in lavender, acacia and rosemary honey [65,72]. Yang et al. [73] identified benzaldehyde as being a volatile marker in Corsican chestnut honey with a 10.8% concentration. Furthermore, we can also note the presence of benzeneethanol in significant amounts in the case of the honey samples from Zone 2 (3.58%), Zone 1 (2.78%) and Zone 3 (2.37%). Benzenethanol and benzoic acid were identified as rape honey markers [74].
Alcohols constitute an important part of Romanian honey samples reaching values of 28.35% in Zone 3, 23.87% in Zone 2, 19.13% in Zone 1. The alcohols present in all the zones were ethanol, 2-propanol, 2-methyl-3-butene-2-ol, isoamyl alcohol, 3-methyl-3-butene-1-ol, 2-methyl-2-butene-1-ol, cis-3-hexen-1-ol, 2-ethyl-1-hexanol, linalool, hotrienol, alfa-terpienol, benzeneethanol, benzenemethanol, phenol. Among the identified alcohols, ethanol, benzeneethanol, 3-methyl-3-butene-1-ol proved to have the highest area percentage of all the analyzed samples (Table 8).
Alcohols represent important markers of honey; alcohols, such as 3-methyl-3-butene-1-ol and 2-methyl-2-butene-1-ol were described as adding a fresh aroma, their presence in honey being associated with different floral origins [64]. Ethanol, 2-methyl-propanol and 3-methyl-3-butene-1-ol were described as being very important compounds in monofloral lavender honey [65]. The identification of 3-methyl-3-butene-1-ol was also associated with monofloral rosemary honey [75].
As far as aldehydes are concerned, it can be observed that the honey samples from Zone 1 present the highest concentration, 27.63%, followed by the ones from Zone 2 with a 22.34% concentration. The samples in Zone 3 have a relative aldehyde concentration of 13.43%. The aldehydes identified in the samples from all the three production areas are: 3-methyl-butanal, heptanal, 3-methyl-2-butanal, nonanal, furfural, decanal, benzaldehyde, lilac aldehyde, 5-methyl-2-furancarboxaldehyde, acetaldehyde and 3-phenylfenil-propenal. Plutowska et al. [76] have established hexanal as a specific marker for the acacia honey produced in Poland, while methyl butanol and lilac aldehyde proved to be a specific marker for the Polish honeydew honey. The following substances from the aldehyde group were also identified in the composition of these honeys: hexanal, nonanal, decanal, acetaldehyde and lilac aldehydes.
Ketones, sulfur compounds, esters and aliphatic hydrocarbons were also identified in small amounts, but none of them could be considered markers for acacia honey.
As other studies presented the idea that minor compounds also influence honey flavor, the table was organized in order to summarize the specific aromas of all the identified volatile compounds. Thus, it can be observed that the honey aroma is very complex and depends on the specific flora of each production zone, but also on the compounds secreted by the bees or on the transformations that occur during storage.

4. Conclusions

In accordance with the motivation and the objectives proposed, the quality indices and the biomarkers specific to acacia honey were established. However, pure acacia honey represents only a low percentage of the total honey production, as the majority of honeys have a varied composition of nectar or honeydew, being thus considered polyfloral honeys. Therefore, distinguishing monofloral honeys from polyfloral honeys is a significant challenge that involves assessing the botanical origin of honey and its correct labelling. Volatile compounds can be useful in classifying acacia honeys, but they are insufficient in order to distinguish between the samples produced in different areas. As such, the use of multiple volatile compounds is recommended, which will constitute the volatile fingerprint of a certain area, so that the results are less susceptible to the variation of individual components.
Many consumers seek for products with special aromas, specific to production zones. In conclusion, consumer affinity for the special aroma of the acacia honey, which have an important nutritional value, being recommended in small amounts even for diabetes patients [77], is legitimate and this study aims at scientifically explaining the fact that honey flavor is influenced by its origin.

Supplementary Materials

The following are available online at https://www.mdpi.com/2304-8158/8/10/445/s1, Figure S1: CIELAB color space (www.printroot.com); Figure S2: Descriptive statistics for water content of Romanian acacia honey and box plot graph for the three production zones, Figure S3: GC-MS chromatogram of VOC in sample S1.

Author Contributions

Conceptualization, N.M.M.; data curation, K.B.N.; formal analysis, N.M.M.; funding acquisition, D.S.D.; investigation, M.-L.F.; methodology, M.-L.F, V.B.; review, M.-L.F; supervision, L.A.M., E.H.; validation, K.B.N.; visualization, F.F.; writing—original draft, N.M.M., O.B.; writing—review and editing, O.B.

Funding

The research did not receive external funding.

Acknowledgments

The manuscript is part of NMM PhD thesis. Financial support for the manuscript was granted by project SAFE-HONEY (PN-III=P2-890/12.09.2017 (to VB and OB) and Program 1 - Development of the National Research and Development System, Subprogram 1.2 - Institutional Performance - Projects for Financing the Excellence in CDI, Contract no. 37PFE/06.11.2018. Title of the project: “Increasing the institutional performance through consolidation and development of research directions within the USAMVCN” (to DSD and BO).

Conflicts of Interest

The authors declare no conflict of interest.

References

  1. EU Council. Council Directive 2001/110/EC of 20 December 2001 relating to honey. Off. J. Eur. Commun. 2002, 10, 47–52. [Google Scholar]
  2. Alvarez-Suarez, J.M.; Tulipani, S.; Romandini, S.; Vidal, S.A.; Battino, M. Methodological Aspects about Determination of Phenolic Compounds and in Vitro Evaluation of Antioxidant Capacity in the Honey: A Review. Curr. Anal. Chem. 2009, 5, 293–302. [Google Scholar] [CrossRef]
  3. Anklam, E. A review of the analytical methods to determine the geographical and botanical origin of honey. Food Chem. 1998, 63, 549–562. [Google Scholar] [CrossRef]
  4. Escuredo, O.; Dobre, I.; Fernández-González, M.; Seijo, M.C. Contribution of botanical origin and sugar composition of honeys on the crystallization phenomenon. Food Chem. 2014, 149, 84–90. [Google Scholar] [CrossRef] [PubMed]
  5. Oroian, M.; Amariei, S.; Leahu, A.; Gut, G. Multi-Element Composition of Honey as a Suitable Tool for Its Authenticity Analysis. Polish J. Food Nutr. Sci. 2015, 65, 93–100. [Google Scholar] [CrossRef] [Green Version]
  6. Estevinho, L.M.; Feás, X.; Seijas, J.A.; Pilar Vázquez-Tato, M.P. Organic honey from Trás-os-Montes Region (Portugal): Chemical, palinological, microbiological and bioactive compounds characterization. Food Chem. Toxicol. 2012, 50, 258–264. [Google Scholar] [CrossRef] [PubMed]
  7. Kaškoniene, V.; Venskutonis, P.R. Floral markers in honey of various botanical and geographical origins: A Review. Compr. Rev. Food Sci. Food 2010, 9, 620–634. [Google Scholar] [CrossRef]
  8. Karabagias, I.K.; Maia, M.; Karabagias, V.K.; Gatzias, I.; Badeka, A.V. Characterization of Eucaliptus, Chestnut and Heather Honeys from Portugal Using Multi-Parameter Analysis and Chemo-Calculus. Foods 2018, 7, 194. [Google Scholar] [CrossRef] [PubMed]
  9. Manyi-Loh, C.E.; Ndip, R.N.; Clarke, A.M. Volatile Compounds in Honey: A review on Their Involvment in Aroma, Botanical Origin Determination and Potential Biomedical Activities. Int. J. Mol. Sci. 2011, 12, 9514–9532. [Google Scholar] [CrossRef] [PubMed]
  10. Juan-Borrás, M.; Domenech, E.; Escheriche, I. Correlation between methyl anthranilate level and percentage of pollen in Spanish citrus honey. Int. J. Food Sci. Technol. 2015, 50, 1690–1696. [Google Scholar] [CrossRef] [Green Version]
  11. Juan-Borrás, M.; Domenech, E.; Hellebrandova, M.; Escheriche, I. Effect of country origin on physicochemical, sugar and volatile composition of acacia, sunflower and tilia honeys. Food Res. Int. 2014, 60, 86–94. [Google Scholar] [CrossRef]
  12. Kádár, M.; Juan-Borrás, M.; Carot, J.M.; Domenech, E.; Escheriche, I. Volatile fraction composition and physicochemical parameters as tools for the differentiation of lemon blossom honeys and orange blossom honey. J. Sci. Food Agric. 2011, 91, 2768–2776. [Google Scholar] [CrossRef] [PubMed]
  13. Persano-Oddo, L.; Piro, R. Main European unifloral honeys: Descriptive sheets. Apidologie 2004, 35, 38–81. [Google Scholar] [CrossRef]
  14. Mărghitaş, L.A.; Dezmirean, D.; Moise, A.; Bobiş, O.; Laslo, L.; Bogdanov, S. Physico-chemical and bioactive properties of different floral origin honeys from Romania. Food Chem. 2009, 112, 863–867. [Google Scholar] [CrossRef]
  15. Karabagias, I.K.; Karabournioti, S. Discrimination of Clover and Citrus Honeys from Egypt According to Floral Type Using Easily Assessable Physicochemical Parameters and Discriminant Analysis: An External Validation of the Chemometric Approach. Foods 2018, 7, 70. [Google Scholar] [CrossRef] [PubMed]
  16. Bonta, V.; Mărghitaş, L.A.; Stanciu, O.; Laslo, L.; Dezmirean, D.; Bobiş, O. High performance liquid chromatographic analysis of sugars in Transilvanian honeydew honey. USAMVCN Bull. 2008, 65, 229–232. [Google Scholar]
  17. Cotte, J.F.; Casabianca, H.; Chardon, S.; Lheritier, J.; Grenier-Loustalot, M.F.G. Chromatographic analysis of sugars applied to the characterization of monofloral honey. Anal. Bioanal. Chem. 2004, 280, 698–705. [Google Scholar] [CrossRef]
  18. Escheriche, I.; Sobrino-Gregorio, L.; Conchado, A.; Juan-Borrás, M. Volatile profile in the accurate labelling of monofloral honey. The case of lavander and thyme honey. Food Chem. 2017, 226, 61–68. [Google Scholar] [CrossRef]
  19. Gianelli Barra, M.P.; Ponce-Díaz, M.C.; Venegas-Gallegos, C. Volatile compounds in honey produced in the central valley of Ñuble Province, Chile. Chil. J. Agric. Res. 2010, 70, 75–84. [Google Scholar] [CrossRef]
  20. Hafida, H.; Fauconnier, M.L.; Rizki, H.; Ouradi, H.; Ennahli, S.; Hassaini, L. Determination of physico-chemical properties and composition in volatile constituents by Solid Phase Micro-Extraction of honey samples from different botanical and geographical origins in Morocco. J. Apic. Res. 2019, in press. [Google Scholar]
  21. Kádár, M.; Juan-Borrás, M.; Hellebrandova, M.; Doménech, E.; Escheriche, I. Volatile Fraction Composition of Acacia (Robinia pseudoacacia) Honey from Romania, Spain and Check Republic. Bull. USAMV Agric. 2010, 67, 259–265. [Google Scholar]
  22. Pérez, R.A.; Sánchez-Brunete, C.; Calvo, R.M.; Tadeo, J.L. Analysis of Volatiles from Spain Honeys by Solid-Phase Microextraction and Gas Chromatography-Mass Spectrometry. J. Agric. Food Chem. 2002, 50, 2633–2637. [Google Scholar] [CrossRef]
  23. Cimpoiu, C.; Hosu, A.; Miclăuş, V.; Puşcaş, A. Determination of floral origin of some Romanian honeys on the basis of physical and biochemical properties. Spectrochim. Acta Part A 2013, 100, 149–154. [Google Scholar] [CrossRef]
  24. Dobre, I.; Alexe, P.; Escuredo, O.; Seijo, C.M. Palynological evaluation of selected honeys from Romania. Grania 2013, 52, 113–121. [Google Scholar] [CrossRef]
  25. Dincă, O.R.; Ionete, R.E.; Popescu, R.; Costinel, D.; Radu, G.L. Geographical and botanical origin discrimination of Romanian honey using complex stable isotope data and chemometrics. Food Anal. Meth. 2015, 8, 401–412. [Google Scholar] [CrossRef]
  26. Stihi, C.; Chelarescu, E.; Duliu, O.G.; Toma, L.G. Characterization of Romanian honey using physico-chemical parameters and the elemental content determined by analytical techniques. Rom. Rep. Phys. 2016, 68, 362–369. [Google Scholar]
  27. Oroian, M.; Amariei, S.; Roşu, A.; Gutt, G. Classification of unifloral honeys using multivariate analysis. J. Essent. Oil Res. 2015, 27, 533–544. [Google Scholar] [CrossRef]
  28. Oroian, M.; Ropciuc, S.; Buculei, A. Romanian honey authentication based on phisico-chermical parameters and chemometrics. J. Food Meas. Charact. 2016, 1–7. [Google Scholar] [CrossRef]
  29. SR 784/1-3:2009. Honey. Part 1: Quality requirements at delivery by producers; Part 2: Honey quality requirements; Part 3: Analysis methods. Available online: https://magazin.asro.ro/standarde/can/1/S84 (accessed on 25 August 2019).
  30. Bogdanov, S.; Martin, P.; Lüllmann, C. Harmonised methods of the European Honey Commission. Apidologie 1997, 1–59. Available online: http://www.ihc-platform.net/ihcmethods2009.pdf (accessed on 25 August 2019).
  31. Tanoh, E.A.; Nea, F.; Kemene, T.K.; Genva, M.; Saive, M.; Tonzibo, F.Z.; Fauconnier, M.L. Antioxidant and Lipoxygenase Inhibitory Activities of Essential Oils from Endemic Plants of Côte d’Ivoire: Zanthoxylum mezoneurispinosum Ake Assi and Zanthoxylum psammophilum Ake Assi. Molecules 2019, 24, 2445. [Google Scholar] [CrossRef]
  32. Czipa, N.; Phillips, C.J.C.; Kovács, B. Composition of acacia honeys following processing, storage and adulteration. J. Food Sci. Technol. 2019, 56, 1245–1255. [Google Scholar] [CrossRef] [Green Version]
  33. Lazarevic, K.B.; Andric, F.; Trifkovic, J.; Tesik, Z.; Milojkovic-Opsenica, D. Characterization of Serbian unifloral honeys according to their physicochemical parameters. Food Chem. 2012, 132, 2060–2064. [Google Scholar] [CrossRef]
  34. Pridal, A.; Vorlova, L. Honey and its physical parameters. Czech J. Anim. Sci. 2002, 47, 439–444. [Google Scholar]
  35. Uršulin-Trstenjak, N.; Puntarić, D.; Levanić, D.; Gvozdić, V.; Pavlek, Ž.; Puntarić, A.; Puntarić, E.; Puntarić, I.; Vidosavljević, D.; Lasić, D.; et al. Pollen, physicochemical and mineral analysis of Croation Acacia honey samples: Applicability for identificaton of botanical and geographical origin. J. Food Qual. 2017, 2017, 8538693. [Google Scholar] [CrossRef]
  36. Kasperová, J.; Nagy, J.; Popelka, P.; Dičáková, Z.; Nagyová, A.; Malá, P. Physico-chemical indicators and identification of selected Slovak honeys based on color measurement. Acta Vet. Brno 2012, 81, 057–062. [Google Scholar] [CrossRef]
  37. Ropciuc, S.; Oroian, M.; Olariu, V. Impact of adulteration with glucose, fructose and hydrolysed inulin syrup on honey physical-chemical properties. Food Environ. Saf. 2017, 16, 54–60. [Google Scholar]
  38. Bertoncelj, J.; Doberšek, U.; Jamnik, M.; Golob, T. Evaluation of the phenolic content, antioxidant activity and color of Slovenian honey. Food Chem. 2007, 105, 822–828. [Google Scholar] [CrossRef]
  39. Escuredo, O.; Rodriguez-Flores, M.S.; Rojo-Martinez, S.; Seijo, C.M. Contribution to the chromatic characterization of unifloral honeys from Galicia (NW Spain). Foods 2019, 8, 233. [Google Scholar] [CrossRef]
  40. Sabatini, A.G.; Bartolotti, L.; Marcazzan, G.L. Conoscere il Miele; Edizioni Avenue Media: Bologna-Milano, Italia, 2007. [Google Scholar]
  41. Marc, L.; Mărghitaş, L.A.; Bobiş, O.; Bonta, V.; Mihai, C. Preliminary study on the authenticity of Acacia, Multifloral and Linden honey from Cluj County. Bull. USAMV Anim. Sci. Biotechnol. 2012, 69, 129–135. [Google Scholar]
  42. Golob, T.; Plestenjak, A. Quality of Slovene honey. Food Technol. Biotechnol. 1999, 37, 195–201. [Google Scholar]
  43. Sanz, M.L.; Gonzalez, M.; de Lorenzo, C.; Sanz, L.; Martinez-Castro, I. Carbohydrate composition and physic chemical properties of artisanal honeys from Madrid (Spain): Occurrence of Echium sp honey. J. Sci. Food Agric. 2004, 84, 1577–1584. [Google Scholar] [CrossRef]
  44. Bobiş, O.; Mărghitaş, L.; Bonta, V.; Dezmirean, D.; Cocan, O. Determination of sugars in Romanian honeys of different botanical origin, using HPLC. Bull. USAMV 2006, 62, 143–148. [Google Scholar]
  45. Bonta, V.; Mărghitaş, L.; Bobiş, O.; Dezmirean, D. HPLC sugar profile in quality and authenticity determination of Romanian honey. In Apiculture—From Science to Agribusiness and Apitherapy; Maronia Publishing House: Cluj-Napoca, Romania, 2007; pp. 59–64. [Google Scholar]
  46. Mărghitaş, L.A.; Dezmirean, D.; Pocol, C.; Ilea, M.; Bobiş, O.; Gergen, I. The Development of a Biochemical Profile of Acacia Honey by identifying Biochemical Determinants of its Quality. Not. Bot. Horti Agrobot. 2010, 38, 84–90. [Google Scholar] [CrossRef]
  47. Mădaş, N.; Mărghitaş, L.A.; Dezmirean, D.; Bonta, V.; Bobiş, O. Botanical origin authentication of Black locust (Robinia pseudoacacia) honey, by means of sugar spectrum determnination. Agricultura 2012, 3, 95–100. [Google Scholar]
  48. Dobre, I.; Georgescu, L.A.; Alexe, P.; Escuredo, O.; Seijo, M.C. Rheological behavior of different honey types from Romania. Food Res. Int. 2012, 49, 126–132. [Google Scholar] [CrossRef]
  49. Rybac-Chmielewska, H. High performance liquid chromatography (HPLC) study of sugar composition in somekinds of natural honey and winter stores processed by bees from starch syrup. J. Apic. Sci. 2007, 51, 23–38. [Google Scholar]
  50. Martins, R.C.; Lopes, V.V.; Valentão, P.; Carvalho, J.C.M.F.; Isabel, P.; Amaral, M.T.; Batista, M.T.; Andrade, P.B.; Silva, B.M. Relevant principal component analysis applied to the characterization of Portuguese heather honey. Nat. Prod. Res. 2008, 27, 1560–1582. [Google Scholar] [CrossRef]
  51. Consonni, R.; Cagliari, L.R.; Cogliati, C. NMR Characterization of saccharides in Italian Honeys of different sources. J. Agric. Food Chem. 2012, 60, 4526–4534. [Google Scholar] [CrossRef]
  52. Kasperné-Szél, Z. Chemical Characteristics of Milkweed Honey and Its Comparison with Robinia Honey. Ph.D. Thesis, Corvinus University Budapest, Budapest, Hungary, 2006. [Google Scholar]
  53. Hişil, Y.; Bağdatlioğlu, N. Change s in sugars of clear honeys kept in glass jars during storage. Gida Teknol. Dern. Yayin Organi 1994, 19, 103–105. [Google Scholar]
  54. Goldschmidt, S.; Burkert, H. Uber das Vorkommen im Bienenhonig bisher unbekannter Zucker. Hoppe Seyler Z. Physiol. Chem. 1955, 300, 188–200. [Google Scholar] [CrossRef]
  55. Belliardo, F.; Buffa, M.; Patetta, A. Manino, A. Identification of melezitose and erlose in floral and honeydew honeys. Carbohyd. Res. 1979, 71, 335–338. [Google Scholar] [CrossRef]
  56. Fakhari, A.R.; Salehi, P.; Heydari, R.; Ebrahimi, S.N.; Haddad, P.R. Hydrodistillation-headspace solvent microextraction, a new method for analysis of the essential oil components of Lavandula angustifolia Mill. J. Chromatogr. A 2005, 1098, 14–18. [Google Scholar] [CrossRef]
  57. Shearer, D.A.; Boch, R. 2-heptanone in the mandibular gland secretion of the honey-bee. Nature 1965, 206, 530. [Google Scholar] [CrossRef]
  58. Bedini, S.; Flamini, G.; Cosci, F.; Ascizzi, R.; Echeverria, M.C.; Guidi, L.; Landi, M.; Lucchi, A.; Conti, B. Artemisia spp. essential oil against the disease-carrying blowfly Calliphora vomitoria. Parasites Vectors 2017, 10, 80. [Google Scholar] [CrossRef]
  59. Jardine, K.; Abrell, L.; Kurc, S.A.; Huxman, T.; Ortega, J.; Guenther, A. Volatile organic compound emission from Larrea tridentata (creosotebush). Atmos. Chem. Phys. 2010, 10, 12191–12206. [Google Scholar] [CrossRef]
  60. Croteau, R. Biosynthesis and catabolism of monoterpenoids. Chem. Rev. 1987, 87, 929–954. [Google Scholar] [CrossRef]
  61. Dai, J.-P.; Chen, J.; Bei, Y.-F.; Han, B.-X.; Wang, S. Influence of borneol on primary mice oral fibroblasts: A penetration enhancer may be used in oral submucous fibrosis. J. Orally Pathol. Med. 2009, 38, 276–281. [Google Scholar] [CrossRef]
  62. Rotarescu, R.; Vidican, C. Impact’s assessment ofthermal processing and storage conditions onenzimatic activity and HMF content in honey. Carpathian J. Food Sci. Technol. 2010, 2, 1–13. [Google Scholar]
  63. Pongprayoon, U.; Baeckstrom, P.; Jacobsson, U.; Lindstroem, M.; Bohlin, L. Antispasmodic activity of beta-Damascenone and E-Phytol isolated from Ipomoea pescaprae. Planta Med. 1992, 58, 19–21. [Google Scholar] [CrossRef]
  64. Castro-Vázquez, L.; Díaz-Maroto, M.C.; Pérez-Coello, M.S. Aroma composition and new chemical markers of Spanish citrus honeys. Food Chem. 2007, 103, 601–606. [Google Scholar] [CrossRef]
  65. Cuevas-Glory, L.F.; Pino, J.A.; Santiago, L.S.; Sauri-Duch, E. A review of volatile analytical methods for determining the botanical origin of honey. Food Chem. 2007, 103, 1032–1043. [Google Scholar] [CrossRef]
  66. Jerković, I.; Tuberso, C.I.G.; Gugić, M.; Bubalo, D. Composition of Sulla (Hedysarum coronarium L.) honey solvent extractives determined by GC/MS: Norisoprenoids and other volatile organic compounds. Molecules 2010, 15, 6375–6385. [Google Scholar] [CrossRef] [PubMed]
  67. Culea, M. Spectrometria de masă. Principii şi aplicaţii; Risoprint Publishing House: Cluj-Napoca, Romania, 2008; pp. 7–276. [Google Scholar]
  68. Bastos, C.; Alves, R. Compostos voláteis em méis florais. Quim. Nova 2003, 26, 90–96. [Google Scholar] [CrossRef]
  69. Gianelli, M.P.; Flores, M.; Toldrá, F. Optimisation of solid phase microextraction (SPME) for the analysis of volatile compounds in dry-cured ham. J. Sci. Food Agric. 2002, 82, 1703–1709. [Google Scholar] [CrossRef]
  70. Jerkovic, I.; Marijanovic, Z.; Kezic, J.; Gugic, M. Headspace, Volatile and Semi-Volatile Organic Compounds Diversity and Radical Scavenging Activity of Ultrasonic Solvent Extracts from Amorpha fruticosa Honey Samples. Molecules 2009, 14, 2717–2728. [Google Scholar] [CrossRef]
  71. Radovic, B.S.; Careri, M.; Mangia, A.; Musci, M.; Gerboles, M.; Anklam, E. Contribution of dynamic headspace GC–MS analysis of aroma compounds to authenticity testing of honey. Food Chem. 2001, 72, 511–520. [Google Scholar] [CrossRef]
  72. Soria, A.C.; Martínez-Castro, I.; Sanz, J. Analysis of volatile composition of honey by solid phase microextraction and gas chromatography-mass spectrometry. J. Sep. Sci. 2003, 26, 793–801. [Google Scholar] [CrossRef]
  73. Yang, Y.; Battesti, M.J.; Paolini, J.; Muselli, A.; Tomi, P.; Costa, J. Melissopalynological origin determination and volatile composition analysis of Corsican “Erica arborea spring maquis” honeys. Food Chem. 2012, 134, 37–47. [Google Scholar] [CrossRef]
  74. Ruoff, K. Solid-Phase Microextraction of Honey Volatiles: A Method for the Determination of the Botanical Origin of Honey. Master’s Thesis, University of Helsinki, Helsinki, Finland, 2003. [Google Scholar]
  75. De la Fuente, E.; Martinez-Castro, I.; Sanz, J. Characterization of Spanish unifloral honeys by solid phase microextraction and gas chromatography-mass spectrometry. J. Sep. Sci. 2005, 28, 1093–1100. [Google Scholar] [CrossRef]
  76. Plutowska, B.; Chmiel, T.; Dymerski, T.; Wardencki, W. A headspace solid-phase microextrasction method development and its application in the determination of volatiles in honeys by gas chromatography. Food Chem. 2011, 126, 1288–1298. [Google Scholar] [CrossRef]
  77. Bobis, O.; Dezmirean, D.S.; Moise, A. Honey and diabetes: The Importance of Natural Simple Sugars in Diet for Preventing and Treating Different Type of Diabetes. Oxid. Med. Cell. Longev. 2018, 2018, 4757893. [Google Scholar] [CrossRef]
Figure 1. Geographic origin of investigated acacia honey samples (Green triangle – Zone 1; Blue triangle – Zone 2; Red triangle – Zone 3 of sample harvesting).
Foods 08 00445 g001
Figure 2. Glucose and fructose content (A) and minor sugars (B) of the analyzed samples (mean value of three repetitions ± SD).
Foods 08 00445 g002
Figure 3. Graphic representation matrix plot of sugars.
Foods 08 00445 g003
Table 1. Selective physico-chemical parameter values for investigated honey samples (water content (%) and water activity (aw)).
Zone 1Zone 2Zone 3
Sample CodeObtained ValuesSample CodeObtained ValuesSample CodeObtained Values
Water Content (%)Water Activity (aw)Water Content (%)Water Activity (aw)Water Content (%)Water Activity (aw)
S116.8 ± 0.10.599 ± 0.000S416.1 ± 0.20.568 ± 0.001S517.3 ± 0.10.565 ± 0.001
S215.5 ± 0.10.573 ± 0.006S617.4 ± 0.00.578 ± 0.001S715.8 ± 0.20.593 ± 0.001
S316.9 ± 0.00.607 ± 0.001 S1116.4 ± 0.00.578 ± 0.001
S816.0 ± 0.20.578 ± 0.001S1417.3 ± 0.10.594 ± 0.001S2116.8 ± 0.20.686 ± 0.004
S916.3 ± 0.10.602 ± 0.003 S2917.2 ± 0.10.610 ± 0.001
S1015.4 ± 0.00.575 ± 0.001S1917.8 ± 0.30.621 ± 0.001S3015.5 ± 0.2 0.574 ± 0.001
S1215.7 ± 0.30.558 ± 0.003 S3116.1 ± 0.10.615 ± 0.001
S1317.5 ± 0.00.603 ± 0.001S2520.4 ± 0.10.690 ± 0.004S3216.5 ± 0.10.599 ± 0.000
S1521.3 ± 0.20.600 ± 0.000 S3316.9 ± 0.10.601 ± 0.000
S1615.7 ± 0.10.562 ± 0.001S2717.0 ± 0.00.602 ± 0.000S3420.4 ± 0.10.656 ± 0.001
S1718.0 ± 0.20.610 ± 0.003 S3915.4 ± 0.10.555 ± 0.003
S1817.1 ± 0.10.621 ± 0.000S3516.7 ± 0.20.598 ± 0.001S4018.9 ± 0.20.580 ± 0.001
S2018.0 ± 0.10.616 ± 0.001
S2215.7 ± 0.10.559 ± 0.001S3616.8 ± 0.20.595 ± 0.001S4116.9 ± 0.30.574 ± 0.001
S2316.6 ± 0.10.591 ± 0.000
S2416.7 ± 0.10.597 ± 0.001S3718.7 ± 0.10.620 ± 0.001S4216.9 ± 0.30.573 ± 0.000
S2816.7 ± 0.10.592 ± 0.001S3816.7 ± 0.10.580 ± 0.002S5214.8 ± 0.20.537 ± 0.003
S4817.1 ± 0.10.578 ± 0.001
S5115.0 ± 0.20.540 ± 0.001S5018.0 ± 0.20.596 ± 0.000S5517.2 ± 0.20.587 ± 0.000
S5316.8 ± 0.10.570 ± 0.000
S5816.1 ± 0.00.552 ± 0.00S5716.1 ± 0.10.558 ± 0.001S5618.8 ± 0.10.611 ± 0.001
Average16.705 ± 0.10.585 ± 0.001Average17.416 ± 0.130.600 ± 0.001Average17.088 ± 0.150.591 ± 0.01
Every value is a mean of three determinations (n = 3) ± standard deviations.
Table 2. The color parameter values of acacia honey samples (L*, a*, b*) (n = 50).
Zone 1Zone 2Zone 3
Sample CodeObtained ValuesSample CodeObtained ValuesSample CodeObtained Values
L*a*b*L*a*b*L*a*b*
S160.62 ± 0.02−0.76 ± 0.0113.02 ± 0.01S454.11 ± 0.082.03 ± 0.0225.99 ± 0.06S560.48 ± 0.13−0.39 ± 0.0110.98 ± 0.03
S259.42 ± 0.03−0.69 ± 0.0213.06 ± 0.02S650.19 ± 0210.39 ± 0.0219.60 ± 0.03S756.20 ± 0.120.22 ± 0.0224.91 ± 0.00
S351.28 ± 0.091.98 ± 0.0226.07 ± 0.03 S1159.60 ± 0.04−0.62 ± 0.0112.81 ± 0.04
S859.62 ± 0.09−0.54 ± 0.0415.32 ± 0.05S1456.94 ± 0.260.98 ± 0.0321.53 ± 0.06S2156.96 ± 0.100.58 ± 0.0321.17 ± 0.15
S960.24 ± 0.08−0.42 ± 0.0113.34 ± 0.03 S2960.10 ± 0.07−0.76 ± 0.0113.68 ± 0.09
S1058.16 ± 0.06−0.37 ± 0.0219.27 ± 0.09S1957.76 ± 0.030.50 ± 0.0317.23 ± 0.05S3059.17 ± 0.140.29 ± 0.0217.45 ± 0.08
S1259.52 ± 0.05−0.11 ± 0.0315.85 ± 0.01 S3157.03 ± 0.190.44 ± 0.0420.23 ± 0.39
S1358.96 ± 0.220.08 ± 0.0216.79 ± 0.04S2557.56 ± 0.110.52 ± 0.0117.73 ± 0.09S3255.73 ± 0.371.18 ± 0.0122.19 ± 0.28
S1554.48 ± 0.182.31 ± 0.0128.22 ± 0.05 S3355.88 ± 0.180.98 ± 0.0221.84 ± 0.14
S1661.87 ± 0.19−0.36 ± 0.039.47 ± 0.11S2757.82 ± 0.280.57 ± 0.0320.82 ± 013S3455.42 ± 0.161.20 ± 0.0223.23 ± 0.07
S1760.51 ± 0.17−0.23 ± 0.0313.07 ± 0.10 S3959.84 ± 0.11−0.40 ± 0.0018.19 ± 0.09
S1850.92 ± 0.195.80 ± 0.0630.41 ± 0.59S3559.69 ± 0.110.08 ± 0.0313.08 ± 0.03S4060.46 ± 0.08−0.60 ± 0.0112.05 ± 0.09
S2060.98 ± 0.070.68 ± 0.0311.20 ± 0.11
S2259.68 ± 0.200.23 ± 0.0216.56 ± 0.08S3660.98 ± 0.40−0.29 ± 0.0011.39 ± 0.18S4162.60 ± 0.13−0.81 ± 0.027.03 ± 0.03
S2360.54 ± 0.04−0.37 ± 0.0111.75 ± 0.02
S2460.12 ± 0.02−0.11 ± 0.0214.76 ± 0.03S3757.48 ± 0.070.62 ± 0.0319.82 ± 0.18S4261.34 ± 0.10−0.70 ± 0.0210.38 ± 0.06
S2859.28 ± 0.160.02 ± 0.0216.73 ± 0.14S3860.97 ± 0.38−0.62 ± 0.0112.07 ± 0.22S5262.70 ± 0.18−0.99 ± 0.039.87 ± 0.07
S4864.00 ± 0.12−0.66 ± 0.016.23 ± 0.04
S5159.88 ± 0.38−0.71 ± 0.0220.67 ± 0.32S5062.59 ± 0.03−1.05 ± 0.037.21 ± 0.03S5561.05 ± 0.12−0.73 ± 0.0111.25 ± 0.08
S5361.11 ± 0.06−0.68 ± 0.0113.60 ± 0.10
S5861.96 ± 0.43−1.28 ± 0.0411.37 ± 0.05S5762.03 ± 0.35−0.82 ± 0.028.66 ± 0.04S5659.90 ± 0.00−0.27 ± 0.0314.07 ± 0.10
Average59.31 ± 0.140.12 ± 0.0215.16 ± 0.10Average58.18 ± 0.180.24 ± 0.0216.26 ± 0.09Average59.06 ± 0.13−0.08 ± 0.0215.96 ± 0.11
L* - degree of brightness (luminosity); a*, b* - color tonality.
Table 3. Analysis of variance for water content, water activity and color (L, a*, b*).
Parameter/ZoneAnalysis of Variance Parameters
Water Content (%)
GroupsCountAverageVariance
Zone 12116.704761.789726
Zone 21217.416671.463333
Zone 31717.088242.327353
ANOVAFp-valueF crit
1.066350.3524443.195056
Water activity (aw)
GroupsCountAverageVariance
Zone 1210.5853330.000510
Zone 2120.60000.001154
Zone 3170.5914120.001423
ANOVAFp-valueF crit
0.8485910.434473.195056
GroupsCountAverageVariance
Zone 12159.314769.517026
Zone 21258.1766712.29979
Zone 31759.062355.631544
ANOVAFp-valueF crit
0.5756270.5662673.195056
a*
GroupsCountAverageVariance
Zone 1210.1180952.189636
Zone 2120.24250.72793
Zone 317−0.081180.544336
ANOVAFp-valueF crit
0.3064130.7375423.195056
b*
GroupsCountAverageVariance
Zone 12115.1621940.39225
Zone 21216.2641732.77234
Zone 31715.9605930.49048
ANOVAFp-valueF crit
0.1567580.8553563.195056
Table 4. Pearson correlation matrix of physico-chemical parameters for Zone 1.
ParametersWater contentFructose Glucose SucroseTuranose Maltose Isomaltose Erlose Water activityColor L*Color a*Color b*
Water content1.000
Fructose−0.1331.000
Glucose0.071−0.4761.000
Sucrose0.2770.136−0.5391.000
Turanose−0.0340.425−0.371−0.0781.000
Maltose−0.2090.419−0.190−0.0450.7211.000
Isomaltose0.098−0.3250.294−0.5270.3330.1101.000
Erlose0.1670.374−0.5920.7900.2090.281−0.4411.000
Water activity0.581−0.3210.624−0.359−0.120−0.1390.471−0.3931.000
Color L*−0.0090.378−0.5180.1610.2700.208−0.1850.369−0.4471.000
Color a*0.167−0.6120.708−0.262−0.385−0.5110.292−0.5270.549−0.8411.000
Color b*0.027−0.4110.435−0.021−0.379−0.3500.020−0.2660.288−0.8180.7231.000
L*- degree of brightness (luminosity); a*, b*- color tonality; Blue: significant for the 0.01 level; Yellow: significant of the 0.05 level.
Table 5. Pearson correlation matrix of physico-chemical parameters for Zone 2.
ParametersWater contentFructose Glucose SucroseTuranose Maltose Isomaltose Erlose Water activityColor L*Color a*Color b*
Water content1.000
Fructose−0.2711.000
Glucose0.343−0.5901.000
Sucrose−0.457−0.1940.3321.000
Turanose−0.5550.602−0.584−0.1391.000
Maltose−0.6010.2110.1780.3720.5891.000
Isomaltose−0.117−0.1070.078−0.2640.5770.5191.000
Erlose−0.7680.133−0.2700.5190.6400.6950.3761.000
Water activity0.921−0.3210.500−0.367−0.676−0.522−0.182−0.7621.000
Color L*−0.0950.564−0.160−0.0110.2860.092−0.163−0.083−0.0141.000
Color a*0.048−0.2630.4030.157−0.2200.2920.1530.1770.137−0.7281.000
Color b*0.092−0.3360.3820.059−0.1750.2990.2640.1750.134−0.8030.9621.000
L*- degree of brightness (luminosity); a*, b*- color tonality; Blue: significant for the 0.01 level; Yellow: significant of the 0.05 level.
Table 6. Pearson correlation matrix of physico-chemical parameters for Zone 3.
ParametersWater contentFructose Glucose SucroseTuranose Maltose Isomaltose Erlose Water activityColor L*Color a*Color b*
Water content1.000
Fructose−0.0971.000
Glucose−0.013−0.8911.000
Sucrose−0.4820.1060.0491.000
Turanose−0.4140.655−0.6930.4501.000
Maltose−0.3670.664−0.6110.4850.9471.000
Isomaltose−0.3590.273−0.2020.2000.6690.7451.000
Erlose−0.2640.684−0.6660.5130.9080.9350.5661.000
Water activity0.744−0.4280.337−0.750−0.745−0.723−0.411−0.7191.000
Color L*−0.3340.157−0.1650.6670.5650.5720.2430.733−0.7161.000
Color a*0.363−0.0770.022−0.796−0.473−0.464−0.125−0.6190.708−0.9441.000
Color b*0.177−0.2990.255−0.576−0.548−0.580−0.224−0.7490.624−0.9490.8761.000
L*- degree of brightness (luminosity); a*, b*- color tonality; Blue: significant for the 0.01 level; Yellow: significant of the 0.05 level.
Table 7. Retention index from literature (Ria) and calculated retention index (RIb) of volatile compounds in honey samples of the three investigated zones (Z1–Z3).
RankVolatile Compound (Usual and/or IUPAC Name)RIaZ1Z2Z3
RIbRIbRIb
1dimethyl sulfide/methylsulfanylmethane734
2acetone/2-propanone810807806805
3ethyl acetate872 862
43-methylbutanal/Isovaleraldehyde912906906904
5isopropyl alcohol/2-propanol917915919913
6ethanol928923923921
72,2,4,6,6-pentamethylheptane 945
82,3-butanedione/diacetyl977969967968
92-methylpropanenitrile/isobutyronitrile 985 976
10alfa-pinene/2,6,6-trimethylbicyclo[3.1.1]hept-2-ene 9999991000
112-butanol/sec-butanol10221010
123-methylpentanal/3-methylvaleraldehyde 101610101011
132-methyl-3-buten-2-ol/dimethylvinylcarbinol1036104110241013
143,6-dimethyldecane 1051 1054
15hexanal10671061
162-methyl-2-butenal 1069
172-methylpropan-1-ol/isobutyl alcohol/isobutanol1085 1077
183-pentanol1110109010841086
19delta-3-carene/3,7,7-trimethylbicyclo[4.1.0]hept-3-ene1148112211271104
205-methyl-2-hexanone 1129
21heptanal1184116211551164
222-heptanone11601169
23limonene119811711169
243-methyl-2-butenal 117411731174
25dodecane1200118111811180
26isoamyl alcohol/3-methylbutan-1-ol1230118311841183
273-methyl-3-buten-1-ol1240122312231221
283-hydroxy-2-butanone/acetoin/3-hydroxy-2-butanone1272126912541255
29octanal12781269
302-methyl-2-buten-1-ol1315129412941293
316-methyl-5-hepten-2-one1329131213501304
323-hydroxy-3-methylbutanoic acid 134713501345
33cis-3-hexene-1-ol1351136013621358
34nonanal1382137113771369
35linalool oxide/6-ethenyl-2,2,6-trimethyloxan-3-ol1423141514121412
36acetic acid1432143414321430
372-furancarboxaldehyde/furfural 1434144114401435
38trans-linalool oxide1451144514421443
392-ethyl-1-hexanol 147214771473
40decanal1485148114801478
412-acetylfuran1491148214821480
42benzaldehyde1502149514941493
43lilac aldehyde B 151915241516
44propanoic acid/propionic acid1523152615281520
45linalool L1544153215271528
46lilac aldehyde A 154515441543
475-methyl-2-furancarboxaldehyde1563155315511551
482-methylpropanoic acid1584155515581553
492,2-dimethylpropanoic acid/pivalic acid 1585
50ho-trienol15861594 1592
51butyrolactone 160016031596
52butanoic Acid1628161516171612
53benzenacetaldehyde/acetaldehyde1646162216221618
545-ethenyldihydro-5-methyl-2(3H)-Furanone 164716441641
552-methylbutanoic acid/DL-2-methylbutyric acid1667166116621662
564-ketoisophorone/4-oxoisophorone 1672 1669
57alfa-terpineol/(S)-2-(4-Methyl-3-cyclohexenyl)-2-propanol1688167516771680
583-pyridinecarboxaldehyde/nicotinic aldehyde 1676 1682
59borneol1698 1684
60naphtalene17181718
61epoxylinalool 172817321722
62pentanoic acid/valeric acid 1729
633-methylpentanoic acid 1780178317841786
64beta-damascenone 17901804 1801
65hexanoic acid1814183618371835
66para-cymen-8-ol/2-(4-methylphenyl)propan-2-ol 184718381838
67trans-geranylacetone/(5E)-6,10-dimethylundeca-5,9-dien-2-one 184118461837
68benzenemethanol/phenylmethanol1844186218601847
69benzeneethanol/phenethyl alcohol1878189518931891
70benzyl nitrile/2-Phenylacetonitrile
71sabinene/4-methylidene-1-propan-2-ylbicyclo[3.1.0]hexane
722,5-furandicarboxaldehyde/furan-2,5-dicarbaldehyde
73phenol1932
74octanoic acid/caprylic acid2083
75nonanoic acid/pelargonic acid2110
763-phenyl-2-propenal/cinnamaldehyde
772-methoxy-4-vinylphenol
78benzoic acid
79HMF/5-hydroxymethil-2-Furfural
Table 8. Relative area of volatile organic compounds (VOC) of honey samples from the three investigated zones (Z1 – Z3).
RankCompoundZone 1 (%)Zone 2 (%)Zone 3 (%)Class%COV Z1%COV Z2%COV Z3
1dimethyl sulfide/methylsulfanylmethane1.5782.8672.171Sulphur compounds1.5782.8672.171
2acetone/2-propanone2.8305.11920.609Ketone7.4637.43323.058
82,3-butanedione/diacetyl1.3871.4200.765
205-methyl-2-hexanone0.0660.0000.000
222-heptanone0.5420.0000.000
283-hydroxy-2-butanone/acetoin0.7080.6460.853
316-methyl-5-hepten-2-one0.1880.1710.125
564-ketoisophorone/4-oxoisophorone0.9630.0000.510
64beta-demascenone0.2090.0000.072
67trans-geranylacetone0.5700.0770.124
3ethyl acetate0.0000.0002.720Esters0.0000.0002.720
43-methyl butanal/isovaleraldehyde1.7530.5380.002Aldehyde27.63922.34413.439
15hexanal0.1780.0000.000
172-methyl-2-butenal0.4470.3700.000
21heptanal0.0740.0200.004
243-methyl-2-butenal1.5140.5220.165
29octanal0.0200.0000.000
34nonanal1.3821.1830.575
372-Furancarboxaldehyde / furfural7.2629.7375.241
41decanal0.6484.4640.070
42benzaldehyde7.2373.8904.686
43lilac aldehyde B1.8980.1770.141
46lilac aldehyde A2.4300.0170.046
475-methyl-2-furancarboxaldehyde0.3210.5160.156
53benzenacetaldehyde/acetaldehyde1.0880.8091.945
593-pyridinecarboxaldehyde/nicotinic aldehyde0.7060.0000.095
722,5-furandicarboxaldehyde/furan-2,5-dicarbaldehyde0.6700.0000.292
763-phenyl-2-propenal/cinnamaldehyde0.0110.0970.021
79HMF/5-hydroxymethyl-2-Furfural0.0000.0040.000
5isopropyl alcohol/2-propanol0.8640.0030.265Alcohols19.13023.87628.359
6ethanol4.14413.07717.910
112-butanol/sec-butanol0.0070.0000.000
132-methyl-3-buten-2-ol/dimethylvinylcarbinol0.4420.4930.122
162-methyl-1-propanol/isobutanol0.0000.0000.101
183-pentanol0.0070.0960.011
25isoamyl alcohol0.4050.5101.171
273-methyl-3-buten-1-ol2.0901.3350.565
302-methyl-2-buten-1-ol0.7160.7130.208
33cis-3-hexene-1-ol0.0780.1930.145
392-ethyl-1-hexanol0.1740.0280.098
45linalool L3.1011.4181.930
50ho-trienol2.6360.0001.340
57alfa-terpineol 0.1580.3440.039
58borneol0.0000.0050.000
61epoxylinalol0.5320.5840.292
66para-cymen-8-ol/2-(4-methylphenyl)propan-2-ol0.0070.0060.003
68benzenemethanol0.8501.2791.623
69benzeneethanol/phenethyl alcohol2.7803.6832.378
73Phenol0.1390.1090.158
72,2,4,6,6-pentamethylheptane0.0000.0000.021Aliphatic hydrocarbons0.9370.2630.608
10alfa-pinene/4,7,7-trimethylbicyclo[3.1.1]hept-3-ene0.0260.0260.012
123-methylpentanal/3-methylvaleraldehyde0.6080.1550.498
143,6 dimethyldecane0.1560.0000.024
19delta-3-carene/3,7,7-trimethylbicyclo[4.1.0]hept-3-ene0.0350.0060.018
23limonene0.0560.0730.016
26dodecane0.0030.0030.019
71sabinene/4-methylidene-1-propan-2-bicyclo[3.1.0]hexane0.0530.0000.000
92-methylpropanenitrile0.3260.0000.045Nitrogen compounds0.9160.0001.610
70benzylnitrile0.5900.0001.565
323-hydroxy-3-methylbutanoic acid0.0250.0740.070Carboxylic acids32.22530.36921.723
36acetic acid16.64124.73312.269
44propanoic acid/propionic acid0.8620.6970.687
482-methylpropanoic acid1.3350.2031.385
492,2-dimethyl propanoic acid/Pivalic acid0.0520.0000.000
52butanoic acid1.6460.7500.644
552-methylbutanoic acid/DL-2-methylbutyric Acid5.0941.7711.219
62pentanoic acid/valeric acid0.0000.0000.108
633-methylpentanoic acid5.3361.6294.497
65hexanoic acid0.6610.5070.265
74octanoic acid0.1720.0000.000
75nonanoic acid0.0920.0000.000
78benzoic acid0.3090.0050.579
35linalool oxide/6-ethenyl-2,2,6-trimethyloxan-3-ol6.8838.6184.188Aromatic acids9.69812.7906.211
38trans-linalool oxide1.5642.1621.115
402-acetylfuran0.1210.4350.267
51butyrolactone0.2240.1740.274
545-ethenyldihydro-5-methyl-2(3H)-furanone0.8881.4010.367
60naphtalene0.0180.0000.000
772-methoxy-4-vinylphenol0.0850.0570.103Ethers0.0850.0570.103

