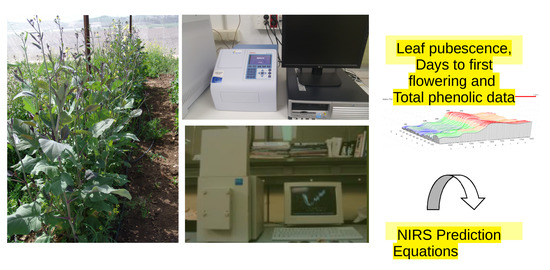
Prediction of Agro-Morphological and Nutritional Traits in Ethiopian Mustard Leaves (Brassica Carinata A. Braun) by Visible-Near-Infrared Spectroscopy
Abstract
1. Introduction
2. Results and Discussion
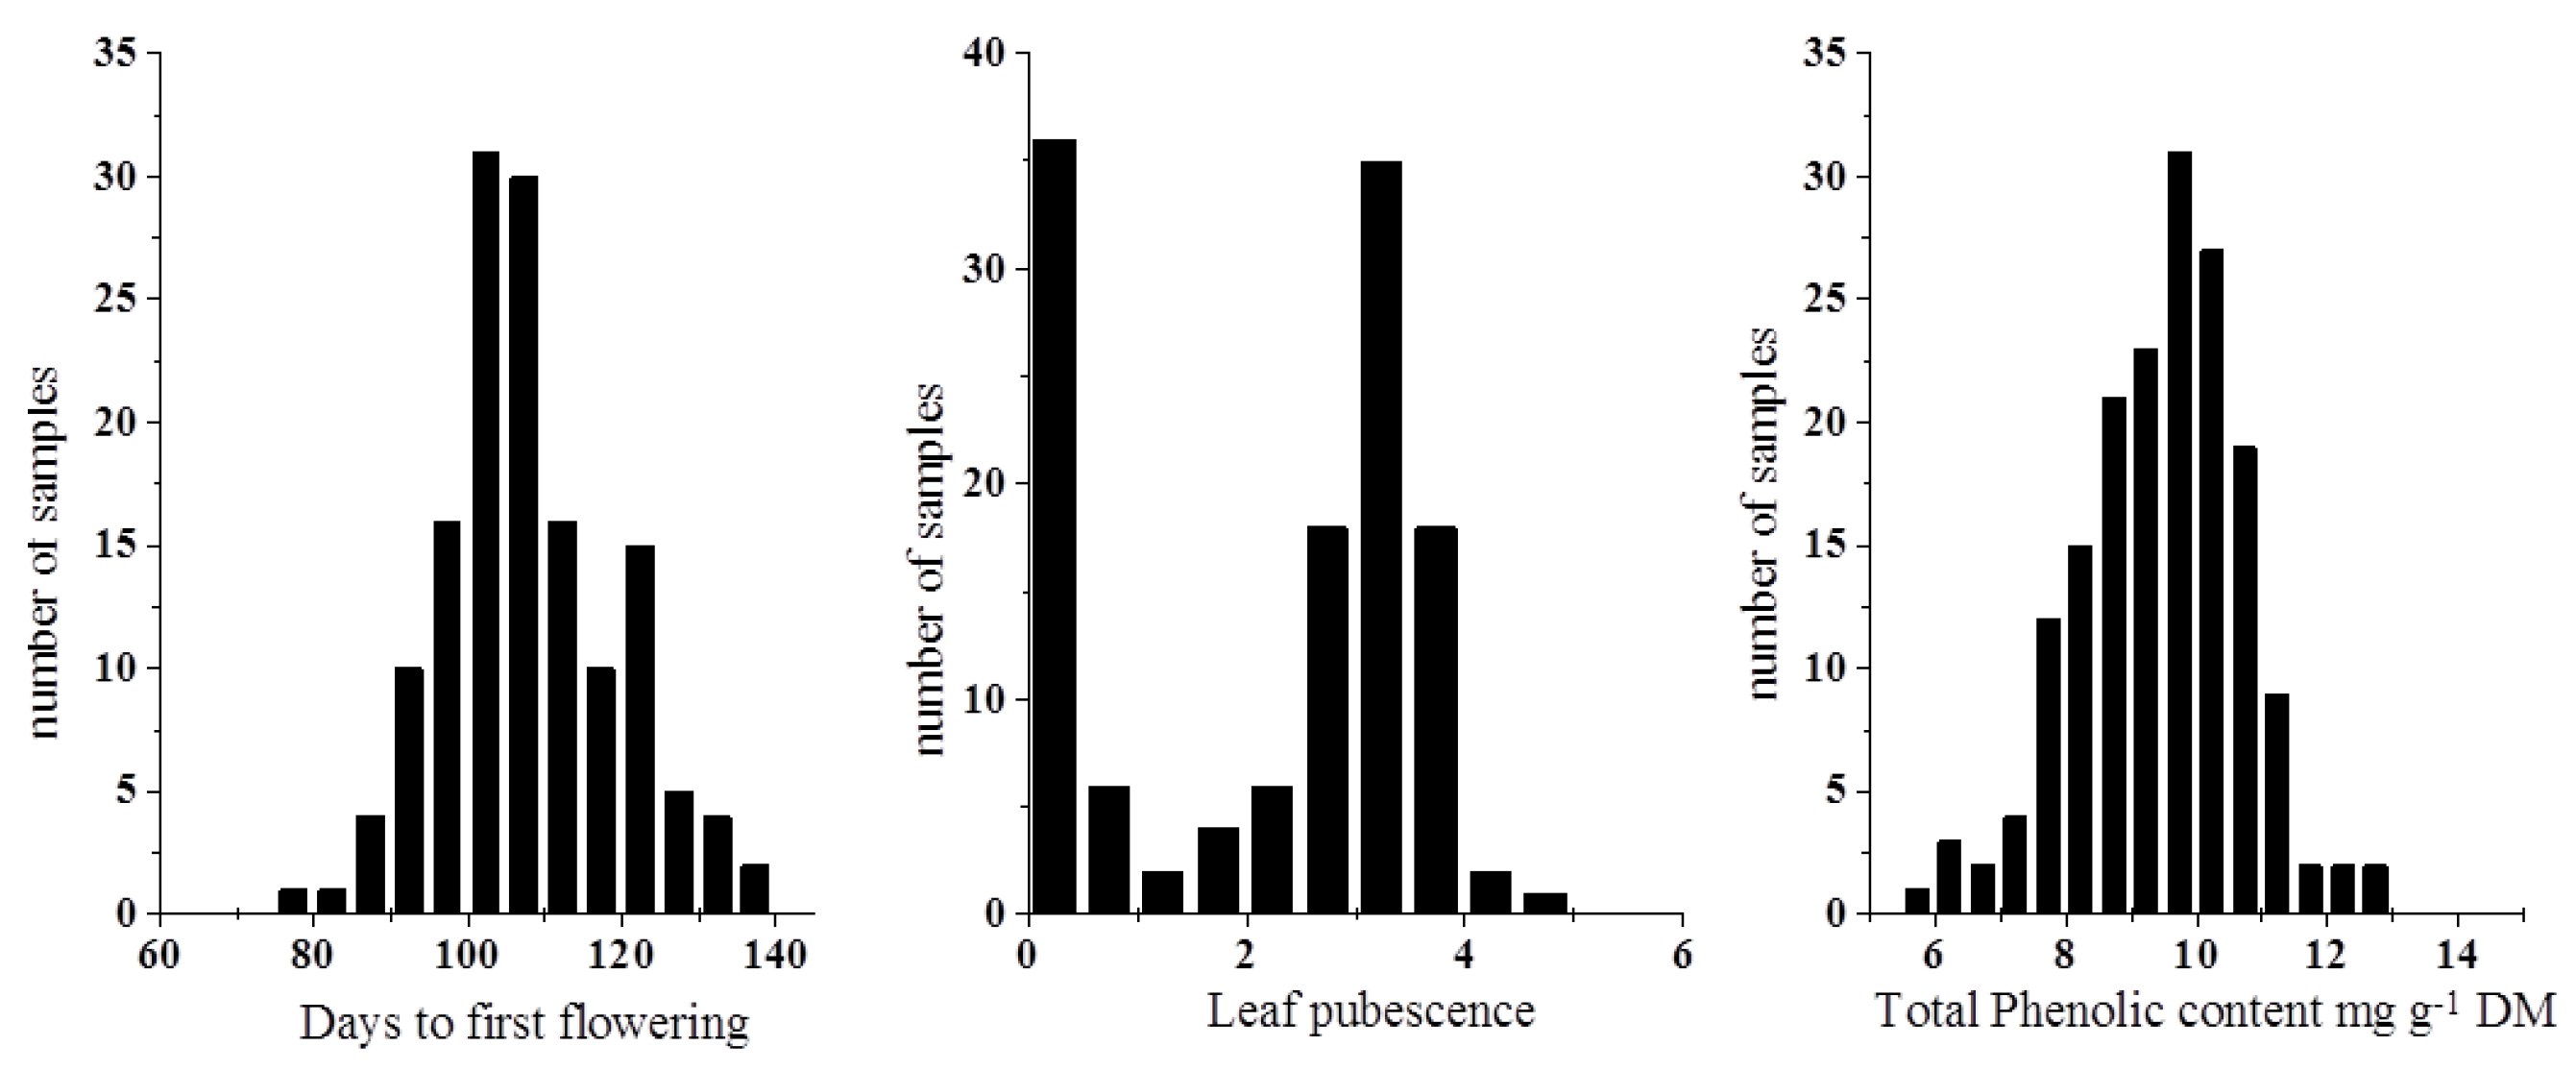
2.1. Reference Analysis of Days to First Flowering, Leaf Pubescence and Total Phenolic Content in the Accessions
2.2. Spectral Data Pre-Treatments and Equation Performances
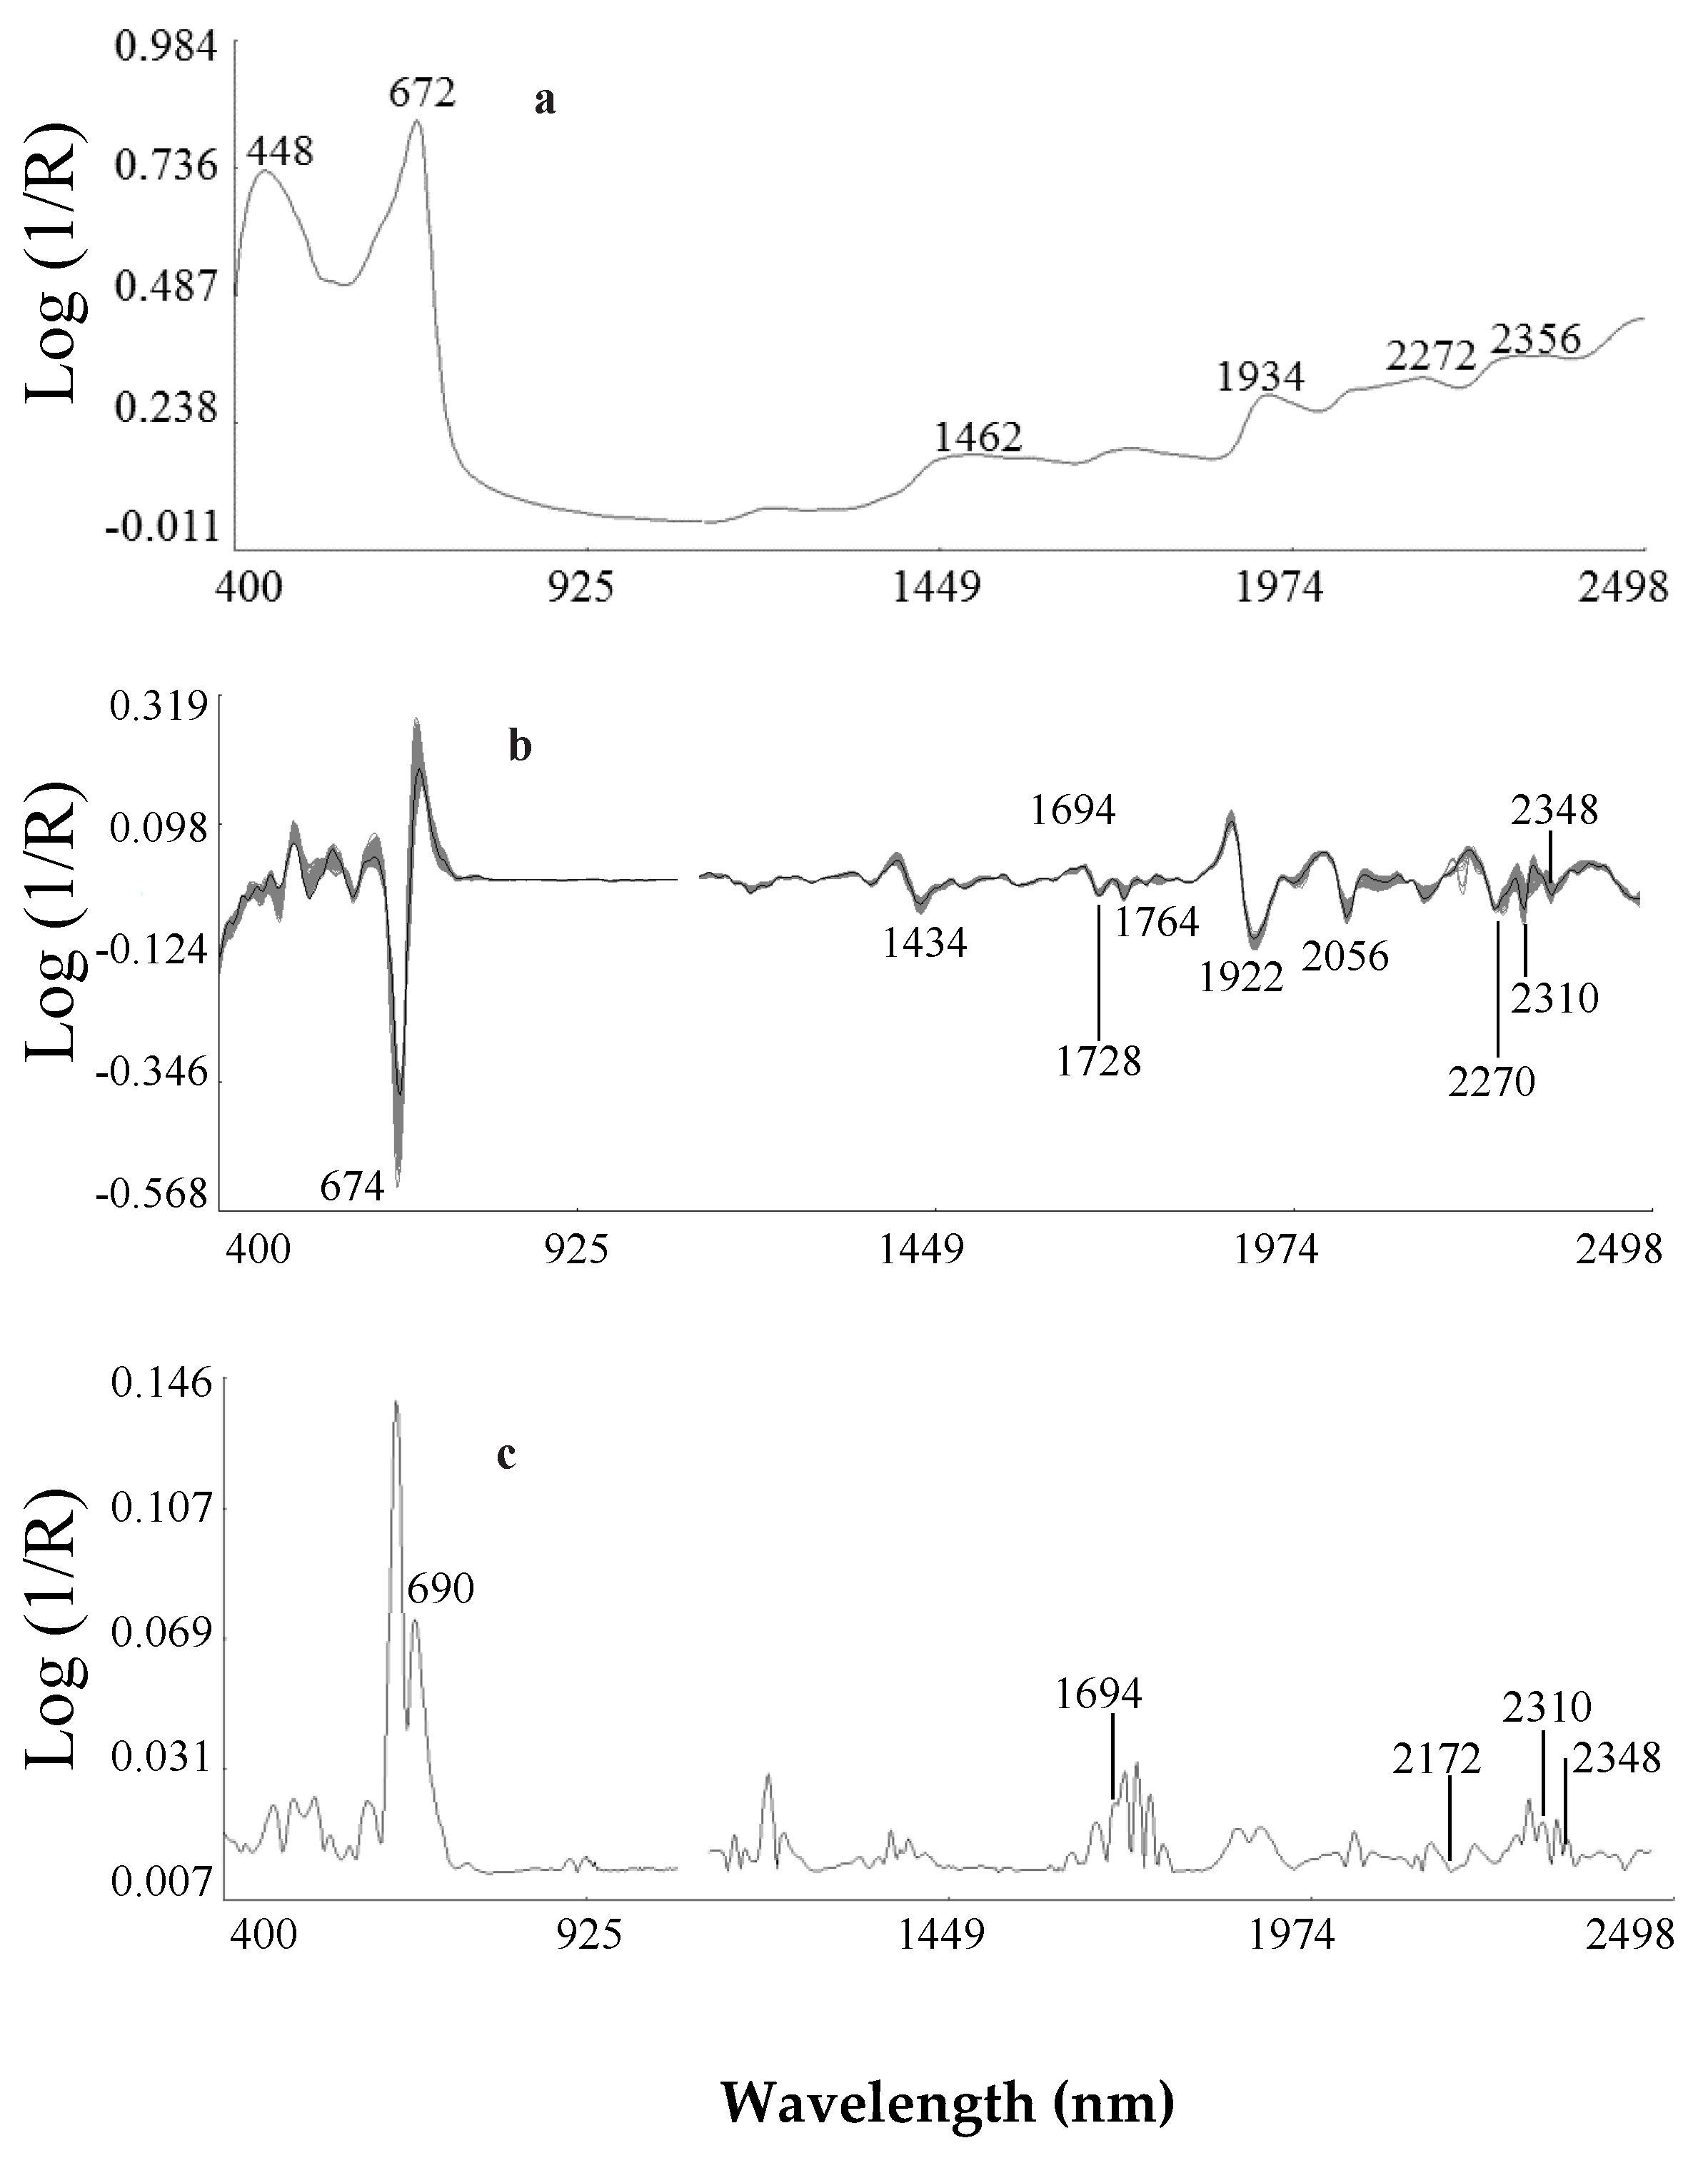
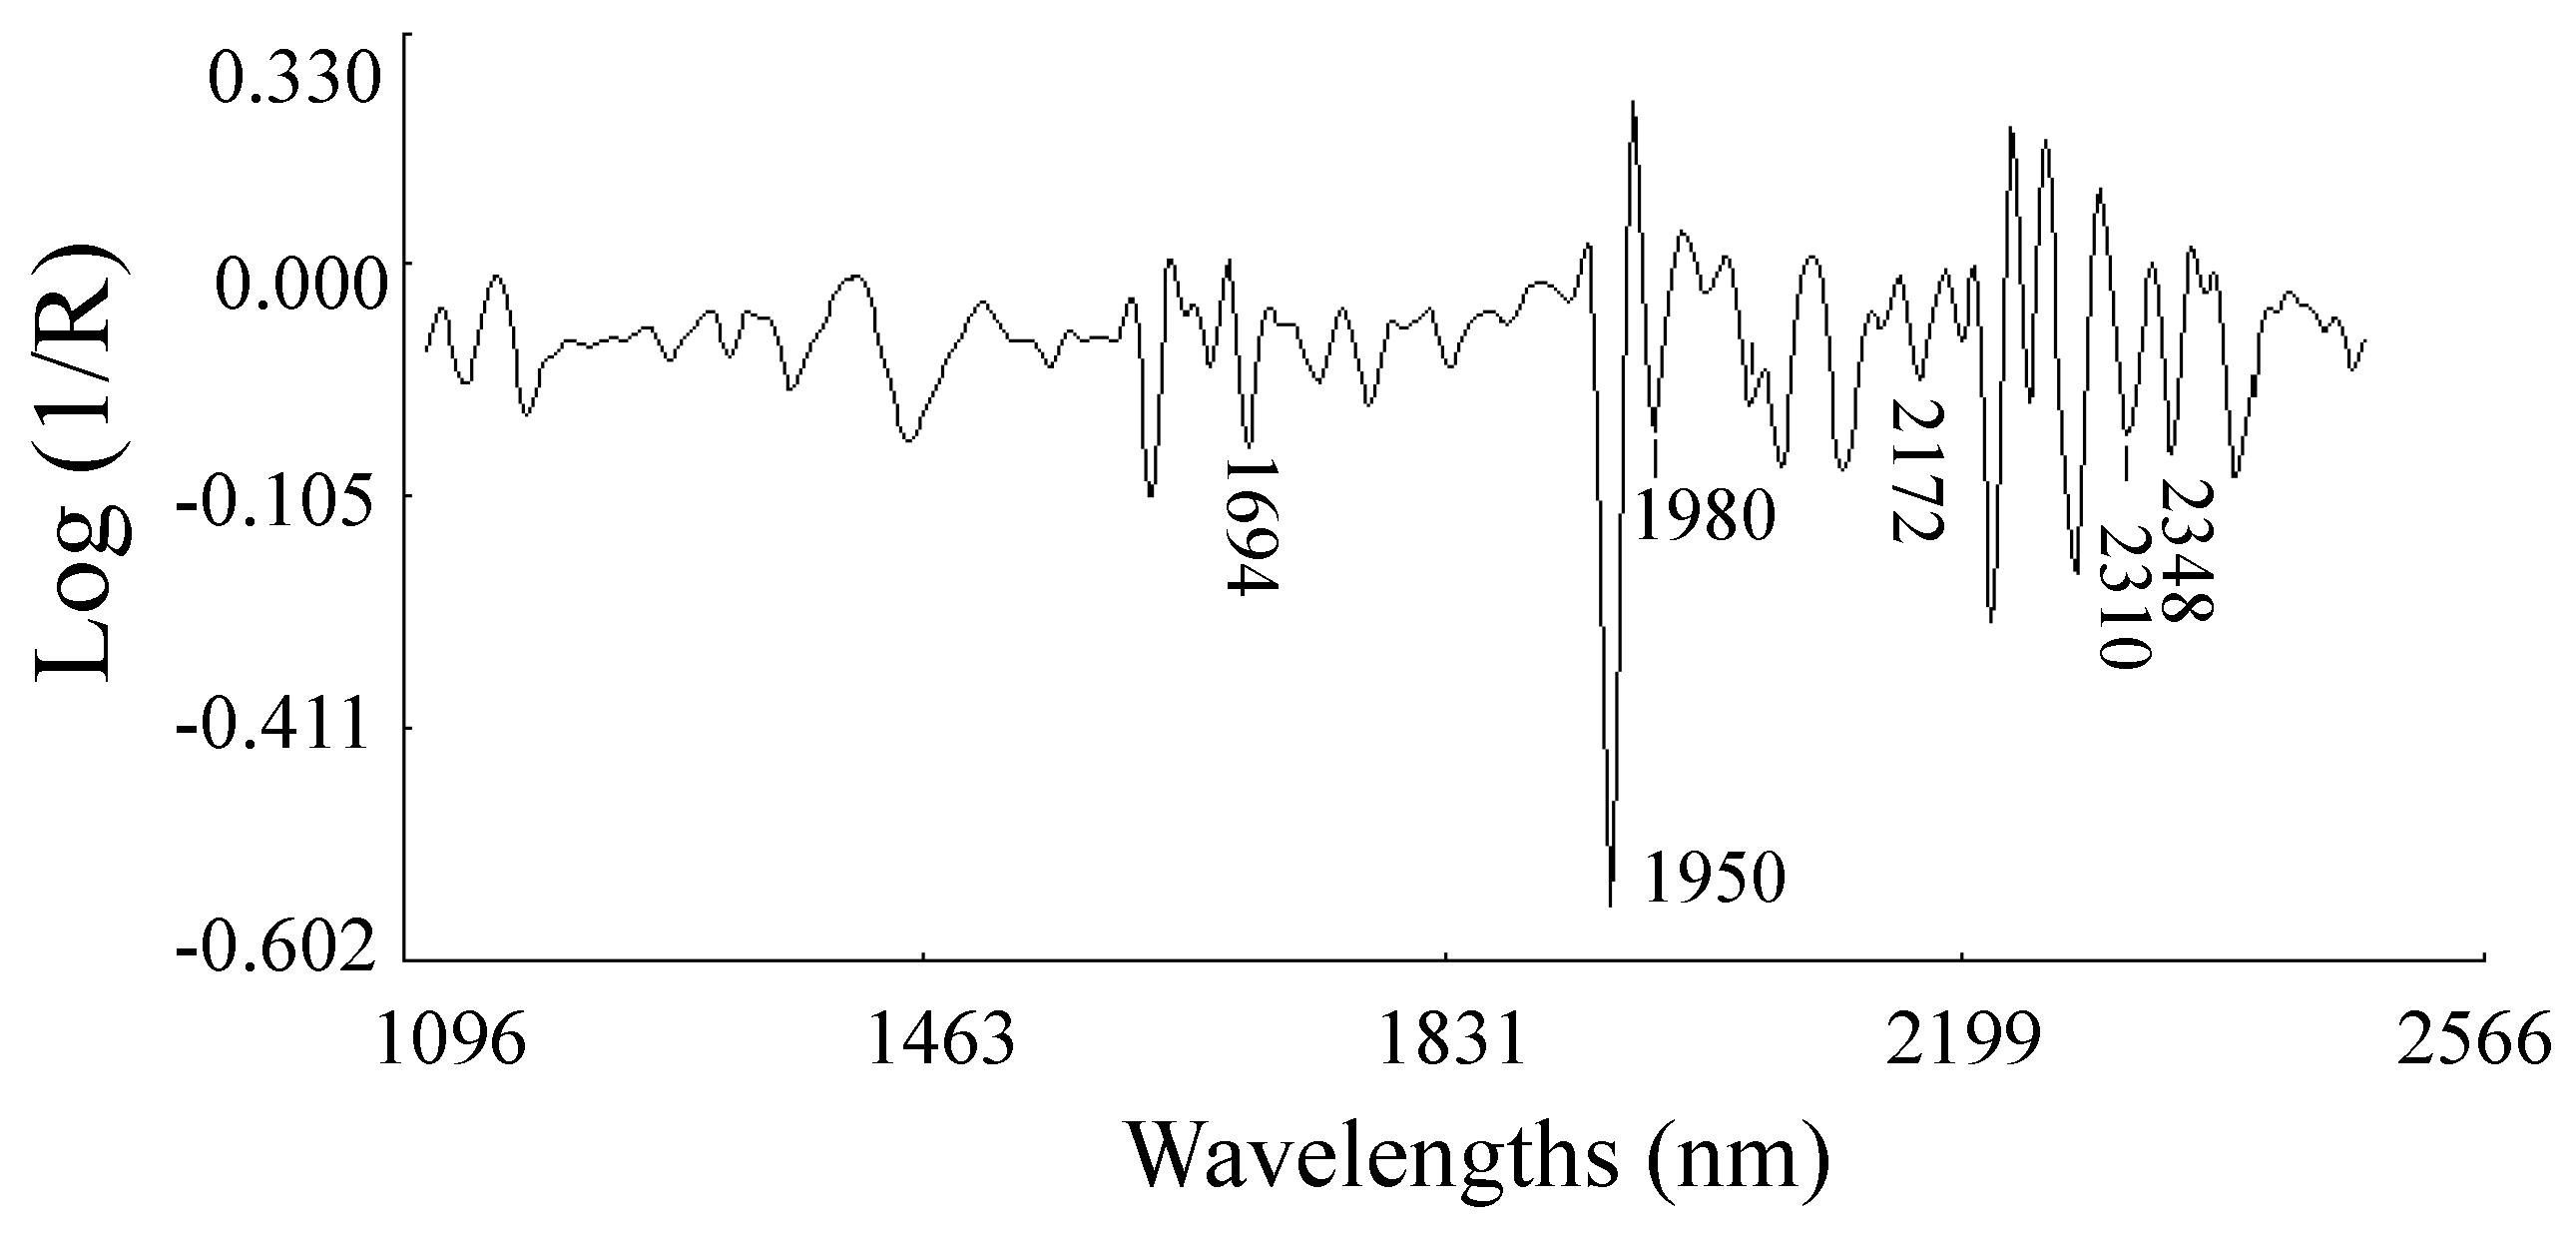
2.2.1. Second Derivative Spectra of Ethiopian Mustard Leaf
2.2.2. Calibration Equation
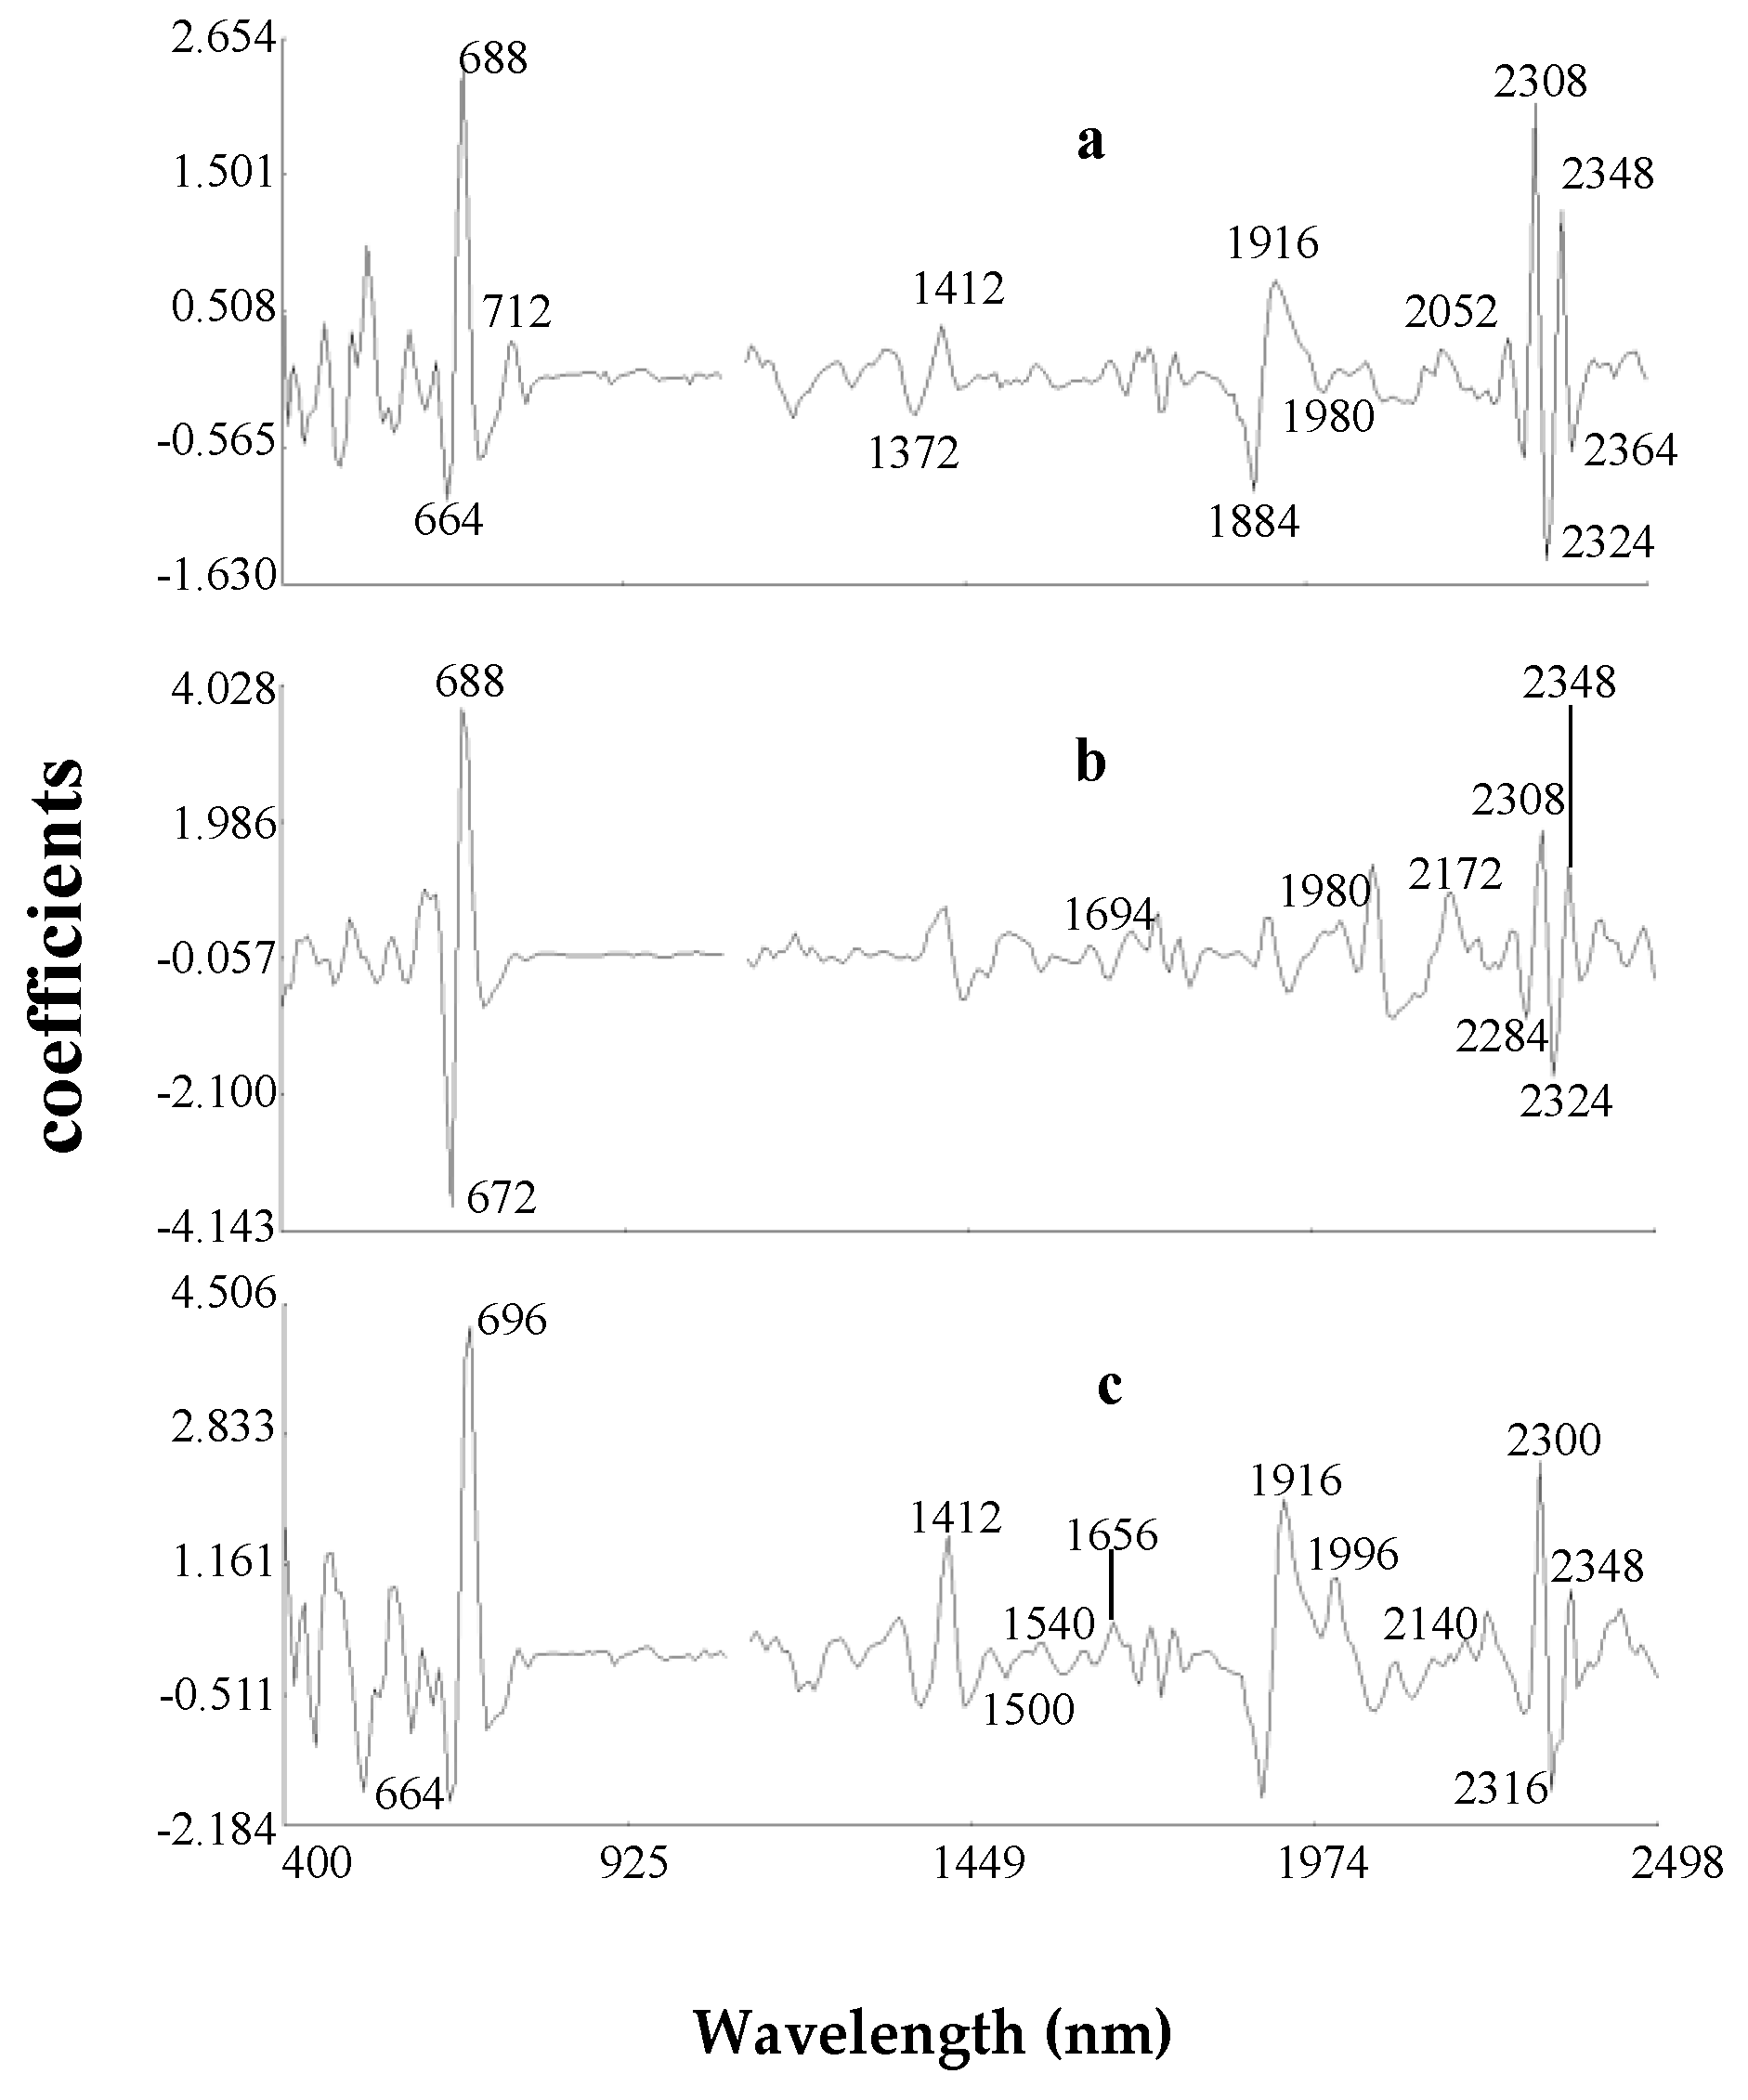
2.2.3. Modified Partial Least Square Loadings
3. Materials and Methods
3.1. Plant Material and Greenhouse Experiments
3.2. Determination of LP
3.3. Determination of DFF
3.4. Determination of the Total Phenolic Fraction
3.5. NIRS Analysis
4. Conclusions
Author Contributions
Funding
Acknowledgments
Conflicts of Interest
References
- De Haro, A.; Domínguez, J.; García-Ruiz, R.; Velasco, L.; Del Río, M.; Muñoz, J.; Fernández-Martínez, J.M. Registration of six Ethiopian mustard germplasm lines. Crop Sci. 1998, 38, 558. [Google Scholar] [CrossRef]
- Muthoni, J. Characterization of Ethiopian mustard (Brassica carinata A. Braun) lines for vegetative agromorphological traits at Arusha, Tanzania. J. Hortic. Forest. 2010, 2, 1–6. [Google Scholar]
- Egea-Gilabert, C.; Fernández, J.A.; Migliaro, D.; Martínez-Sánchez, J.J.; Vicente, M.J. Genetic variability in wild vs. cultivated Eruca vesicaria populations as assessed by morphological, agronomical and molecular analyses. Sci. Hortic. 2009, 121, 260–266. [Google Scholar] [CrossRef]
- Yan, A.; Pan, J.; An, L.; Gan, Y.; Feng, H. The responses of trichome mutants to enhanced ultraviolet-B radiation in Arabidopsis thaliana. J. Photochem. Photobiol. B Biol. 2012, 113, 29–35. [Google Scholar] [CrossRef]
- Prozherina, N.; Freiwald, V.; Rousi, M.; Oksanen, E. Interactive effect of springtime frost and elevated ozone on early growth, foliar injuries and leaf structure of birch (Betula pendula). New Phytol. 2003, 159, 623–636. [Google Scholar] [CrossRef]
- Quinn, C.F.; Freeman, J.L.; Reynolds, R.J.; Cappa, J.J.; Fakra, S.C.; Marcus, M.A. Selenium hyperaccumulation offers protection from cell disruptor herbivores. Plant Physiol. 2010, 153, 1630–1652. [Google Scholar] [CrossRef]
- Broadhurst, C.L.; Chaney, R.L.; Angle, J.S.; Maugel, T.K.; Erbe, E.F.; Murphy, C.A. Simultaneous hyperaccumulation of nickel, manganese, and calcium in Alyssum leaf trichomes. Environ. Sci. Technol. 2004, 38, 5797–5802. [Google Scholar] [CrossRef]
- Larkin, J.C.; Brown, M.L.; Schiefelbein, J. How do cells know what they want to be when they grow up? Lessons from epidermal patterning in Arabidopsis. Annu. Rev. Plant Biol. 2003, 54, 403–430. [Google Scholar] [CrossRef]
- Morales, M.; Janick, J. Arugula: A promising specialty leaf vegetable. In Trends in New Crops and New Uses; Janick, J., Whipkey, A., Eds.; ASHS Press: Alexandria, VA, USA, 2002; pp. 418–423. [Google Scholar]
- Wang, P.; Zhu, Z. Effect of different harvest seasons on the flavonoids content and antioxidant activities of leaf mustard. Acta Horticult. Sin. 2006, 33, 745–750. [Google Scholar]
- Fang, Z.X.; Hu, Y.X.; Liu, D.H.; Chen, J.C.; Ye, X.Q. Changes of phenolic acids and antioxidant activities during potherb mustard (Brassica juncea, Coss.) pickling. Food Chem. 2008, 108, 811–817. [Google Scholar] [CrossRef]
- Gottlieb, D.M.; Schultz, J.; Bruun, S.W.; Jacobsen, S.; Søndergaard, I. Multivariate approaches in plant science. Phytochem. 2004, 65, 1531–1548. [Google Scholar] [CrossRef] [PubMed]
- Font, R.; Del Río, M.; Fernández-Martínez, J.M.; De Haro-Bailón, A. Use of near-infrared spectroscopy for screening the individual and total glucosinolate contents in Indian mustard seed (Brassica juncea L. Czern. & Coss.). J. Agric. Food Chem. 2004, 52, 3563–3569. [Google Scholar] [PubMed]
- Sahamishirazi, S.; Zikeli, S.; Fleck, M.; Claupein, W.; Graeff-Hoenninger, S. Development of a near-infrared spectroscopy method (NIRS) for fast analysis of total, indolic, aliphatic and individual glucosinolates in new bred open pollinating genotypes of broccoli (Brassica oleracea convar. botrytis var. italica). Food Chem 2017, 232, 272–277. [Google Scholar] [CrossRef] [PubMed]
- Font, R.; Del Río-Celestino, M.; Rosa, E.; Aires, A.; De Haro-Bailon, A. Glucosinolate assessment in Brassica oleracea leaves by near-infrared spectroscopy. J. Agric. Sci. 2005, 143, 65–73. [Google Scholar] [CrossRef]
- Mnzava, N.A.; Schippers, R.R. Brassica carinata A. Braun. Record from Protabase. In PROTA (Plant Resources of Tropical Africa/ Ressources Végétales de l’Afrique Tropicale); Van der Vossen, H.A.M., Mkamilo, G.S., Eds.; PROTA: Wageningen, The Netherlands, 2007. [Google Scholar]
- Tcacenco, F.A.; Ford-Lloyd, B.V.; Astley, D. A numerical study of variation in a germplasm collection of Brassica carinata and allied species from Ethiopia. Z. Pflanzenzüchtg. 1985, 94, 192–200. [Google Scholar]
- Tkachuk, R.; Kuzina, F.D. Chlorophyll analysis of whole rapeseed kernels by near infrared reflectance. Can. J. Plant Sci. 1982, 62, 875–884. [Google Scholar] [CrossRef]
- Murray, I. The NIR spectra of homologous series of organic compounds. In Proceedings of the International Near Infrared Diffuse Reflectance/Transmittance Spectroscopy Conference, Budapest, Hungary, 4–11 October 1989; pp. 13–28. [Google Scholar]
- Osborne, B.G.; Fearn, T.; Hindle, P.H. Practical NIR Spectroscopy with Applications in Food and Beverage Analysis; LongmanScientific&Technical: Essex, England, 1993. [Google Scholar]
- Shenk, J.S.; Workman, J.; Westerhaus, M. Application of NIR spectroscopy to agricultural products. In Handbook of Near Infrared Analysis; Burns, D.A., Ciurczac, E.W., Eds.; Marcel Dekker: New York, NY, USA, 2001; pp. 419–474. [Google Scholar]
- McFadden, A.; Mailer, R.J. Sinapine in Australian canola. In Proceedings of the Thirteenth Biennial Australian Research Assembly on Brassicas, Tamworth, Australia, 8–12 September 2003; pp. 96–98. [Google Scholar]
- Zhang, C.; Shen, Y.; Chen, J.; Xiao, P.; Bao, J. Nondestructive prediction of total phenolics, flavonoid contents, and antioxidant capacity of rice grain using near-infrared spectroscopy. J. Agric. Food Chem. 2008, 56, 8268–8272. [Google Scholar] [CrossRef] [PubMed]
- Del Río, M.; Font, R.; De Haro, A. Predicting the flowering cycle of Indian mustard plants through the glucosinolate analysis of the seed by Near-infrared Spectroscopy. In Proceedings of the 17th EUCARPIA General Congress, Tulln, Austria, 8–11 September 2004; p. 496. [Google Scholar]
- Marquez-Lema, A.; Pérez-Vich, B.; Velasco-Varo, L.; Fernández-Martínez, J.M. Development and characterisation of a Brassica carinata inbred line incorporating genes for low glucosinolate content from B. juncea. Euphytica 2008, 164, 365–375. [Google Scholar] [CrossRef]
- Slaton, M.R.; Hunt, E.R.; Smith, W.K. Estimating near-infrared leaf reflectance from leaf structural characteristics. Am. J. Bot. 2001, 88, 278–284. [Google Scholar] [CrossRef] [PubMed]
- Nicolaï, B.M.; Beullens, K.; Bobelyn, E.; Peirs, A.; Saeys, W.; Theron, K.I. Nondestructive measurement of fruit and vegetable quality by means of NIR spectroscopy: A review. Postharvest Biol. Technol. 2007, 46, 99–118. [Google Scholar] [CrossRef]
- Xie, L.; Ye, X.; Liu, D.; Ying, Y. Quantification of glucose, fructose and sucrose in bayberry juice by NIR and PLS. Food Chem. 2009, 114, 1135–1140. [Google Scholar] [CrossRef]
- Budić-Leto, I.; Gajdos Kljusurić, J.; Zdunić, G.; Tomić-Potrebuješ, I.; Banović, M.; Kurtanjek, Ž.; Lovrić, T. Usefulness of near infrared spectroscopy and chemometrics in screening of the quality of dessert wine Prošek. Croat. J. Food Sci. Technol. 2011, 3, 9–15. [Google Scholar]
- International Board for Plant Genetic Resources (IBPGR). Descriptors for Brassica and Raphanus; International Board for Plant Genetic Resources: Rome, Italy, 1990. [Google Scholar]
- Sellappan, S.; Akoh, C.C.; Krewer, G. Phenolic compounds and antioxidant capacity of Georgia-grown blueberries and blackberries. J. Agric. Food Chem. 2002, 50, 2432–2438. [Google Scholar] [CrossRef] [PubMed]
- Wyndham, W.R.; Mertens, D.R.; Barton, F.E., II. Protocol for NIRS calibration: Sample selection and equation development and validation. In Near Infrared Reflectance Spectroscopy (NIRS): Analysis of Forage Quality; Marten, G.C., Shenk, J.S., Barton, F.E., II, Eds.; ARS, USDA: Washington, DC, USA, 1989; p. 96. [Google Scholar]
- Mark, H.; Workman, I. Statistics in Spectroscopy; Academic Press, Inc.: New York, NY, USA, 1991. [Google Scholar]
| Calibration | Cross-Validation | ||||||||
|---|---|---|---|---|---|---|---|---|---|
| Traits | n | Range | Mean | SD d | SEC e | R2 f | SECV g | R2cv h | RPD i |
| DFF a | 135 | 82–137 | 107.53 | 10.87 | 1.43 | 0.98 | 2.40 | 0.95 | 4.52 |
| LP b | 135 | 0–7 | 3.42 | 0.80 | 0.32 | 0.84 | 0.52 | 0.63 | 1.53 |
| TPC c | 405 | 2.20–12.70 | 8.57 | 1.96 | 0.06 | 0.99 | 0.08 | 0.99 | 24.50 |
© 2018 by the authors. Licensee MDPI, Basel, Switzerland. This article is an open access article distributed under the terms and conditions of the Creative Commons Attribution (CC BY) license (http://creativecommons.org/licenses/by/4.0/).
Share and Cite
Martínez-Valdivieso, D.; Font, R.; Del Río-Celestino, M. Prediction of Agro-Morphological and Nutritional Traits in Ethiopian Mustard Leaves (Brassica Carinata A. Braun) by Visible-Near-Infrared Spectroscopy. Foods 2019, 8, 6. https://doi.org/10.3390/foods8010006
Martínez-Valdivieso D, Font R, Del Río-Celestino M. Prediction of Agro-Morphological and Nutritional Traits in Ethiopian Mustard Leaves (Brassica Carinata A. Braun) by Visible-Near-Infrared Spectroscopy. Foods. 2019; 8(1):6. https://doi.org/10.3390/foods8010006
Chicago/Turabian StyleMartínez-Valdivieso, Damián, Rafael Font, and Mercedes Del Río-Celestino. 2019. "Prediction of Agro-Morphological and Nutritional Traits in Ethiopian Mustard Leaves (Brassica Carinata A. Braun) by Visible-Near-Infrared Spectroscopy" Foods 8, no. 1: 6. https://doi.org/10.3390/foods8010006
APA StyleMartínez-Valdivieso, D., Font, R., & Del Río-Celestino, M. (2019). Prediction of Agro-Morphological and Nutritional Traits in Ethiopian Mustard Leaves (Brassica Carinata A. Braun) by Visible-Near-Infrared Spectroscopy. Foods, 8(1), 6. https://doi.org/10.3390/foods8010006


