Article

Prebiotic Effects and Fermentation Kinetics of Wheat Dextrin and Partially Hydrolyzed Guar Gum in an In Vitro Batch Fermentation System

1
Department of Food Science and Nutrition, University of Minnesota—Twin Cities 1334 Eckles Ave St. Paul, MN 55108, USA
2
Novartis Consumer Health, Inc. 200 Kimball Drive Parsippany, NJ 07054-0622, USA
3
Department of Animal Sciences and Division of Nutritional Sciences, University of Illinois—Urbana-Champaign 1207 West Gregory Drive Urbana, IL 61801, USA
*
Author to whom correspondence should be addressed.
Foods 2015, 4(3), 349-358; https://doi.org/10.3390/foods4030349
Submission received: 21 June 2015 / Revised: 12 August 2015 / Accepted: 18 August 2015 / Published: 21 August 2015
(This article belongs to the Special Issue Fermented Foods and Probiotics)

Abstract

:
Scientific research demonstrates that two indigenous gut bacteria, Lactobacillus and Bifidobacterium can contribute to human health. Although these bacteria can be consumed as probiotics, they can also be produced in the gut by bacteria, and are then called prebiotics. The primary objective of this in vitro study was to quantitatively analyze at the genus level how two dietary fibers, wheat dextrin (WD) and partially hydrolyzed guar gum (PHGG) changed the levels of these two gut bacteria at 12 and 24 h, via real time qualitative polymerase chain reaction (qPCR). Secondary objectives were changes in fecal pH, short chain fatty acids (SCFAs) and total gas volume produced. At 12 h WD was more bifidogenic (9.50 CFU log10/mL) than PHGG (9.30 CFU log10/mL) (p = 0.052), and also at 24 h WD (9.41 CFU log10/mL) compared with PHGG (9.27 CFU log10/mL) (p = 0.043). WD produced less total SCFAs at both 12 and 24 h than PHGG, and produced significantly lower amounts of gas at 12 and 24 h (p < 0.001). Both PHGG and WD also promoted growth of Lactobacilli when measured at 12 and 24 h compared with the 0 h analysis, indicating that both fibers are lactogenic. These results demonstrate the prebiotic effect of WD and PHGG. Based on fermentation kinetics, PHGG is more rapidly fermented than WD, and both fibers show prebiotic effects as early as 12 h.

1. Introduction

Dietary fiber is generally defined as nondigestible carbohydrates and lignin that are intrinsic and intact in plants, with functional fiber showing beneficial physiological effects in humans [1]. Currently the U.S. recommendations for dietary fiber, expressed as a Dietary Reference Intake, are 25 g/day for adult females and 38 g/day for adult males, although the typical daily intake for U.S. consumers is approximately 17 g/day [2,3]. Generally accepted health benefits associated with regular fiber consumption include maintaining a healthy digestive system, increased satiety, decreased caloric intake, and fermentation that results in beneficial changes in the gut microflora [4,5]. Daily supplementation of beneficial dietary fibers may be an effective way to help consumers get the recommended amount of dietary fiber, and its associated health benefits.
Wheat dextrin (WD) and partially hydrolyzed guar gum (PHGG) are dietary fibers evaluated in this study. WD is a soluble, fermentable fiber composed of a glucose polymer formed by the polymerization and hydrolysis of wheat starch that resists digestion in the small intestine due to its glucoside linkages [6]. PHGG is a hydrolyzed product of guar gum, composed of mannose and galactose monomers. Clinical studies have shown that 45 g/day of WD is well tolerated in the gastrointestinal tract [7]. WD also has been shown to decrease hunger and increase satiety in a randomized, double-blind, placebo-controlled study [8,9]. PHGG has been shown in randomized, cross-over clinical studies to reduce hunger and increase satiety [10,11].
Two different soluble fibers were selected in this study to help understand the mechanisms of action and subsequent changes in gut microflora through the use of an in vitro batch fermentation model. In vitro fermentation methods are a representative model of colonic fermentation, and work well to predict substrate availability and ability for fermentation in the gut [12]. Previous preliminary studies have shown that WD and PHGG ferment in the large intestine producing measurable levels of beneficial Bifidobacteria and Lactobacillus at 24 h, indicating that both dietary fibers demonstrate a prebiotic effect [13].
The primary objective of this study was to measure changes in two beneficial genera of microbes, Lactobacillus and Bifidobacterium, to better understand the prebiotic effects of WD and PHGG and their mechanisms of action. Secondary objectives included measurements of common fermentation markers, such as pH, total gas volume and short-chain fatty acids (SCFA).

2. Materials and Methods

Fibers investigated in this study included wheat dextrin (Benefiber®, Novartis Consumer Health Inc., Parsippany, NJ, USA) and partially hydrolyzed guar gum (Benefibra™, Novartis Consumer Health Spa Origgio, Varese, Lombardy, Italy). A substrate blank was employed for all baseline measurements in fecal inoculum. Chemical reagents used in this study were provided by ThermoFisher Scientific (ThermoFisher Scientific Inc., Waltham, MN, USA), Sigma-Aldrich (Sigma-Aldrich, St. Louis, MO, USA) and Oxyrase (Oxyrase Inc., Mansfield, OH, USA).

2.1. Fecal Collection

Fecal samples were collected from three healthy volunteers (2 males, 1 female) under anaerobic conditions from three individuals (ages 18–28) consuming non-specific Western diets, free of antibiotic treatments in the last 6 months, not affected by any GI diseases and not consuming any prebiotic or probiotic supplements. Fecal samples were anaerobically collected within 1 h of the start of the batch fermentation and homogenized immediately upon collection.

2.2. Fermentation

Fiber samples (0.5 g) were hydrated in 40 mL of prepared sterile tricase peptone fermentation media in 100 mL serum bottles, capped to avoid contamination, and incubated for 12 h at 4 °C. Following incubation, serum bottles were transferred to a circulating water bath at 37 °C and allowed to incubate for 2 h. Post-collection, fecal samples were homogenized using a 6:1 ratio of phosphate buffer solution to fecal matter. After mixing, obtained fecal slurry was combined with prepared reduction solution (2.52 g cysteine hydrochloride, 16 mL 1N NaOH, 2.56 g sodium sulfide nonanhydride, 380 mL DD H2O) at a 2:15 ratio. 10 mL of the prepared fecal inoculum was added to each of the serum bottles, 0.8 mL Oxyrase® added, flushed with CO2, sealed, and then immediately placed in the 37 °C circulating water bath. Samples were prepared in triplicate and analyzed at 0, 4, 8, 12 and 24 h. Triplicate positive controls (dextrose) and negative controls (substrate blank) were also analyzed at the same time points. Upon removal at appropriate time point, pH and total gas volume were measured. Then, 1 mL of copper sulfate (200 g/L) was added to cease fermentation. Lastly, 2 mL aliquots were frozen at −80 °C for further analysis.

2.3. pH Analysis

Two milliliter aliquots were removed from serum bottles immediately following total gas measurement and measured with an Orion PerpHect LogR Meter—Model 350 (Orion Research, Inc., Boston, MA, USA).

2.4. Gas Analysis

Total gas production was measured by syringe difference analysis. Gas was measured by piercing cap of serum bottle with syringe needle and measuring gas released from system.

2.5. SCFA Analysis

SCFA extraction methods were adapted and modified from Schneider et al. [14] 2 mL aliquots were removed from the −80 °C freezer and placed in 4 °C cooler for 12 h to thaw prior to SCFA analysis. Tubes were then gently vortexed for 5 s. Then, 1.6 mL of DI H20, 400 μL H2SO4 (50% vol/vol), and 2 mL diethyl ether (premixed with 2-ethyl butyric acid as internal standard) were all added to tubes and vortexed again for 5 s. Tubes were then placed in an orbital shaker for 45 min at 100 RPM. Tubes were removed and then centrifuged for 5 min at 3000 RPM. Supernatant was removed from tube and placed in 10 mL plastic tubes containing CaCl2 to remove any residual water. Solution was then filtered using a BD 1 mL syringe (Becton, Dickinson and Company Franklin Lakes, NJ, USA) and a Millex 13 mm nylon membrane filter with a 0.20 μm pore size (Merck Millipore Ltd Tullagreen, Carrigtwohill, Co. Cork, Ireland). Extractions were then analyzed using a HP 5890 series gas chromatograph (Hewlitt Packard, Palo Alto, CA, USA) with a 30 m × 0.250 mm × 0.25 μm polyethylene glycol (PEG) column (Agilent Technologies, Santa Clara, CA, USA), with a 110 °C oven temperature. Samples were injected using an automated HP 7673 GC/SFC injector (Hewlitt Packard, Palo Alto, CA, USA). Injector and detector temperatures were 220 and 240 °C, respectively. Flow rates for air, helium and hydrogen were 26, 28 and 315 mL/min, respectively. All samples were analyzed with a 50:1 split ratio.

2.6. Microbiota Analysis—Quantitative Polymerase Chain Reaction (qPCR)

Bifidobacterium genus and Lactobacillus genus were quantified by DNA extraction from fermented samples, followed by qPCR using specific primers. Amplification was performed in a set of triplicate reactions for each bacterial group within each sample according to the procedures of Hernot et al. [15] For amplification, 10 μL final volume containing 2X SYBR Green PCR Master Mix (Applied BioSystems, Foster City, CA, USA), 15 pmol of each primer, and 10 ng of template DNA were used. Standard curves were obtained by harvesting pure cultures of each bacterium in the logarithmic growth phase in triplicate to create a five-fold dilution series. DNA from each serial dilution was extracted using a PowerSoil DNA Isolation Kit (MO BIO Laboratories, Inc., Carlsbad, CA, USA) and amplified along with fecal DNA samples using a Taqman ABI PRISM 7900HT Sequence Detection System (Applied BioSystems). The colony forming units (CFU) of each standard curve serial dilution was determined by plating the Lactobacillus genus on Difco Lactobacilli MRS broth (Becton, Dickenson, and Company, Sparks, MD, USA), and Bifidobacterium genus on Difco Reinforced Clostridial Medium (Becton, Dickenson, and Company, Sparks, MD, USA). Cycle threshold (Ct) values were plotted against standard curves for quantification (CFU/mL) of the target bacterial DNA from fermentation samples.

2.7. Statistical Analysis

Statistical analysis was conducted using SAS statistical program software version 9.3 (SAS Institute, Cary, NC, USA). Analysis of variance (ANOVA) with Tukey pair-wise was used for all tests measuring differences of means. Statistical significance was achieved for p-values less than 0.05. Log transformations were implemented as needed for analysis.

3. Results

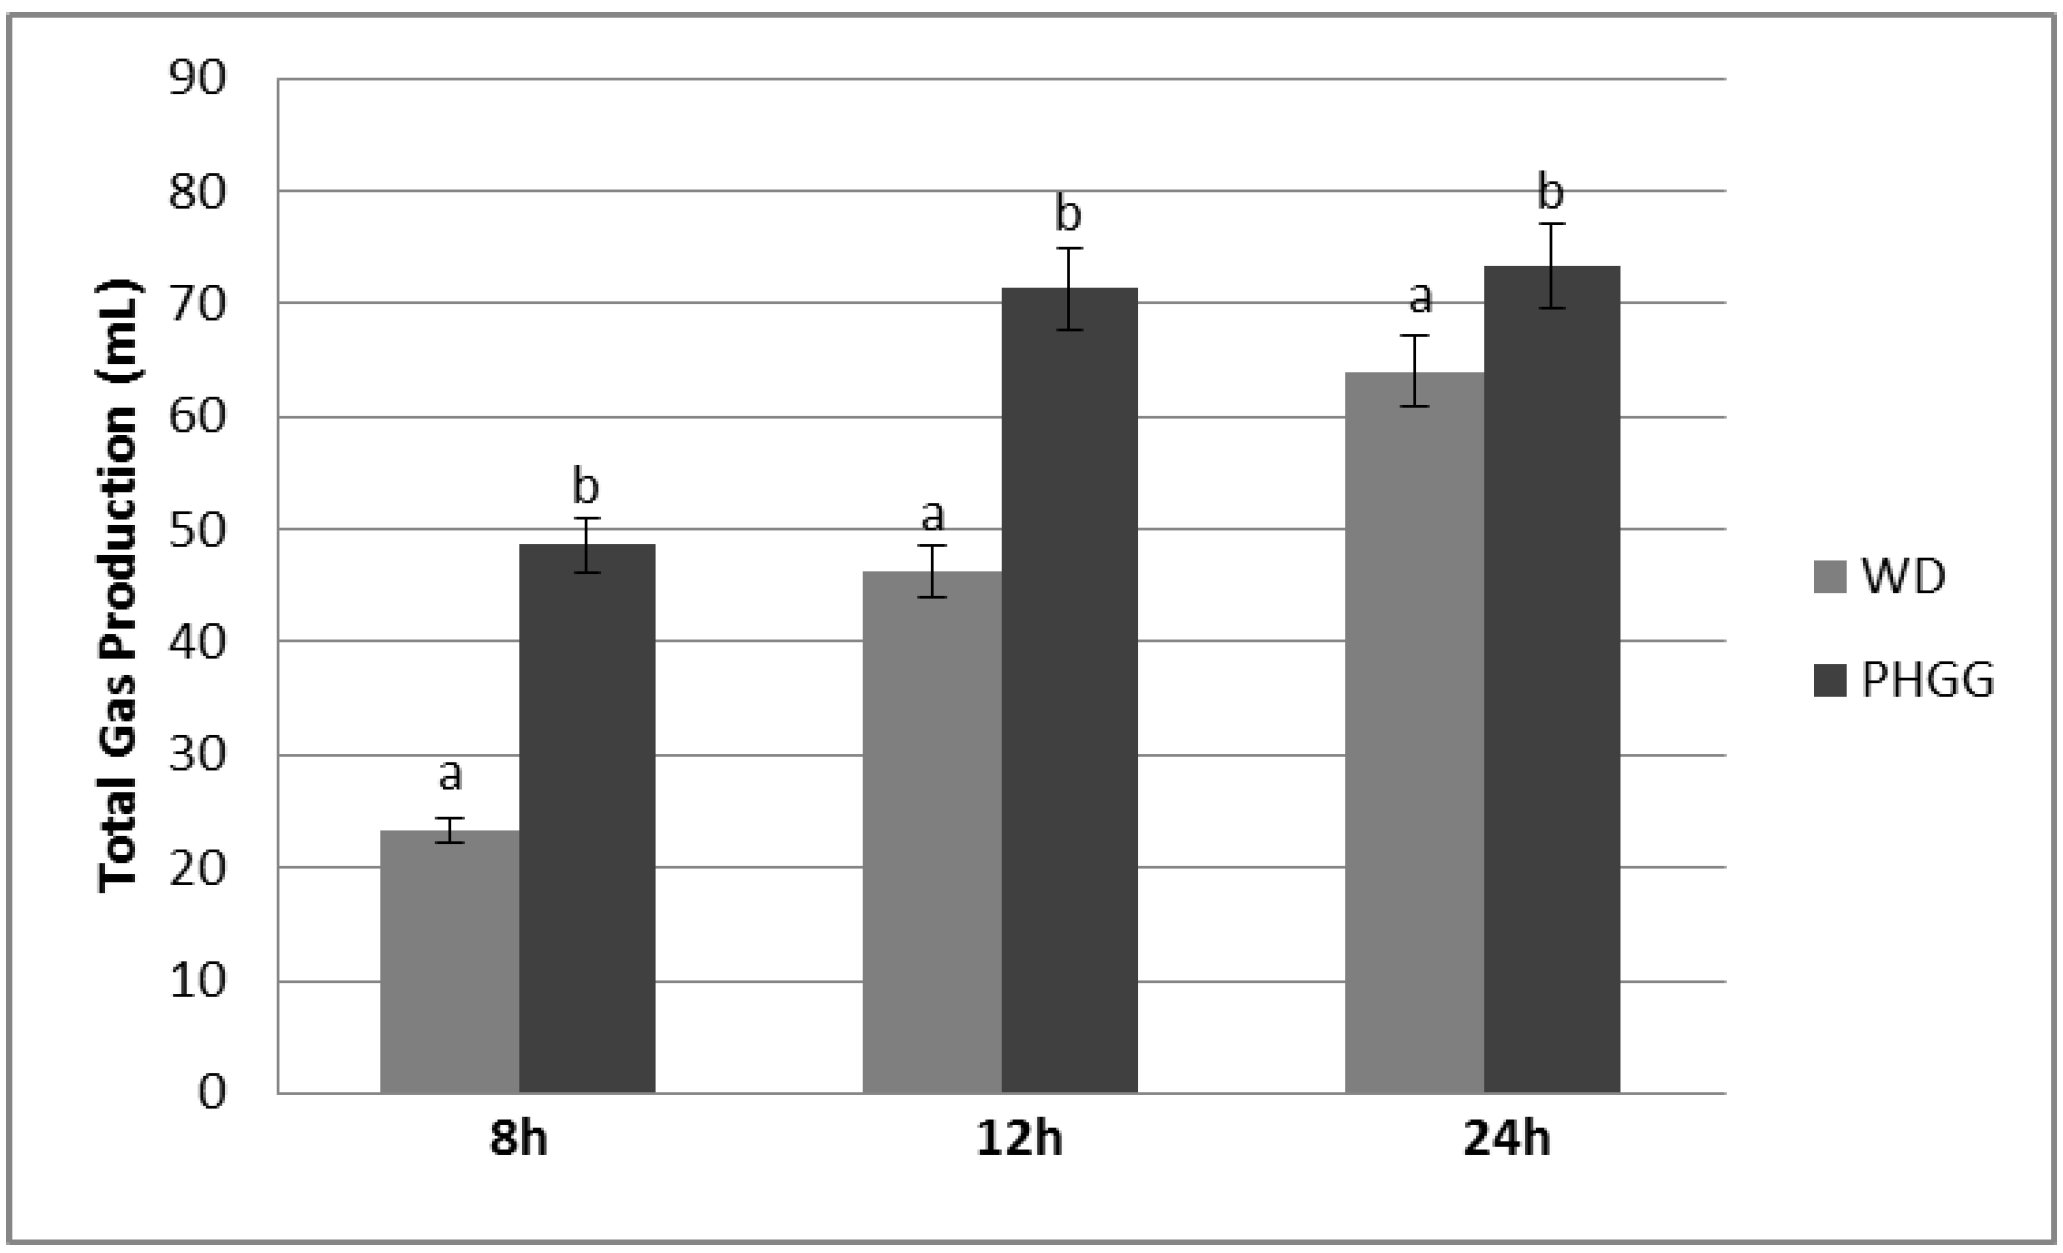
3.1. Gas Production and pH Shift

Within the first four hours of analysis, neither WD nor PHGG produced detectable amounts of gas. At 8 h, PHGG produced significantly more gas (p < 0.001) than WD, as well as at 12 and 24 h of fermentation (Figure 1). Each fiber produced a significant decrease in pH (Table 1), with WD decreasing more consistently over 24 h, while PHGG decreased quickly between 4 and 8 h of fermentation, which is simultaneously reflected by the large increase in gas production at 8 h for PHGG.
Figure 1. Total Gas Volume Produced in Batch Culture Fermentation System with Wheat Dextrin (WD) and Partially Hydrolyzed Guar Gum (PHGG) Across 24 h of Analysis. Notes: Columns with different letters are significantly different from one another within the same time of measurement (p < 0.05), at 8, 12 and 24 h; Values displayed are mean values (n = 3) ± SE; No measurable amounts of gas were detected in the substrate blank, or at 0 or 4 h for WH and PHGG.
Foods 04 00349 g001
Table 1. pH Shift in Batch Culture Fermentation System with WD and PHGG Across 24 h of Analysis.
Time (h)pH
WDPHGGBlank
06.96 (0.02) a6.97 (0.01) a7.06 (0.01) b
46.51 (0.00) a6.59 (0.02) b6.96 (0.01) c
86.34 (0.00) b5.93 (0.00) a6.92 (0.00) c
126.07 (0.01) b5.90 (0.00) a6.92 (0.01) c
245.78 (0.02) a5.86 (0.00) b6.92 (0.01) c
Notes: Values are mean (n = 3) followed by (SE); Values with different letters are statistically different from each other within rows (p < 0.05).

3.2. SCFA Production

Levels of acetate, propionate and butyrate indicate that increased amounts of SCFAs can be seen with time in the batch culture fermentation system for both WD and PHGG. Levels for PHGG remained constant or declined after 12 h. WD produced less total SCFA (data not shown) compared to PHGG at 12 h (p = 0.015). All levels expressed (Table 2) are expressed as μmol SCFA/mL of system media.
Table 2. Short Chain Fatty Acids (SCFAs) of Exposed Human Fecal Inoculum across 24 h of Analysis.
Time (h)Acetate (μmol/mL)Propionate (μmol/mL)Butyrate (μmol/mL)
WDPHGGWDPHGGWDPHGG
01.20 (0.05)1.03 (0.09)0.69 (0.01)0.68 (0.02)0.98 (0.03)0.95 (0.03)
45.02 (0.38)4.30 (0.14)2.45 (0.17)2.36 (0.03)3.70 (0.29)3.22 (0.05)
87.56 (0.36)9.83(0.01)7.37 (0.19)7.47 (0.29)7.77 (0.39)10.48 (0.77)
129.71 (0.53)10.85 (0.23)8.94 (0.66)10.62 (0.10)8.35 (0.78)10.76 (0.18)
2411.60 (0.71)10.74 (0.13)10.59 (0.51)10.62 (0.44)8.32 (0.15)9.85 (0.62)
Values are mean (n = 3) followed by (SE).

3.3. Prebiotic Effects

Shifts in Bifidobacteria and Lactobacilli were used to demonstrate the prebiotic effects measured in the batch culture fermentation system. For both genera of analysis, all three samples had similar baseline concentrations. At 12 h WD was slightly more bifidogenic than PHGG (p = 0.052), and also at 24 h (p = 0.043) (Table 3). Changes in Lactobacilli at 12 and 24 h for both WD and PHGG show that both fibers demonstrate lactogenic prebiotic properties. Based on fermentation kinetics, PHGG is more rapidly fermented than WD, and both fibers show prebiotic effects, based on changes in Bifidobacteria and Lactobacilli, as early as 12 h.
Table 3. Alterations in the Microbiota Concentration in Batch Culture Fermentation with WD and PHGG after 0, 12 and 24 h of Fermentation with Human Fecal Inoculum.
Time (h)Bifidobacteria (CFU log10/mL)Lactobacilli (CFU log10/mL)
WDPHGGBlankWDPHGGBlank
09.24 (0.03) a9.14 (0.07) a9.08 (0.00) a10.39 (0.04) a10.40 (0.09) a10.35 (0.02) a
129.50 (0.03) b9.30 (0.04) b9.05 (0.06) a10.79 (0.04) b10.86 (0.07) b10.35 (0.02) a
249.41 (0.07) b9.27 (0.04) c8.96 (0.07) a10.76 (0.09) b10.68 (0.04) b10.23 (0.03) a
Notes: Values displayed are mean (n = 2) (standard error); Values with different letters are statistically different from each other within rows of three columns displaying data for each respective genus (p < 0.05).

4. Discussion

The human gut microflora is a diverse population, with many different genera of bacteria having very different influences on the host. Both Lactobacillus and Bifidobacterium are generally accepted as two beneficial genera of bacteria, and contribute to a myriad of health benefits to the host [4]. Mechanisms underlying these benefits are thought to be through modulating the immune response and antagonizing pathogens, either by production of antimicrobial compounds or through competition for mucosal binding sites [16]. Additionally, these gut microbes facilitate nutrient and energy extraction from the diet [17]. Therefore, increasing dietary fiber intake while modulating the gut microbiota through supplementation with dietary fibers with prebiotic activity may aid in promoting the gut health of the host. Long-term studies have shown that fiber supplementation can alter the makeup of the intestinal microflora with soluble fibers [18], while the purpose of this study was to evaluate the early prebiotic effects employing an in vitro model.
Quantitative PCR analysis of WD and PHGG display that both are prebiotic dietary fibers, with both fibers displaying bifidogenic and lactogenic properties as early as 12 h when compared to baseline measurements. Previous studies have also shown bifidogenic and lactogenic properties for WD and PHGG at 24 h, while this is the first study to show rapid prebiotic activity at 12 h. Between fibers, WD is statistically more bifidogenic at 24 h (p = 0.043) and shows a statistical trend (p = 0.052) to be more bifidogenic at 12 h when compared to PHGG, although PHGG still shows bifidogenic and lactogenic growth at both 12 and 24 h. WD has also been shown to increase other genera of beneficial bacteria, including non-pathogenic Clostridium and Roseburia, in similar models [19].
Secondary measurements of fermentation kinetics, including change in pH, total gas production and development of SCFAs were also key components to modeling the mechanism of action for these fibers. For WD and PHGG, pH decreased from baseline until the 24 h time point. It is postulated that a decrease in gut pH allows for more efficient absorption of specific minerals [20,21], and may provide protective effects in the colon.
Both fibers did not produce detectable amounts of gas until 8 h, and for the 12 and 24 h measurements, PHGG produced significantly more total gas. Measurement of gas production is of interest as an indirect measurement of fiber fermentation. Work in our laboratory found that production of breath hydrogen and methane was a poor indicator of apparent digestion of fiber [22]. Acute tests of breath hydrogen production find that fibers that are fermented quickly and extensively, such as inulin, produce the most breath hydrogen [23,24]. In an in vitro system like the one described in this paper, differences among fibers on gas production should be useful indicators of the rate and extent of fermentation in the human gut.
Acetate, propionate and butyrate are commonly measured SCFAs and are representative end-products of colonic fermentation and are typically influenced by both microbes present and substrates utilized. Acetate is commonly metabolized by muscles for energy [25], propionate used as a gluconeogenic substrate [26] and butyrate used as an oxidative fuel for colonocytes [27]. Production of these acidic metabolites also promotes a decrease in colonic pH [28], which promotes the growth of many lactic acid bacteria that thrive in more acidic environments. Clinical studies have also shown that this decrease in pH promotes growth of beneficial bacteria such as Bacteroides and inhibits growth of Clostridum perfringens [29]. Based on secondary fermentation measurements, PHGG is more rapidly fermented than WD.
Because of the rapid formation and absorption of SCFAs in vivo, in vitro models are typically employed to accurately understand the kinetics of colonic fermentation. Although pooled fecal homogenates were used in this study, stimulation of bifidogenic and lactogenic bacteria are consistent with other clinical studies, demonstrating the prebiotic effects of WD and PHGG. The current study demonstrates that WD and PHGG act as prebiotic fibers and the prebiotic changes can occur as early as 12 h. Future research should be conducted using individual fecal sampling to analyze specie-specific stimulation of WD and PHGG, and doing so will allow for accurate comparisons between individuals in the population and help us to better understand the relationship between fiber consumption, the host’s microbiome and overall digestive health.

Author Contributions

The study was designed by authors Slavin, Hospattanker, and Carlson. Swanson and Ping conducted the analysis of microbiota. Other laboratory work was conducted by Carlson. All authors contributed to data analysis and interpretation. Carlson wrote the first draft of the manuscript and all authors revised and approved the final manuscript.

Conflicts of Interest

The authors declare no conflict of interest.

References

  1. Slavin, J.L. Position of the American Dietetic Association: Health implications of dietary fiber. J. Am. Diet. Assoc. 2008, 108, 1716–1731. [Google Scholar] [PubMed]
  2. King, D.E.; Mainous, A.G.; Lambourne, C.A. Trends in dietary fiber intake in the United States, 1999–2008. J. Acad. Nutr. Diet. 2012, 112, 642–648. [Google Scholar] [CrossRef] [PubMed]
  3. Reicks, M.; Jonnalagadda, S.; Albertson, A.M.; Joshi, N. Total dietary fiber intakes in the US population are related to whole grain consumption: Results from the National Health and Nutrition Examination Survey 2009 to 2010. Nutr. Res. 2014, 34, 226–234. [Google Scholar] [CrossRef] [PubMed]
  4. Slavin, J. Fiber and prebiotics: Mechanisms and health benefits. Nutrients 2013, 5, 1417–1435. [Google Scholar] [CrossRef] [PubMed]
  5. Slavin, J.L. Dietary fiber and body weight. Nutrition 2005, 21, 411–418. [Google Scholar] [CrossRef] [PubMed]
  6. Vermorel, M.; Coudray, C.; Wils, D.; Sinaud, S.; Tressol, J.C.; Montaurier, C.; Brandolini, M.; Vernet, J.; Bouteloup-Demange, C.; Rayssiguier, Y. Energy value of a low-digestible carbohydrate, NUTRIOSE® FB, and its impact on magnesium, calcium and zinc apparent absorption and retention in healthy young men. Eur. J. Nutr. 2004, 43, 322–349. [Google Scholar] [CrossRef] [PubMed]
  7. Pasman, W.; Wils, D.; Saniez, M.-H.; Kardinaal, A. Long-term gastrointestinal tolerance of NUTRIOSE FB in healthy men. Eur. J. Clin. Nutr. 2006, 60, 1024–1034. [Google Scholar] [CrossRef] [PubMed]
  8. Guerin-Deremaux, L.; Li, S.; Pochat, M.; Wils, D.; Mubasher, M.; Reifer, C.; Miller, L.E. Effects of NUTRIOSE® dietary fiber supplementation on body weight, body composition, energy intake, and hunger in overweight men. Int. J. Food Sci. Nutr. 2011, 62, 628–635. [Google Scholar] [CrossRef] [PubMed]
  9. Guérin-Deremaux, L.; Pochat, M.; Reifer, C.; Wils, D.; Cho, S.; Miller, L.E. The soluble fiber NUTRIOSE induces a dose-dependent beneficial impact on satiety over time in humans. Nutr. Res. 2011, 31, 665–672. [Google Scholar] [CrossRef] [PubMed]
  10. Kovacs, E.M.; Westerterp-Plantenga, M.S.; Saris, W.H.; Goossens, I.; Geurten, P.; Brouns, F. The effect of addition of modified guar gum to a low-energy semisolid meal on appetite and body weight loss. Int. J. Obes. Relat. Metab. Disord. 2001, 25, 307–315. [Google Scholar] [CrossRef] [PubMed]
  11. Lavin, J.H.; Read, N.W. The effect on hunger and satiety of slowing the absorption of glucose: Relationship with gastric emptying and postprandial blood glucose and insulin responses. Appetite 1995, 25, 89–96. [Google Scholar] [CrossRef] [PubMed]
  12. Wisker, E.; Daniel, M.; Rave, G.; Feldheim, W. Fermentation of non-starch polysaccharides in mixed diets and single fibre sources: Comparative studies in human subjects and in vitro. Br. J. Nutr. 1998, 80, 253–261. [Google Scholar] [PubMed]
  13. Noack, J.; Timm, D.; Hospattankar, A.; Slavin, J. Fermentation profiles of wheat dextrin, inulin and partially hydrolyzed guar gum using an in vitro digestion pretreatment and in vitro batch fermentation system model. Nutrients 2013, 5, 1500–1510. [Google Scholar] [CrossRef] [PubMed]
  14. Schneider, S.M.; Girard-Pipau, F.; Anty, R.; van der Linde, E.G.M.; Philipsen-Geerling, B.J.; Knol, J.; Filippi, J.; Arab, K.; Hébuterne, X. Effects of total enteral nutrition supplemented with a multi-fibre mix on faecal short-chain fatty acids and microbiota. Clin. Nutr. 2006, 25, 82–90. [Google Scholar] [CrossRef] [PubMed]
  15. Hernot, D.C.; Boileau, T.W.; Bauer, L.L.; Middelbos, I.S.; Murphy, M.R.; Swanson, K.S.; Fahey, G.C. In vitro fermentation profiles, gas production rates, and microbiota modulation as affected by certain fructans, galactooligosaccharides, and polydextrose. J. Agric. Food Chem. 2009, 57, 1354–1361. [Google Scholar] [CrossRef] [PubMed]
  16. Marco, M.L.; Pavan, S.; Kleerebezem, M. Towards understanding molecular modes of probiotic action. Curr. Opin. Biotechnol. 2006, 17, 204–210. [Google Scholar] [CrossRef] [PubMed]
  17. Kleerebezem, M.; Vaughan, E.E. Probiotic and gut lactobacilli and bifidobacteria: Molecular approaches to study diversity and activity. Annu. Rev. Microbiol. 2009, 63, 269–290. [Google Scholar] [CrossRef] [PubMed]
  18. Holscher, H.D.; Caporaso, J.G.; Hooda, S.; Brulc, J.M.; Fahey, G.C., Jr.; Swanson, K.S. Fiber supplementation influences phylogenetic structure and functional capacity of the human intestinal microbiome: Follow-up of a randomized controlled trial 1–4. Am. J. Clin. Nutr. 2015, 101, 55–64. [Google Scholar] [CrossRef] [PubMed]
  19. Hobden, M.R.; Martin-Morales, A.; Guérin-Deremaux, L.; Wils, D.; Costabile, A.; Walton, G.E.; Rowland, I.; Kennedy, O.B.; Gibson, G.R. In Vitro Fermentation of NUTRIOSE® FB06, a Wheat Dextrin Soluble Fibre, in a Continuous Culture Human Colonic Model System. PLoS ONE 2013, 8, 1–7. [Google Scholar] [CrossRef] [PubMed]
  20. Scholz-Ahrens, K.E.; Schrezenmeir, J. Inulin, oligofructose and mineral metabolism—Experimental data and mechanism. Br. J. Nutr. 2002, 87, S179–S186. [Google Scholar] [CrossRef] [PubMed]
  21. Ohta, A.; Ohtsuki, M.T.; Baba, S.; Kimura, T. Effects of fructooligosaccharides on the absorption of iron, calcium and magnesium in iron-deficient anemic rats. J. Nutr. Sci. Vitaminol. 1995, 41, 281–291. [Google Scholar] [CrossRef] [PubMed]
  22. McNamara, E.A.; Levitt, M.D.; Slavin, J.L. Breath hydrogen and methane: Poor indicators of apparent digestion of soy iber. Am. J. Clin. Nutr. 1986, 43, 898–902. [Google Scholar] [PubMed]
  23. Hess, J.R.; Birkett, A.M.; Thomas, W.; Slavin, J.L. Effects of short-chain fuctooligosaccharides on satiety response in healthy men and women. Appetite 2011, 56, 128–134. [Google Scholar] [CrossRef] [PubMed]
  24. Bonnema, A.L.; Kolberg, L.W.; Thomas, W.; Slavin, J.L. Gastrointestinal tolerance of chicory inulin products. J. Am. Diet. Assoc. 2010, 110, 865–868. [Google Scholar] [CrossRef] [PubMed]
  25. Wong, J.M.W.; de Souza, R.; Kendall, C.W.C.; Emam, A.; Jenkins, D.J.A. Ovid: Colonic Health: Fermentation and Short Chain Fatty Acids. Clin. Gastroenterol. 2006, 40, 235–343. [Google Scholar] [CrossRef]
  26. Wolever, T.; Spadafora, P.; Eshuis, H. Interaction between colonic acetate and propionate in humans. Am. J. Clin. Nutr. 1991, 53, 681–687. [Google Scholar] [PubMed]
  27. Velázquez, O.C.; Lederer, H.M.; Rombeau, J.L. Butyrate and the colonocyte. Dig. Dis. Sci. 1996, 41, 727–739. [Google Scholar] [CrossRef] [PubMed]
  28. Topping, D.L.; Clifton, P.M. Short-chain fatty acids and human colonic function: Roles of resistant starch and nonstarch polysaccharides. Physiol. Rev. 2001, 81, 1031–1064. [Google Scholar] [PubMed]
  29. Lefranc-Millot, C.; Guérin-Deremaux, L.; Wils, D.; Neut, C.; Miller, L.E.; Saniez-Degrave, M.H. Impact of a resistant dextrin on intestinal ecology: How altering the digestive ecosystem with NUTRIOSE®, a soluble fibre with prebiotic properties, may be beneficial for health. J. Int. Med. Res. 2012, 40, 211–224. [Google Scholar] [CrossRef] [PubMed]

