
Study on Moisture Phase Changes in Bread Baking Using a Coupling Model

Abstract
1. Introduction
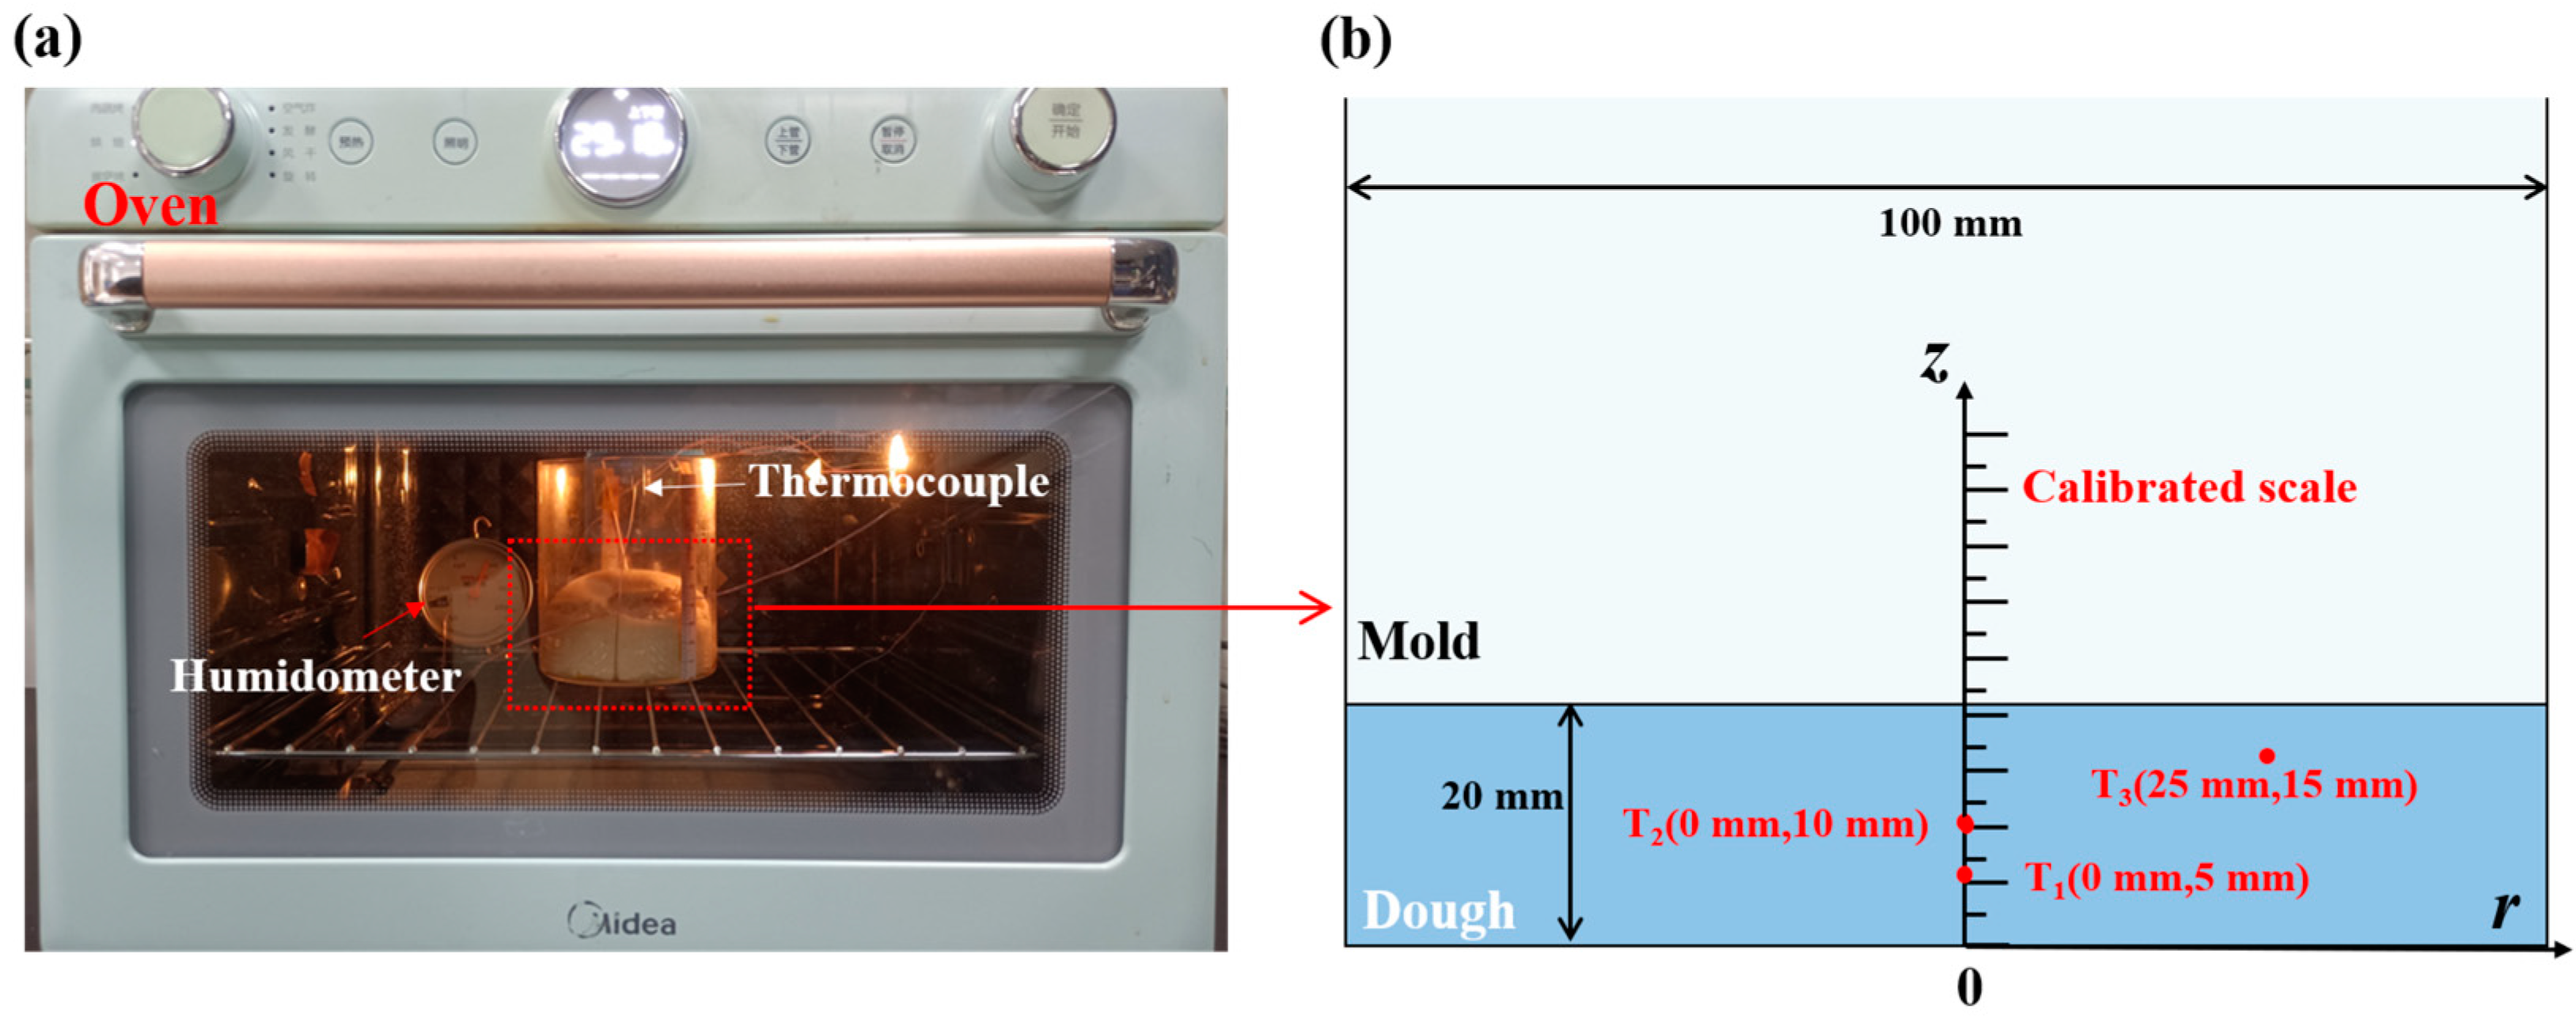
2. Experiment
2.1. Sample Preparation
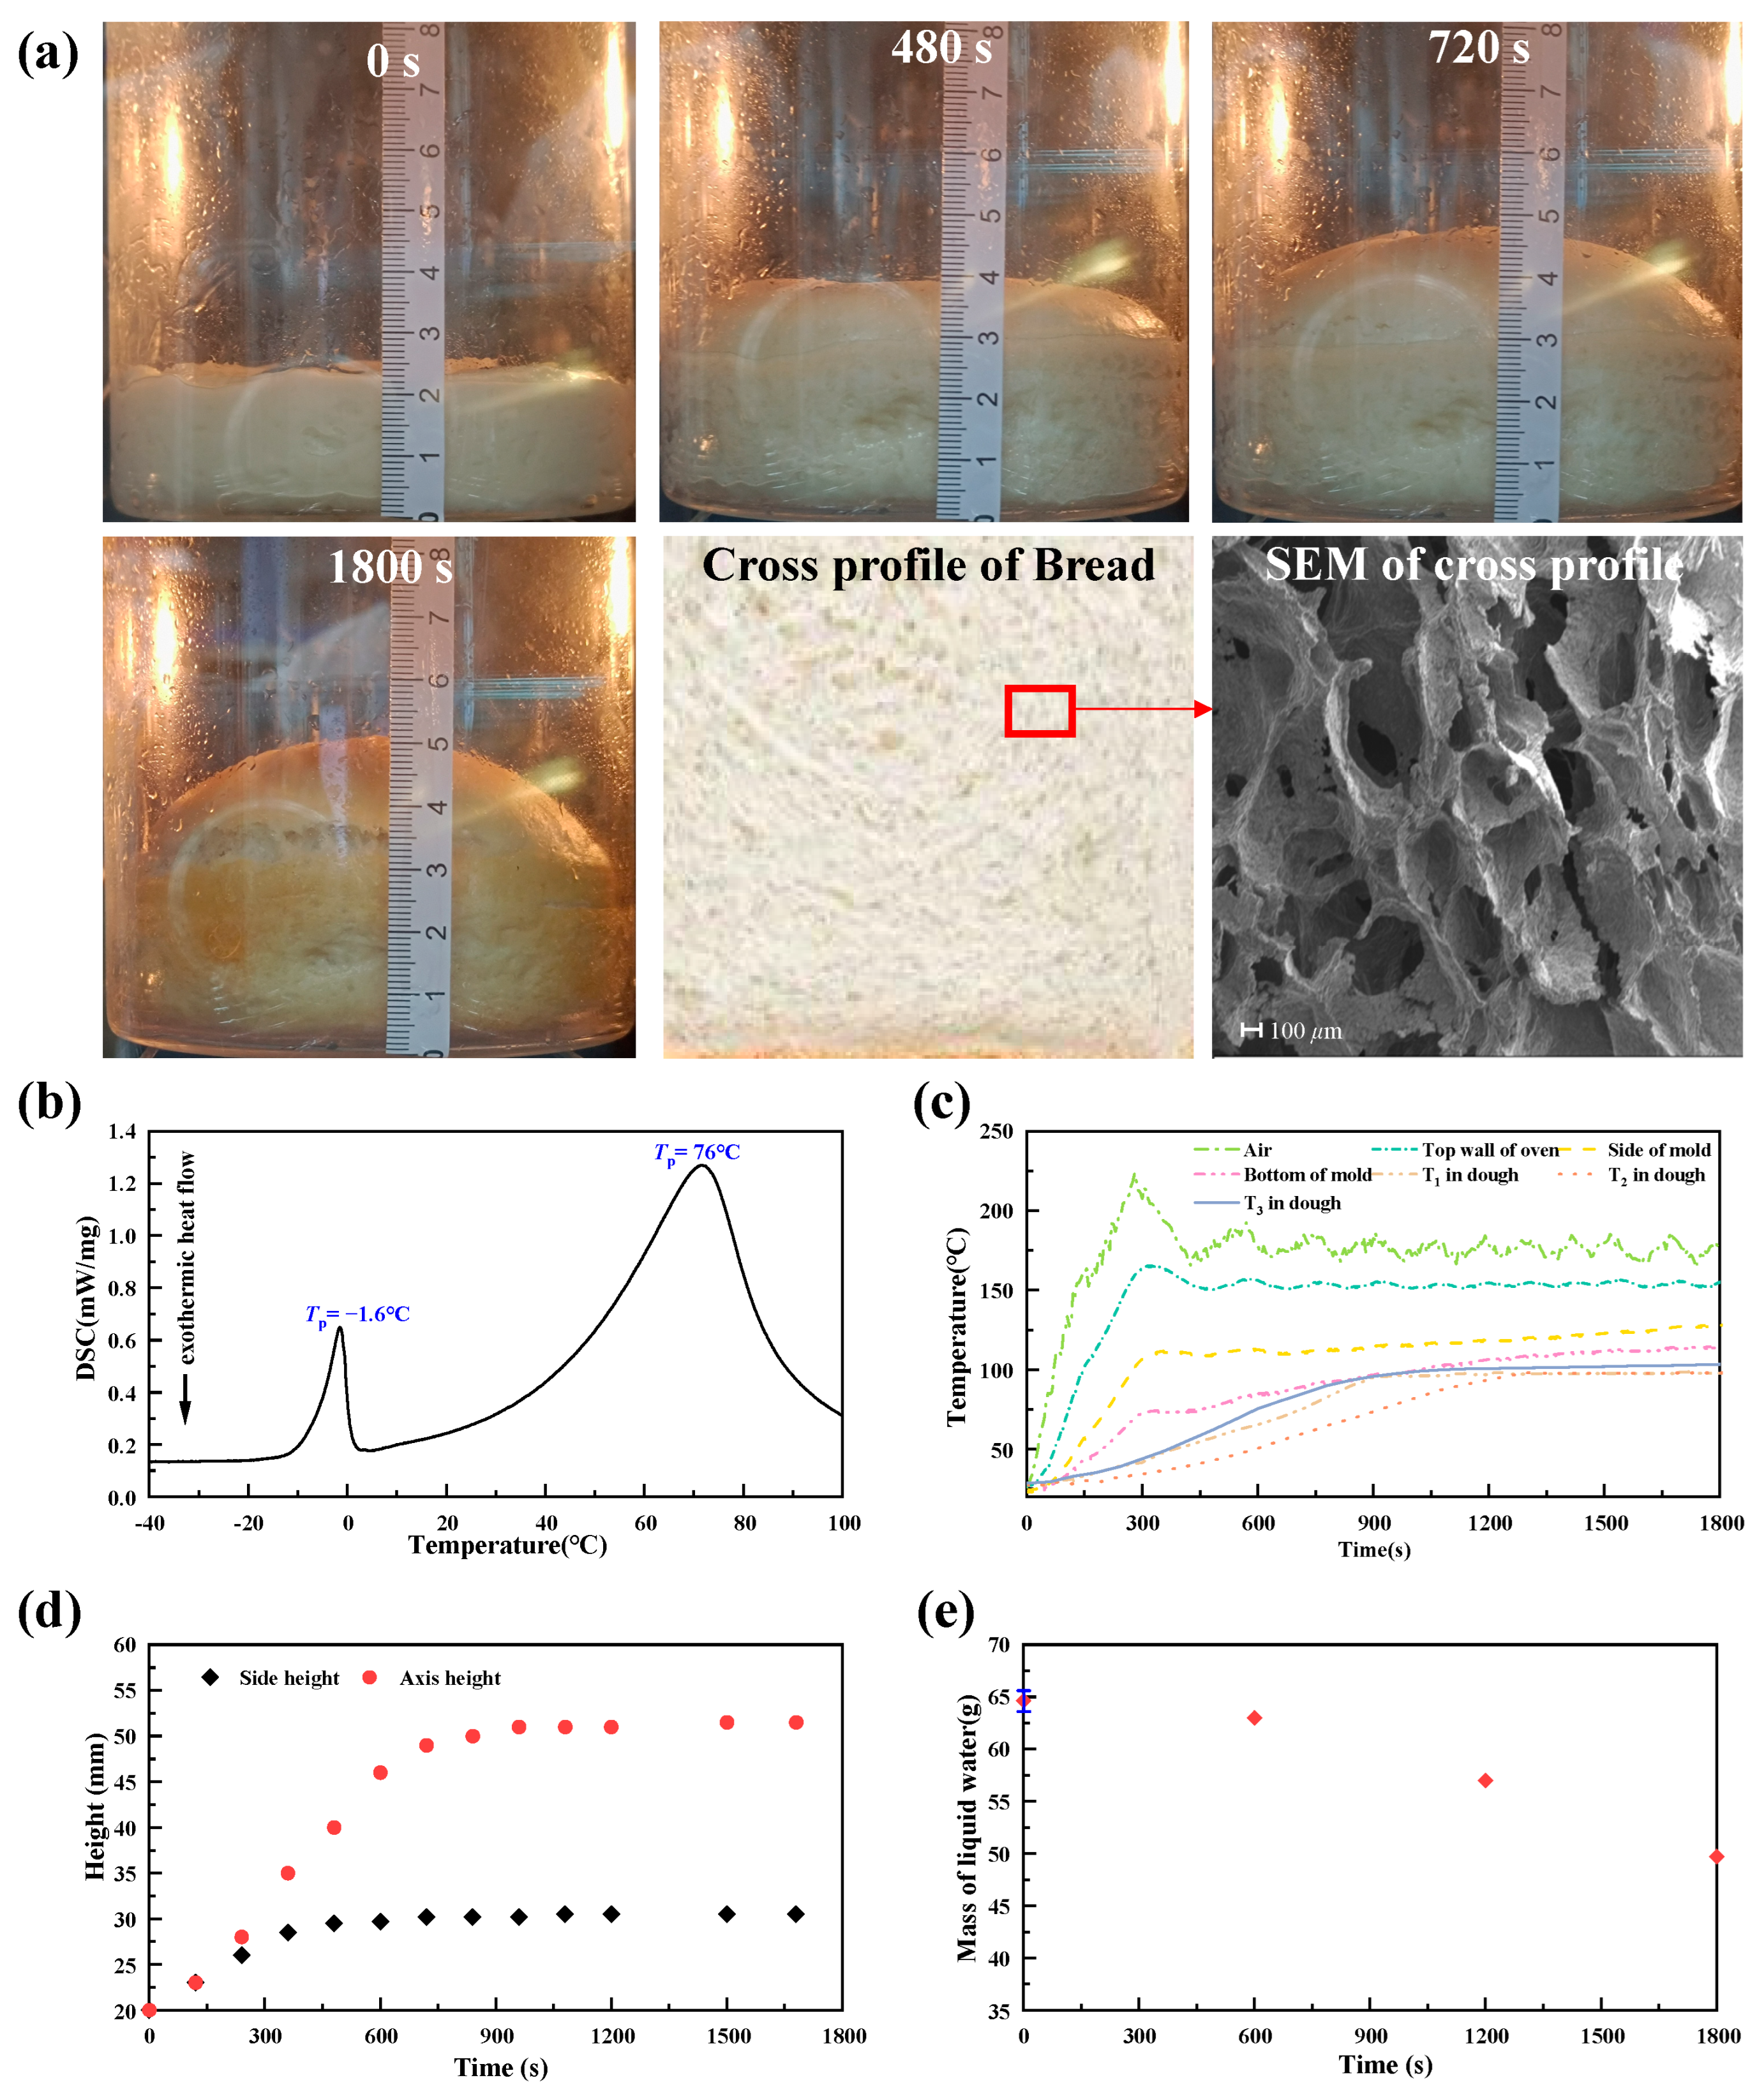
2.2. Experimental Protocols and Measurement Methods
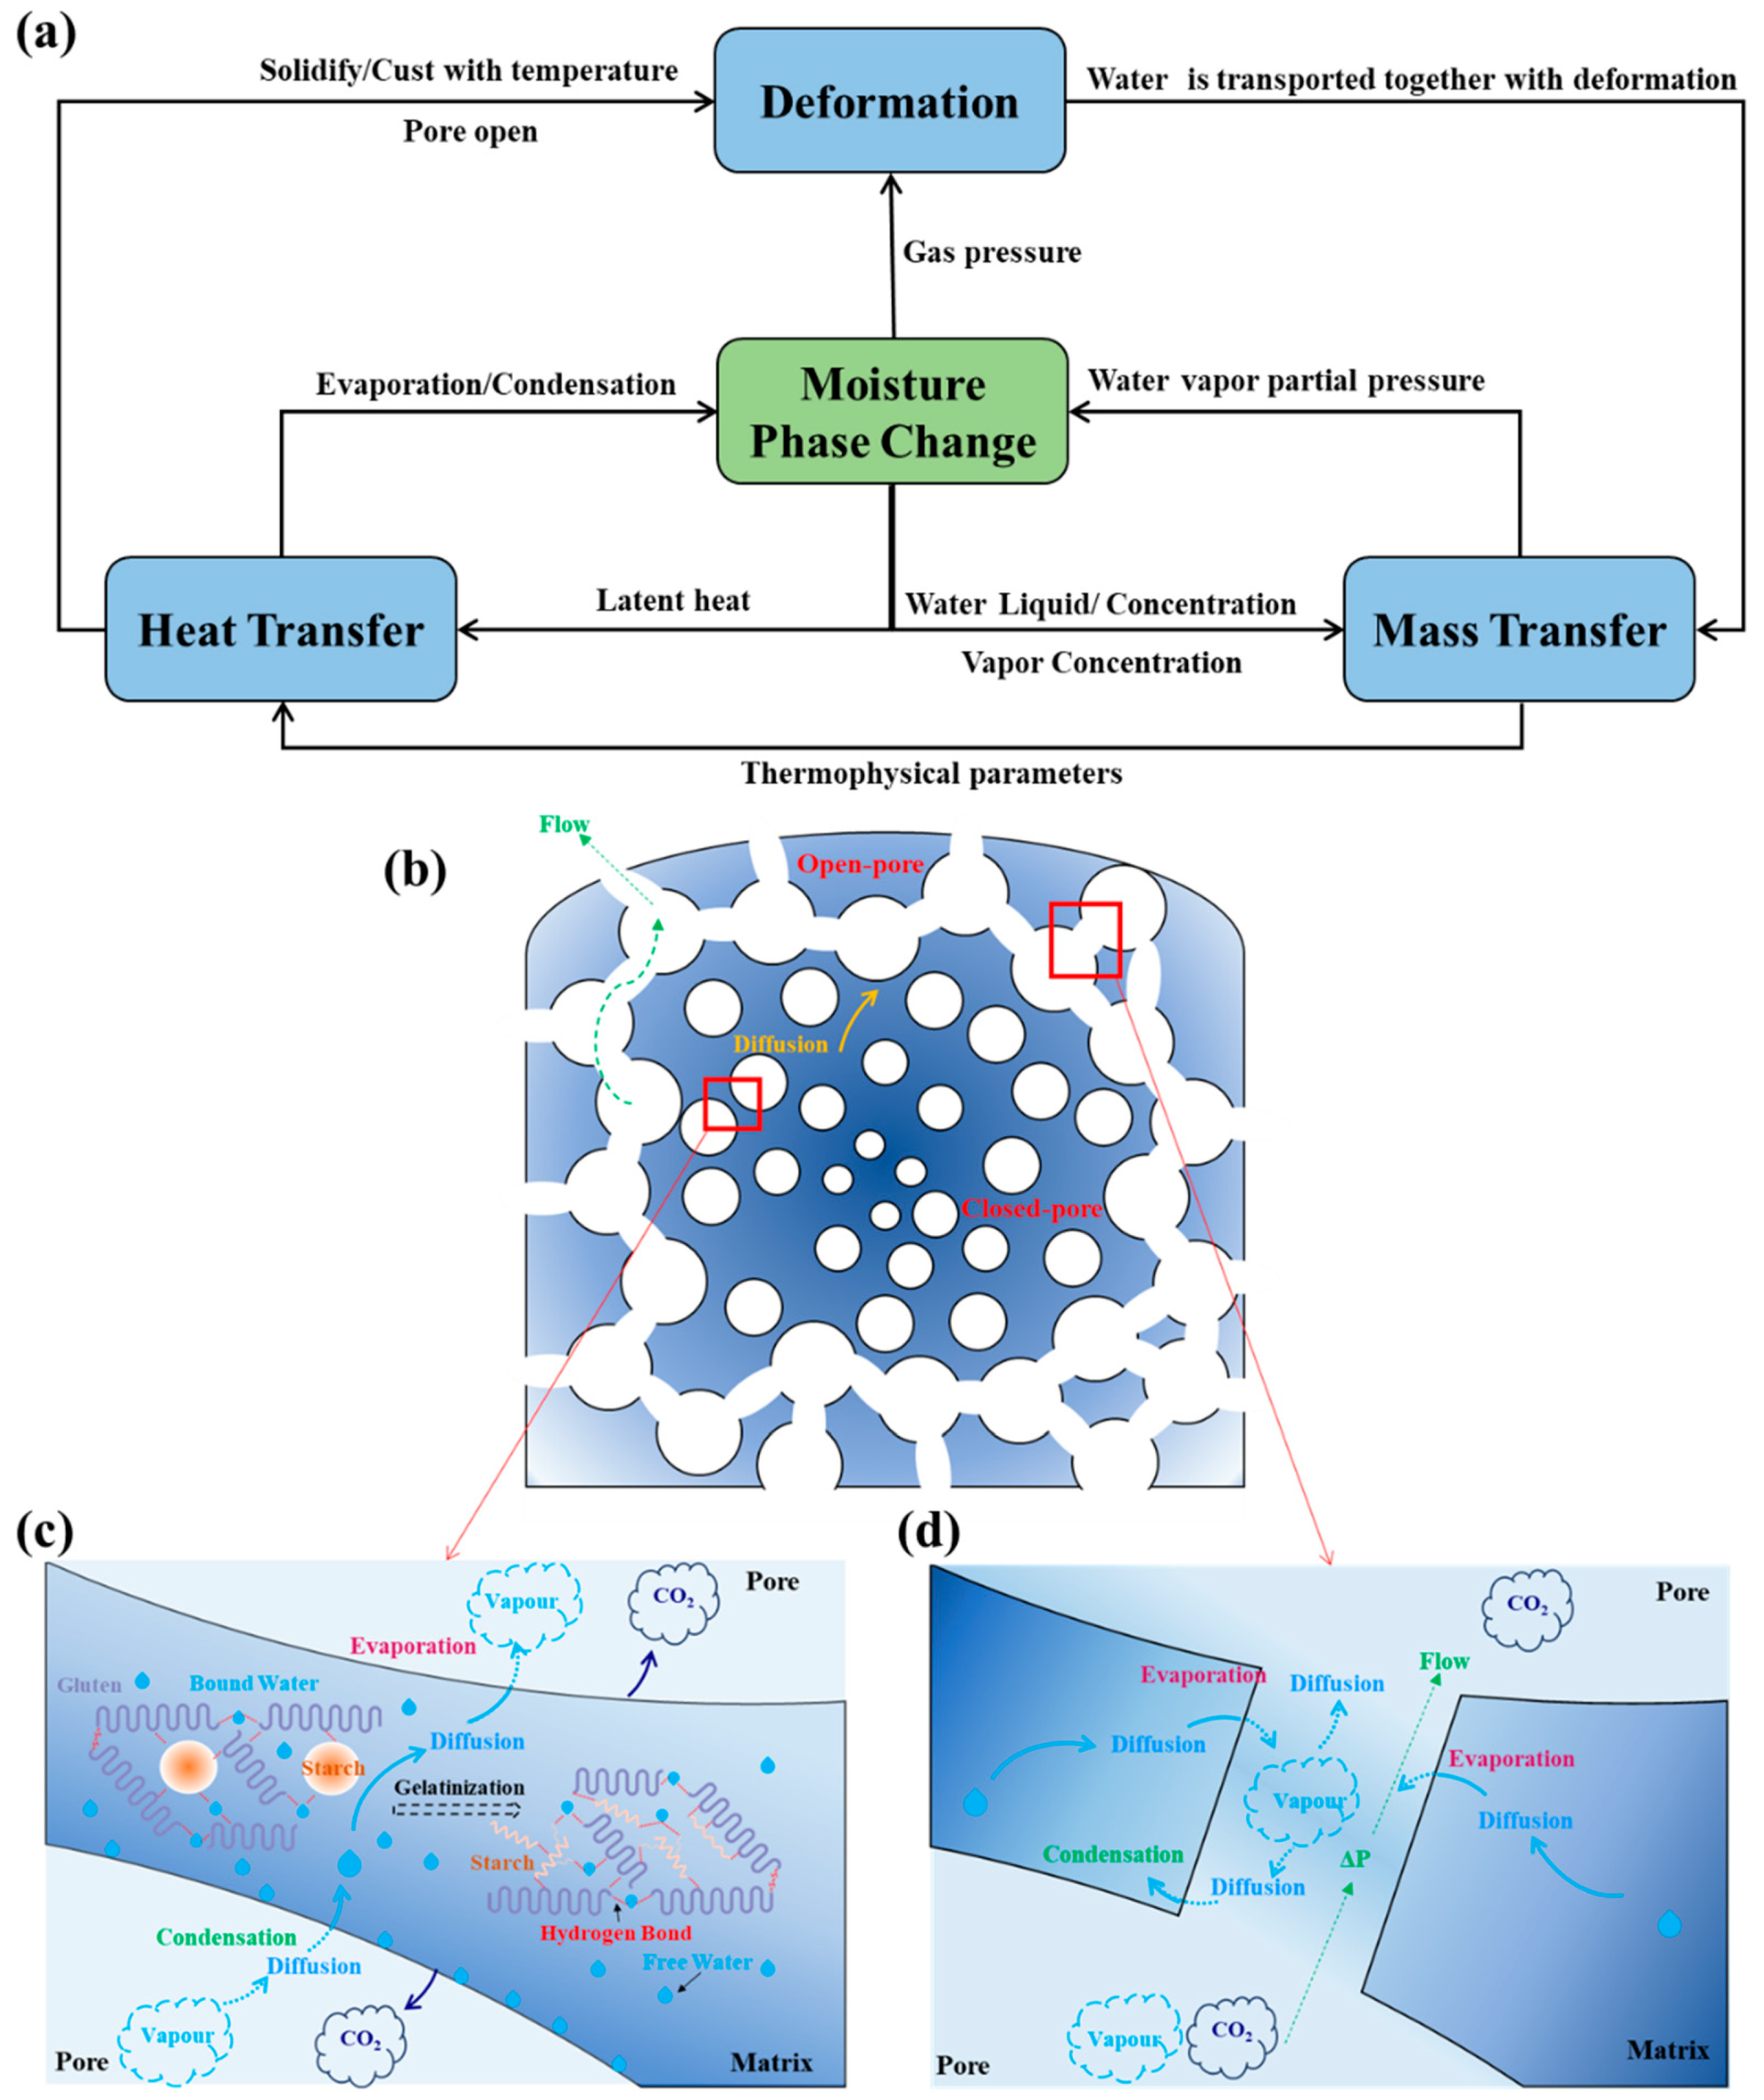
3. Model
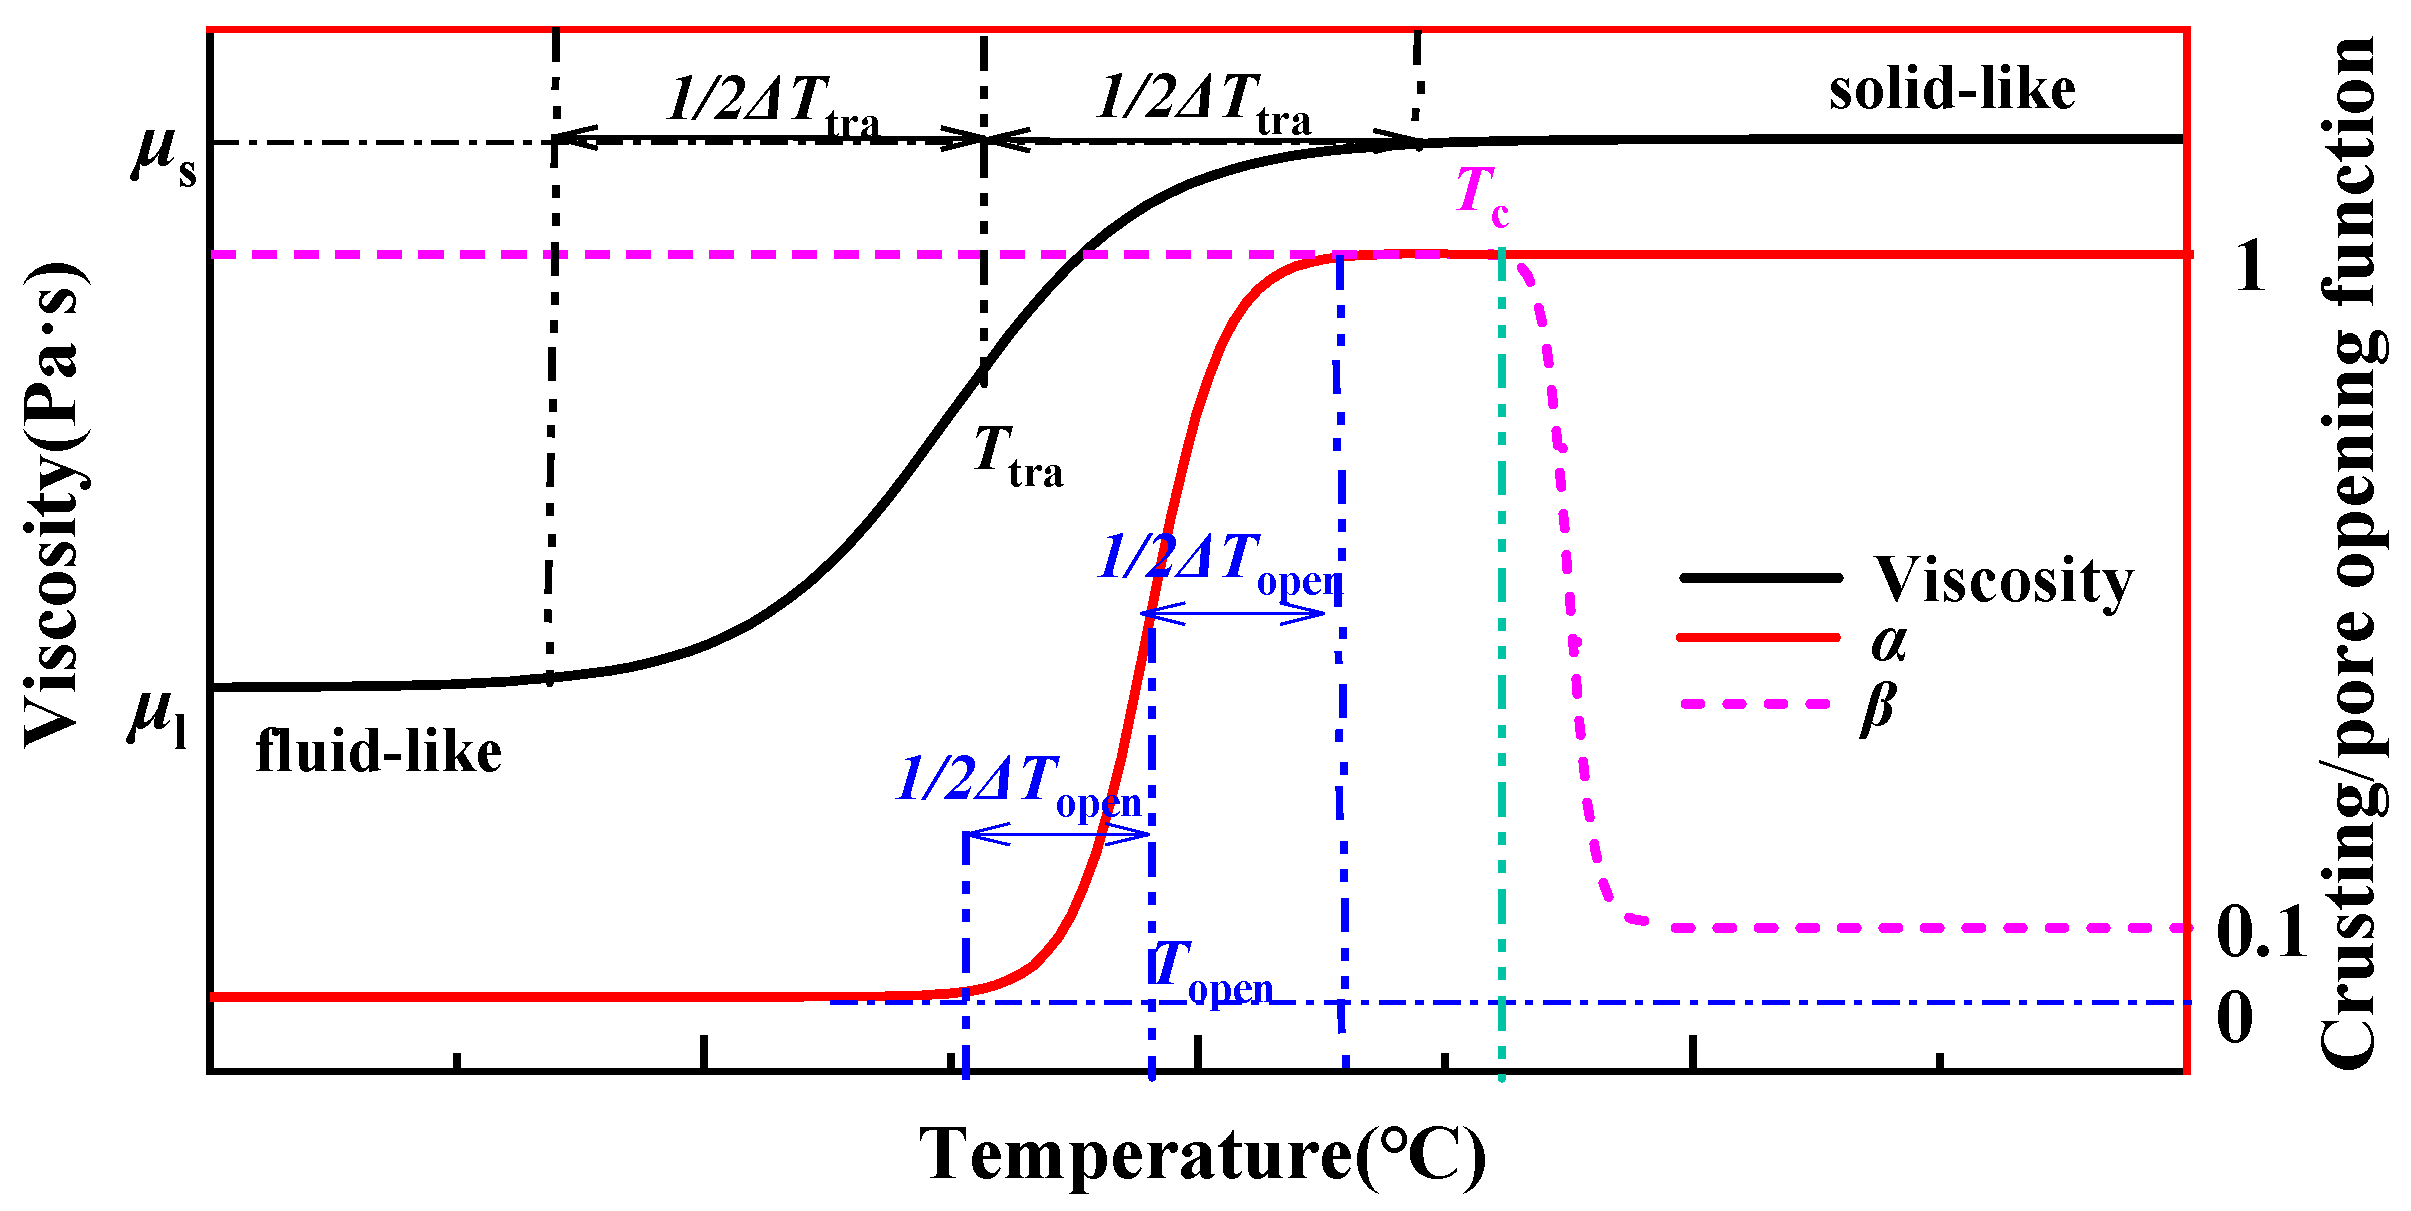
3.1. Governing Equations
3.2. Boundary and Initial Conditions
3.3. Parameters
3.4. Numerical Implementation
4. Results and Discussion
4.1. Determination of Key Parameters
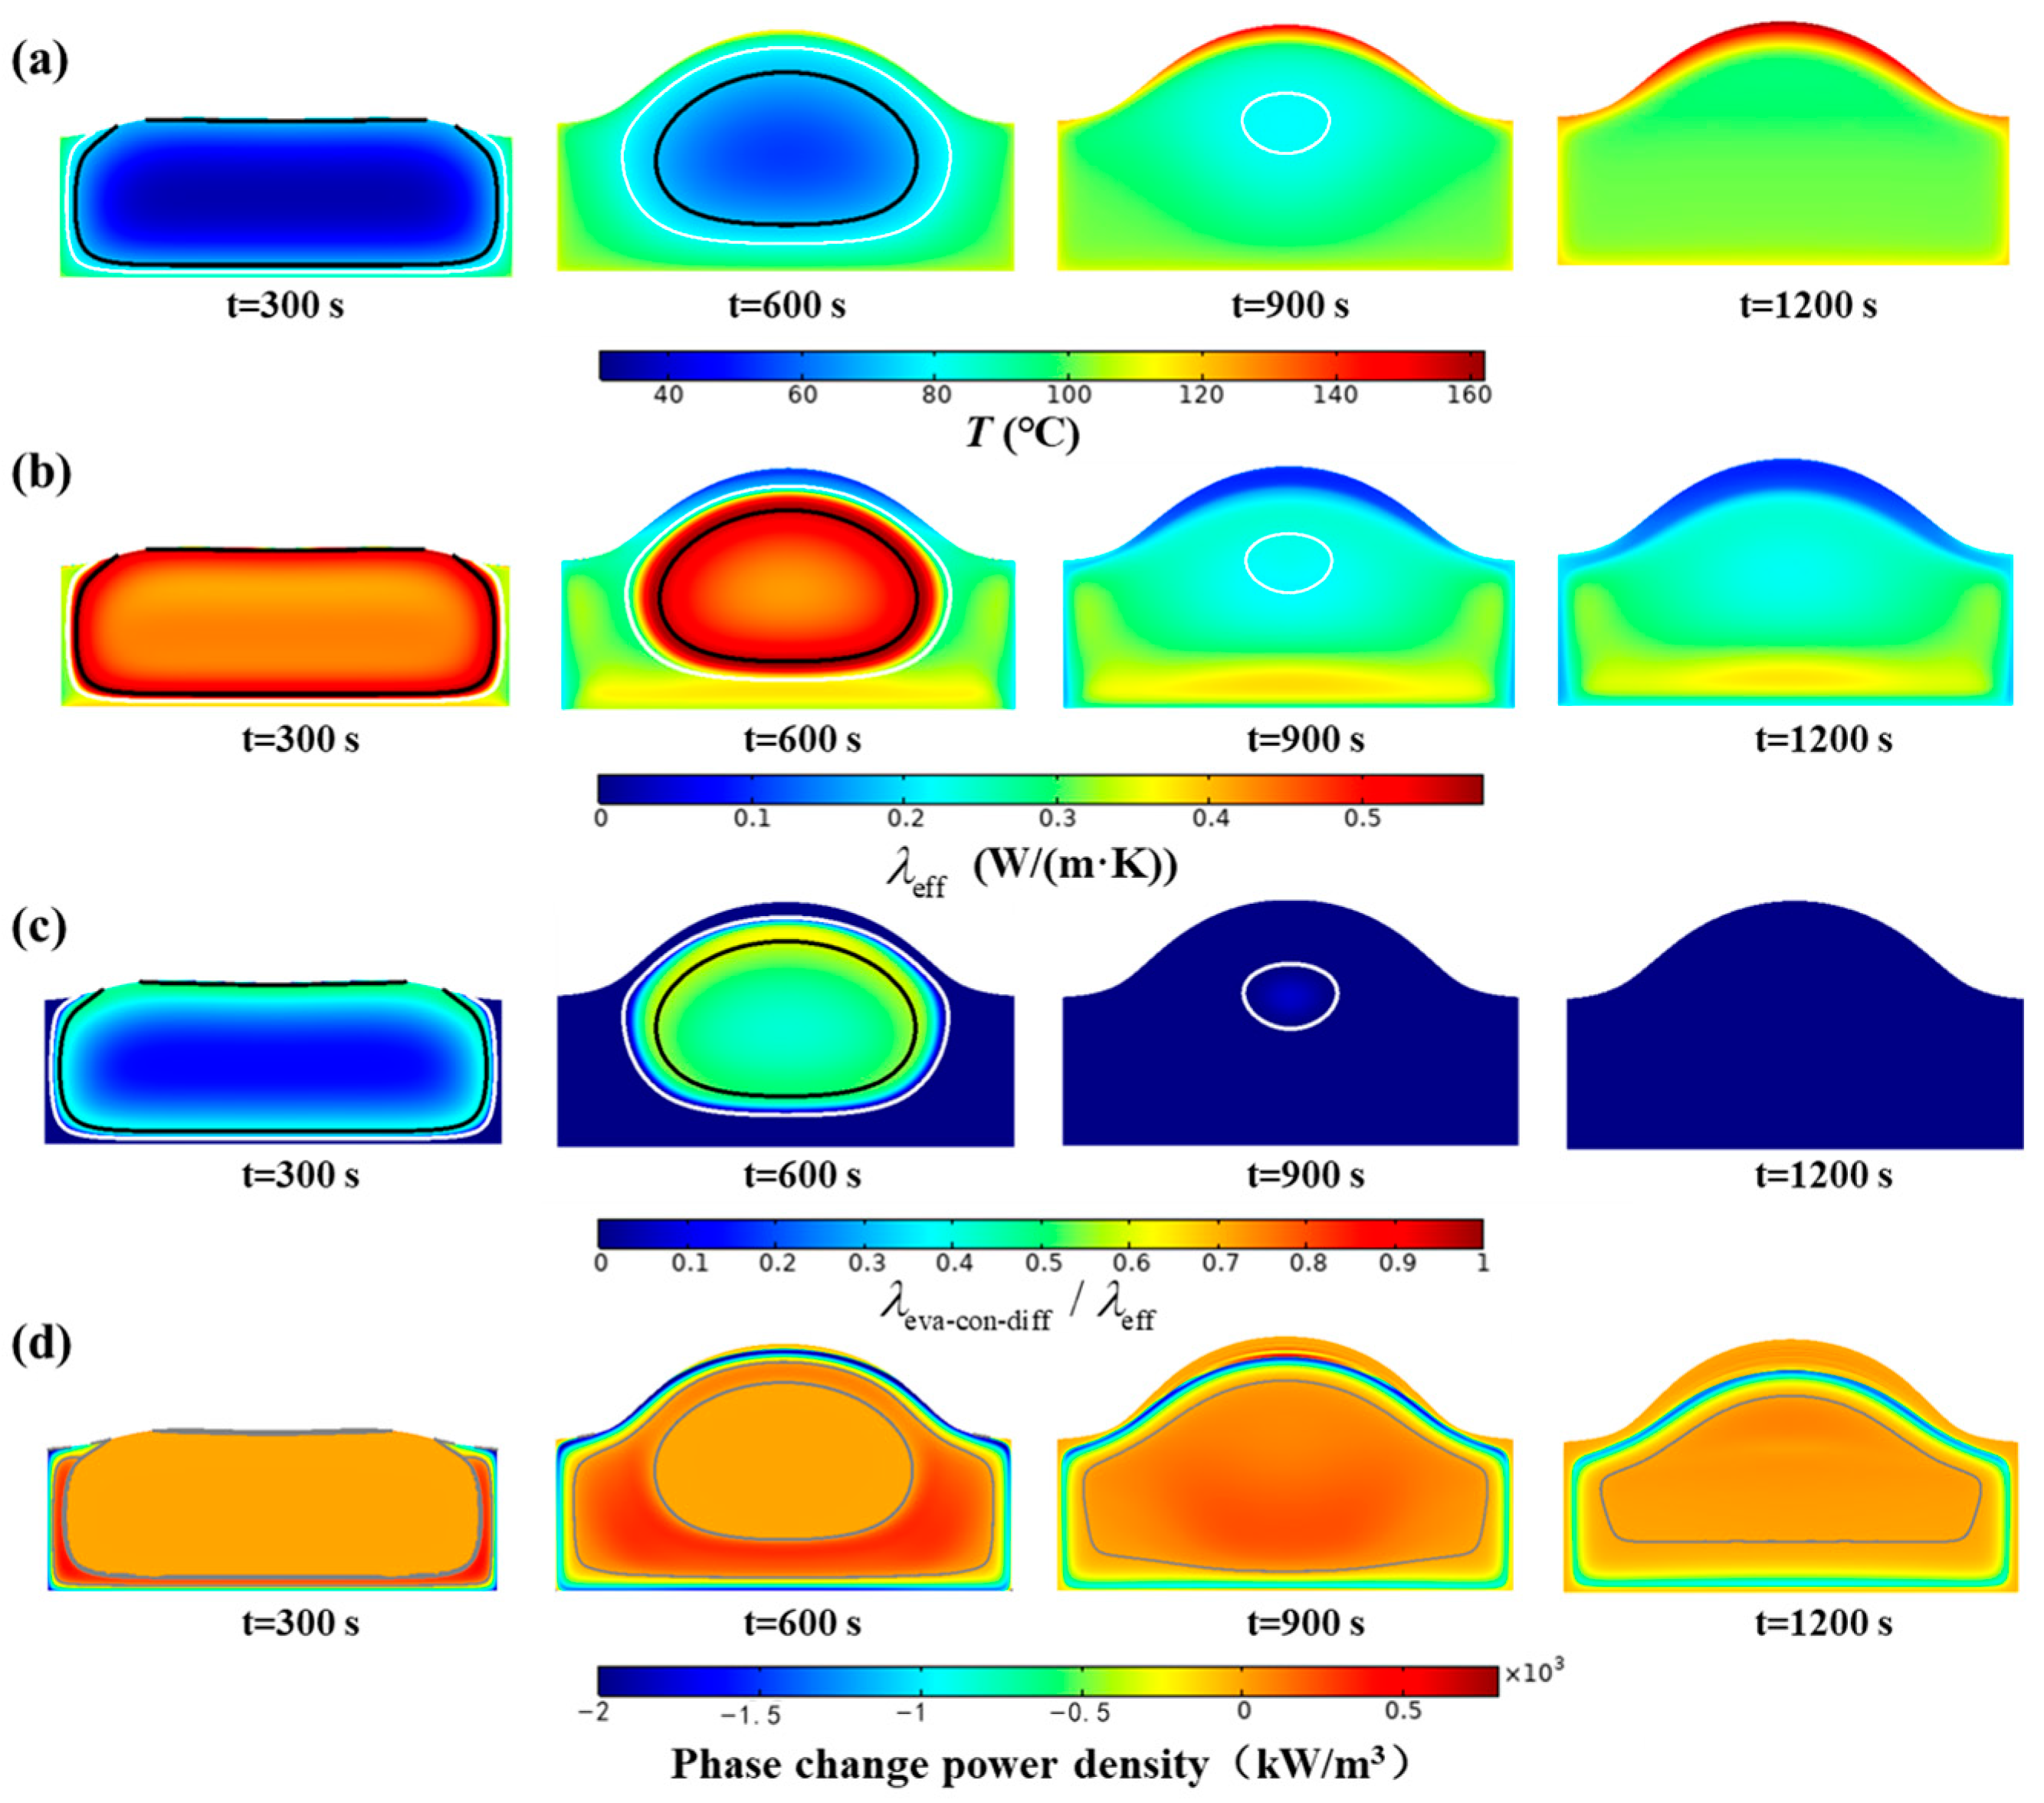
4.2. Effect of the MPC on Heat Transfer
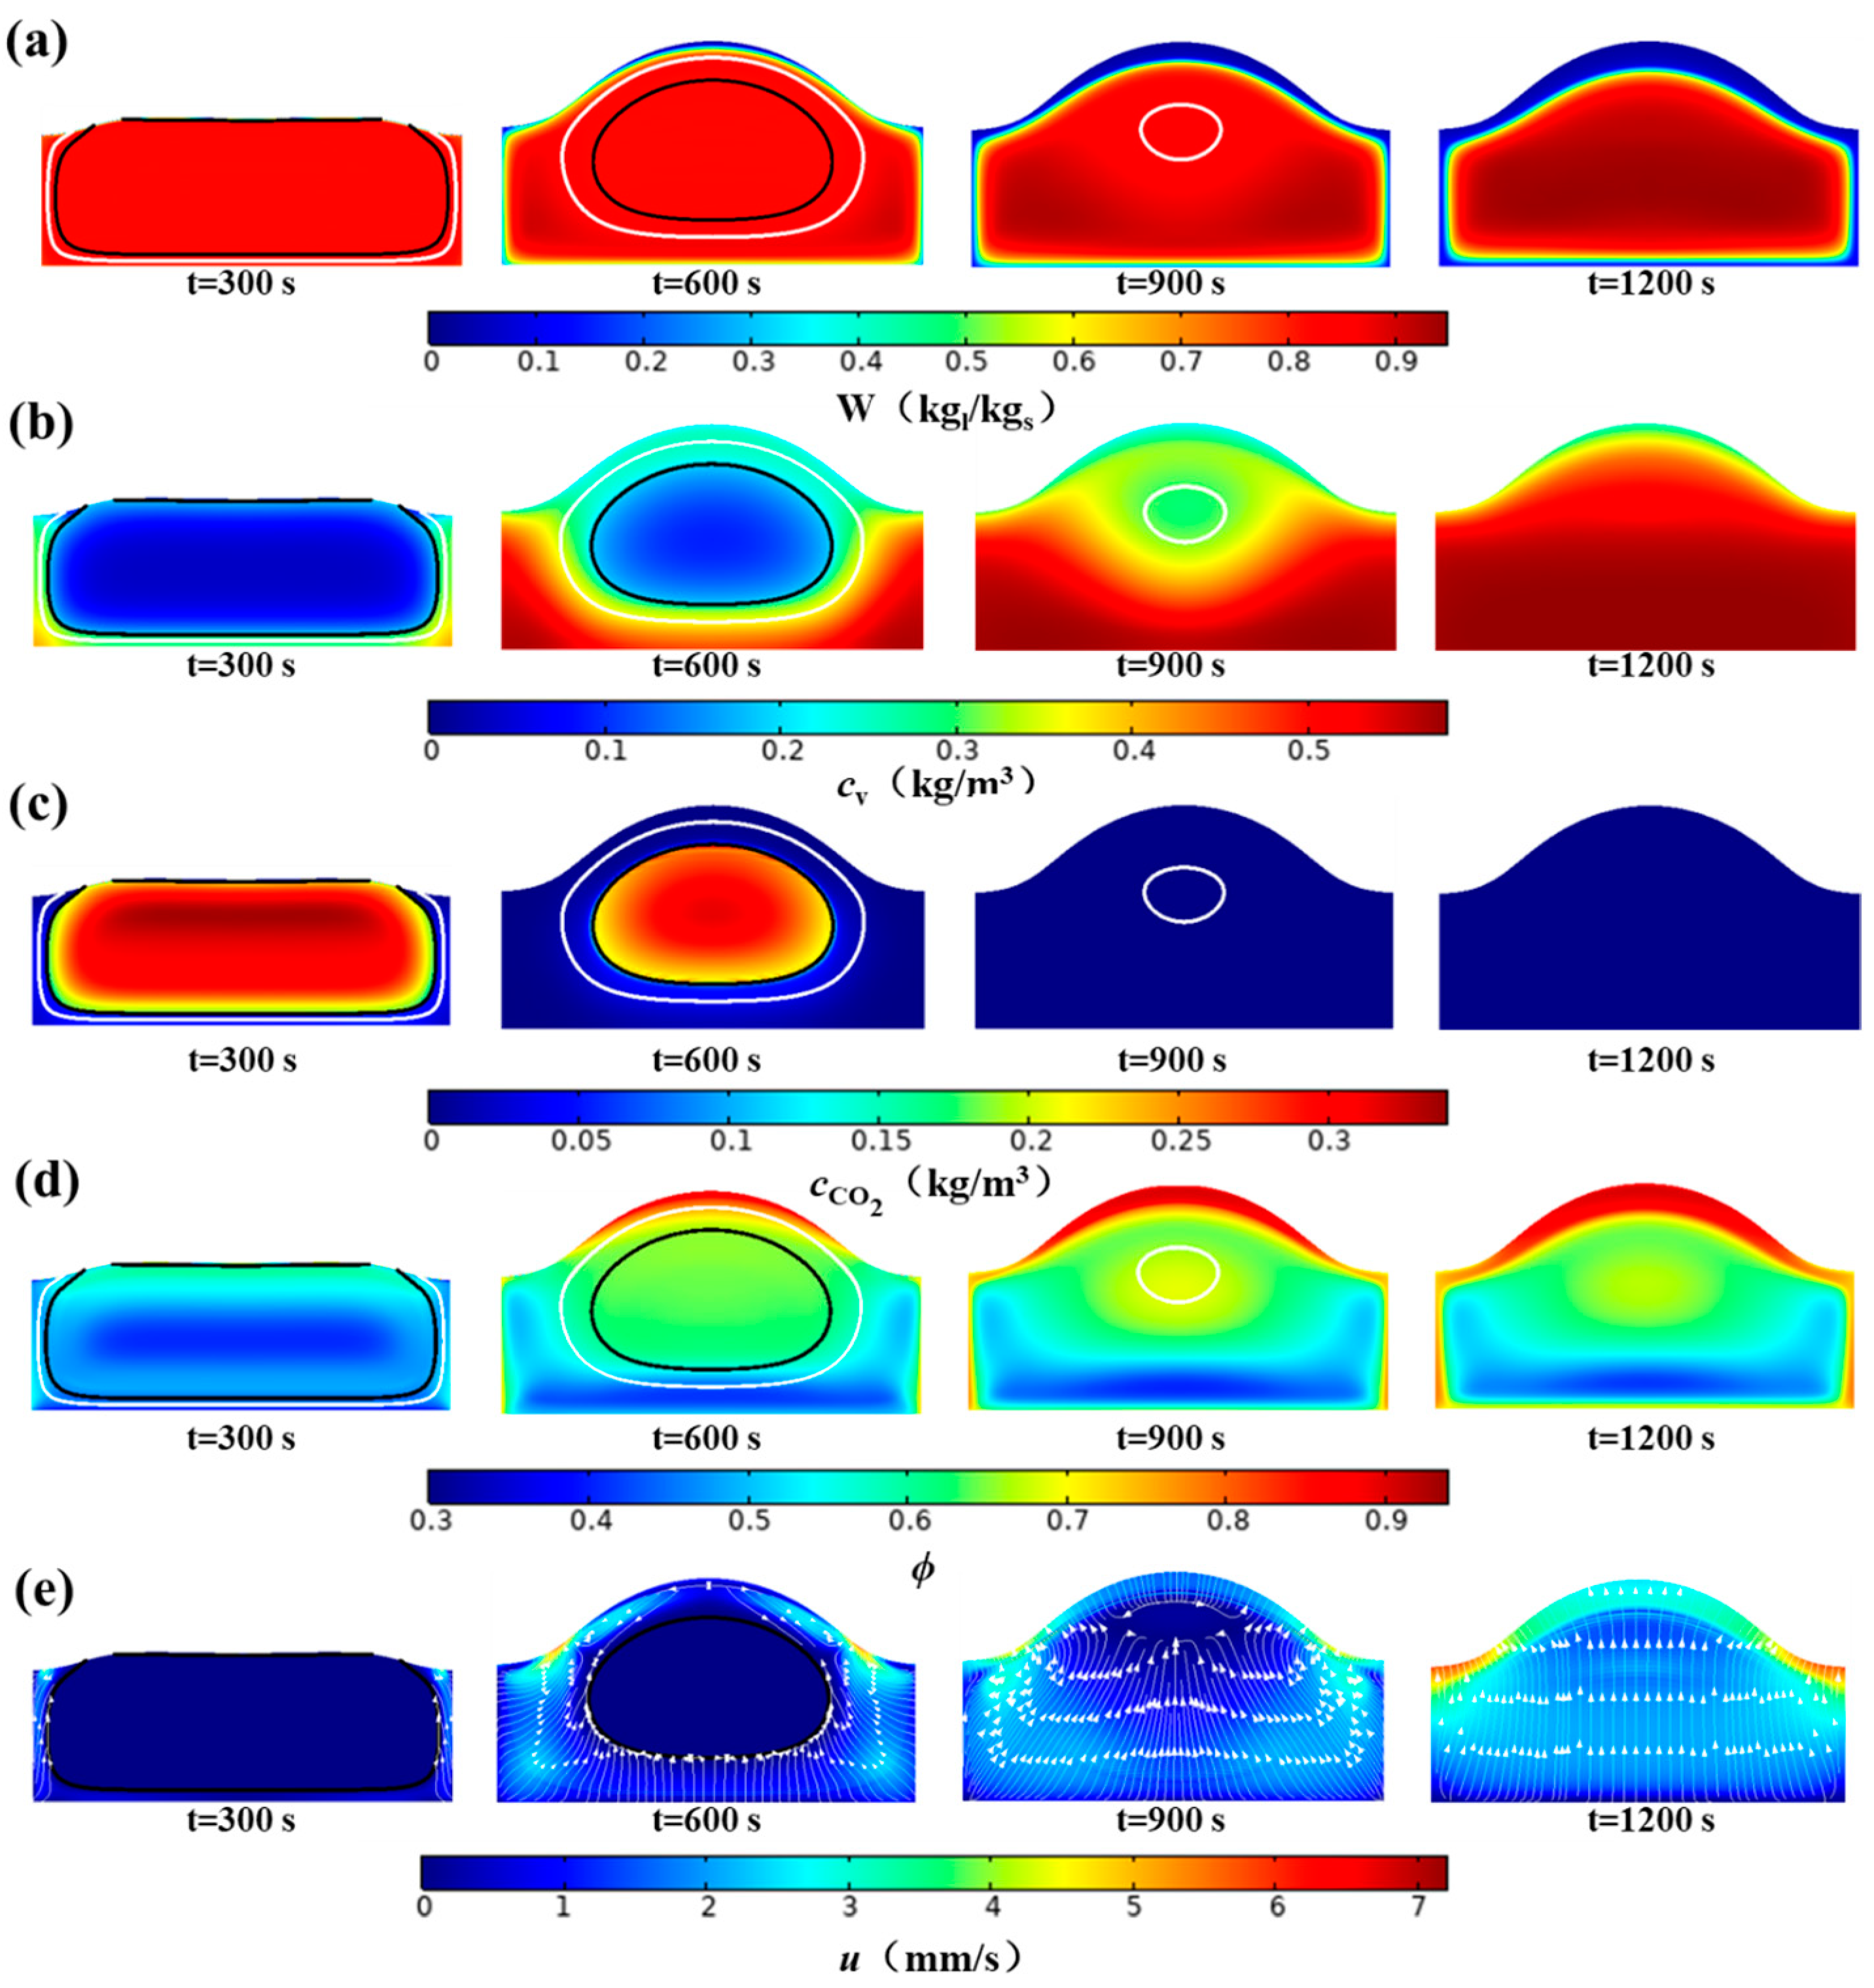
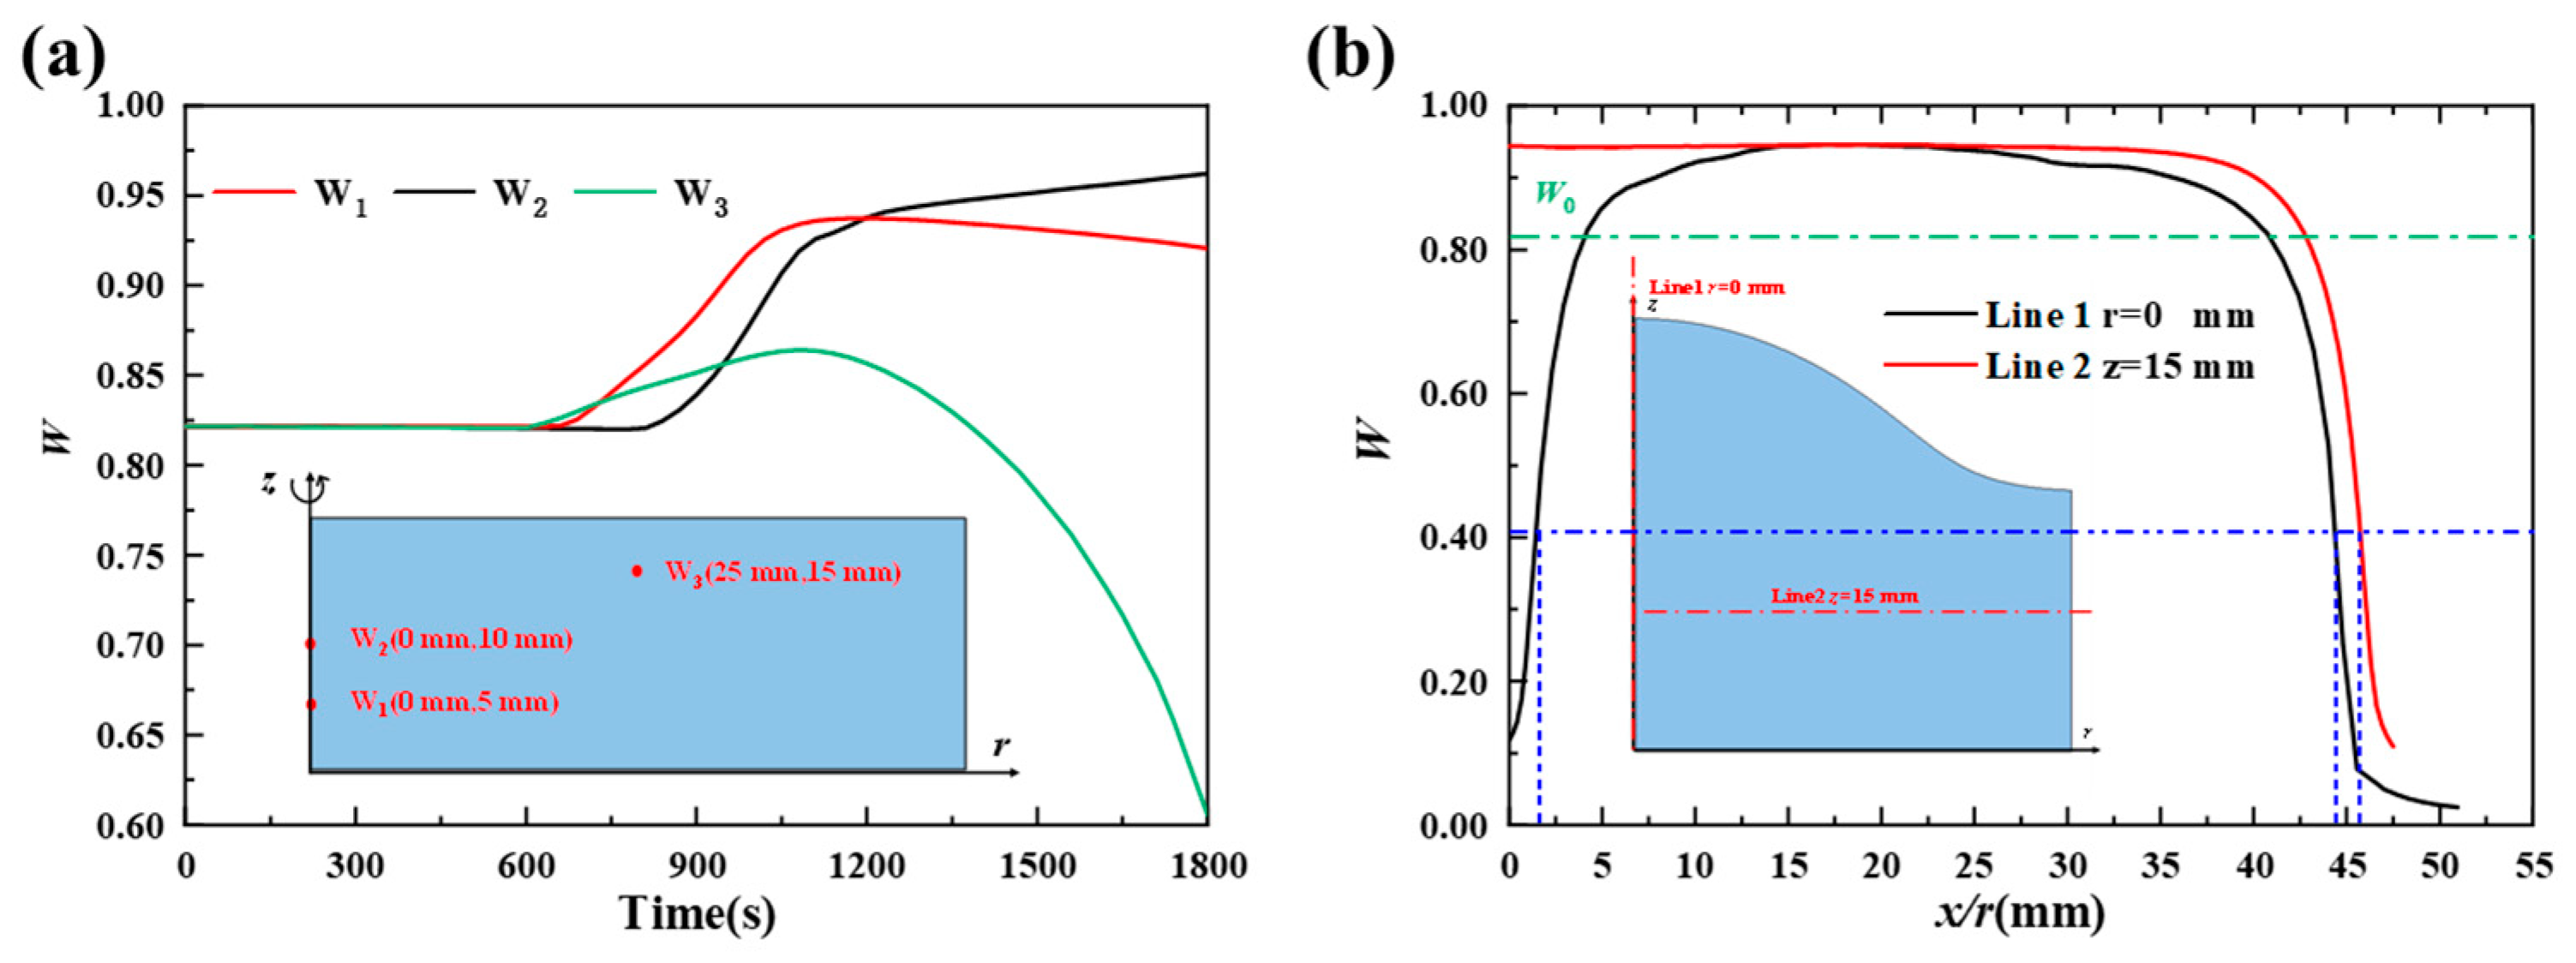
4.3. Effect of the MPC on Mass Transfer
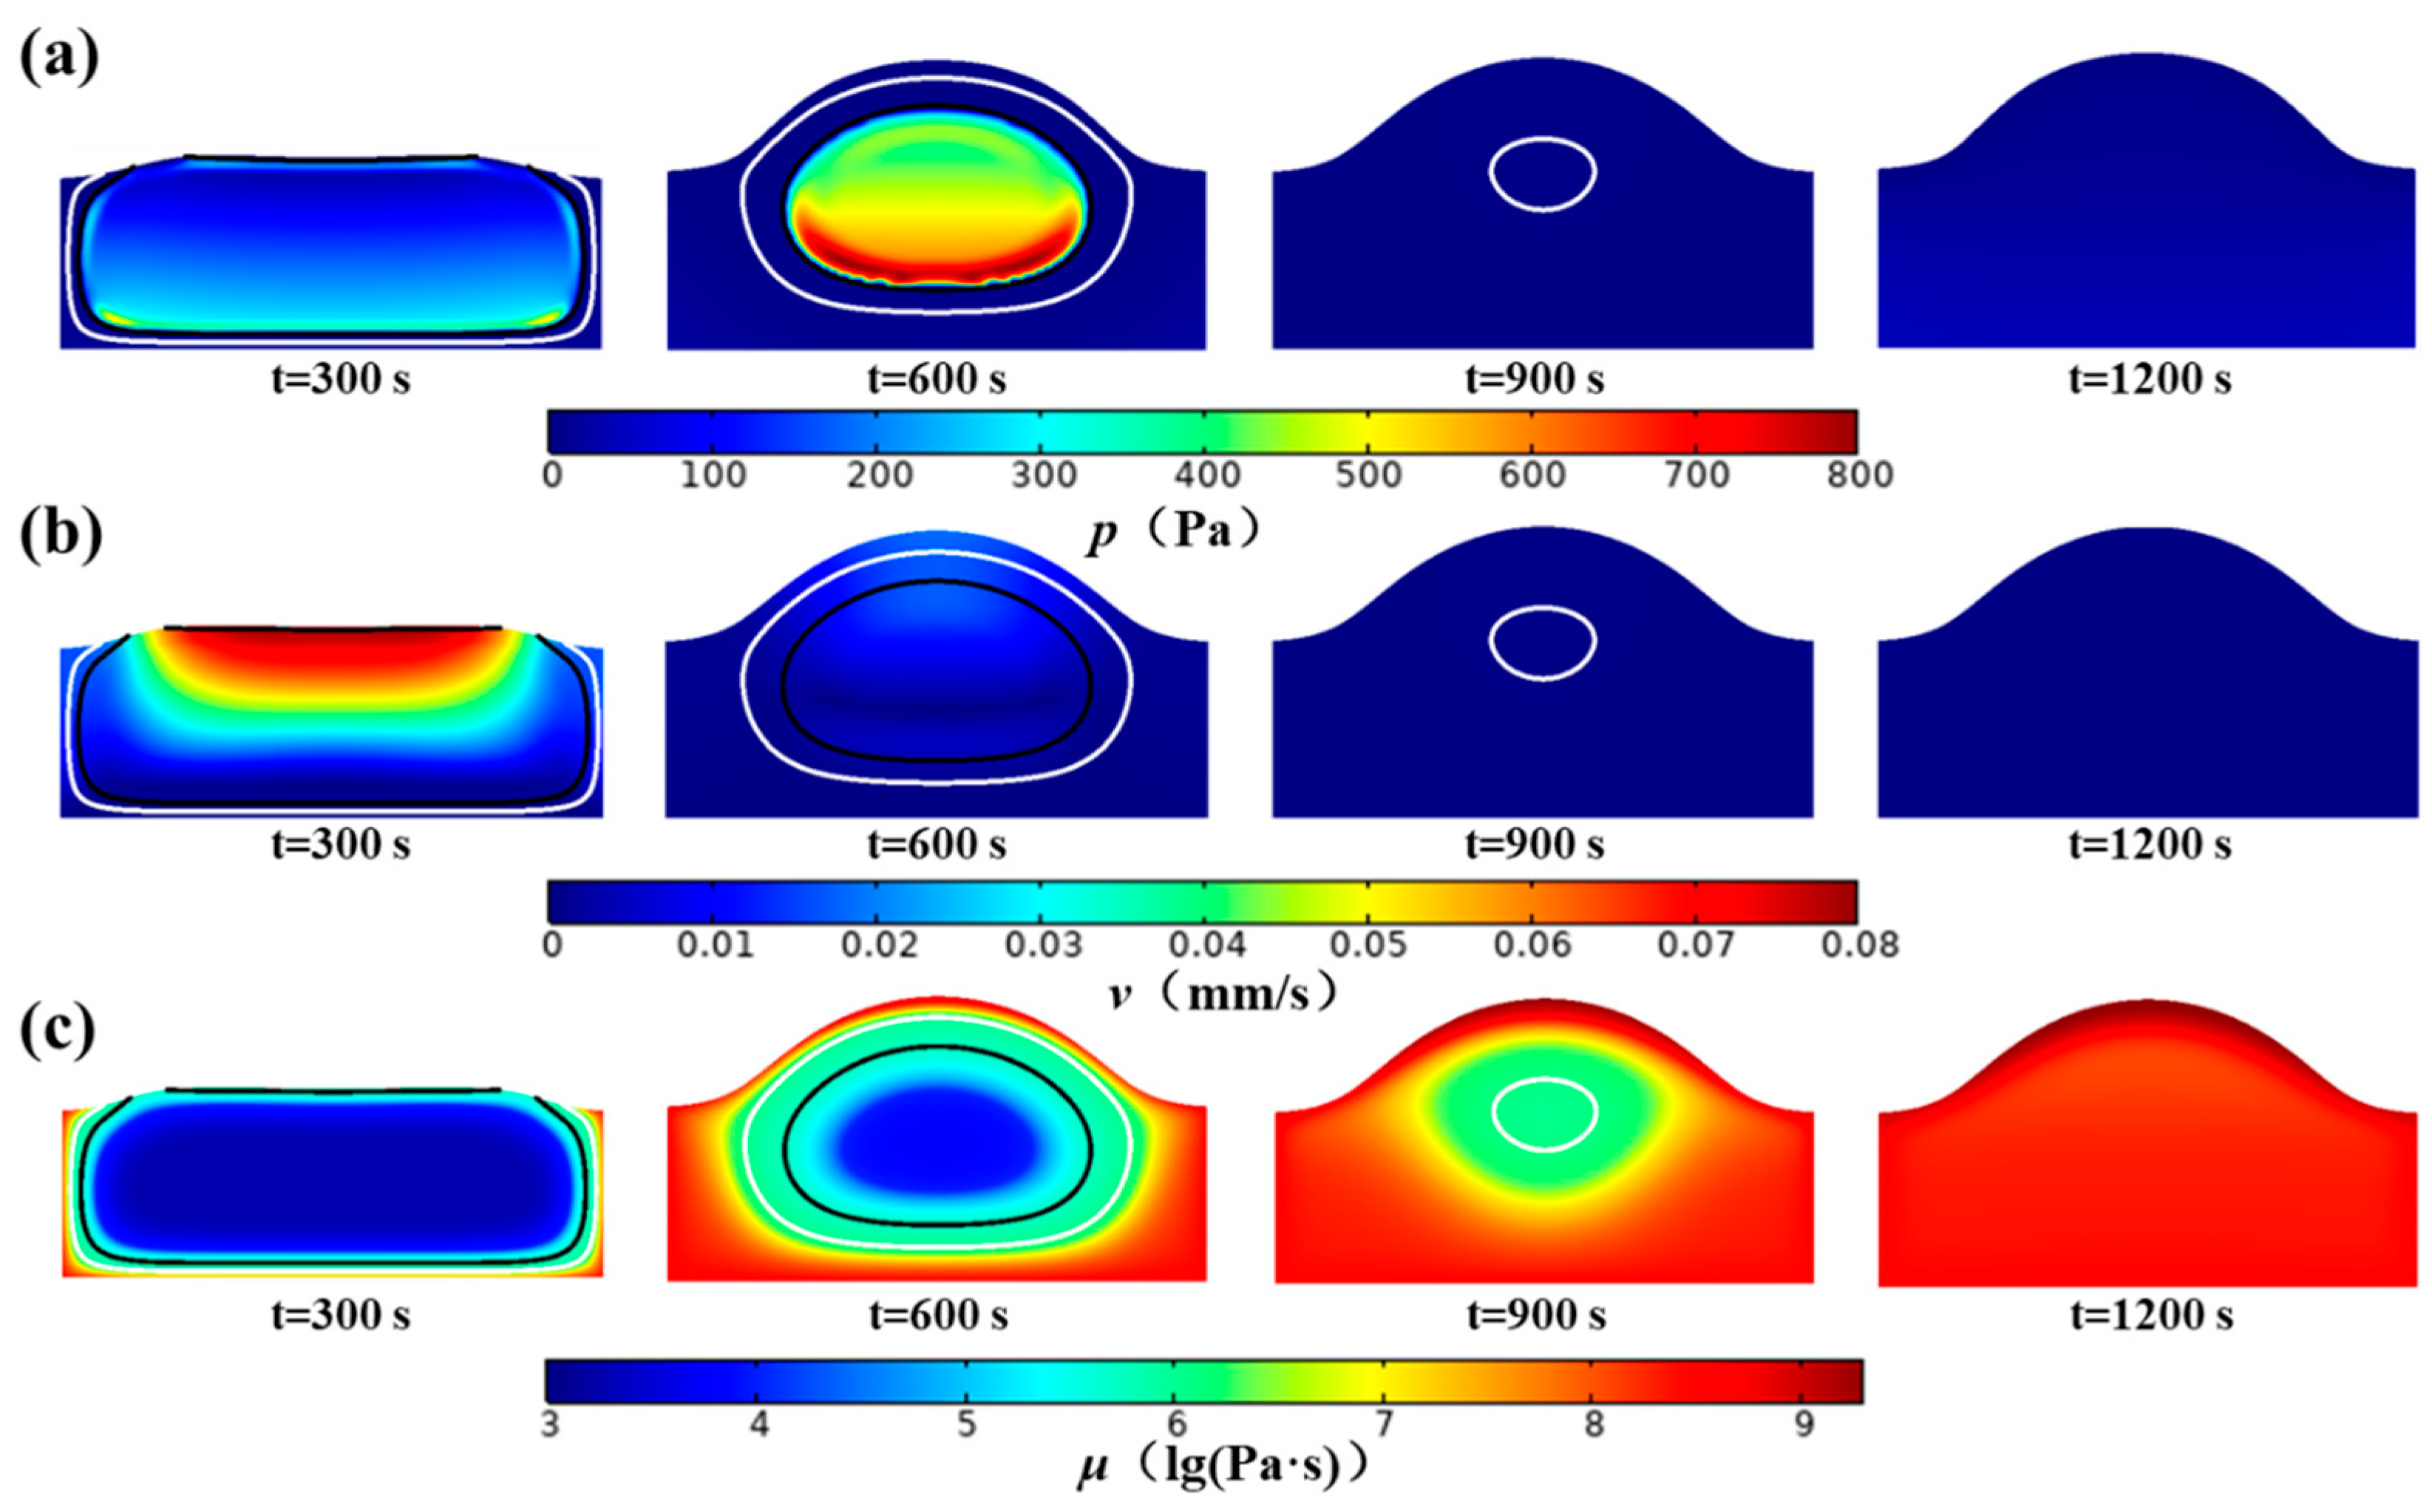
4.4. Effects of MPC on Deformation
5. Conclusions
Author Contributions
Funding
Institutional Review Board Statement
Informed Consent Statement
Data Availability Statement
Conflicts of Interest
Nomenclature
| D | water (liquid or vapor) or CO2 diffusion coefficient, m2 s−1 |
| W | dry base liquid water content, kg kg−1 |
| M | molar mass |
| P | pressure, Pa |
| T | temperature, K |
| kMPC | moisture phase change rate constant |
| cp | specific heat, J kg−1 K−1 |
| h | mass transfer coefficient, m s−1 |
| hc | convective heat transfer coefficient, W m−2 K−1 |
| Lv | latent heat, J kg−1 |
| C | molar concentration of a species, mol m−3 |
| v | velocity, m s−1 |
| R | universal gas constant, J K−1 mol−1 |
| u | velocity of gas flow |
| g | gravitational acceleration, m s−2 |
| F | body force, N |
| I | unit tensor |
| aw | water activity |
| fv | volumetric fraction |
| Greek symbols | |
| ρ | density, kg m−3 |
| Phase apparent density, kg m−3 | |
| porosity | |
| ε | emissivity |
| κ | intrinsic/relative permeability, m−2 |
| σ | stress |
| τ | strain rate tensor |
| λ | thermal conductivity, W m−1 K−1 |
| α | pore opening function |
| β | crust function |
| μ | viscosity function |
| Subscripts/Superscript | |
| 0 | initial |
| l | liquid water |
| s | solid |
| g | gas |
| eff | effective |
| v | water vapor |
| sat | saturation |
| ref | reference |
| eva | evaporation |
| con | condensation |
| diff | diffusion |
References
- Harold, M. On Food and Cooking: The Science and Lore of the Kitchen; Scribner: New York, NY, USA, 2003. [Google Scholar]
- Silva, T.H.L.; Monteiro, R.L.; Salvador, A.A.; Laurindo, J.B.; Carciofi, B.A.M. Kinetics of bread physical properties in baking depending on actual finely controlled temperature. Food Control 2022, 137, 108898. [Google Scholar] [CrossRef]
- Ghaitaranpour, A.; Koocheki, A.; Mohebbi, M. Simulation of bread baking with a conceptual agent-based model: An approach to study the effect of proofing time on baking behavior. J. Food Eng. 2024, 368, 111920. [Google Scholar] [CrossRef]
- Grenier, D.; Rondeau-Mouro, C.; Dedey, K.B.; Morel, M.-H.; Lucas, T. Gas cell opening in bread dough during baking. Trends Food Sci. Technol. 2021, 109, 482–498. [Google Scholar] [CrossRef]
- Feng, W.; Ma, S.; Wang, X. Quality deterioration and improvement of wheat gluten protein in frozen dough. Grain Oil Sci. Technol. 2020, 3, 33–41. [Google Scholar] [CrossRef]
- Castanha, N.; Challois, S.; Grenier, D.; Le-Bail, P.; Dubreil, L.; Lucas, T. Multiphoton microscopy is a nondestructive label-free approach to investigate the 3D structure of gas cell walls in bread dough. Sci. Rep. 2024, 13, 13971. [Google Scholar] [CrossRef] [PubMed]
- Schopf, M. Water Absorption Capacity Determines the Functionality of Vital Gluten Related to Specific Bread Volume. Foods 2021, 10, 228. [Google Scholar] [CrossRef]
- Zanoni, B.; Pierucci, S.; Peri, C. Study of the bread baking process—II. Mathematical modelling. J. Food Eng. 1994, 23, 321–336. [Google Scholar] [CrossRef]
- Purlis, E.; Cevoli, C.; Fabbri, A. Modelling Volume Change and Deformation in Food Products/Processes: An Overview. Foods 2021, 10, 778. [Google Scholar] [CrossRef]
- Nicolas, V.; Vanin, F.; Doursat, C.; Grenier, D.; Lucas, T.; Flick, D. Modeling bread baking with focus on overall deformation and local porosity evolution. Aiche J. 2016, 62, 3847–3863. [Google Scholar] [CrossRef]
- Fan, J.; Mitchell, J.R.; Blanshard, J.M.V. A model for the oven rise of dough during baking. J. Food Eng. 1999, 41, 69–77. [Google Scholar] [CrossRef]
- Zhang, J.; Datta, A.K.; Mukherjee, S. Transport Processes and Large Deformation During Baking of Bread. Aiche J. 2005, 51, 2569–2580. [Google Scholar] [CrossRef]
- Singh, A.P.; Bhattacharya, M. Development of dynamic modulus and cell opening of dough during baking. J. Texture Stud. 2005, 36, 44–67. [Google Scholar] [CrossRef]
- Zhang, L.; Putranto, A.; Zhou, W.; Boom, R.M.; Schutyser, M.A.I.; Chen, X.D. Miniature bread baking as a timesaving research approach and mathematical modeling of browning kinetics. Food Bioprod. Process. 2016, 100, 401–411. [Google Scholar] [CrossRef]
- Ahrné, L.M.; Andersson, C.-G.; Floberg, P.; Rosén, J.M.; Lingnert, H. Effect of crust temperature and water content on acrylamide formation during baking of white bread: Steam and falling temperature baking. LWT Food Sci. Technol. 2007, 40, 1708–1715. [Google Scholar] [CrossRef]
- Purlis, E.; Salvadori, V.O. Bread baking as a moving boundary problem. Part 2: Model validation and numerical simulation. J. Food Eng. 2009, 91, 434–442. [Google Scholar] [CrossRef]
- De Vries, U.; Sluimer, P.; Bloksma, A.H. A quantitative model for heat transport in dough and crumb during baking, In Cereal Science and Technology in Sweden. Proc. Int. Symp. 1989, 174–188. [Google Scholar]
- Wagner, M.J.; Lucas, T.; Le Ray, D.; Trystram, G. Water transport in bread during baking. J. Food Eng. 2007, 78, 1167–1173. [Google Scholar] [CrossRef]
- Nicolas, V.; Salagnac, P.; Glouannec, P.; Ploteau, J.P.; Jury, V.; Boillereaux, L. Modelling heat and mass transfer in deformable porous media: Application to bread baking. J. Food Eng. 2014, 130, 23–35. [Google Scholar] [CrossRef]
- Lucas, T.; Doursat, C.; Grenier, D.; Wagner, M.; Trystram, G. Modeling of bread baking with a new, multi-scale formulation of evaporation–condensation–diffusion and evidence of compression in the outskirts of the crumb. J. Food Eng. 2015, 149, 24–37. [Google Scholar] [CrossRef]
- PPanirani, N.; Darvishi, H.; Hosainpour, A.; Behroozi-Khazaei, N. Comparative study of different bread baking methods: Combined ohmic—Infrared, ohmic—Conventional, infrared—Conventional, infrared, and conventional heating. Innov. Food Sci. Emerg. Technol. 2023, 86, 103349. [Google Scholar] [CrossRef]
- Mansour, Y.; Rouaud, O.; Slim, R.; Rahmé, P. Thermal characterization of a high-temperature industrial bread-baking oven: A comprehensive experimental and numerical study. Appl. Therm. Eng. 2024, 236, 121467. [Google Scholar] [CrossRef]
- Jiménez, F.E.G.; Luna, H.E.R.; Avalos, S.R.; del Ángel Zumaya, J.A.; Vera, G.V.; Tapia, A.A.M.; Gerónimo, R.I.G.; Lovillo, A.P. Development of low-glycemic white bread using Oxalis tuberosa dietary fiber as a functional ingredient for nutraceutical benefits. Appl. Food Res. 2025, 5, 100649. [Google Scholar] [CrossRef]
- Dong, C.; LHuang Xiong, C.; Li, M.; Tang, J. Evaluation of quality of Baguette Bread Using Image Analysis Technique. J. Food Compos. Anal. 2025, 140, 107222. [Google Scholar] [CrossRef]
- Bou-Orm, R.; Jury, V.; Boillereaux, L.; Le-Bail, A. Microwave Baking of Bread: A Review on the Impact of Formulation and Process on Bread Quality. Food Rev. Int. 2021, 39, 1203–1225. [Google Scholar] [CrossRef]
- Purlis, E.; Salvadori, V.O. Bread baking as a moving boundary problem. Part 1: Mathematical modelling. J. Food Eng. 2009, 91, 428–433. [Google Scholar] [CrossRef]
- ISO-712; Cereals and Cereal Products in: Determination of Moisture Content. International Organization for Standardization: Geneva, Switzerland, 2009.
- Liu, Y.; Yu, J.; Copeland, L.; Wang, S.; Wang, S. Gelatinization behavior of starch: Reflecting beyond the endotherm measured by differential scanning calorimetry. Food Chem. 2019, 284, 53–59. [Google Scholar] [CrossRef]
- Wang, S.; Zhang, X.; Wang, S.; Copeland, L. Changes of multi-scale structure during mimicked DSC heating reveal the nature of starch gelatinization. Sci. Rep. 2016, 6, 28271. [Google Scholar] [CrossRef]
- Yang, W.; Long, L.; Zhang, L.; Xu, K.; Huang, Z.; Ye, H. Heat and mass transfer and deformation during chiffon cake baking. J. Food Eng. 2025, 388, 112361. [Google Scholar] [CrossRef]
- Incropera, F.P.; Dewitt, D.P. Fundamentals of Heat and Mass Transfer; Wiley: Hoboken, NY, USA, 2011. [Google Scholar]
- Halder, A.; Dhall, A.; Datta, A.K. An Improved, Easily Implementable, Porous Media Based Model for Deep-Fat Frying: Part I: Model Development and Input Parameters. Food Bioprod. Process. 2007, 85, 209–219. [Google Scholar] [CrossRef]
- Zhang, J. Multiphase Heat and Mass Transfer with Large Deformation in Porous Media. Ph.D. Thesis, Cornell University, Ithaca, NY, USA, 2003. [Google Scholar]
- Lind, I.; Rask, C. Sorption isotherms of mixed minced meat, dough, and bread crust. J. Food Eng. 1991, 14, 303–315. [Google Scholar] [CrossRef]
- Nicolas, V.; Glouannec, P.; Ploteau, J.P.; Salagnac, P.; Jury, V. Experiment and multiphysic simulation of dough baking by convection, infrared radiation and direct conduction. Int. J. Therm. Sci. 2017, 115, 65–78. [Google Scholar] [CrossRef]
- Zanoni, M.A.B.; Wang, J.; Torero, J.L.; Gerhard, J.I. Multiphase modelling of water evaporation and condensation in an air-heated porous medium. Appl. Therm. Eng. 2022, 212, 118516. [Google Scholar] [CrossRef]
- Halder, A.; Dhall, A.; Datta, A.K. Modeling Transport in Porous Media with Phase Change: Applications to Food Processing. J. Heat Transf. 2011, 133, 031010. [Google Scholar] [CrossRef]
- Stokes, G.G. On the Theories of the Internal Friction of Fluids in Motion, and of the Equilibrium and Motion of Elastic Solids; Transactions of the Cambridge Philosophical Society; Cambridge University Press: Cambridge, UK, 1845; Volume 287. [Google Scholar]
- Broyart, B.; Flick, D.; Viné, T.; Bernuau, E. Experimental and numerical study of heat and mass transfer during contact heating of sliced potatoes. J. Food Eng. 2020, 275, 109868. [Google Scholar]
- Zanoni, B.; Smaldone, D.; Schiraldi, A. Starch Gelatinization in Chemically Leavened Bread Baking. J. Food Sci. 1991, 56, 1702–1706. [Google Scholar] [CrossRef]
- Thorvaldsson, K. Water diffusion in bread during baking. Lebensm. Wiss. Und Technol. 1998, 31, 658–663. [Google Scholar] [CrossRef]


| Parameter | Value | Source | Parameter | Value | Source |
|---|---|---|---|---|---|
| 1069 kg/m3 | Experiment | 2030 J/kg | [39] | ||
| 0.9 | Experiment | 4180 J/kg | [39] | ||
| Φ | 1000 W/m2 | Experiment | Tc | 100 °C | [9] |
| 28 °C | Experiment | 1500 kg/m3 | [12,19] | ||
| 1000 kg/m3 | [12,19] | 1.8 × 10⁻⁵ Pa·s | [31] | ||
| Ea | 138 kJ/mol | [40] | 8.77 × 10⁻¹¹ | [19] | |
| kg,0 | 2.8 × 10¹⁸ s−1 | [40] | g | 9.8 m/s2 | |
| 2.454 × 10⁶ J/kg | [39] | R | 8.314 J/(mol·K) | ||
| μl | 104 Pa·s | [20] | μs | 4.5 × 10⁶ Pa·s | [20] |
| psat | [35] | ||||
| [35] | |||||
| [35] | |||||
| Lv | [39] | ||||
| [19] | |||||
| Mesh (i) | Maximum Mesh Size (mm) | Number | Time | Maximum Deviation |
|---|---|---|---|---|
| Mesh 1 | 1.25 | 1200 | 26 min | —— |
| Mesh 2 | 0.75 | 1353 | 33 min | 3.0% |
| Mesh 3 | 0.5 | 4738 | 47 min | 4.1% |
| Mesh 4 | 0.3 | 11,122 | 207 min | 0.3% |
Disclaimer/Publisher’s Note: The statements, opinions and data contained in all publications are solely those of the individual author(s) and contributor(s) and not of MDPI and/or the editor(s). MDPI and/or the editor(s) disclaim responsibility for any injury to people or property resulting from any ideas, methods, instructions or products referred to in the content. |
© 2025 by the authors. Licensee MDPI, Basel, Switzerland. This article is an open access article distributed under the terms and conditions of the Creative Commons Attribution (CC BY) license (https://creativecommons.org/licenses/by/4.0/).
Share and Cite
Zhang, L.; Yang, W.; Xu, K.; Long, L.; Ye, H. Study on Moisture Phase Changes in Bread Baking Using a Coupling Model. Foods 2025, 14, 1649. https://doi.org/10.3390/foods14091649
Zhang L, Yang W, Xu K, Long L, Ye H. Study on Moisture Phase Changes in Bread Baking Using a Coupling Model. Foods. 2025; 14(9):1649. https://doi.org/10.3390/foods14091649
Chicago/Turabian StyleZhang, Luo, Wei Yang, Kai Xu, Linshuang Long, and Hong Ye. 2025. "Study on Moisture Phase Changes in Bread Baking Using a Coupling Model" Foods 14, no. 9: 1649. https://doi.org/10.3390/foods14091649
APA StyleZhang, L., Yang, W., Xu, K., Long, L., & Ye, H. (2025). Study on Moisture Phase Changes in Bread Baking Using a Coupling Model. Foods, 14(9), 1649. https://doi.org/10.3390/foods14091649