
Performance Evaluation of a Solar-Assisted Multistage Heat Pump Drying System Based on the Optimal Drying Conditions for Solanum lycopersicum L.

 , , and
Abstract
1. Introduction
2. Materials and Methods
2.1. Materials and Drying Conditions
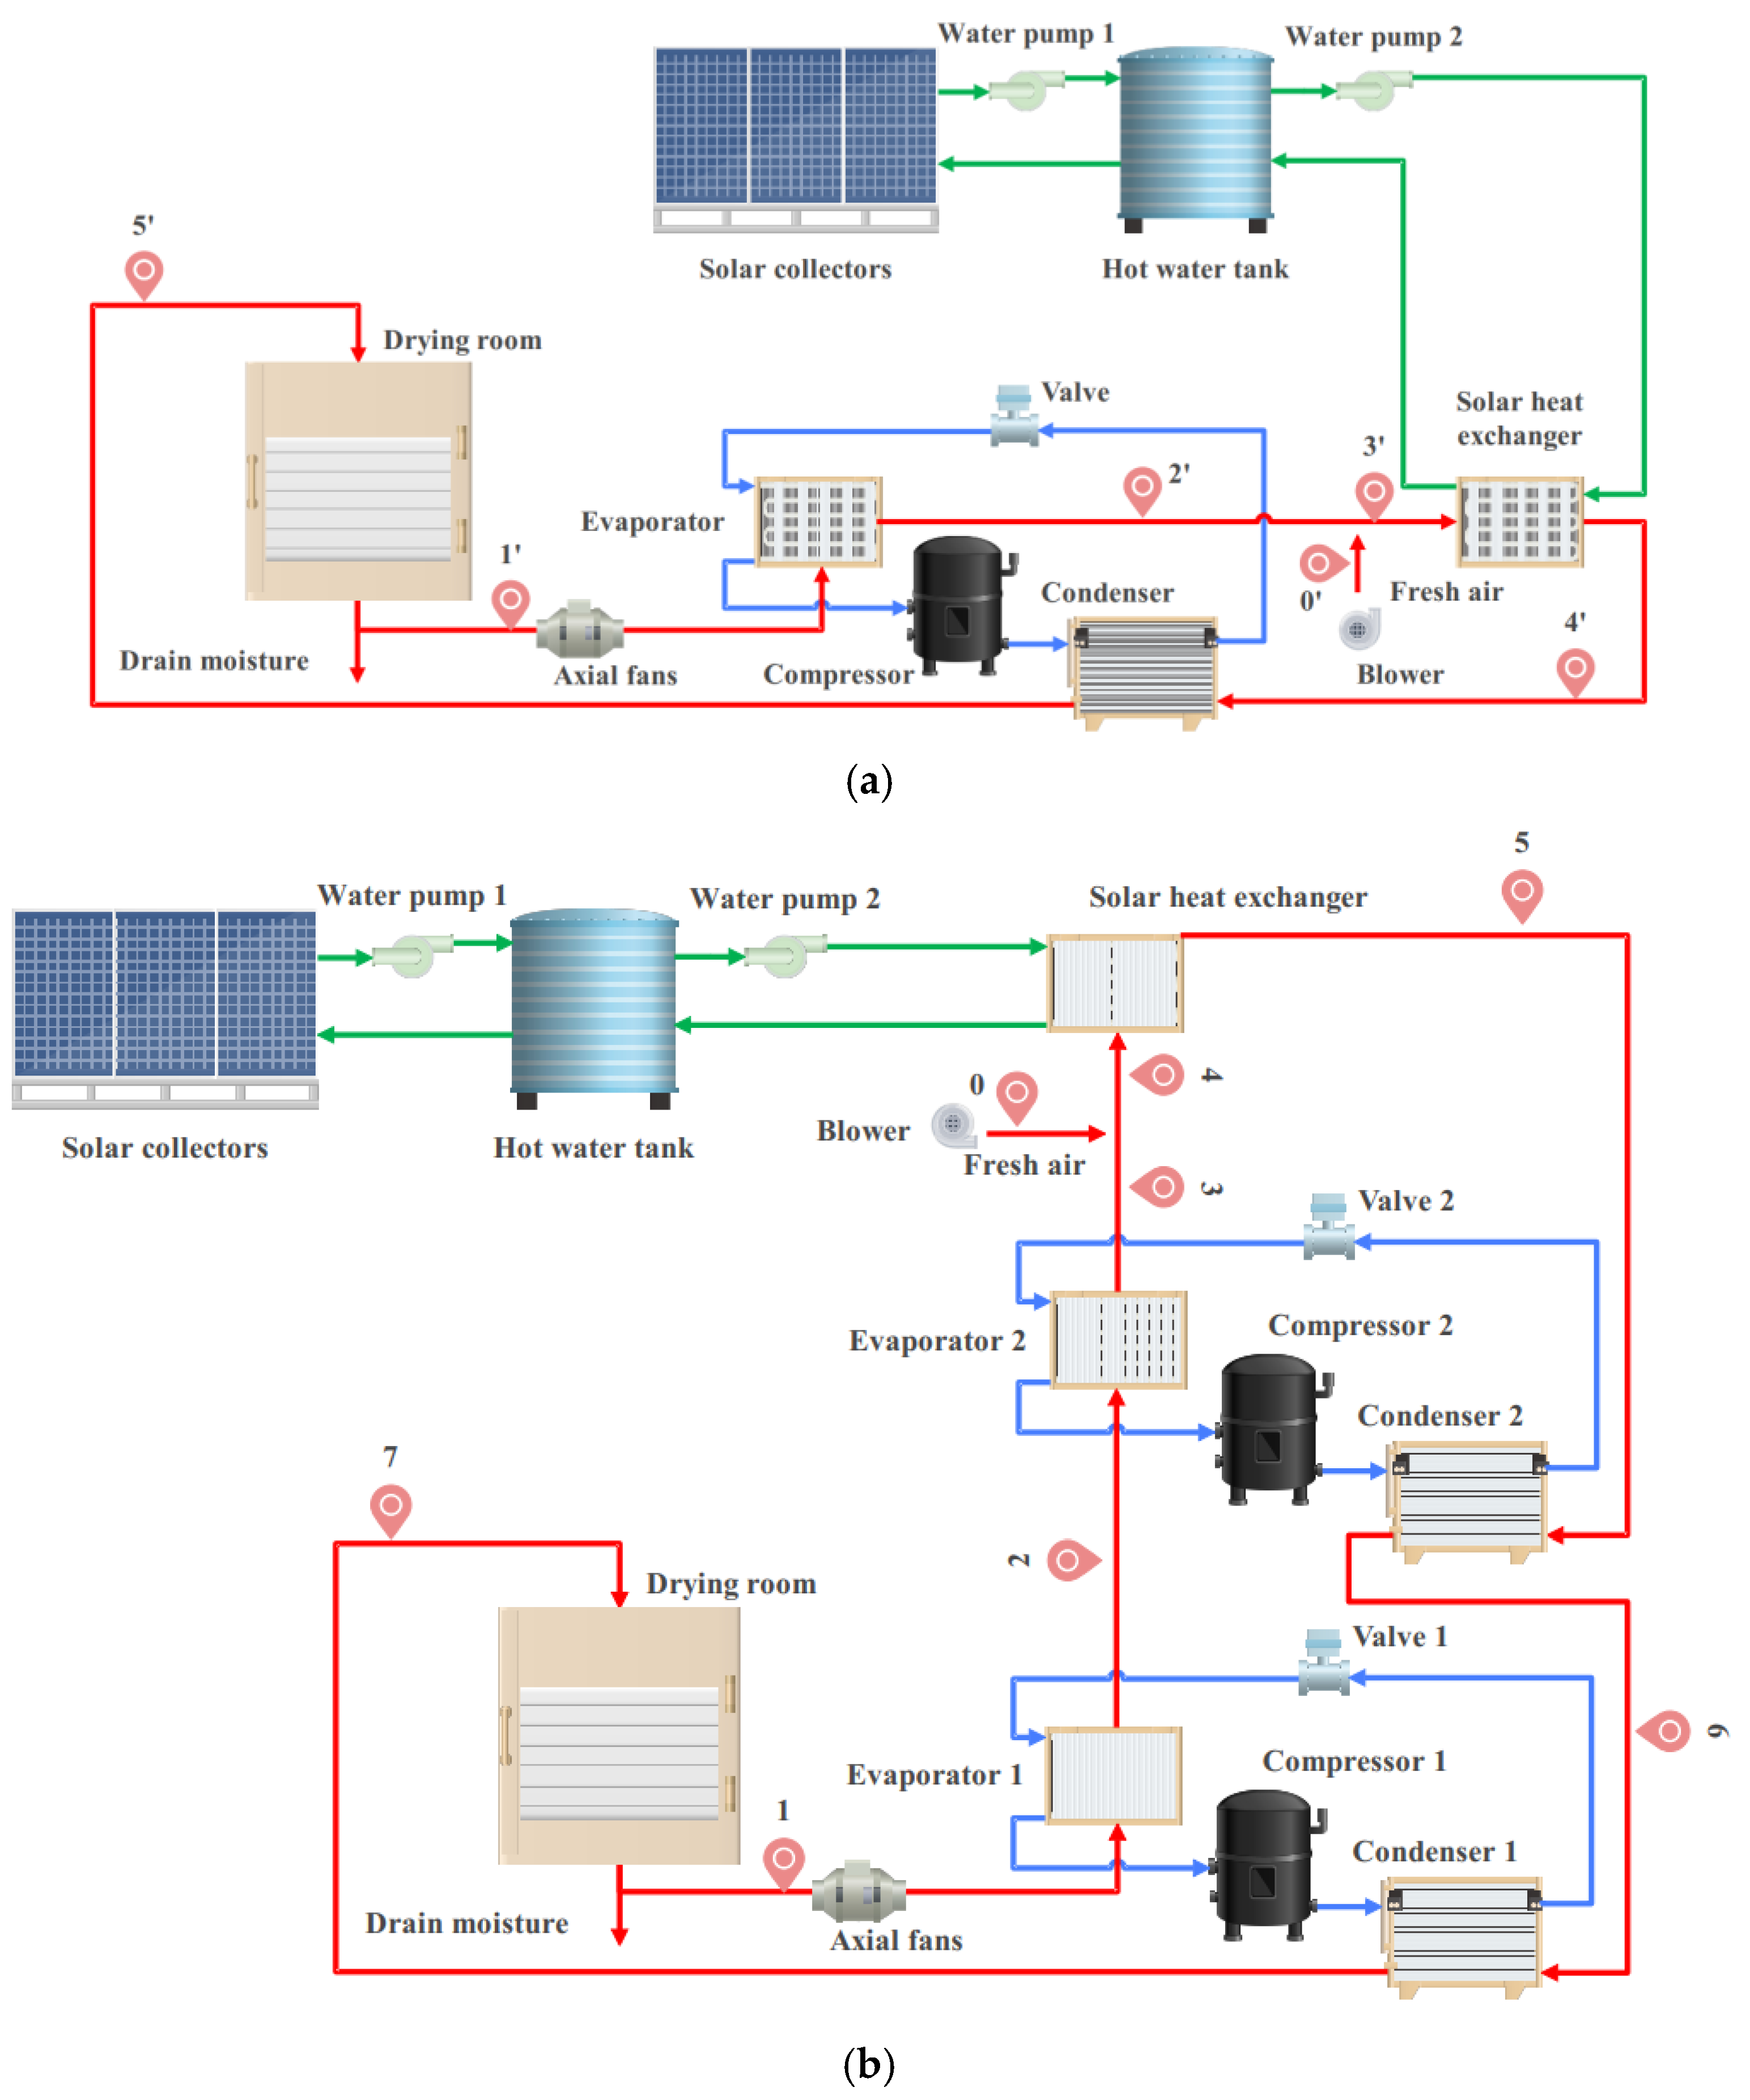
2.2. SAHPD System
2.3. Methods of Quality Analysis
2.3.1. Characterization of the Drying Operation
2.3.2. Color Quality
2.3.3. Phenolic and Flavonoid
2.4. Methods of Performance Analysis
2.4.1. Solar Thermal
2.4.2. Hot Water Storage Tank
2.4.3. Evaluation Indicators of the Overall System
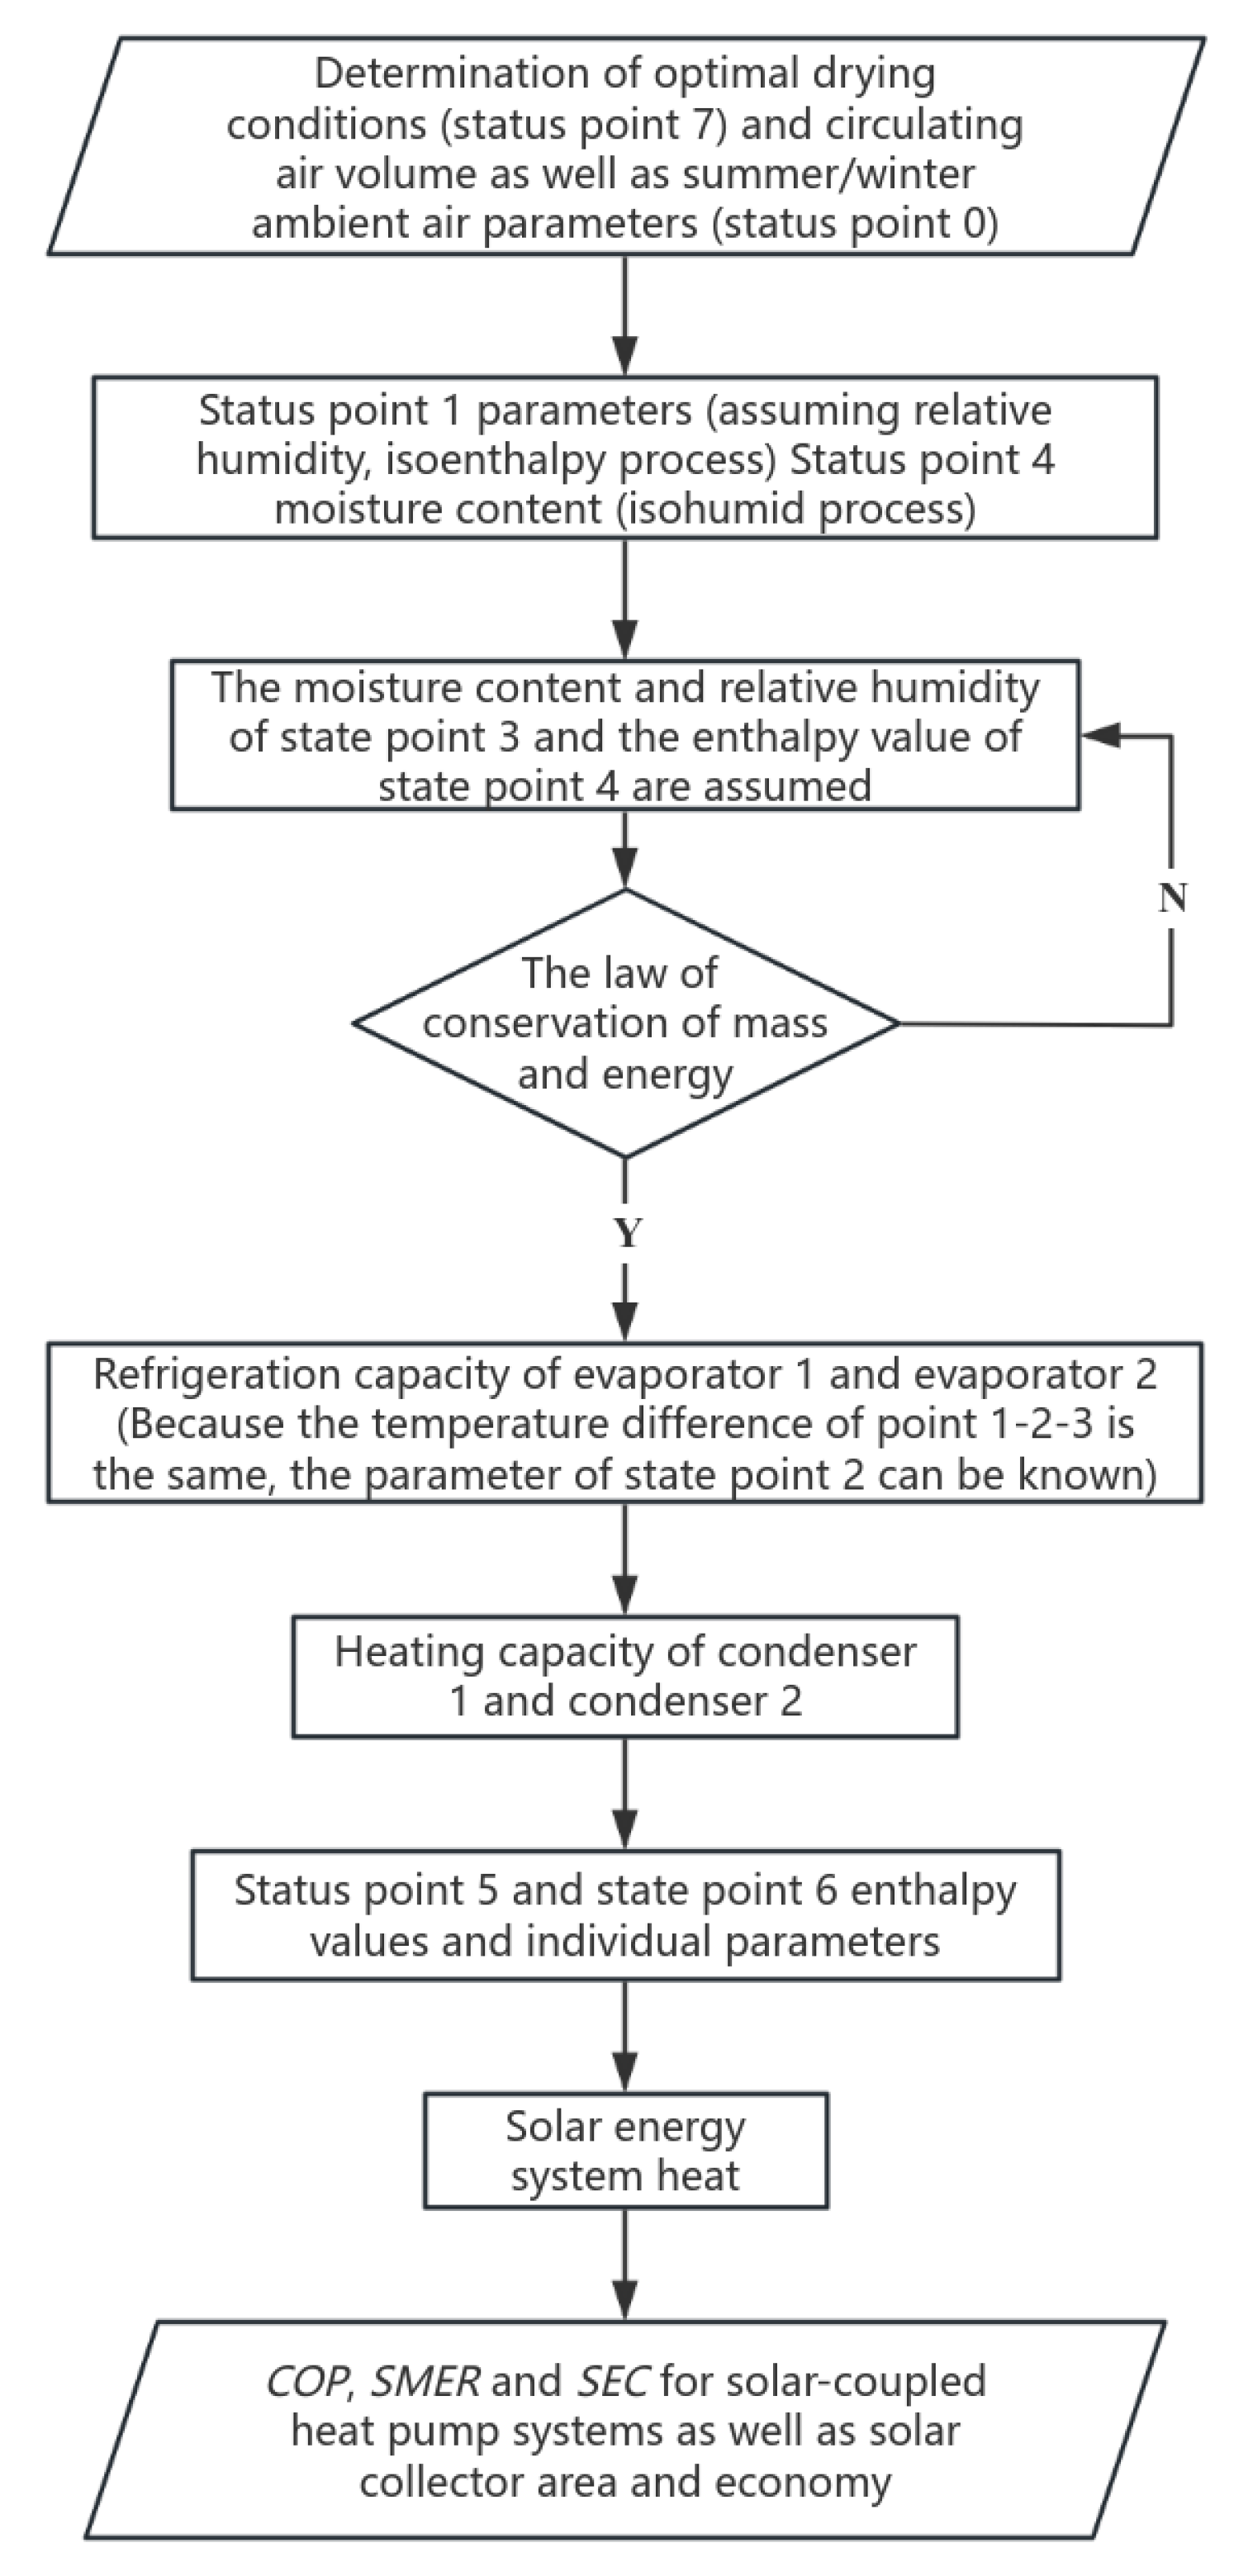
2.4.4. Computational Logic
3. Results and Discussion
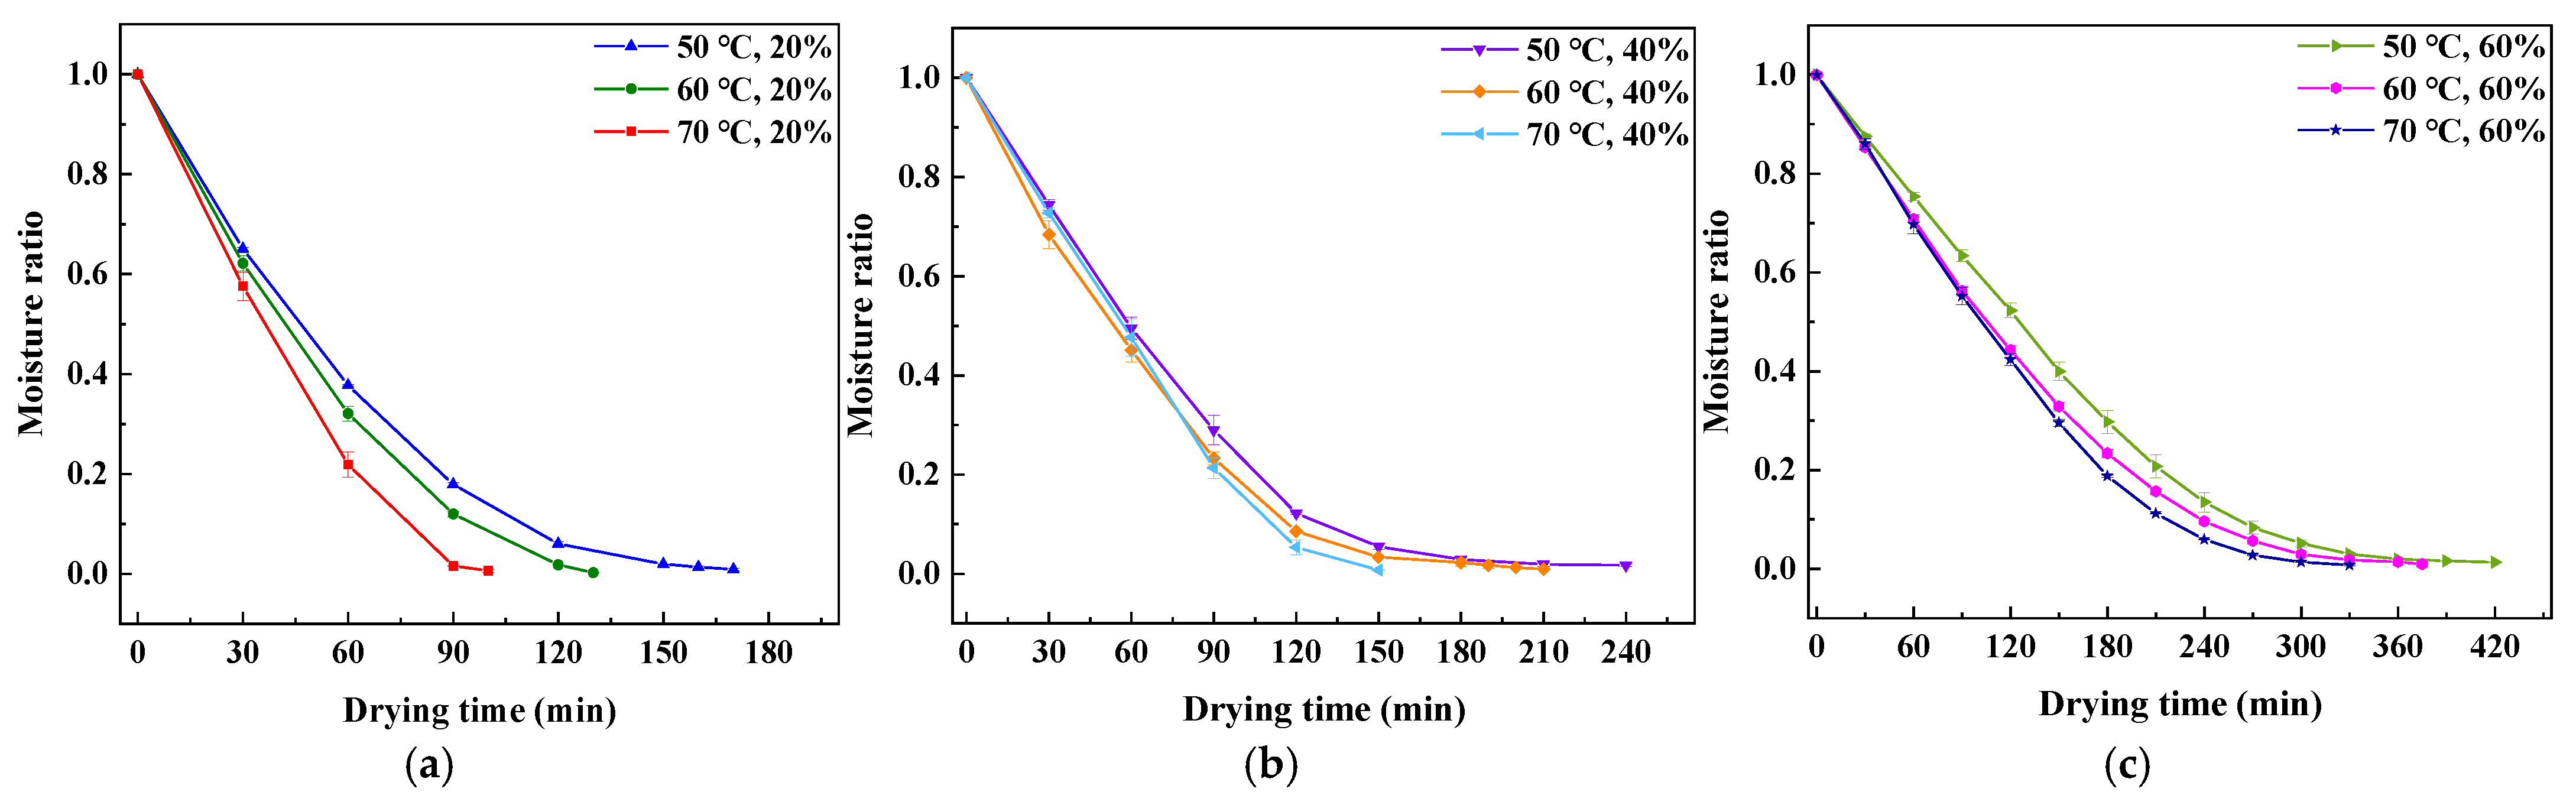
3.1. Analysis of Drying Characteristics
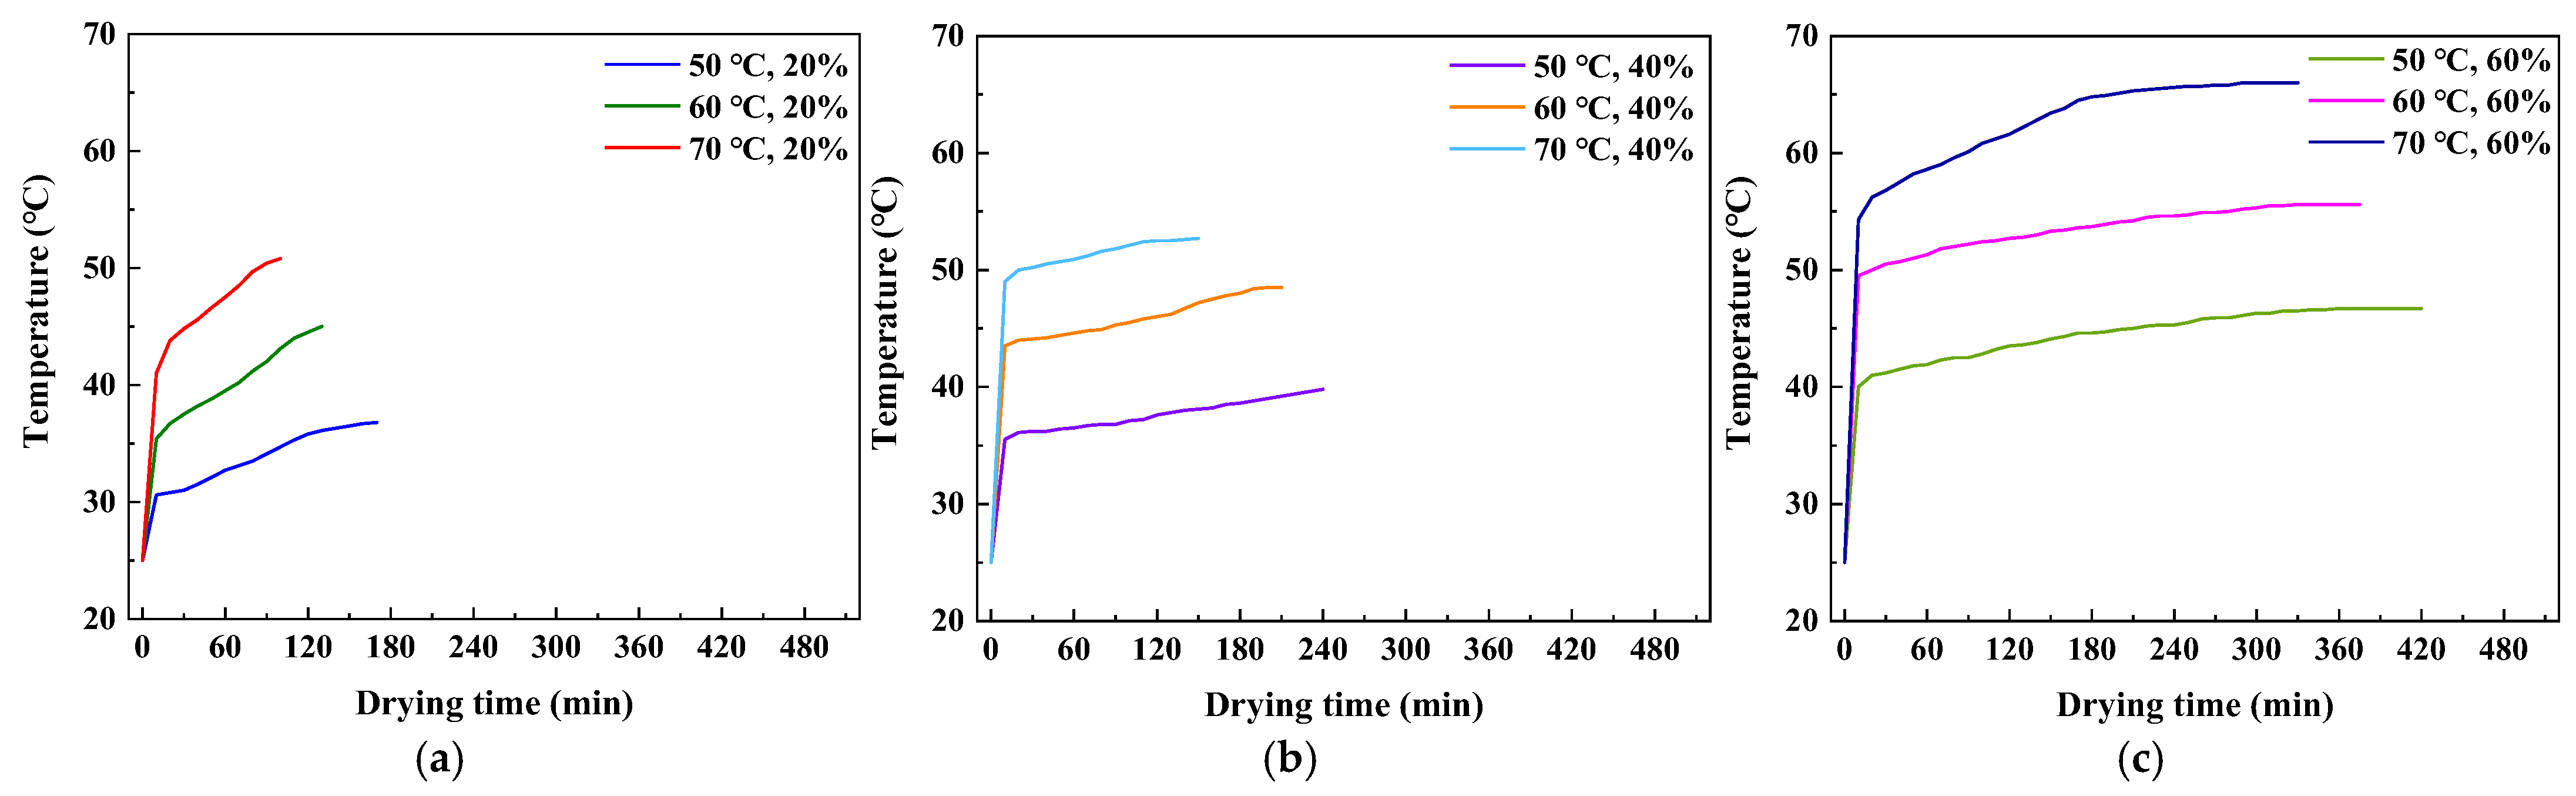
3.2. Analysis of Drying Temperature
3.3. Analysis of Effective Diffusion Coefficient of Moisture
3.4. Analysis of Activation Energy
3.5. Analysis of Product Quality
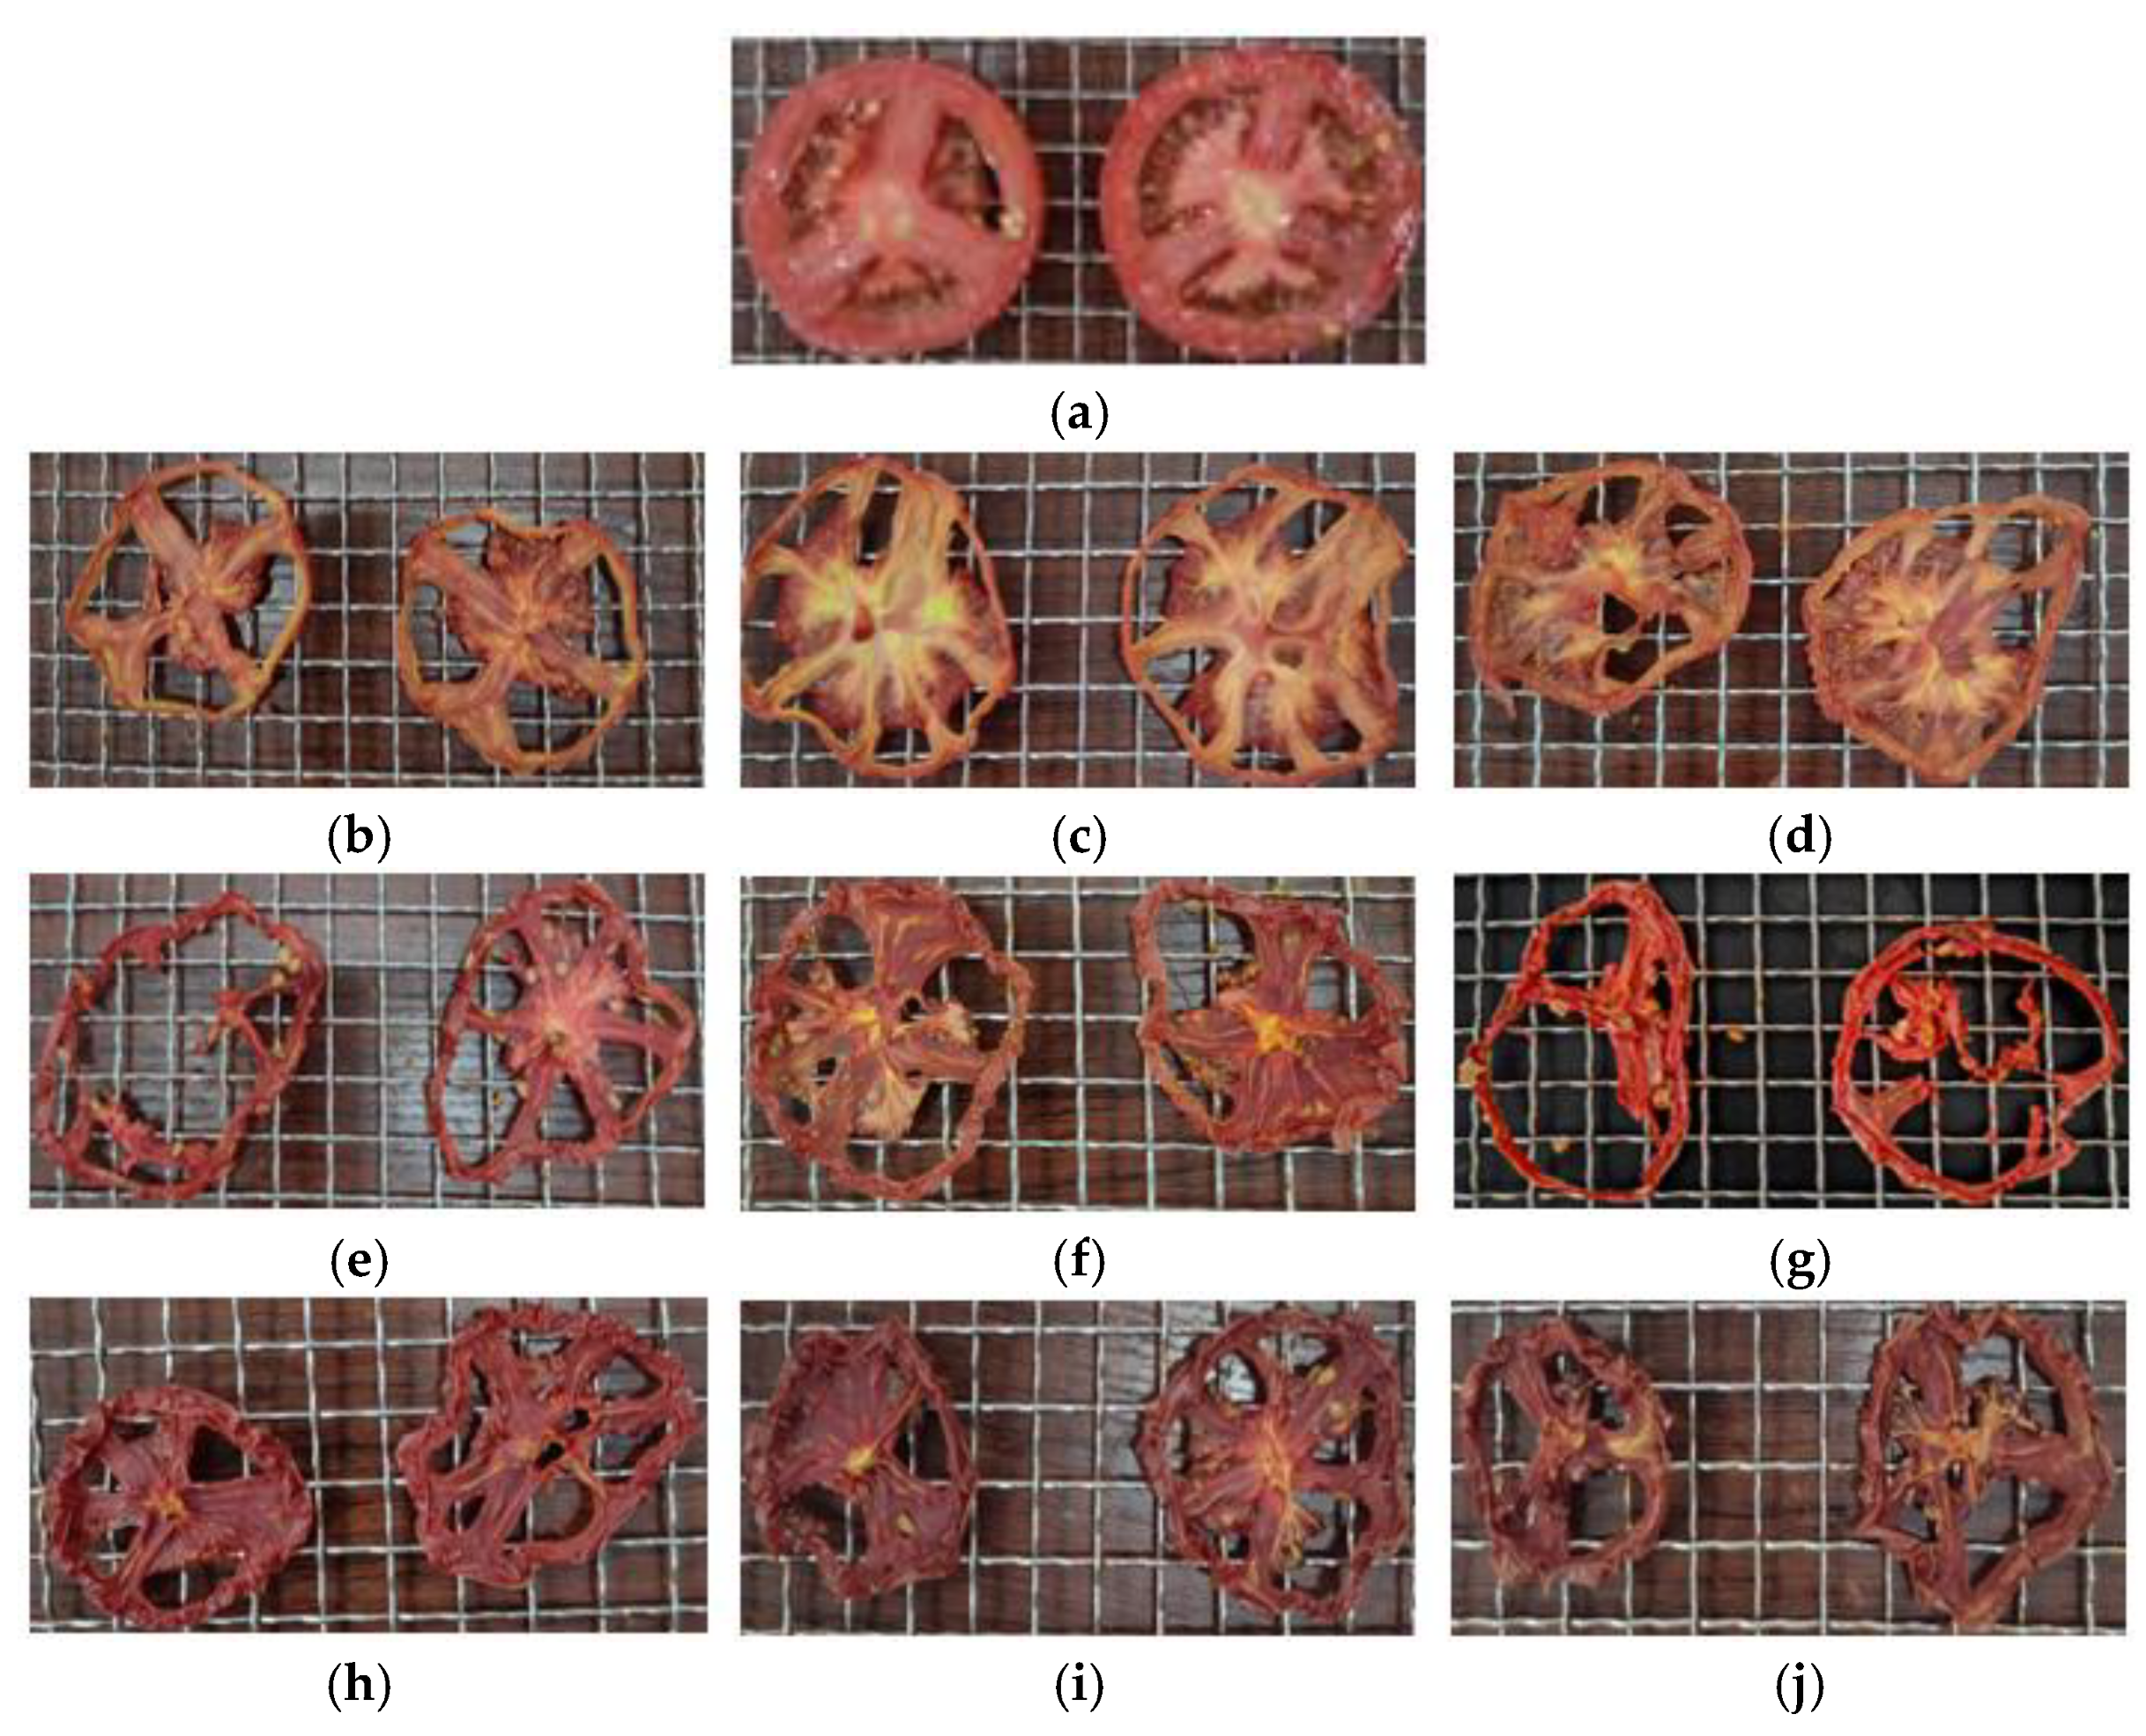
3.5.1. Color
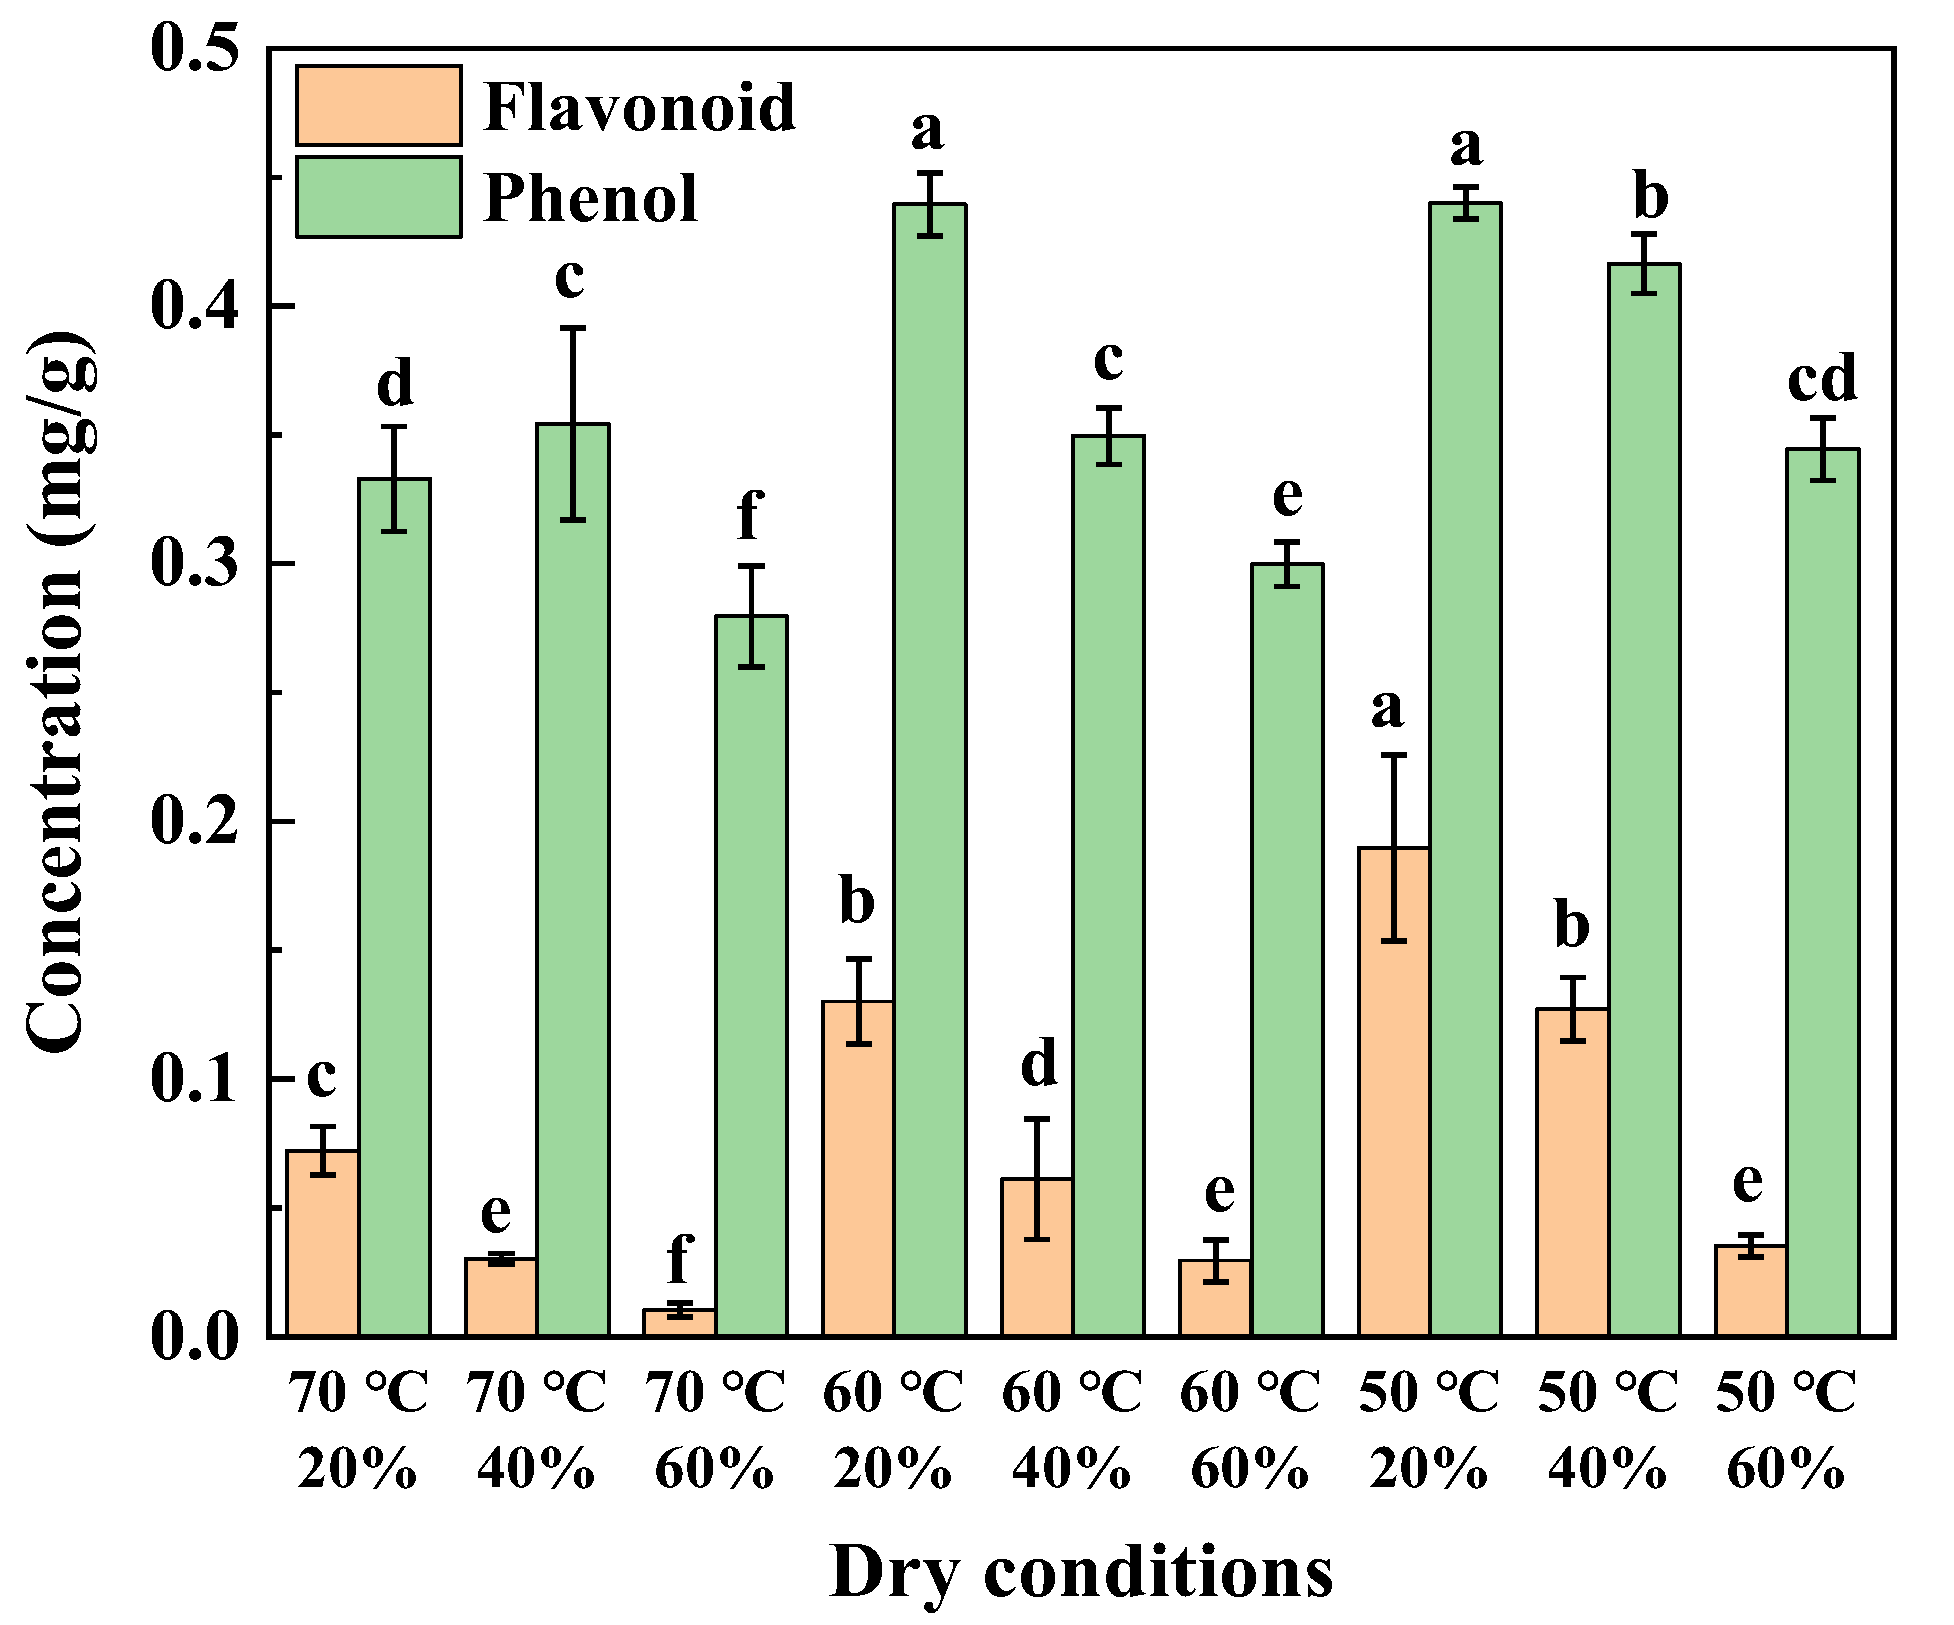
3.5.2. Flavonoid and Phenol
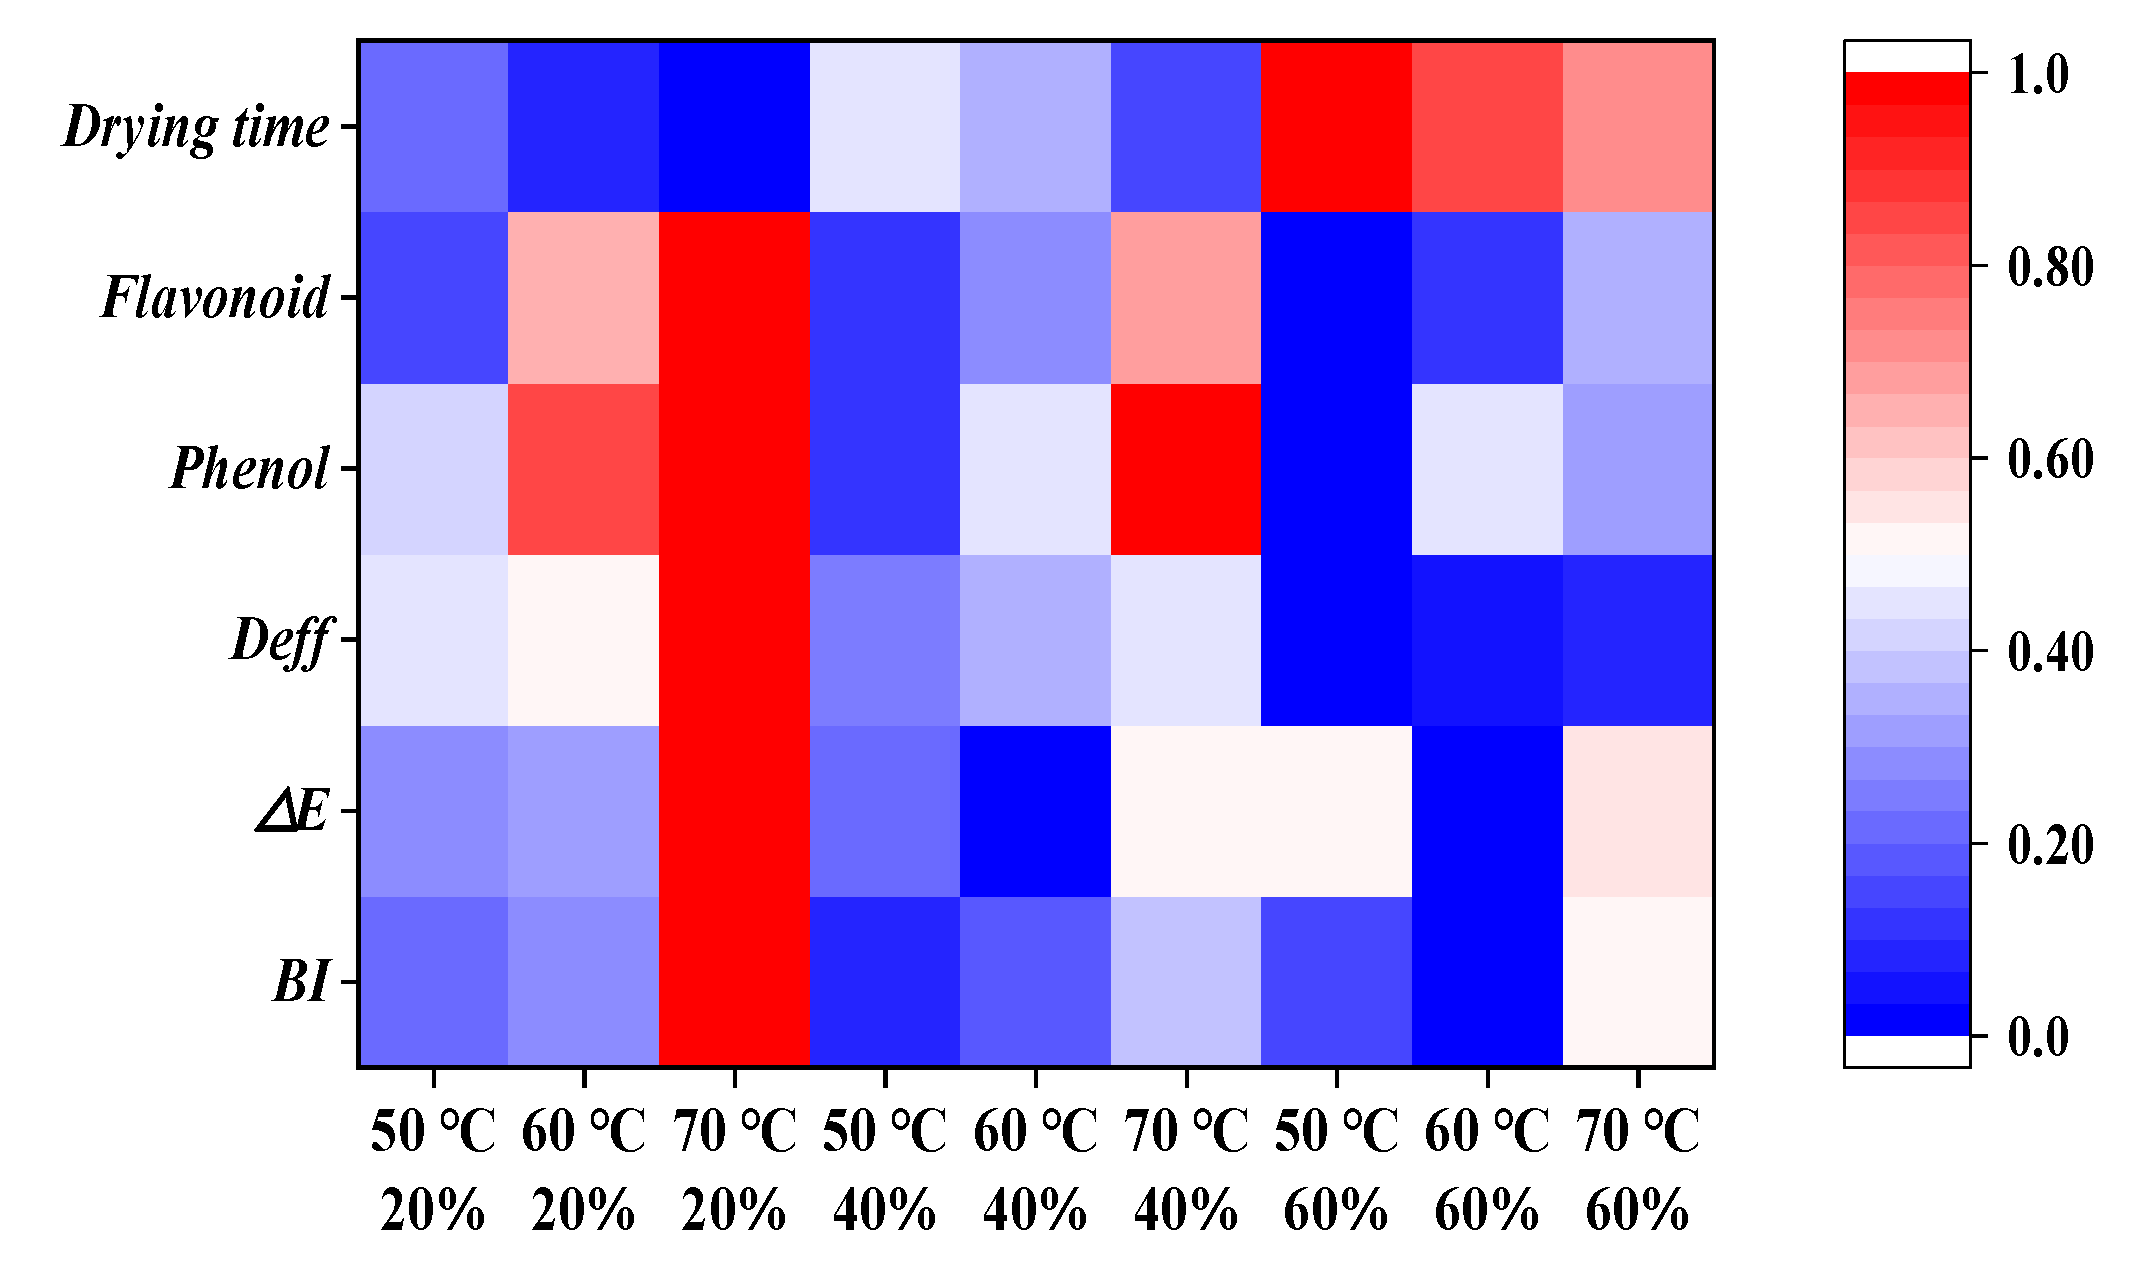
3.6. Visualize the Heatmap
3.7. Analysis of System Performance
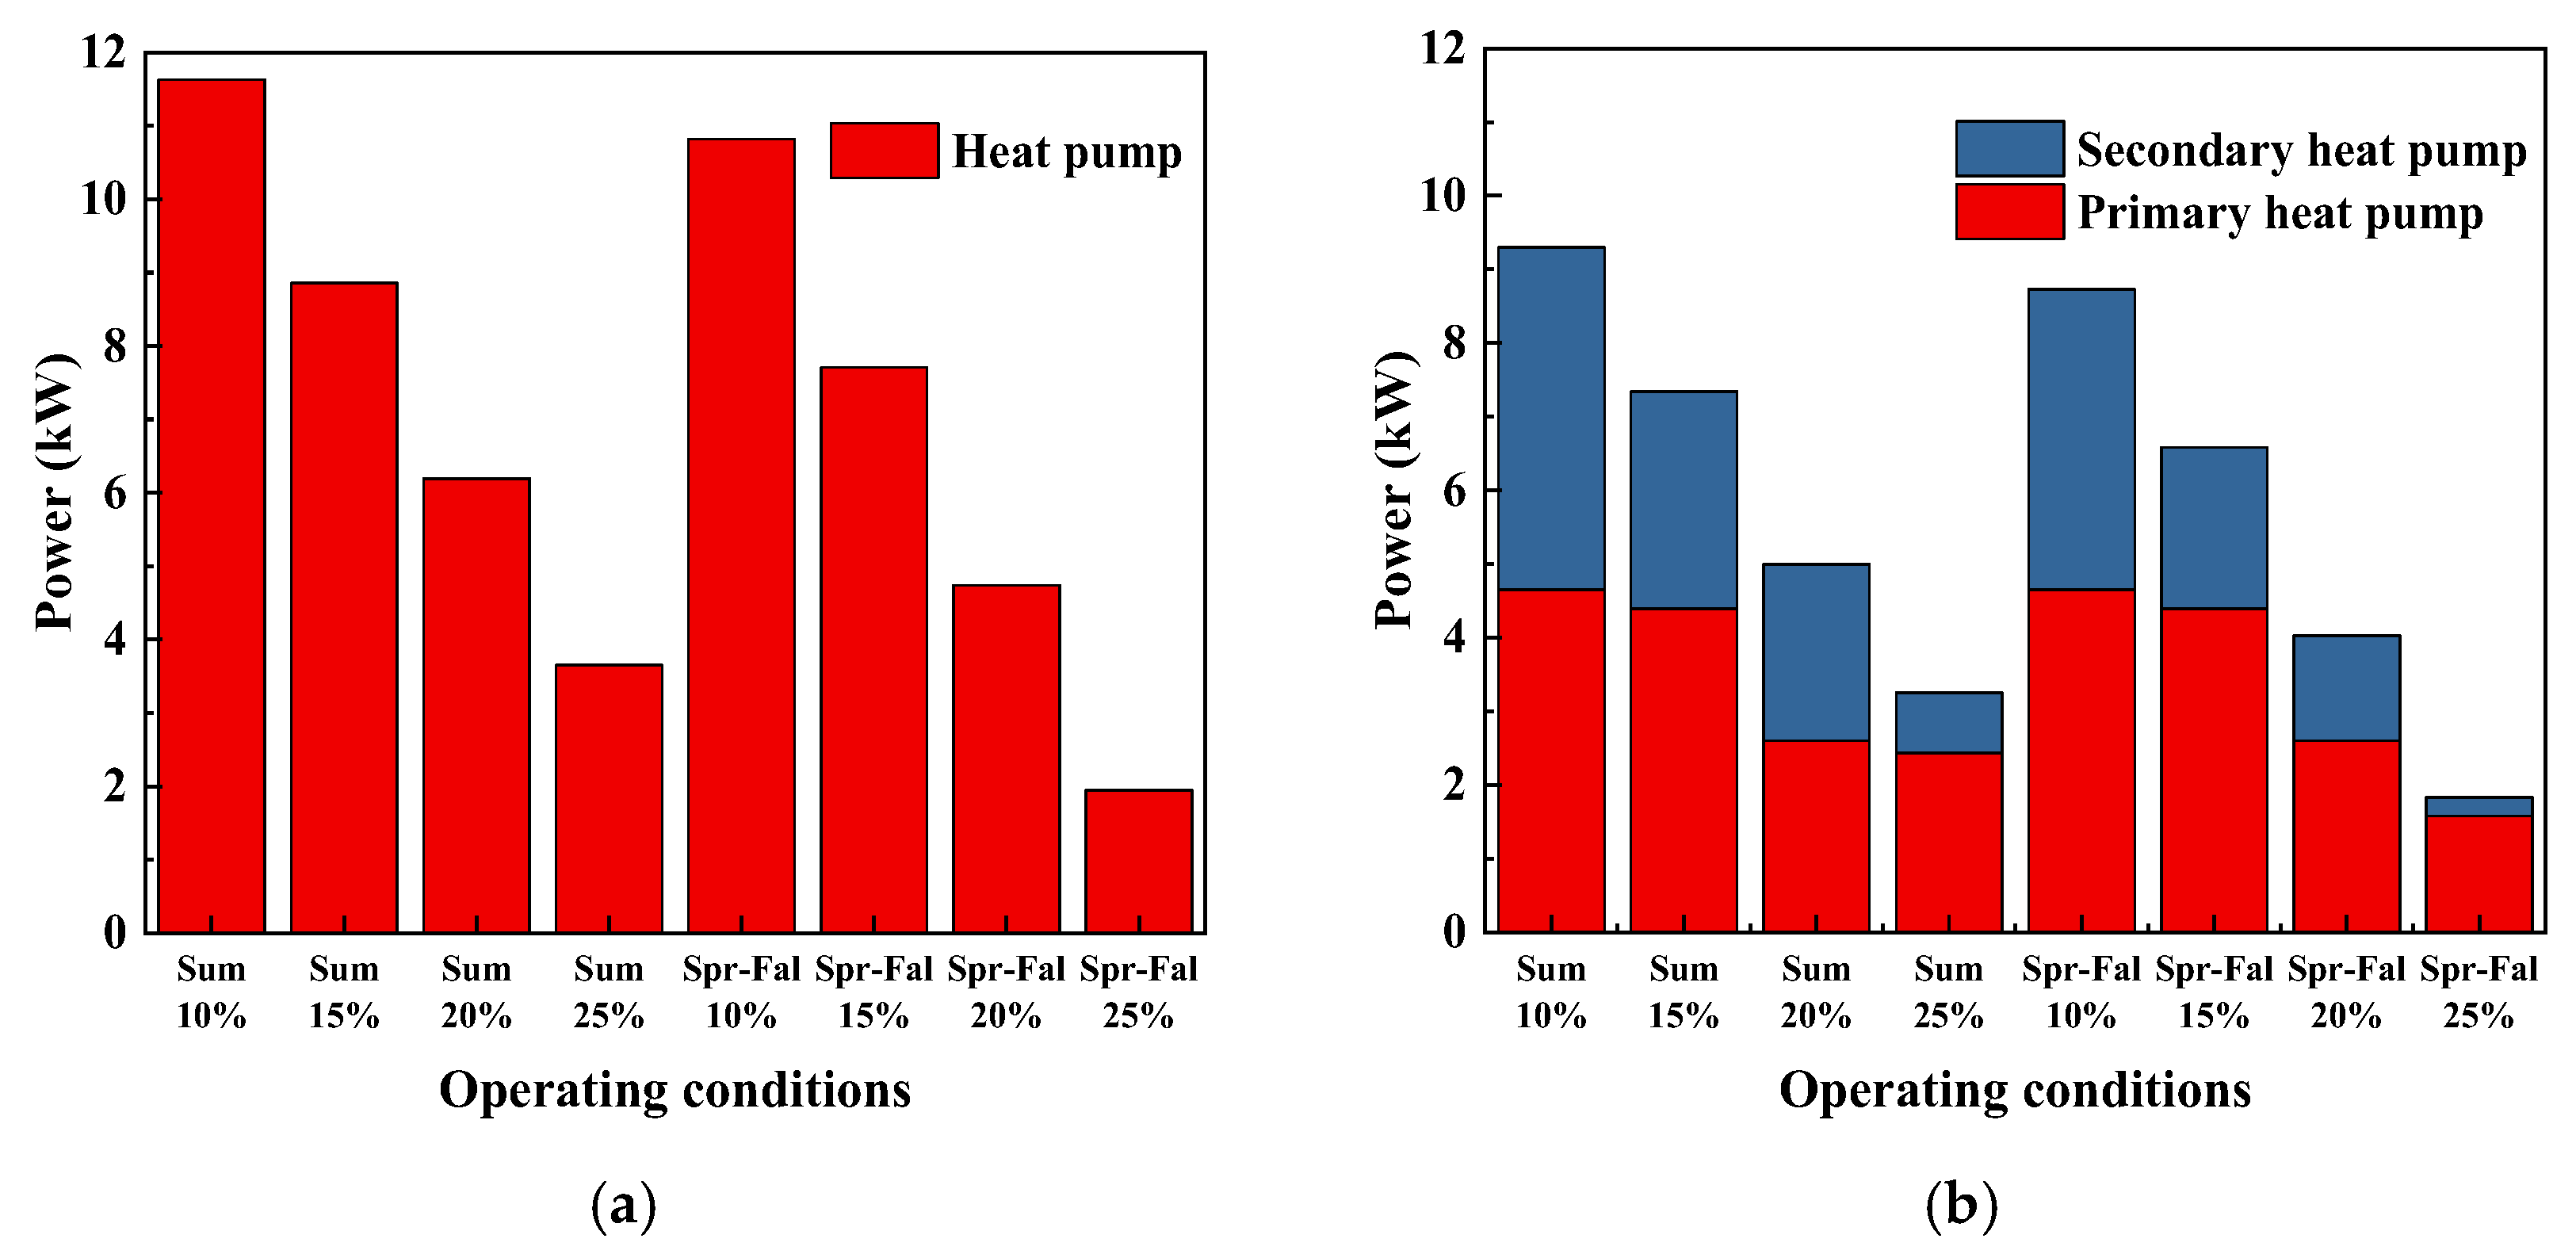
3.7.1. Power
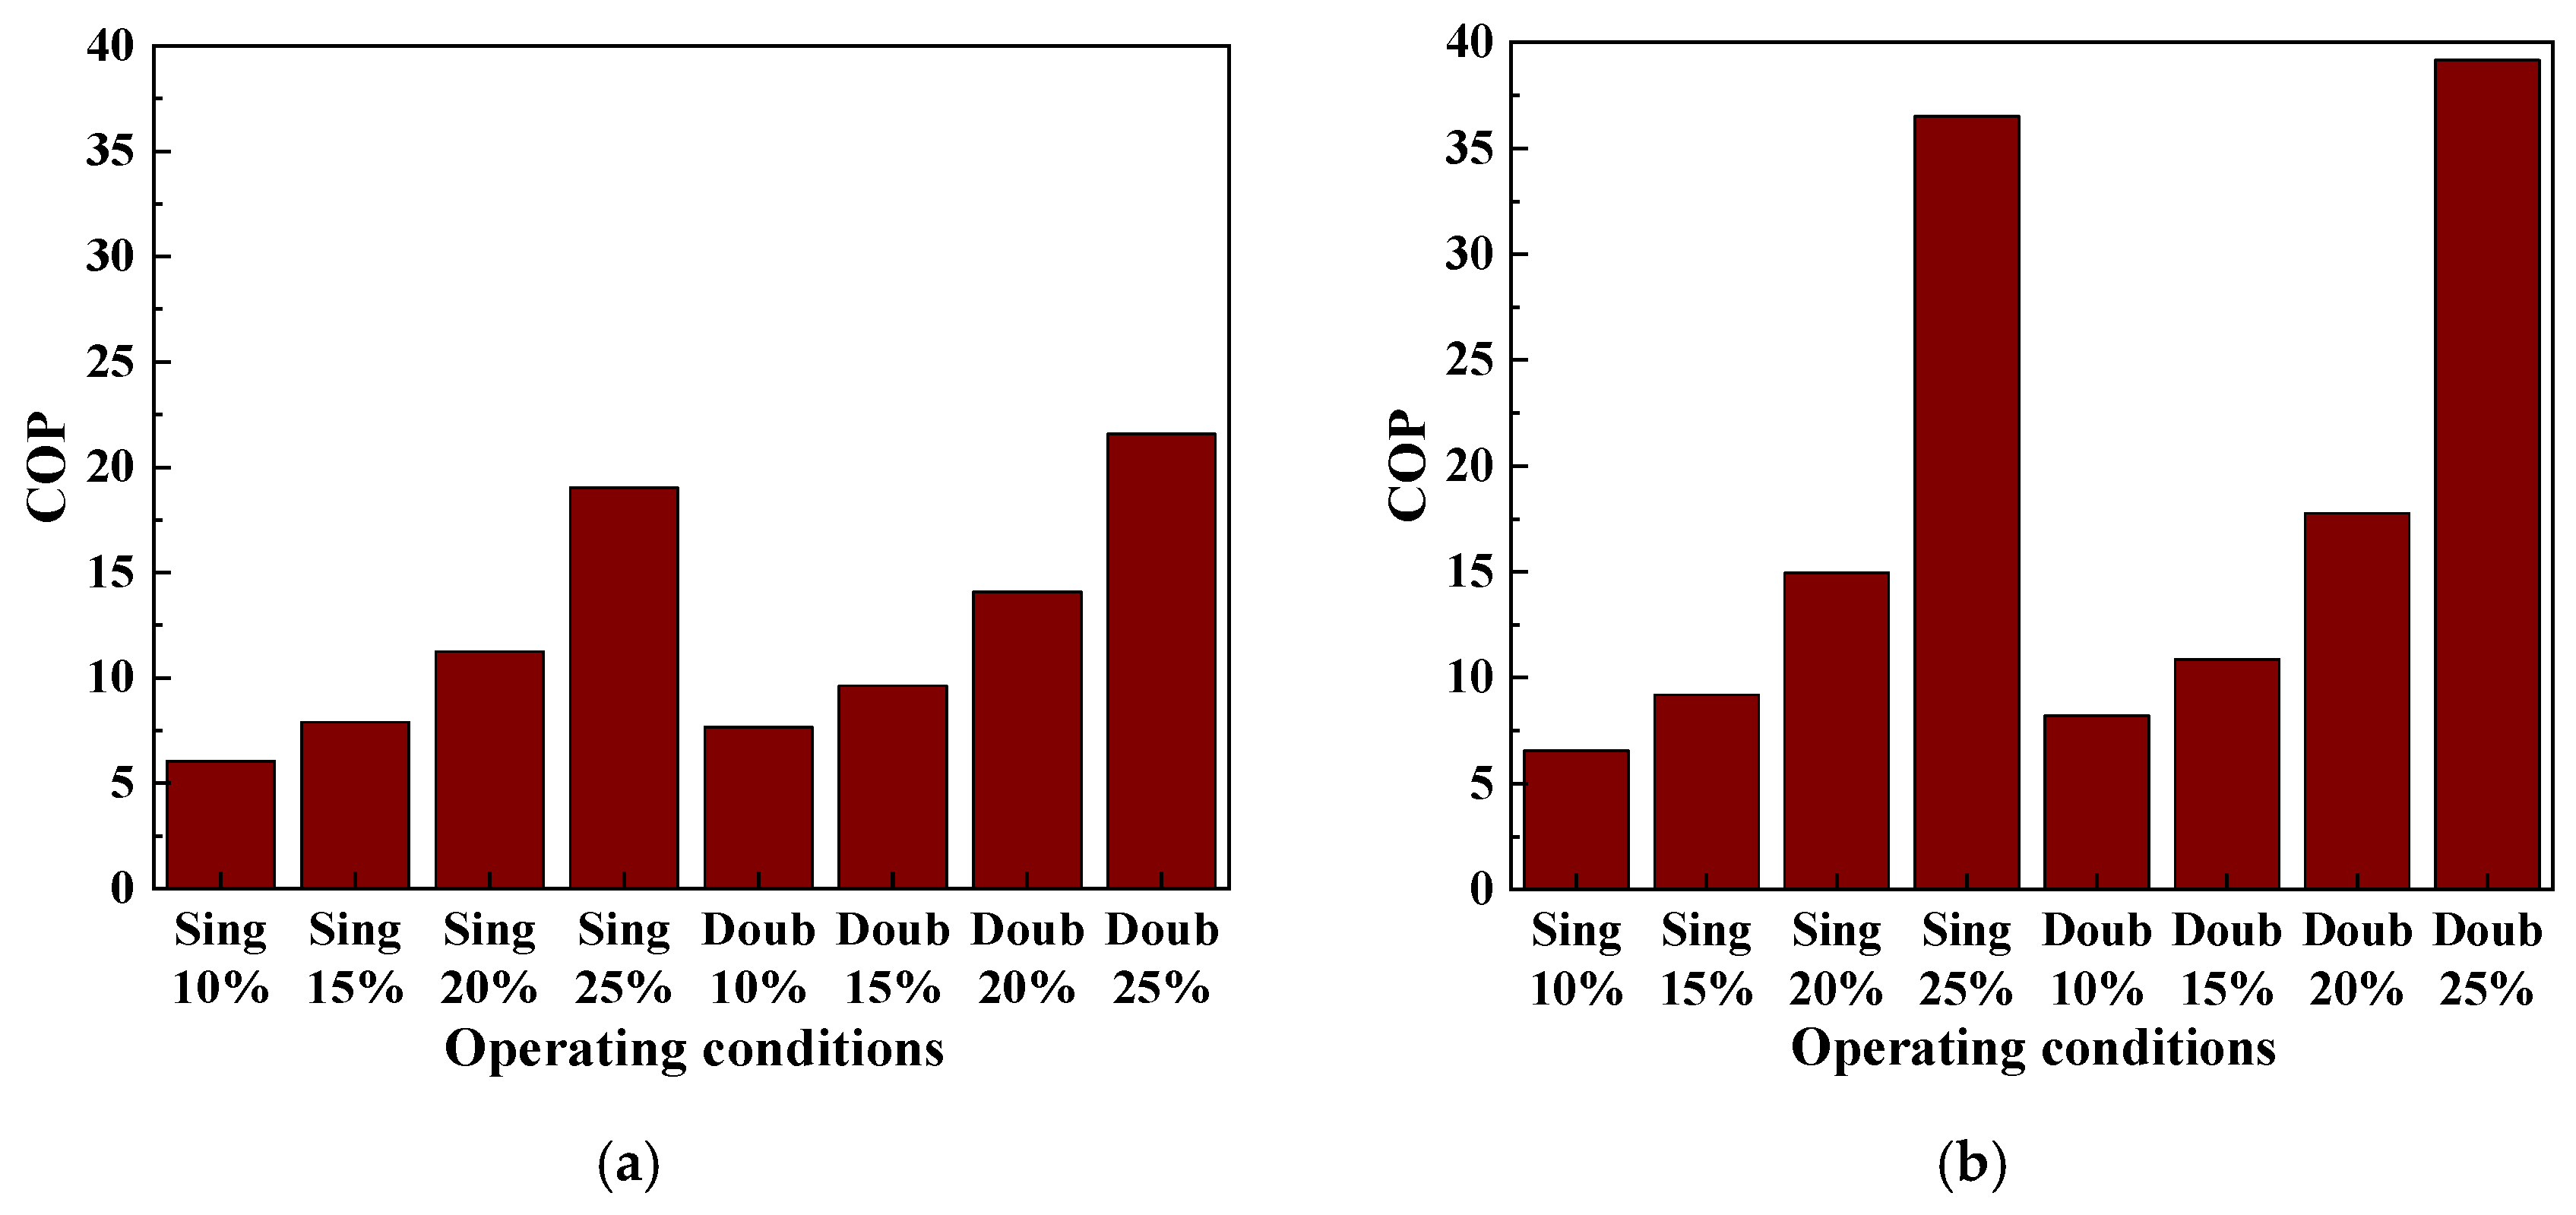
3.7.2. COP
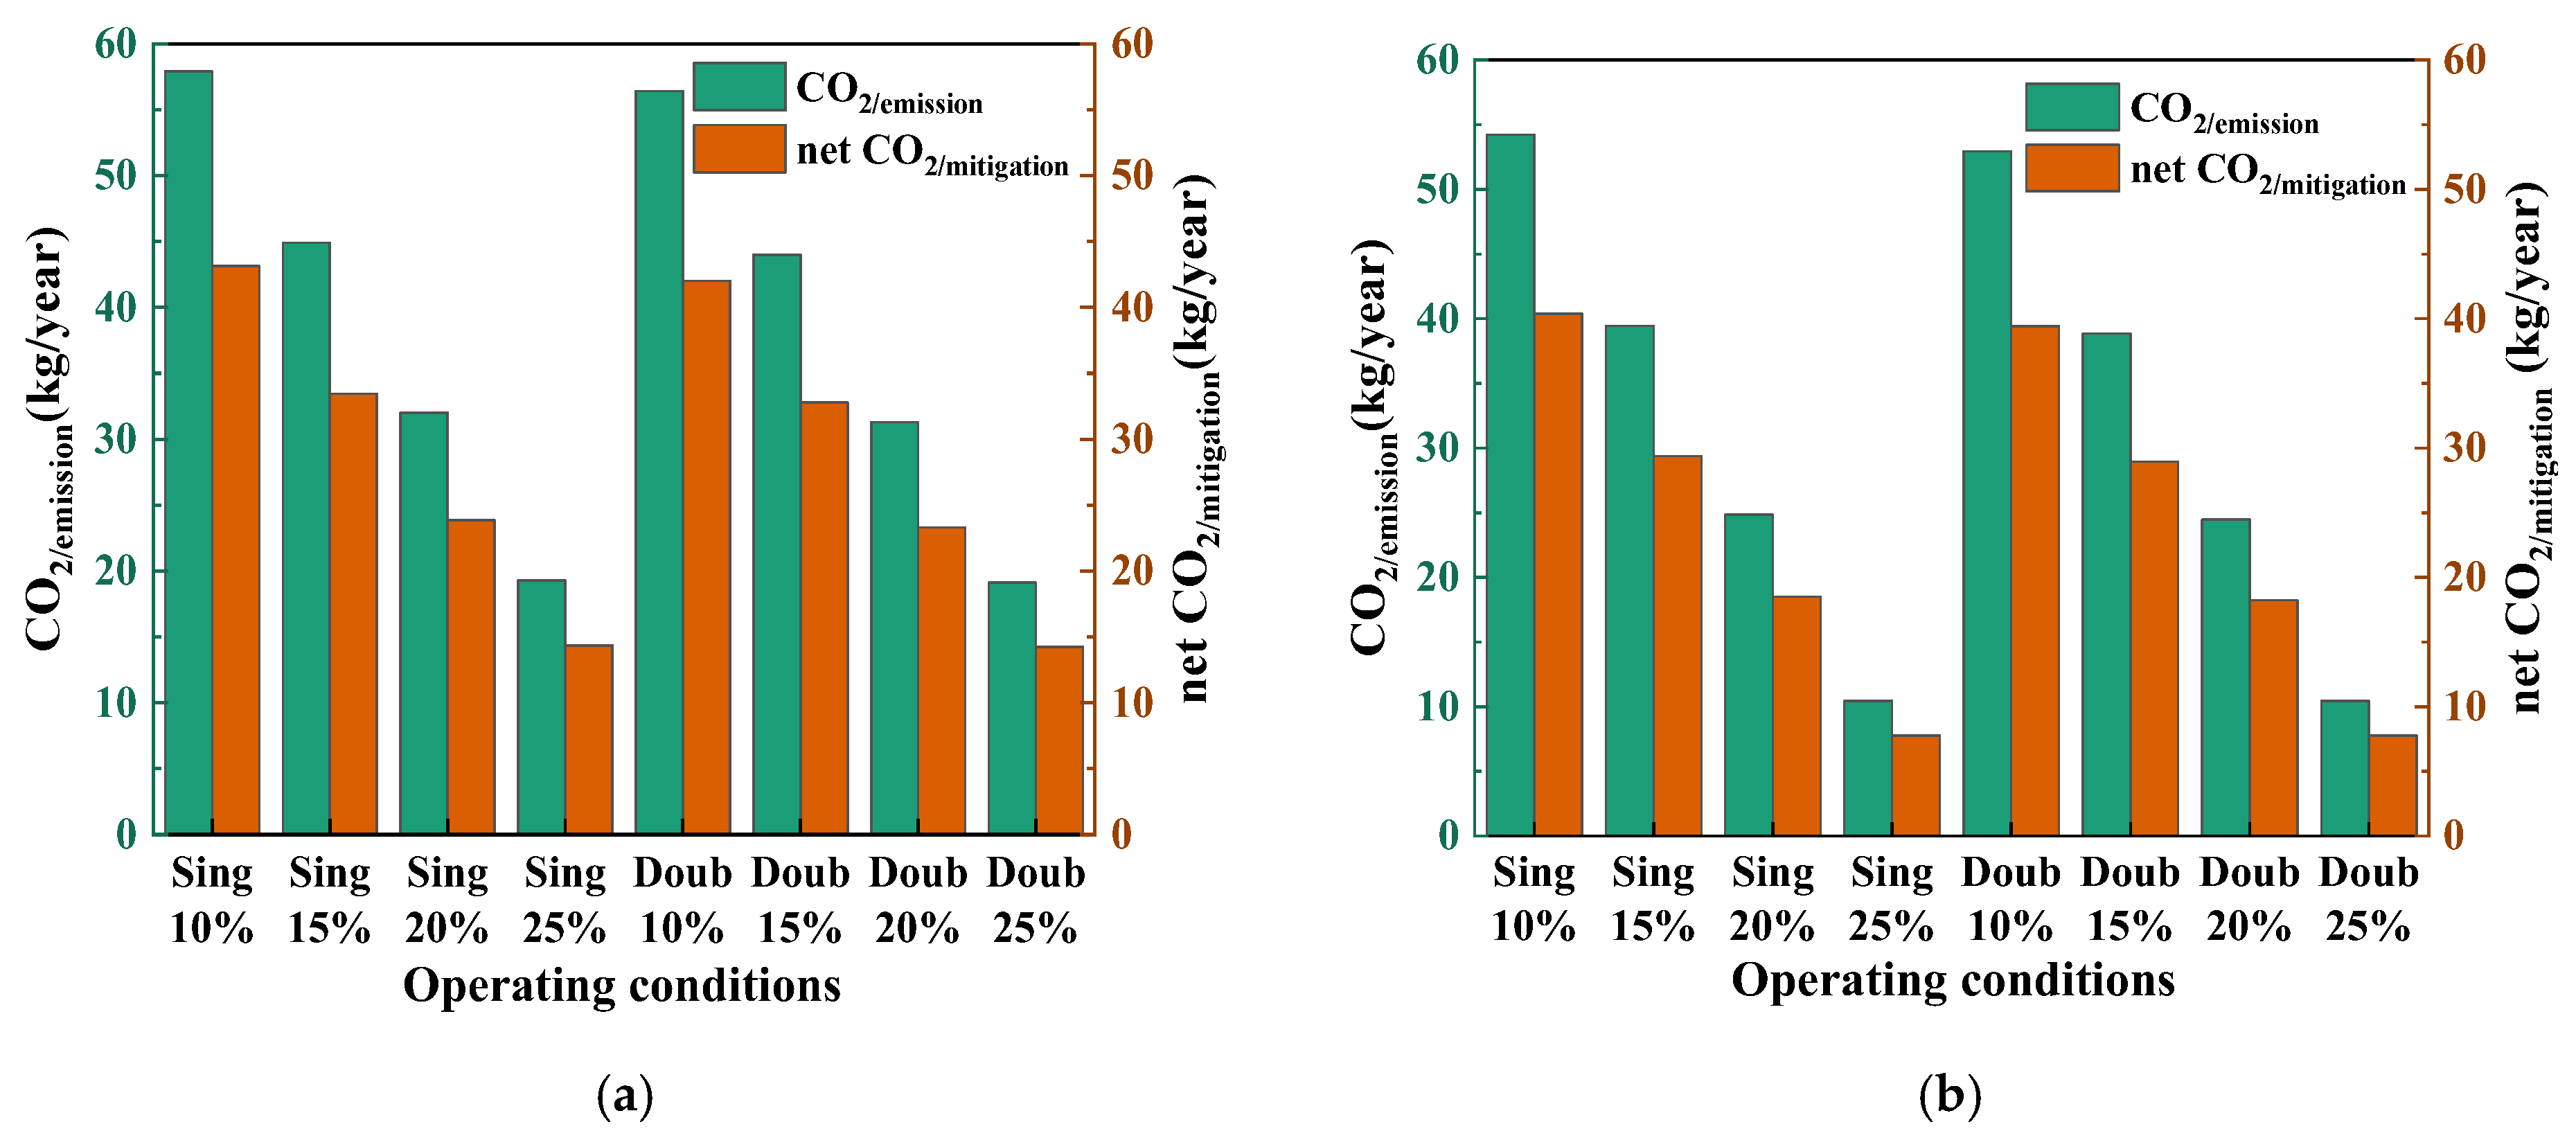
3.7.3. Carbon Emissions
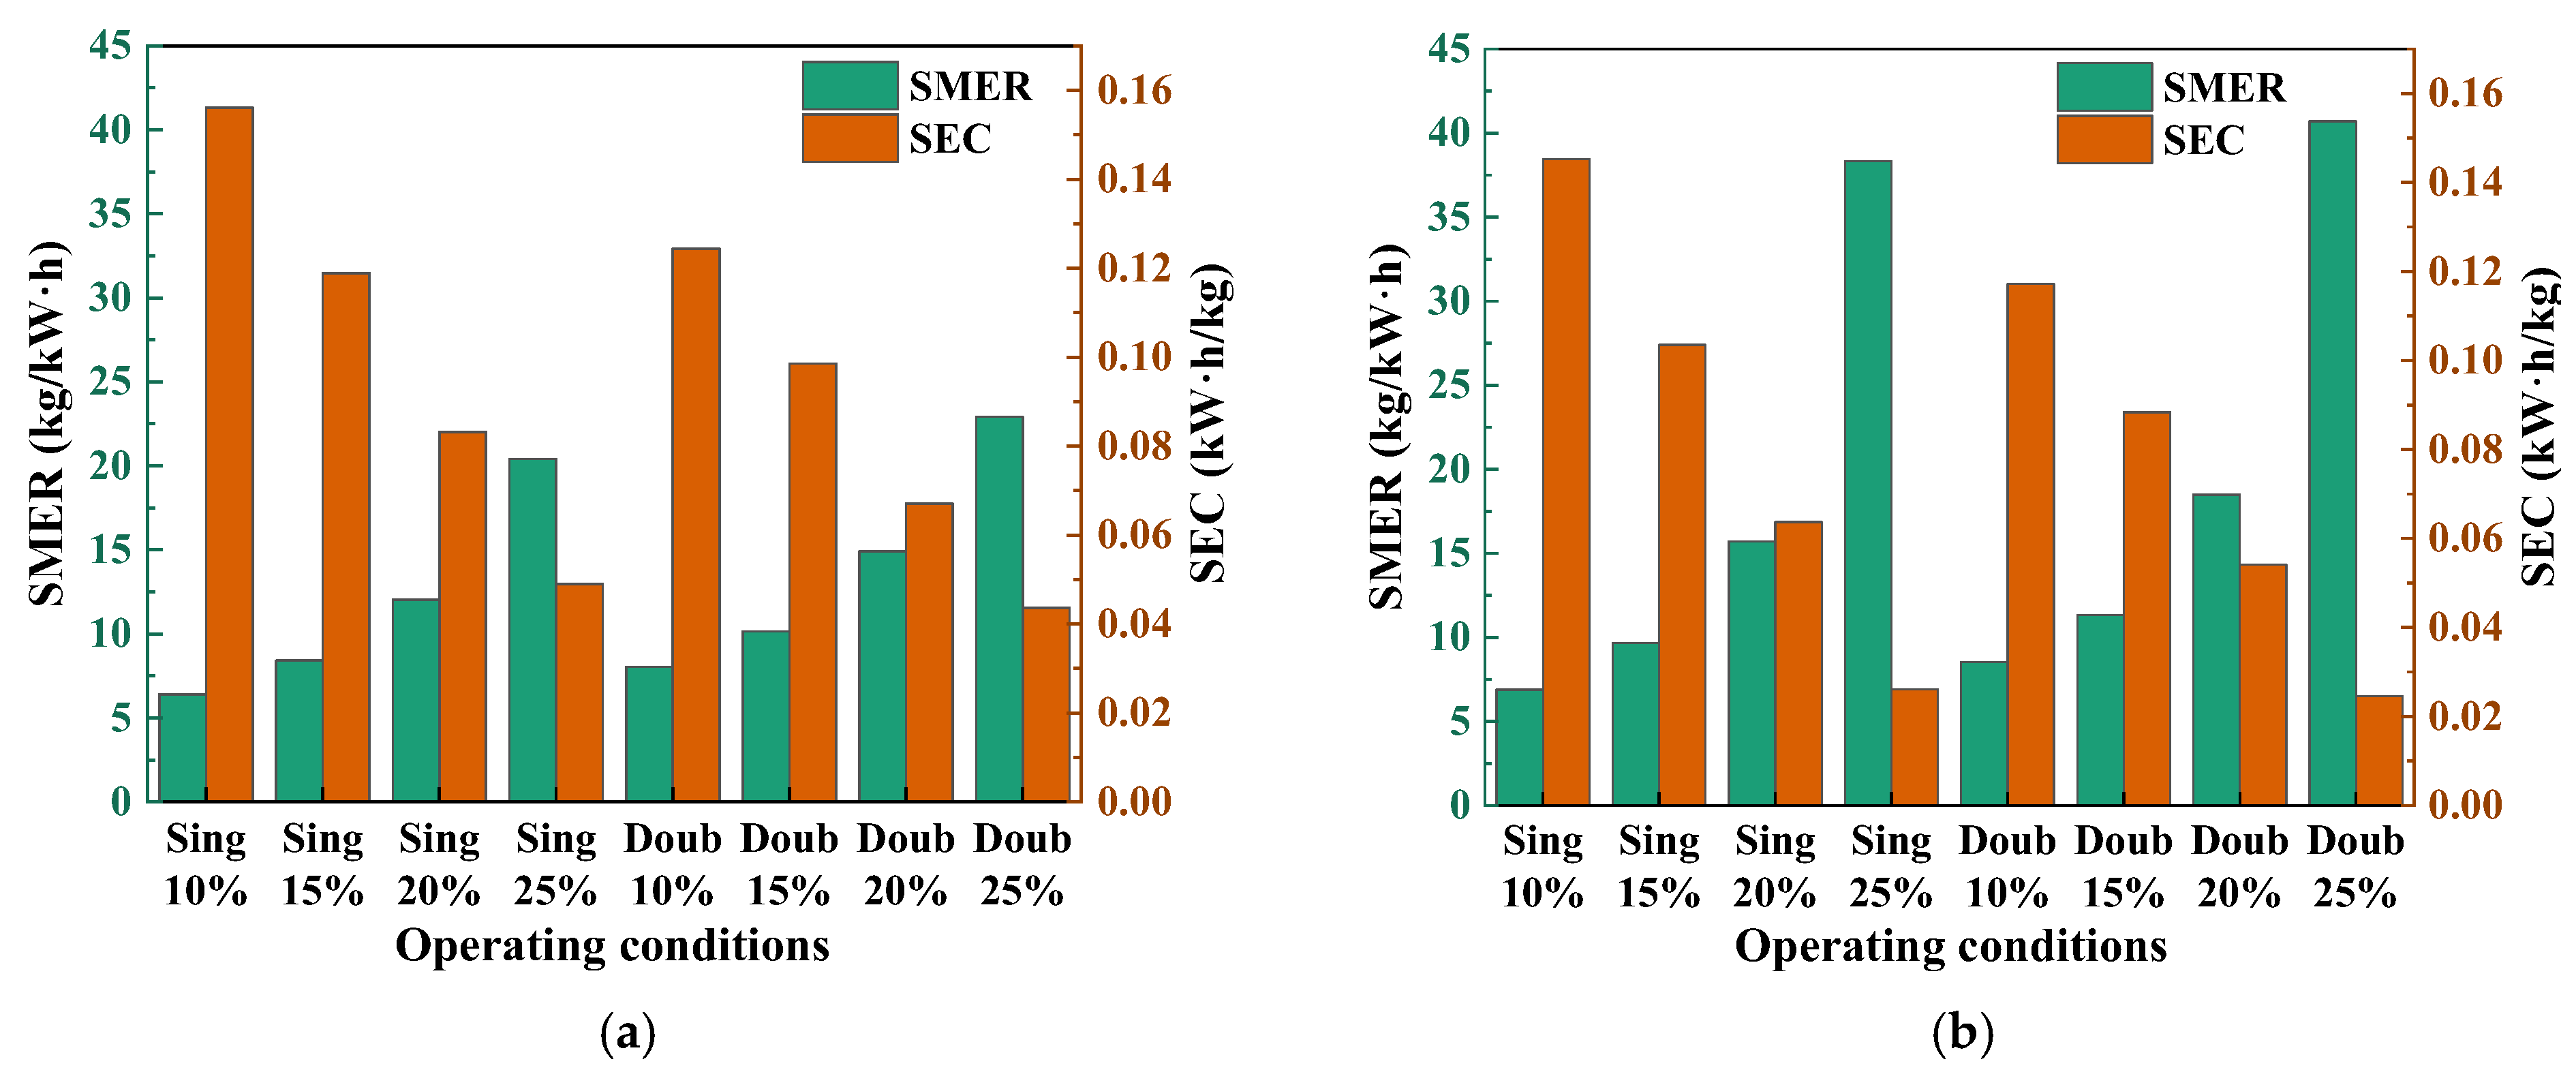
3.7.4. SMER and SEC
3.7.5. Solar Collector and Expansion Tank
4. Conclusions
Author Contributions
Funding
Institutional Review Board Statement
Informed Consent Statement
Data Availability Statement
Conflicts of Interest
References
- Anim-Ayeko, A.O.; Schillaci, C.; Lipani, A. Automatic blight disease detection in potato (Solanum tuberosum L.) and tomato (Solanum lycopersicum, L. 1753) plants using deep learning. Smart Agric. Technol. 2023, 4, 100178. [Google Scholar] [CrossRef]
- Eslami, E.; Abdurrahman, E.; Ferrari, G.; Pataro, G. Enhancing resource efficiency and sustainability in tomato processing: A comprehensive review. J. Clean. Prod. 2023, 425, 138996. [Google Scholar]
- Wang, J.; Li, Z.; Wang, Y. How does China’s energy-consumption trading policy affect the carbon abatement costs? An analysis based on spatial difference-in-differences method. Energy 2024, 294, 130705. [Google Scholar]
- Menon, A.; Stojceska, V.; Tassou, S.A. A systematic review on the recent advances of the energy efficiency improvements in non-conventional food drying technologies. Trends Food Sci. Technol. 2020, 100, 67–76. [Google Scholar]
- Jangde, P.K.; Singh, A.; Arjunan, T.V. Efficient solar drying techniques: A review. Environ. Sci. Pollut. Res. 2022, 29, 50970–50983. [Google Scholar]
- Djebli, A.; Hanini, S.; Badaoui, O.; Haddad, B.; Benhamou, A. Modeling and comparative analysis of solar drying behavior of potatoes. Renew. Energy 2020, 145, 1494–1506. [Google Scholar] [CrossRef]
- Fudholi, A.; Sopian, K.; Yazdi, M.H.; Ruslan, M.H.; Gabbasa, M.; Kazem, H.A. Performance analysis of solar drying system for red chili. Sol. Energy 2014, 99, 47–54. [Google Scholar] [CrossRef]
- Singh, A.; Sarkar, J.; Sahoo, R.R. Experimental performance analysis of novel indirect-expansion solar-infrared assisted heat pump dryer for agricultural products. Sol. Energy 2020, 206, 907–917. [Google Scholar]
- Kuan, M.; Shakir, Y.; Mohanraj, M.; Belyayev, Y.; Jayaraj, S.; Kaltayev, A. Numerical simulation of a heat pump assisted solar dryer for continental climates. Renew. Energy 2019, 143, 214–225. [Google Scholar]
- Wang, Y.; Li, M.; Qiu, Y.; Yu, Q.; Luo, X.; Li, G.; Ma, X. Performance analysis of a secondary heat recovery solar-assisted heat pump drying system for mango. Energy Explor. Exploit. 2019, 37, 1377–1387. [Google Scholar]
- GB 5009.3-2016; National Food Safety Standard—Determination of Moisture in Food. Standardization Administration of China: Beijing, China, 2016.
- Obajemihi, O.I.; Cheng, J.H.; Sun, D.W. Novel cold plasma functionalized water pretreatment for improving drying performance and physicochemical properties of tomato (Solanum lycopersicum L.) fruits during infrared-accelerated pulsed vacuum drying. J. Food Eng. 2024, 379, 112050. [Google Scholar] [CrossRef]
- Rurush, E.; Alvarado, M.; Palacios, P.; Flores, Y.; Rojas, M.L.; Miano, A.C. Drying kinetics of blueberry pulp and mass transfer parameters: Effect of hot air and refractance window drying at different temperatures. J. Food Eng. 2022, 320, 110929. [Google Scholar] [CrossRef]
- Obadina, A.; Ibrahim, J.; Adekoya, I. Influence of drying temperature and storage period on the quality of cherry and plum tomato powder. Food Sci. Nutr. 2018, 6, 1146–1153. [Google Scholar] [CrossRef]
- Zhao, S.Y.; An, N.N.; Zhang, K.Y.; Li, D.; Wang, L.J.; Wang, Y. Evaluation of drying kinetics, physical properties, bioactive compounds, antioxidant activity and microstructure of Acanthopanax sessiliflorus fruits dried by microwave-assisted hot air drying method. J. Food Eng. 2023, 357, 111642. [Google Scholar] [CrossRef]
- Onwude, D.I.; Hashim, N.; Janius, R.; Nawi, N.M.; Abdan, K. Color change kinetics and total carotenoid content of pumpkin as affected by drying temperature. Ital. J. Food Sci./Riv. Ital. Sci. Aliment. 2017, 29, 1–18. [Google Scholar]
- Komonsing, N.; Khuwijitjaru, P.; Nagle, M.; Müller, J.; Mahayothee, B. Effect of drying temperature together with light on drying characteristics and bioactive compounds in turmeric slice. J. Food Eng. 2022, 317, 110695. [Google Scholar] [CrossRef]
- Zhu, T.T.; Diao, Y.H.; Zhao, Y.H.; Li, F.F. Thermal performance of a new CPC solar air collector with flat micro-heat pipe arrays. Appl. Therm. Eng. 2016, 98, 1201–1213. [Google Scholar] [CrossRef]
- Yin, S.L. Solar Collectors and Heating Systems. In Solar and Heat Pump Drying Technology, 1st ed.; Chemical Industry Press: Beijing, China, 2011; Chapter 3. [Google Scholar]
- Yu, H.; Gao, J.; Chen, Y. Heat release performance of heat storage water tank with phase-change material in solar drying system. Trans. Chin. Soc. Agric. Eng. 2015, 31, 207–211. [Google Scholar]
- Pirasteh, G.; Saidur, R.; Rahman, S.M.A.; Rahim, N.A. A review on development of solar drying applications. Renew. Sustain. Energy Rev. 2014, 31, 133–148. [Google Scholar] [CrossRef]
- Hadibi, T.; Mennouche, D.; Arıcı, M.; Yunfeng, W.; Boubekri, A.; Kong, D.; Li, M. Energy and enviro-economic analysis of tomato slices solar drying: An experimental approach. Sol. Energy 2023, 253, 250–261. [Google Scholar] [CrossRef]
- Valencia Ceballos, L.A.; Lopez-Vidaña, E.C.C.; Romero-Perez, C.K.; Escobedo-Bretado, J.; García-Valladares, O.; Martín Domínguez, I.R. Techno-Economic and Environmental Assessment of a Photovoltaic-Thermal (Pv-T) Solar Dryer for Habanero Chili (Capsicuum chinense): 4e (Energy, Economic, Embodied and Environmental) Analysis. Renew. Energy 2025, 245, 122758. [Google Scholar] [CrossRef]
- Lamrani, B.; Elmrabet, Y.; Mathew, I.; Bekkioui, N.; Etim, P.; Chahboun, A.; Draoui, A.; Ndukwu, M.C. Energy, economic analysis and mathematical modelling of mixed-mode solar drying of potato slices with thermal storage loaded V-groove collector: Application to Maghreb region. Renew. Energy 2022, 200, 48–58. [Google Scholar]
- Demiray, E.; Yazar, J.G.; Aktok, Ö.; Çulluk, B.; Çalışkan Koç, G.; Pandiselvam, R. The effect of drying temperature and thickness on the drying kinetic, antioxidant activity, phenolic compounds, and color values of apple slices. J. Food Qual. 2023, 2023, 7426793. [Google Scholar]
- Wang, W.; Wang, W.; Wang, Y.; Yang, R.; Tang, J.; Zhao, Y. Hot-air assisted continuous radio frequency heating for improving drying efficiency and retaining quality of inshell hazelnuts (Corylus avellana L. cv. Barcelona). J. Food Eng. 2020, 279, 109956. [Google Scholar]
- Pei, Y.; Li, Z.; Song, C.; Li, J.; Xu, W.; Zhu, G. Analysis and modelling of temperature and moisture gradient for ginger slices in hot air drying. J. Food Eng. 2022, 323, 111009. [Google Scholar]
- Xu, P.; Zhang, Z.; Peng, X.; Yang, J.; Li, X.; Yuan, T.; Jia, X.; Liu, Y.; Abdullaev, O.; Jenis, J. Study on vacuum drying kinetics and processing of the Lonicera japonica Thunb. aqueous extracts. LWT 2022, 167, 113868. [Google Scholar]
- Xu, P.; Jia, X.; Zhang, Z.; Li, X.; Tang, Y.; Yang, J.; Yuan, T.; Peng, X.; Tang, X.; ElGamal, R. Research on boiling heat transfer of aqueous extracts vacuum drying based on fractal theory. Drying Technol. 2024, 42, 1379–1391. [Google Scholar] [CrossRef]
- Zhang, Y.; Zhu, G.; Li, X.; Zhao, Y.; Lei, D.; Ding, G.; Ambrose, K.; Liu, Y. Combined medium-and short-wave infrared and hot air impingement drying of sponge gourd (Luffa cylindrical) slices. J. Food Eng. 2020, 284, 110043. [Google Scholar]
- Sasongko, S.B.; Hadiyanto, H.; Djaeni, M.; Perdanianti, A.M.; Utari, F.D. Effects of drying temperature and relative humidity on the quality of dried onion slice. Heliyon 2020, 6, e04338. [Google Scholar]
- Santos, M.V.; Ranalli, N.; Orjuela-Palacio, J.; Zaritzky, N. Brewers spent grain drying: Drying kinetics, moisture sorption isotherms, bioactive compounds stability and Bacillus cereus lethality during thermal treatment. J. Food Eng. 2024, 364, 111796. [Google Scholar]
- Deymi-Dashtebayaz, M.; Abadi, M.K.; Asadi, M.; Khutornaya, J.; Sergienko, O. Investigation of a new solar-wind energy-based heat pump dryer for food waste drying based on different weather conditions. Energy 2024, 290, 130328. [Google Scholar]
- Chi, X.; Tang, S.; Song, X.; Rahimi, S.; Ren, Z.; Han, G.; Shi, S.Q.; Cheng, W.; Avramidis, S. Energy and quality analysis of forced convection air-energy assisted solar timber drying. Energy 2023, 283, 128718. [Google Scholar]


| Reagent Name | Control Tube | Measurement Tube | Measurement Tube | Measurement Tube |
|---|---|---|---|---|
| Sample to be measured (μL) | 50 | 50 | - | - |
| Standard solution (μL) | - | - | 50 | - |
| Distilled water (μL) | - | - | - | 50 |
| Reagent 1 (μL) | - | 250 | 250 | 250 |
| Vortex and let sit at room temperature for 2 min | ||||
| Reagent 2 (μL) | 250 | 250 | 250 | 250 |
| Distilled water (μL) | 700 | 450 | 450 | 450 |
| Reagent Name | Control Tube | Measurement Tube | Measurement Tube | Measurement Tube |
|---|---|---|---|---|
| Sample to be measured (μL) | 0.2 | 0.2 | - | - |
| Standard solution (μL) | - | - | 0.2 | - |
| Distilled water (μL) | - | - | - | 0.2 |
| Reagent 1 (μL) | 0.05 | 0.05 | 0.05 | 0.05 |
| Vortex and let sit at room temperature for 5 min | ||||
| Reagent 2 (μL) | - | 0.05 | 0.05 | 0.05 |
| Vortex and let sit at room temperature for 5 min | ||||
| Reagent 3 (μL) | 0.4 | 0.4 | 0.4 | 0.4 |
| 60% ethanol (mL) | 0.35 | 0.3 | 0.3 | 0.3 |
| Temperature/°C | RH/% | Linear Regression Fits the Equation | R2 | Deff/(m2/s) |
|---|---|---|---|---|
| 50 | 20 | lnMR = −0.209 − 0.00040t | 4.05 × 10⁻⁹ | |
| 60 | lnMR = −0.209 − 0.00043t | 4.35 × 10⁻⁹ | ||
| 70 | lnMR = −0.209 − 0.00069t | 7.00 × 10⁻⁹ | ||
| 50 | 40 | lnMR = −0.209 − 0.00028t | 2.83 × 10⁻⁹ | |
| 60 | lnMR = −0.209 − 0.00033t | 3.40 × 10⁻⁹ | ||
| 70 | lnMR = −0.209 − 0.00029t | 4.06 × 10⁻⁹ | ||
| 50 | 60 | lnMR = −0.209 − 0.00015t | 1.52 × 10⁻⁹ | |
| 60 | lnMR = −0.209 − 0.00017t | 1.74 × 10⁻⁹ | ||
| 70 | lnMR = −0.209 − 0.00019t | 1.96 × 10⁻⁹ |
| Temperature/°C | RH/% | R2 | Ea/(kJ/mol) |
|---|---|---|---|
| 50 | 20 | 0.9855 | 25.22 |
| 60 | |||
| 70 | |||
| 50 | 40 | 0.9996 | 16.53 |
| 60 | |||
| 70 | |||
| 50 | 60 | 0.9999 | 11.70 |
| 60 | |||
| 70 |
| Temperature/°C | RH/% | |||||
|---|---|---|---|---|---|---|
| 50 | 20 | 33.89 ± 0.13 a | 21.06 ± 1.01 b | 19.55 ± 0.61 ab | 7.03 ± 1.14 c | 124 |
| 60 | 25.55 ± 0.57 cd | 13.85 ± 1.50 d | 18.31 ± 0.70 b | 9.17 ± 0.18 bc | 150 | |
| 70 | 27.95 ± 1.04 bc | 22.42 ± 0.73 ab | 17.36 ± 1.11 b | 8.83 ± 0.49 bc | 144 | |
| 50 | 40 | 29.47 ± 0.84 b | 23.12 ± 0.80 ab | 16.81 ± 1.16 b | 8.35 ± 0.56 bc | 132 |
| 60 | 27.31 ± 1.14 bc | 17.91 ± 0.63 c | 17.73 ± 1.23 b | 7.23 ± 1.46 bc | 141 | |
| 70 | 27.04 ± 0.94 bc | 23.23 ± 0.60 ab | 18.34 ± 0.29 b | 10.31 ± 0.34 c | 159 | |
| 50 | 60 | 29.97 ± 1.37 b | 25.52 ± 0.27 a | 17.43 ± 0.23 b | 10.40 ± 0.29 b | 138 |
| 60 | 28.99 ± 0.74 b | 22.56 ± 1.03 ab | 21.72 ± 0.86 a | 10.65 ± 1.51 b | 172 | |
| 70 | 22.65 ± 0.99 d | 22.10 ± 0.94 b | 20.00 ± 1.35 ab | 13.55 ± 0.16 a | 219 |
| Fresh Air Volumes | 10% | 15% | 20% | 25% | |
|---|---|---|---|---|---|
| Summer | Solar collector heat supply (kJ) | 13.48 | 25.8 | 38.47 | 50.63 |
| Solar radiation intensity (kJ/m2) | 8000.00 | 8000.00 | 8000.00 | 8000.00 | |
| Effective area of solar collector (m2) | 17.24 | 32.99 | 49.19 | 64.74 | |
| Water temperature increase (°C) | 30.00 | 30.00 | 30.00 | 30.00 | |
| Water flow rate (m3/h) | 0.39 | 0.74 | 1.11 | 1.46 | |
| Total water volume (m3) | 0.65 | 1.24 | 1.85 | 2.44 | |
| Spring/autumn | Solar collector heat supply (kJ) | 17.6 | 31.94 | 46.62 | 61 |
| Solar radiation intensity (kJ/m2) | 8000.00 | 8000.00 | 8000.00 | 8000.00 | |
| Effective area of solar collector (m2) | 22.51 | 40.84 | 59.62 | 78.01 | |
| Water temperature increase (°C) | 30.00 | 30.00 | 30.00 | 30.00 | |
| Water flow rate (m3/h) | 0.51 | 0.92 | 1.35 | 1.76 | |
| Total water volume (m3) | 0.85 | 1.54 | 2.25 | 2.94 |
Disclaimer/Publisher’s Note: The statements, opinions and data contained in all publications are solely those of the individual author(s) and contributor(s) and not of MDPI and/or the editor(s). MDPI and/or the editor(s) disclaim responsibility for any injury to people or property resulting from any ideas, methods, instructions or products referred to in the content. |
© 2025 by the authors. Licensee MDPI, Basel, Switzerland. This article is an open access article distributed under the terms and conditions of the Creative Commons Attribution (CC BY) license (https://creativecommons.org/licenses/by/4.0/).
Share and Cite
Tang, Y.; Li, X.; Xu, P.; Yang, J.; Zhang, Z.; Wang, R.; Zhao, D.; Elgamal, R. Performance Evaluation of a Solar-Assisted Multistage Heat Pump Drying System Based on the Optimal Drying Conditions for Solanum lycopersicum L. Foods 2025, 14, 1195. https://doi.org/10.3390/foods14071195
Tang Y, Li X, Xu P, Yang J, Zhang Z, Wang R, Zhao D, Elgamal R. Performance Evaluation of a Solar-Assisted Multistage Heat Pump Drying System Based on the Optimal Drying Conditions for Solanum lycopersicum L. Foods. 2025; 14(7):1195. https://doi.org/10.3390/foods14071195
Chicago/Turabian StyleTang, Yimin, Xiaoqiong Li, Peng Xu, Junling Yang, Zhentao Zhang, Ruixiang Wang, Dandan Zhao, and Ramadan Elgamal. 2025. "Performance Evaluation of a Solar-Assisted Multistage Heat Pump Drying System Based on the Optimal Drying Conditions for Solanum lycopersicum L." Foods 14, no. 7: 1195. https://doi.org/10.3390/foods14071195
APA StyleTang, Y., Li, X., Xu, P., Yang, J., Zhang, Z., Wang, R., Zhao, D., & Elgamal, R. (2025). Performance Evaluation of a Solar-Assisted Multistage Heat Pump Drying System Based on the Optimal Drying Conditions for Solanum lycopersicum L. Foods, 14(7), 1195. https://doi.org/10.3390/foods14071195