
Optimized Harvest Management Strategy Based on Latent Loss and Antioxidant Enzyme Activity


Abstract
1. Introduction
2. Materials and Methods
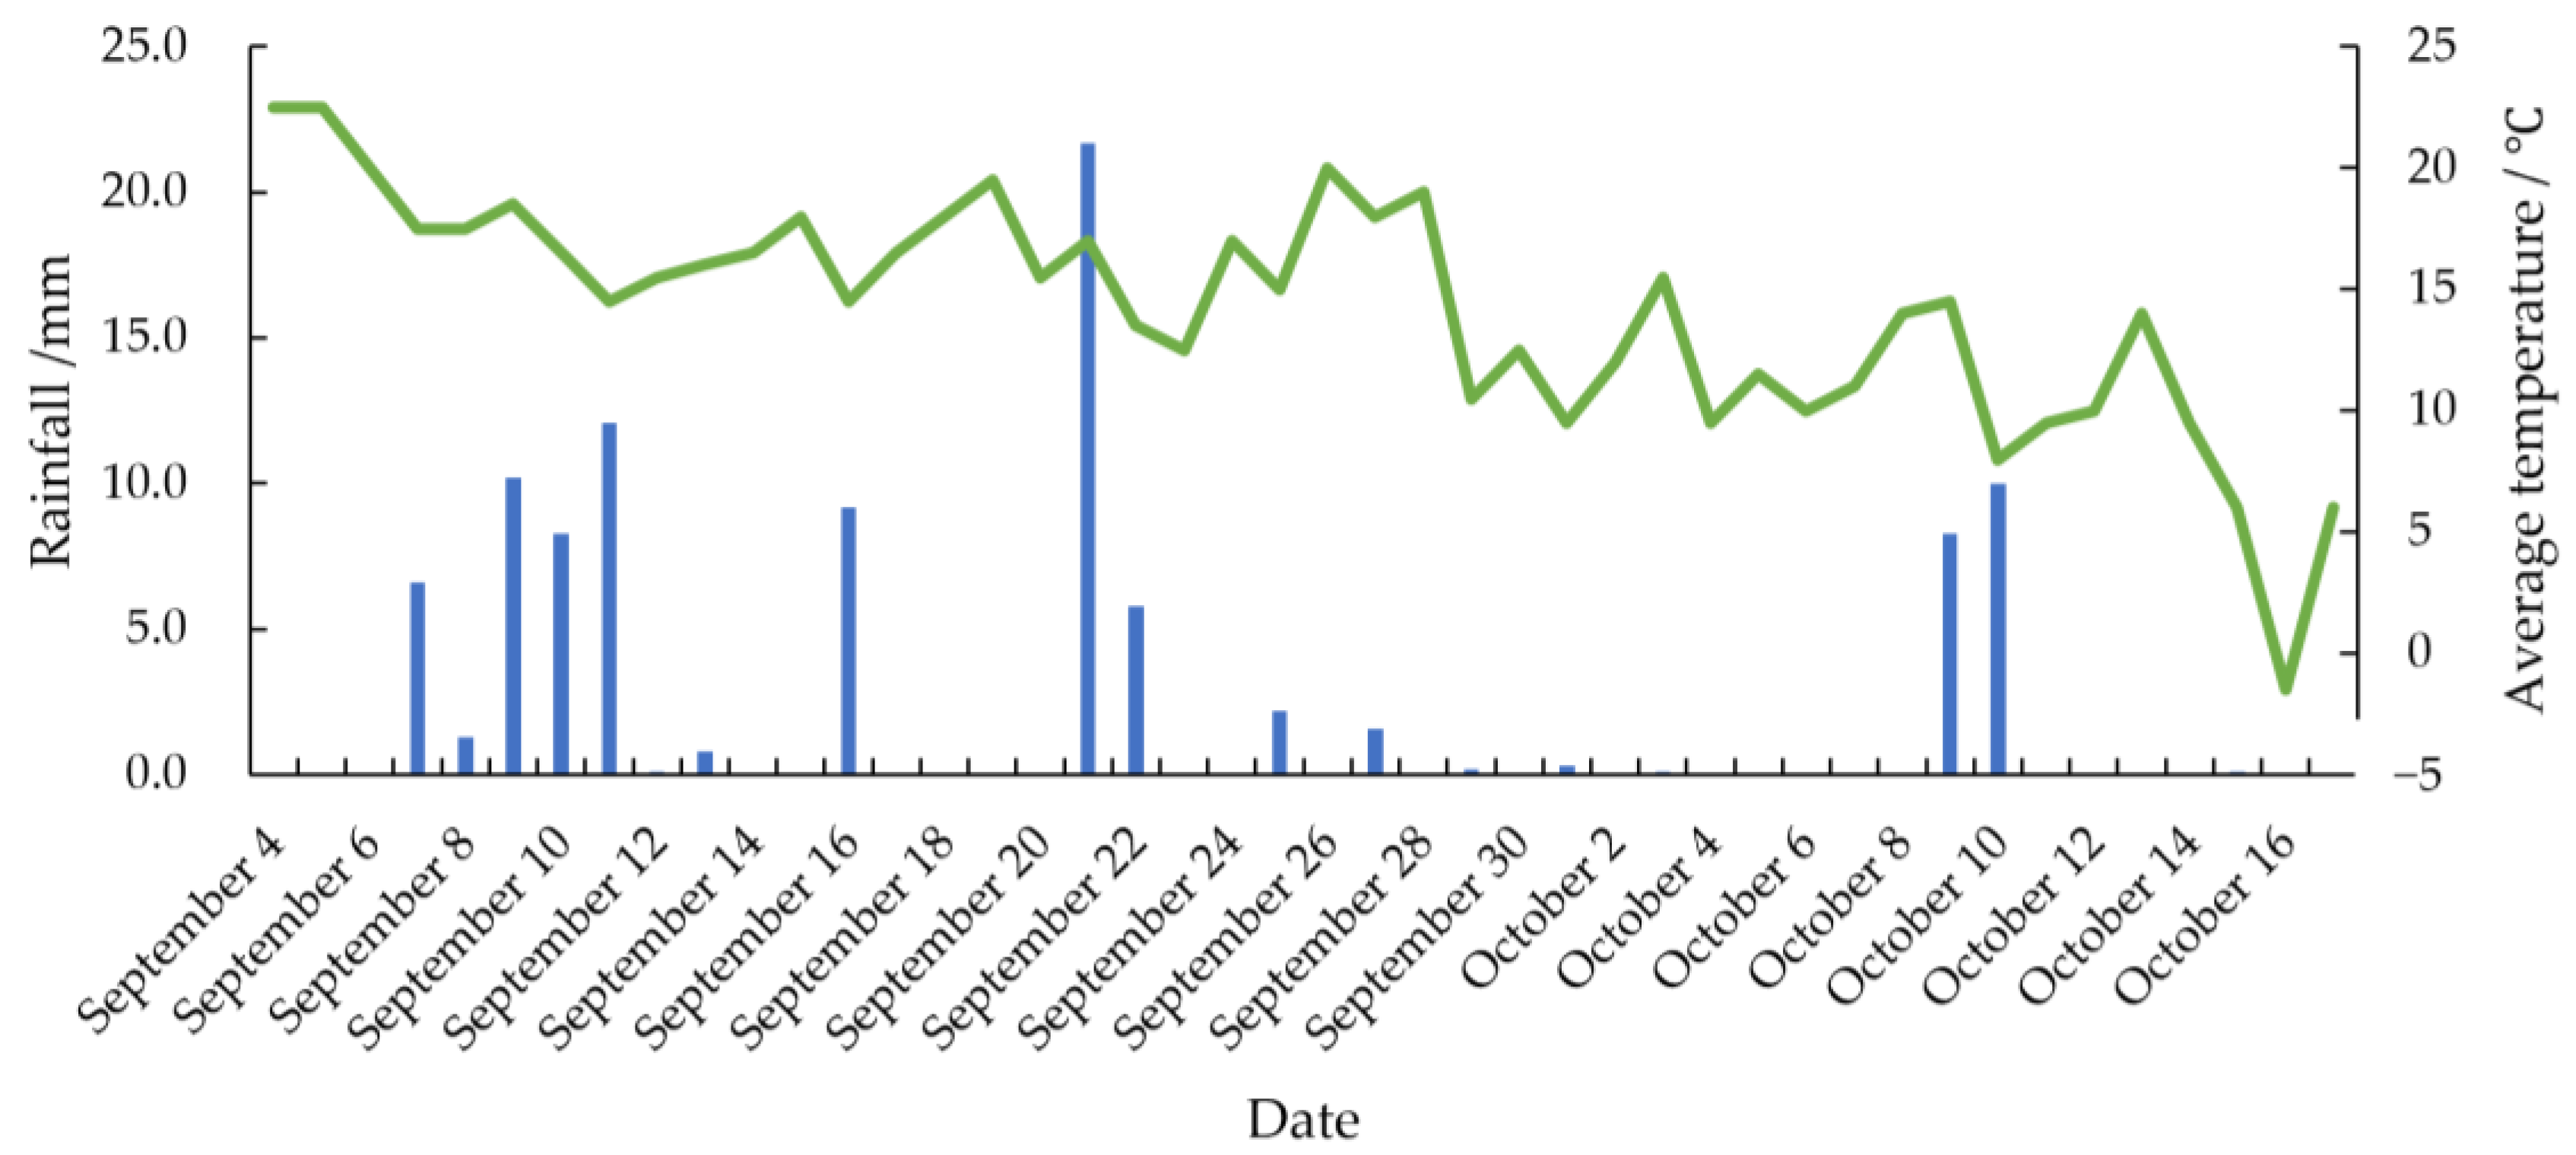
2.1. Plot Location and Test Materials
2.2. Collection of Experimental Samples
2.3. Data Processing and Statistical Analyses
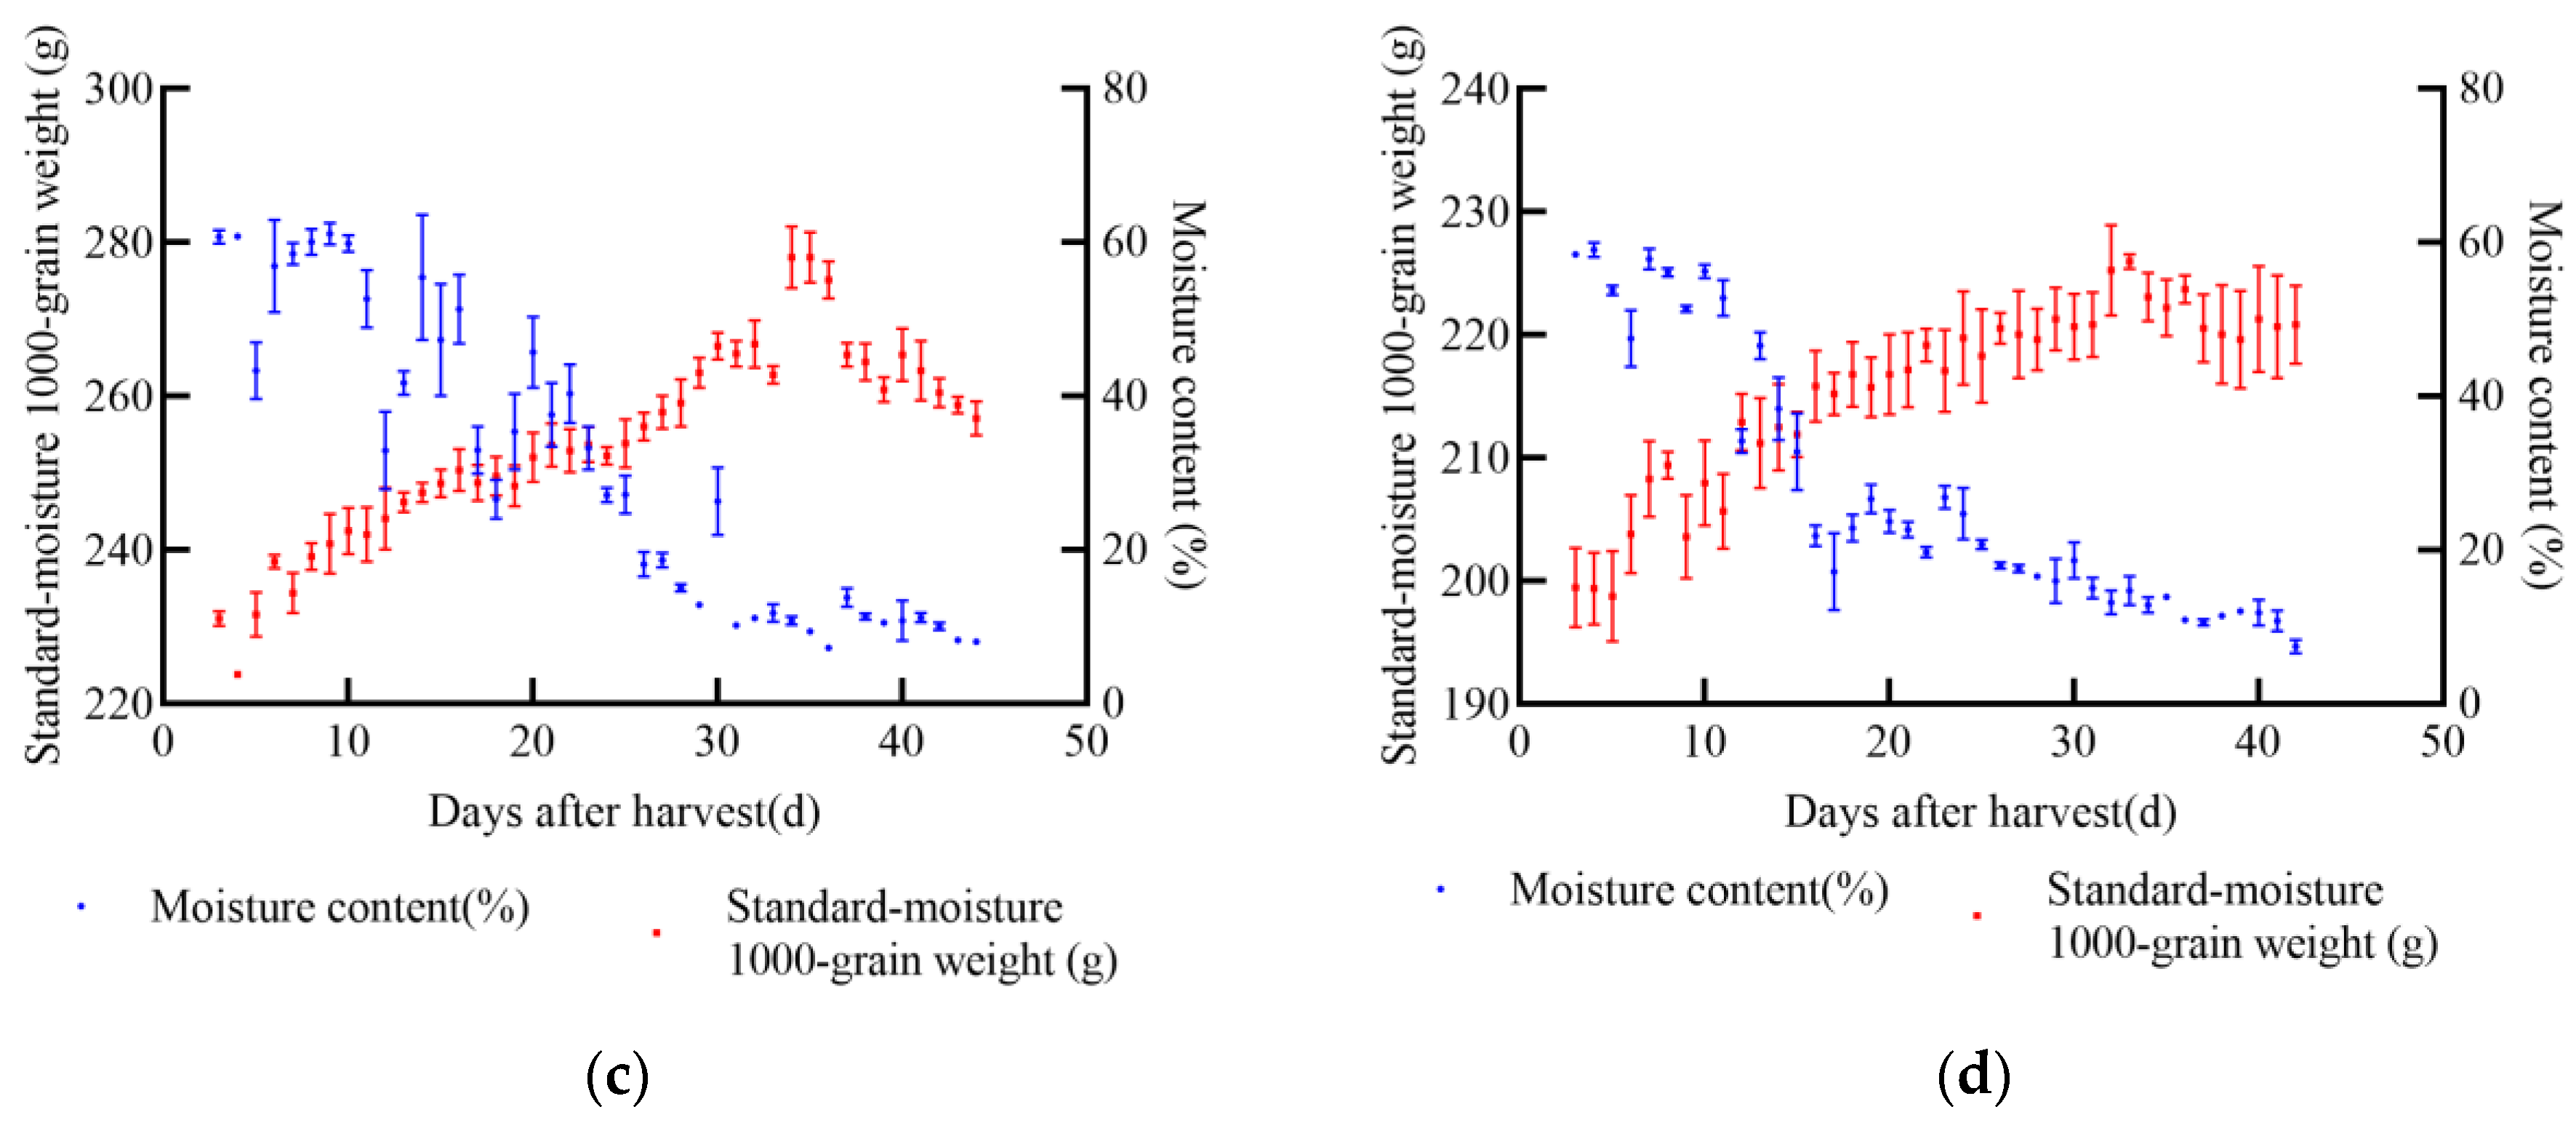
2.3.1. Determination of Standard Moisture 1000-Grain Weight
2.3.2. Latent Dry Matter Loss and Loss Rate
2.3.3. Determination of Antioxidant Enzyme Activity
SOD Enzyme Activity
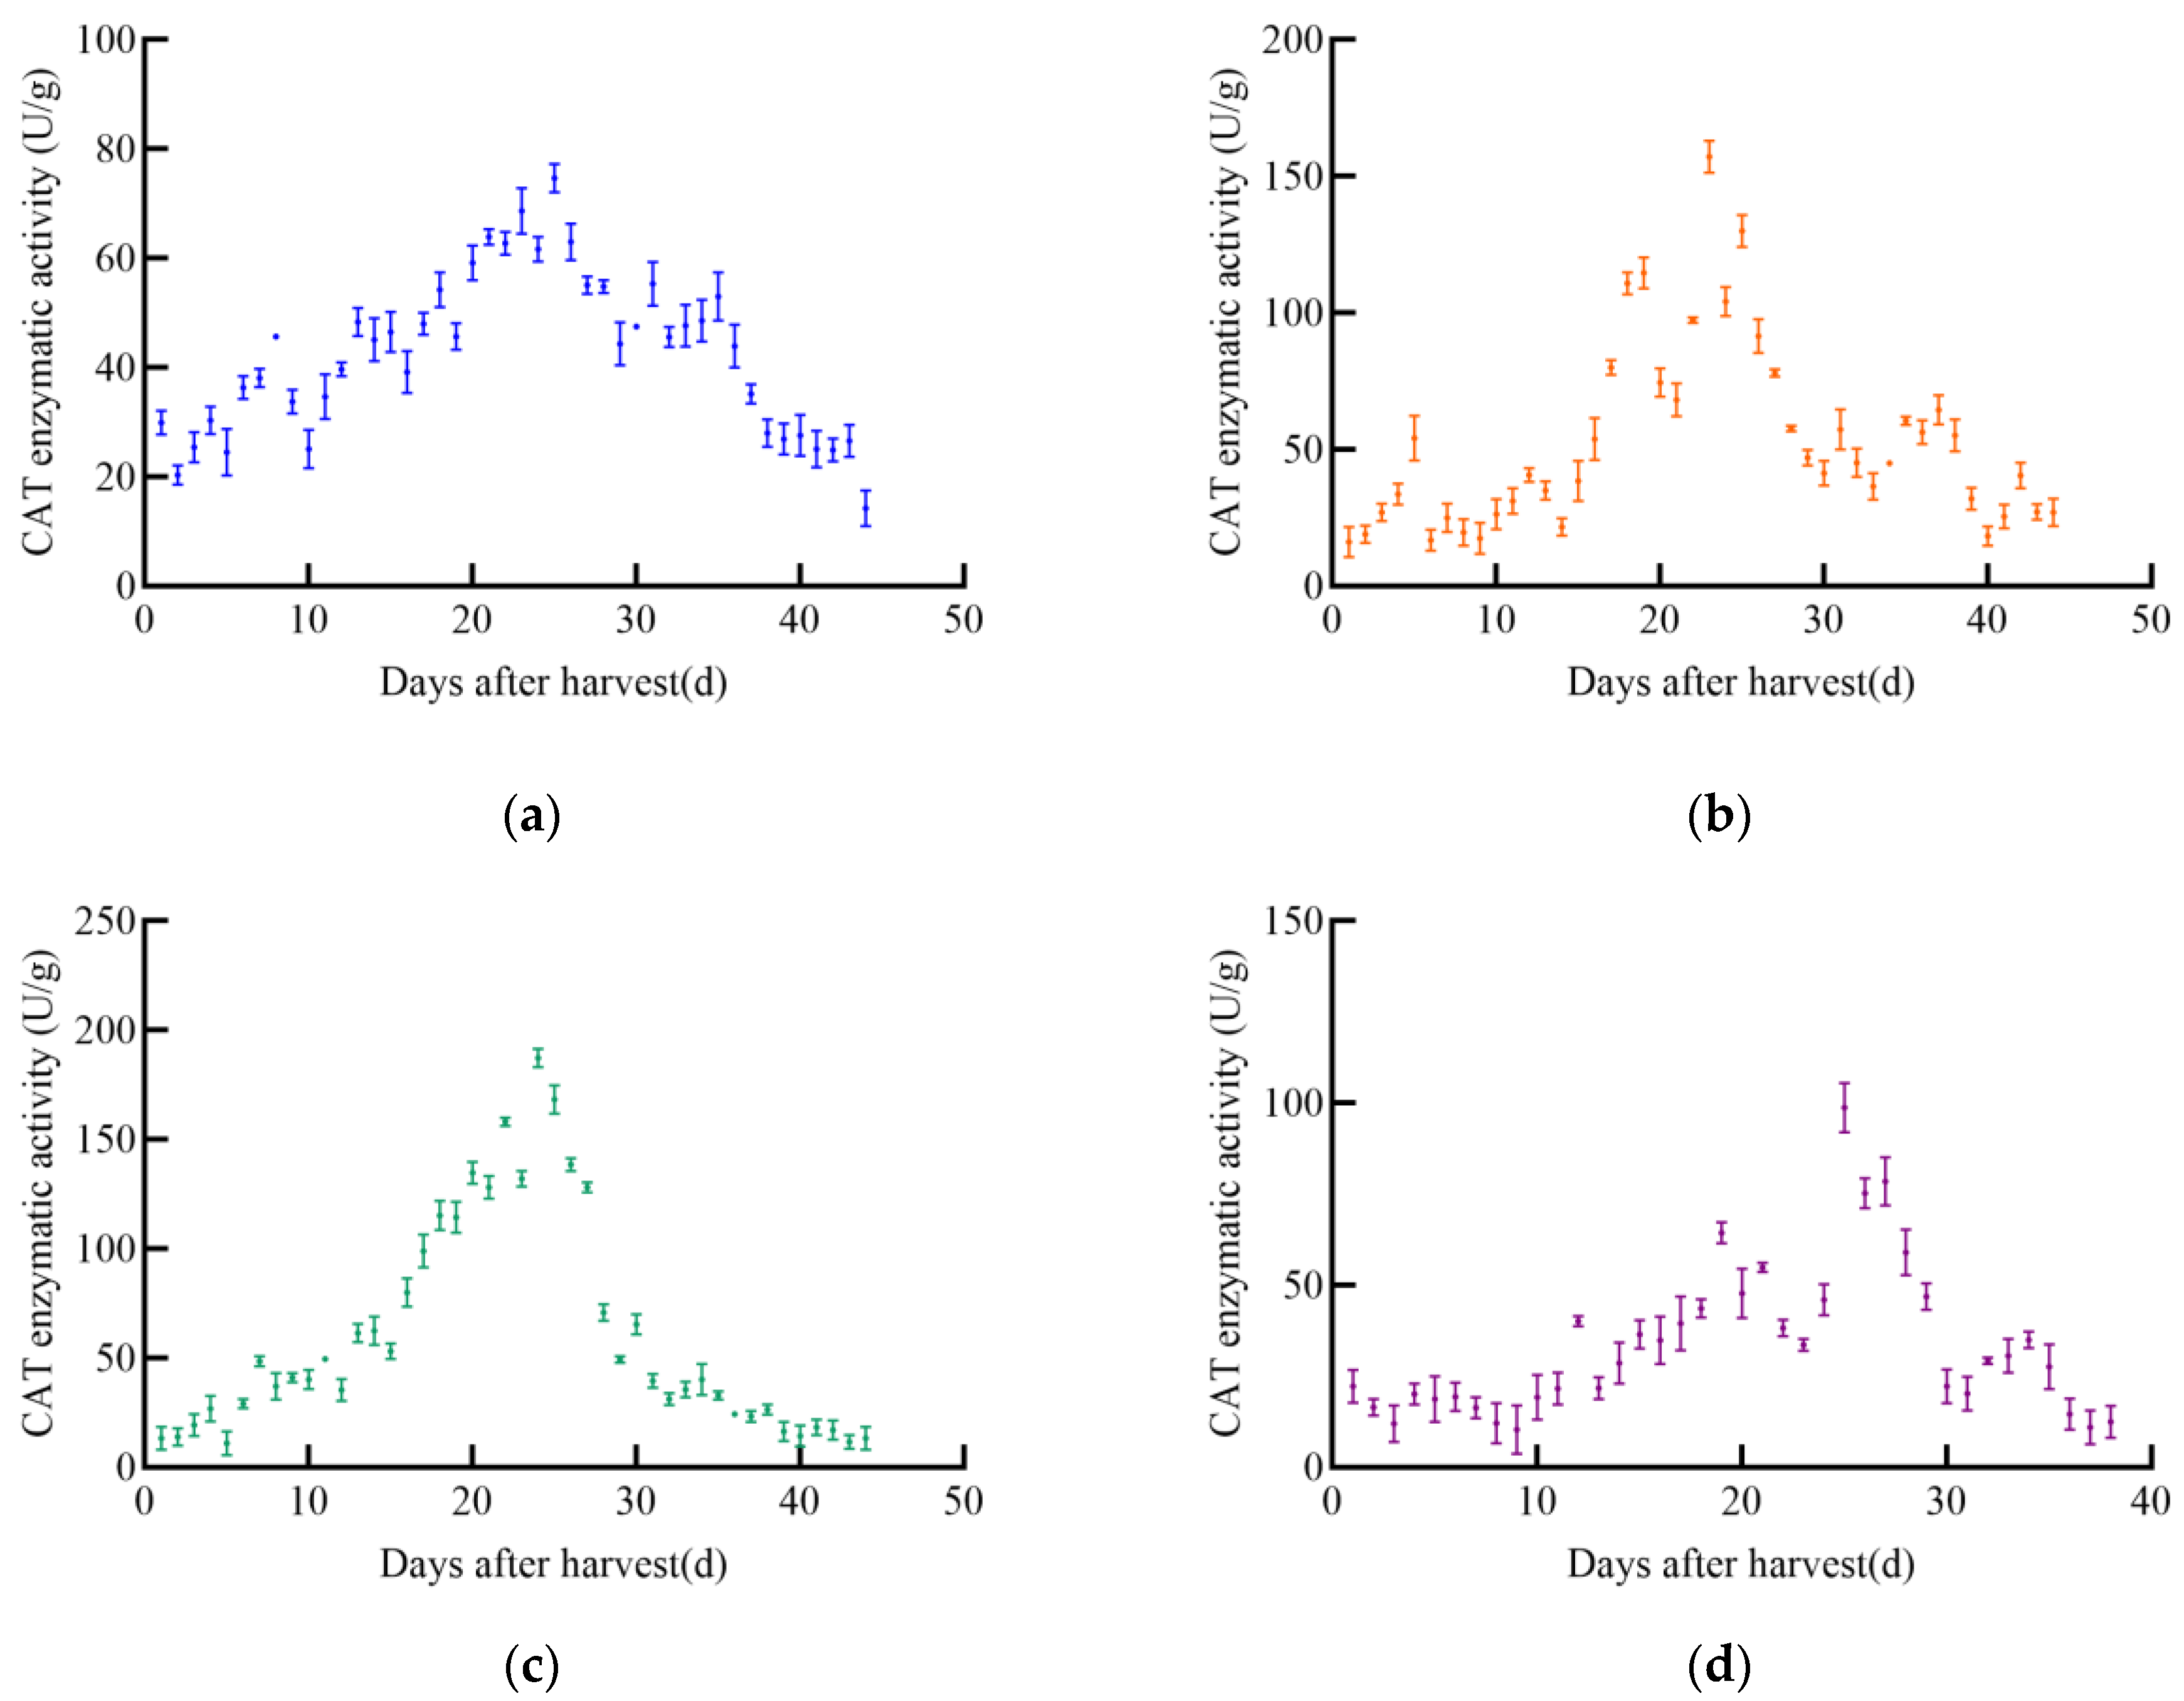
CAT Enzyme Activity
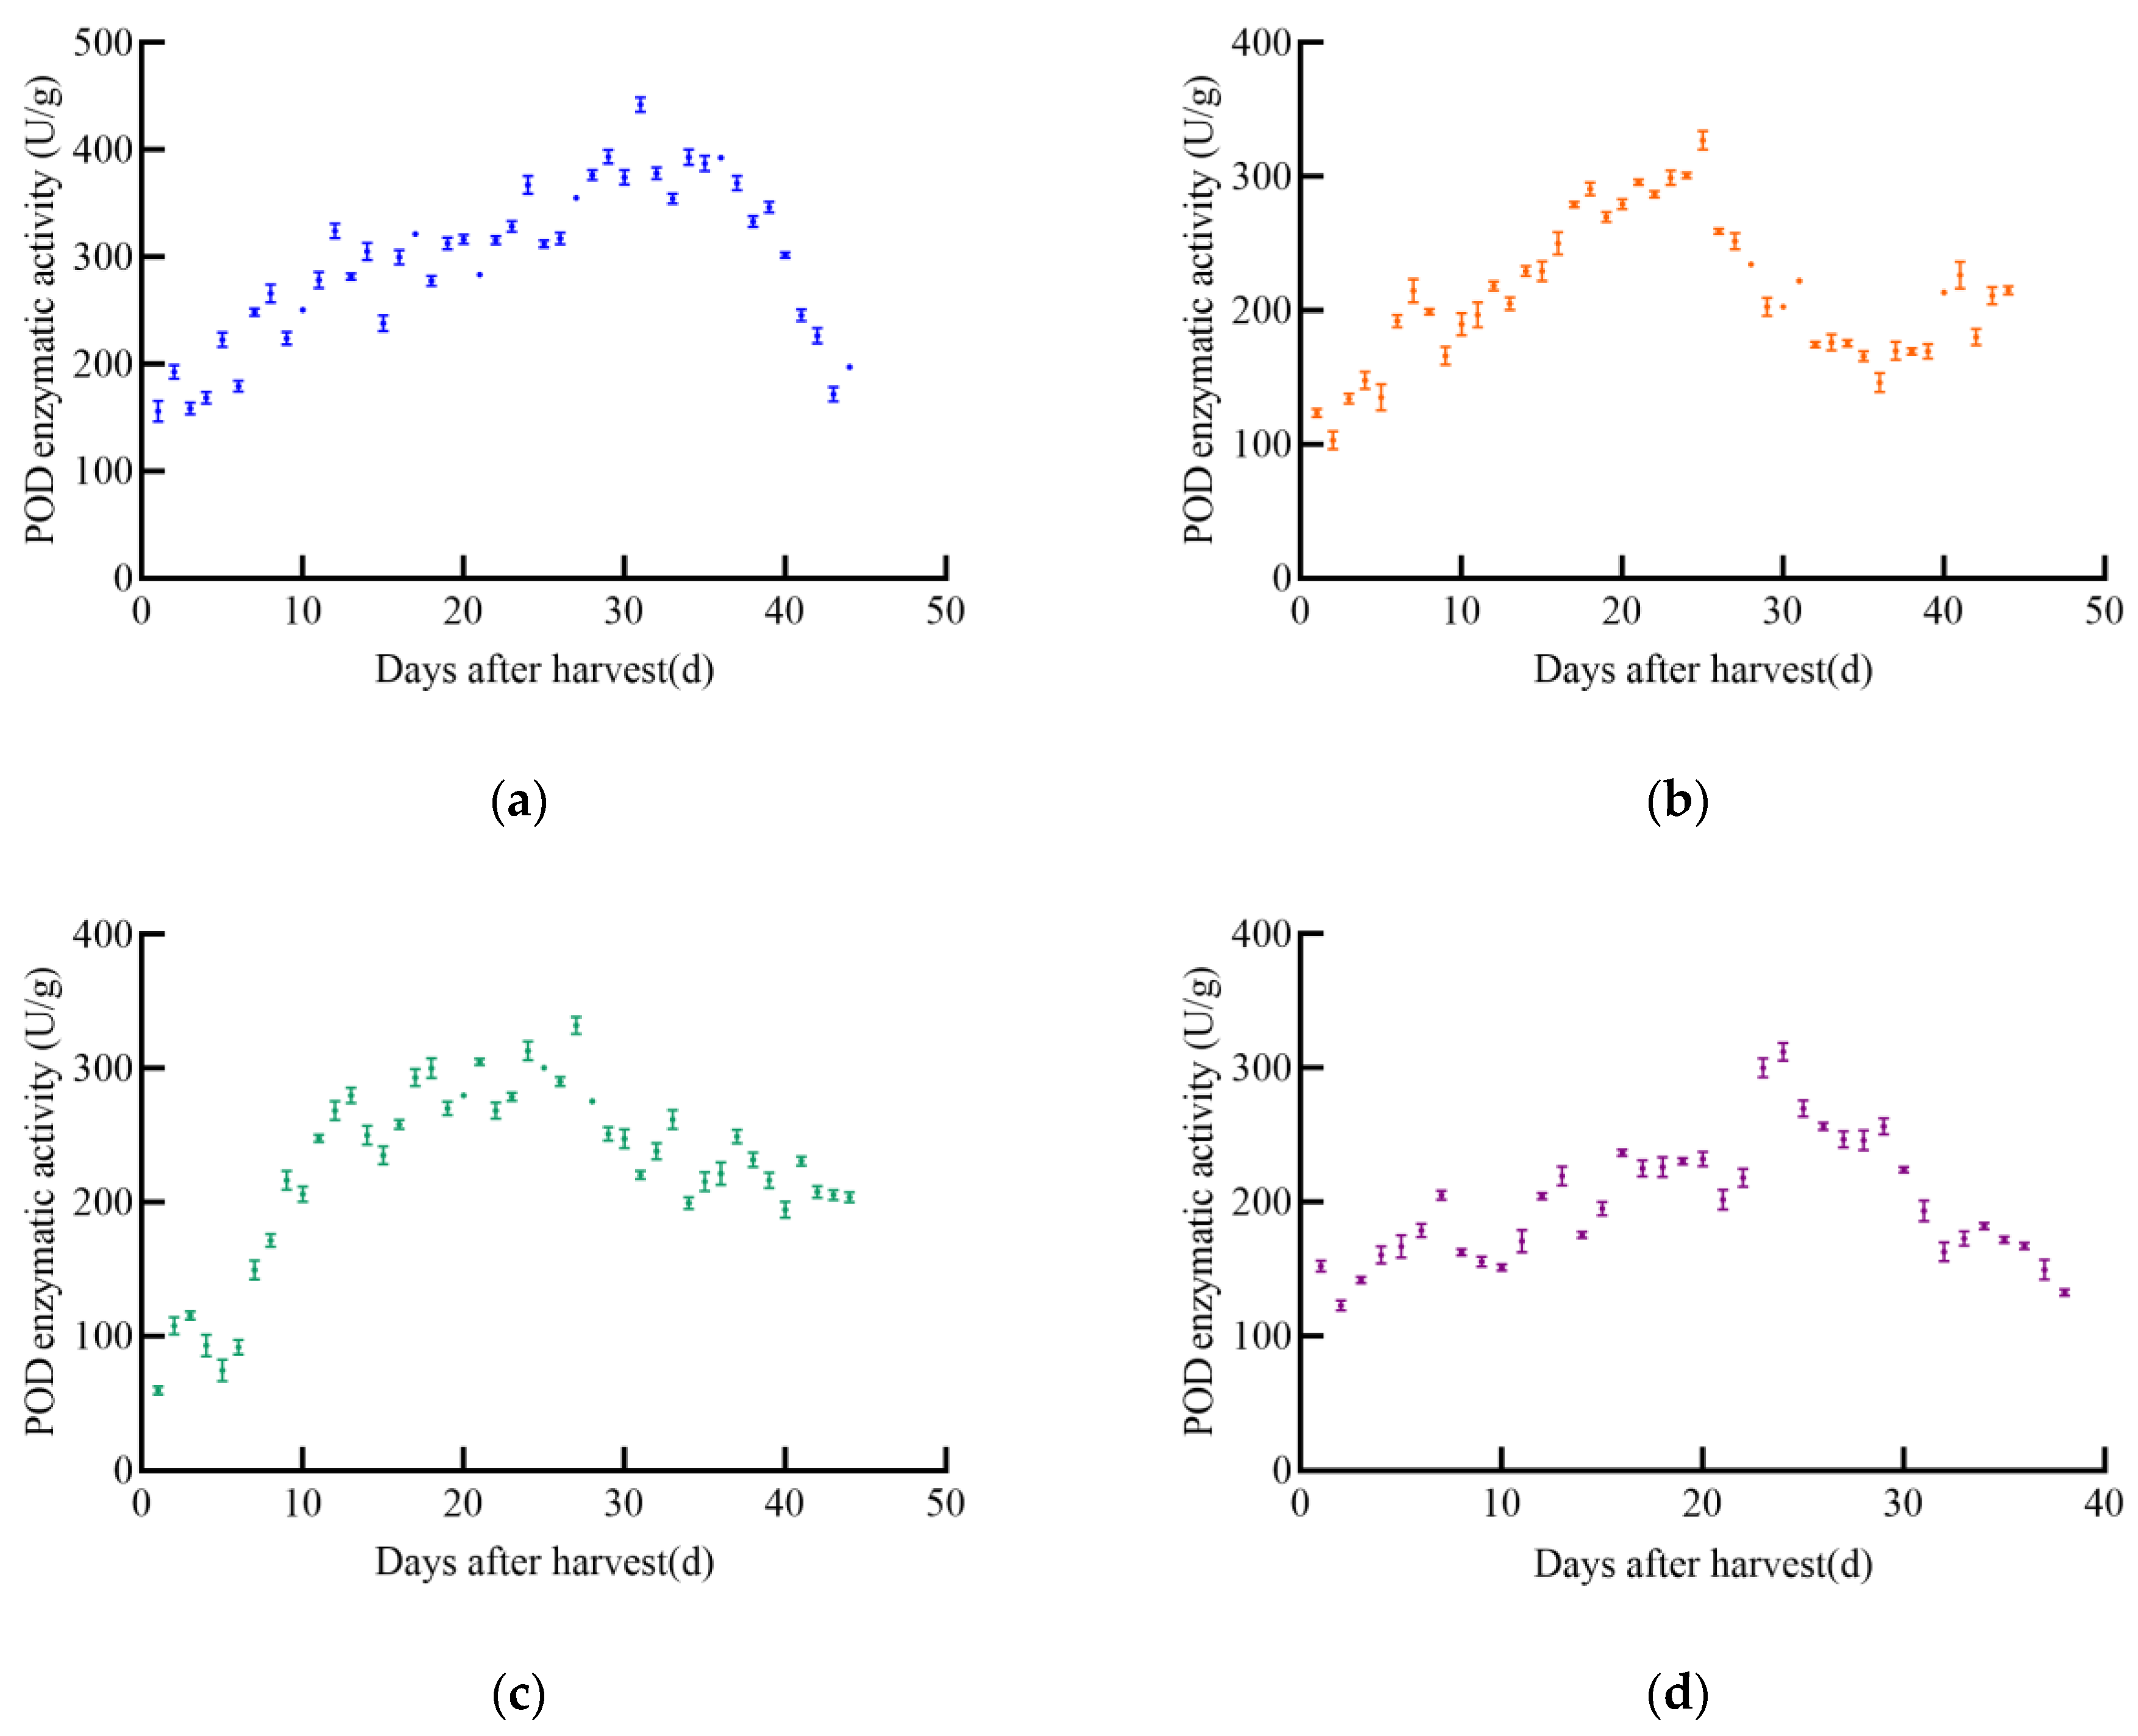
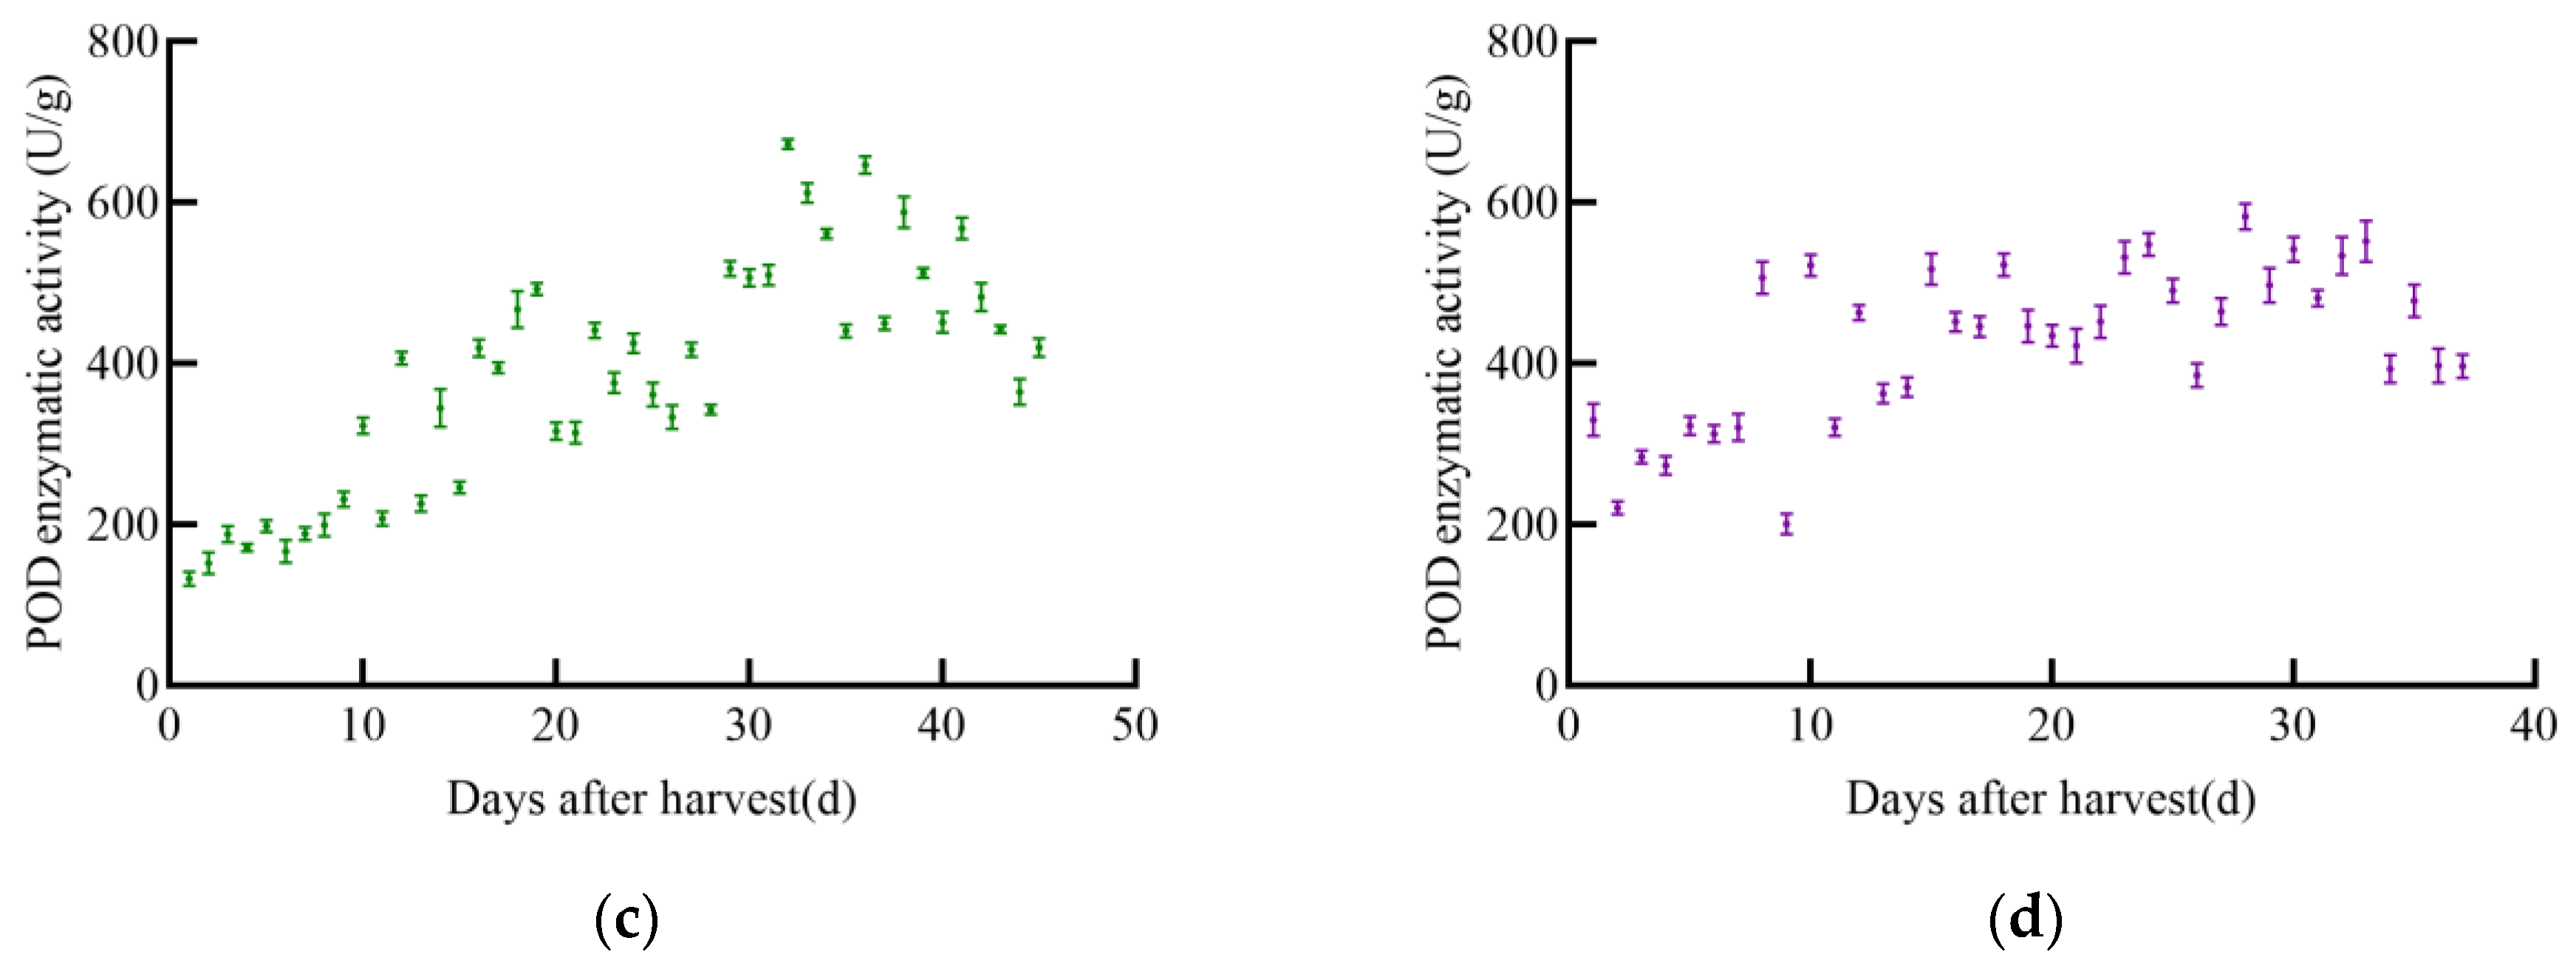
POD Enzyme Activity
3. Results
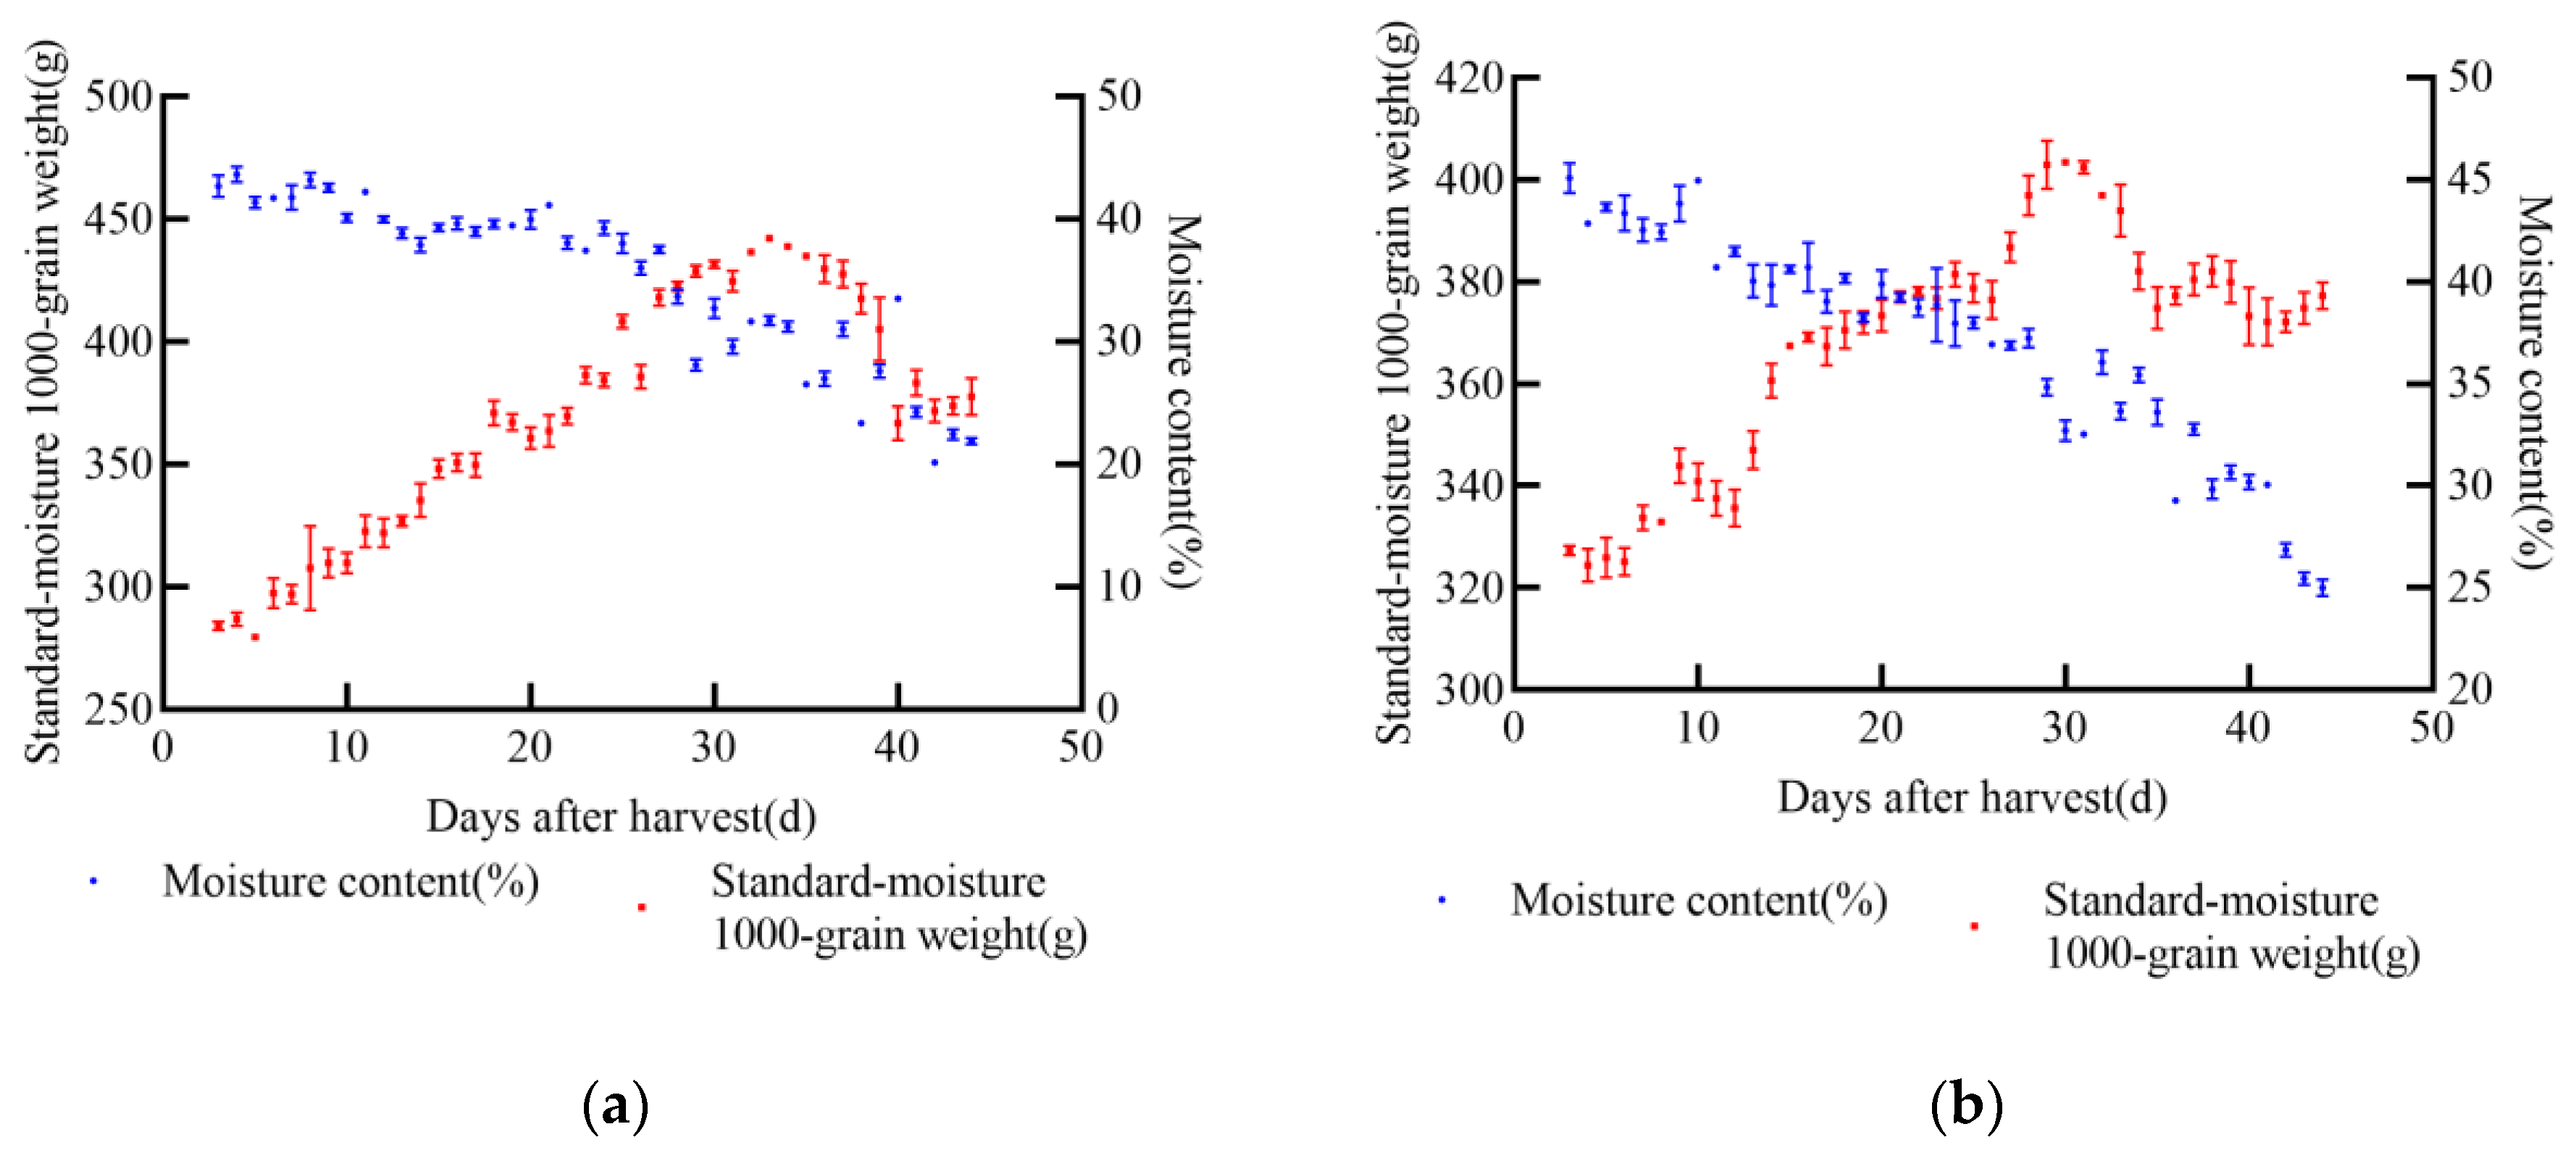
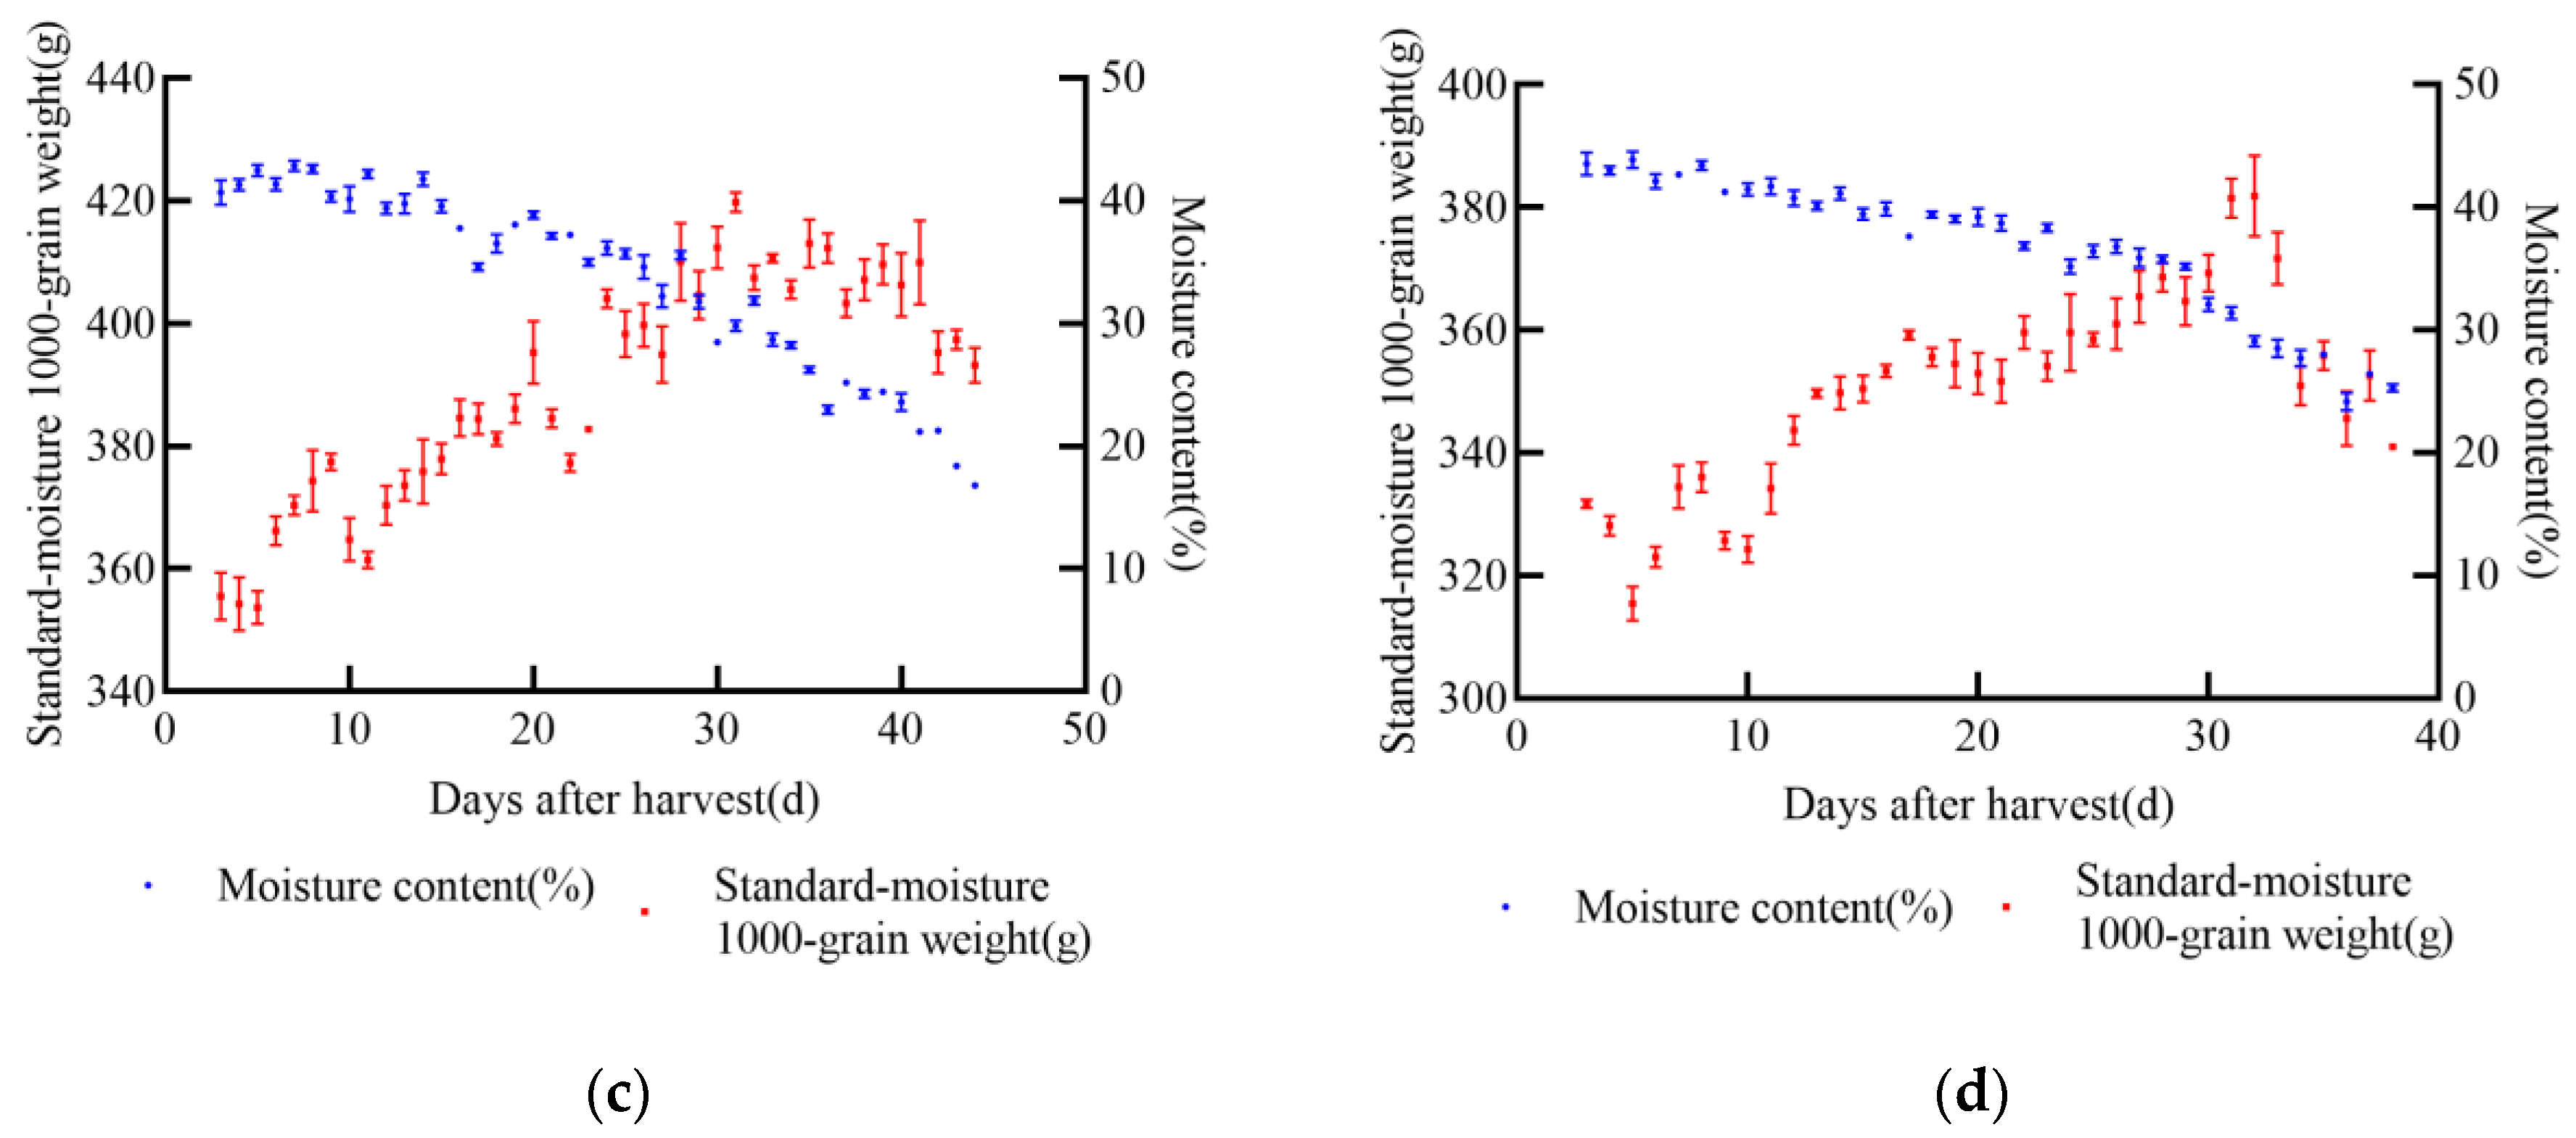
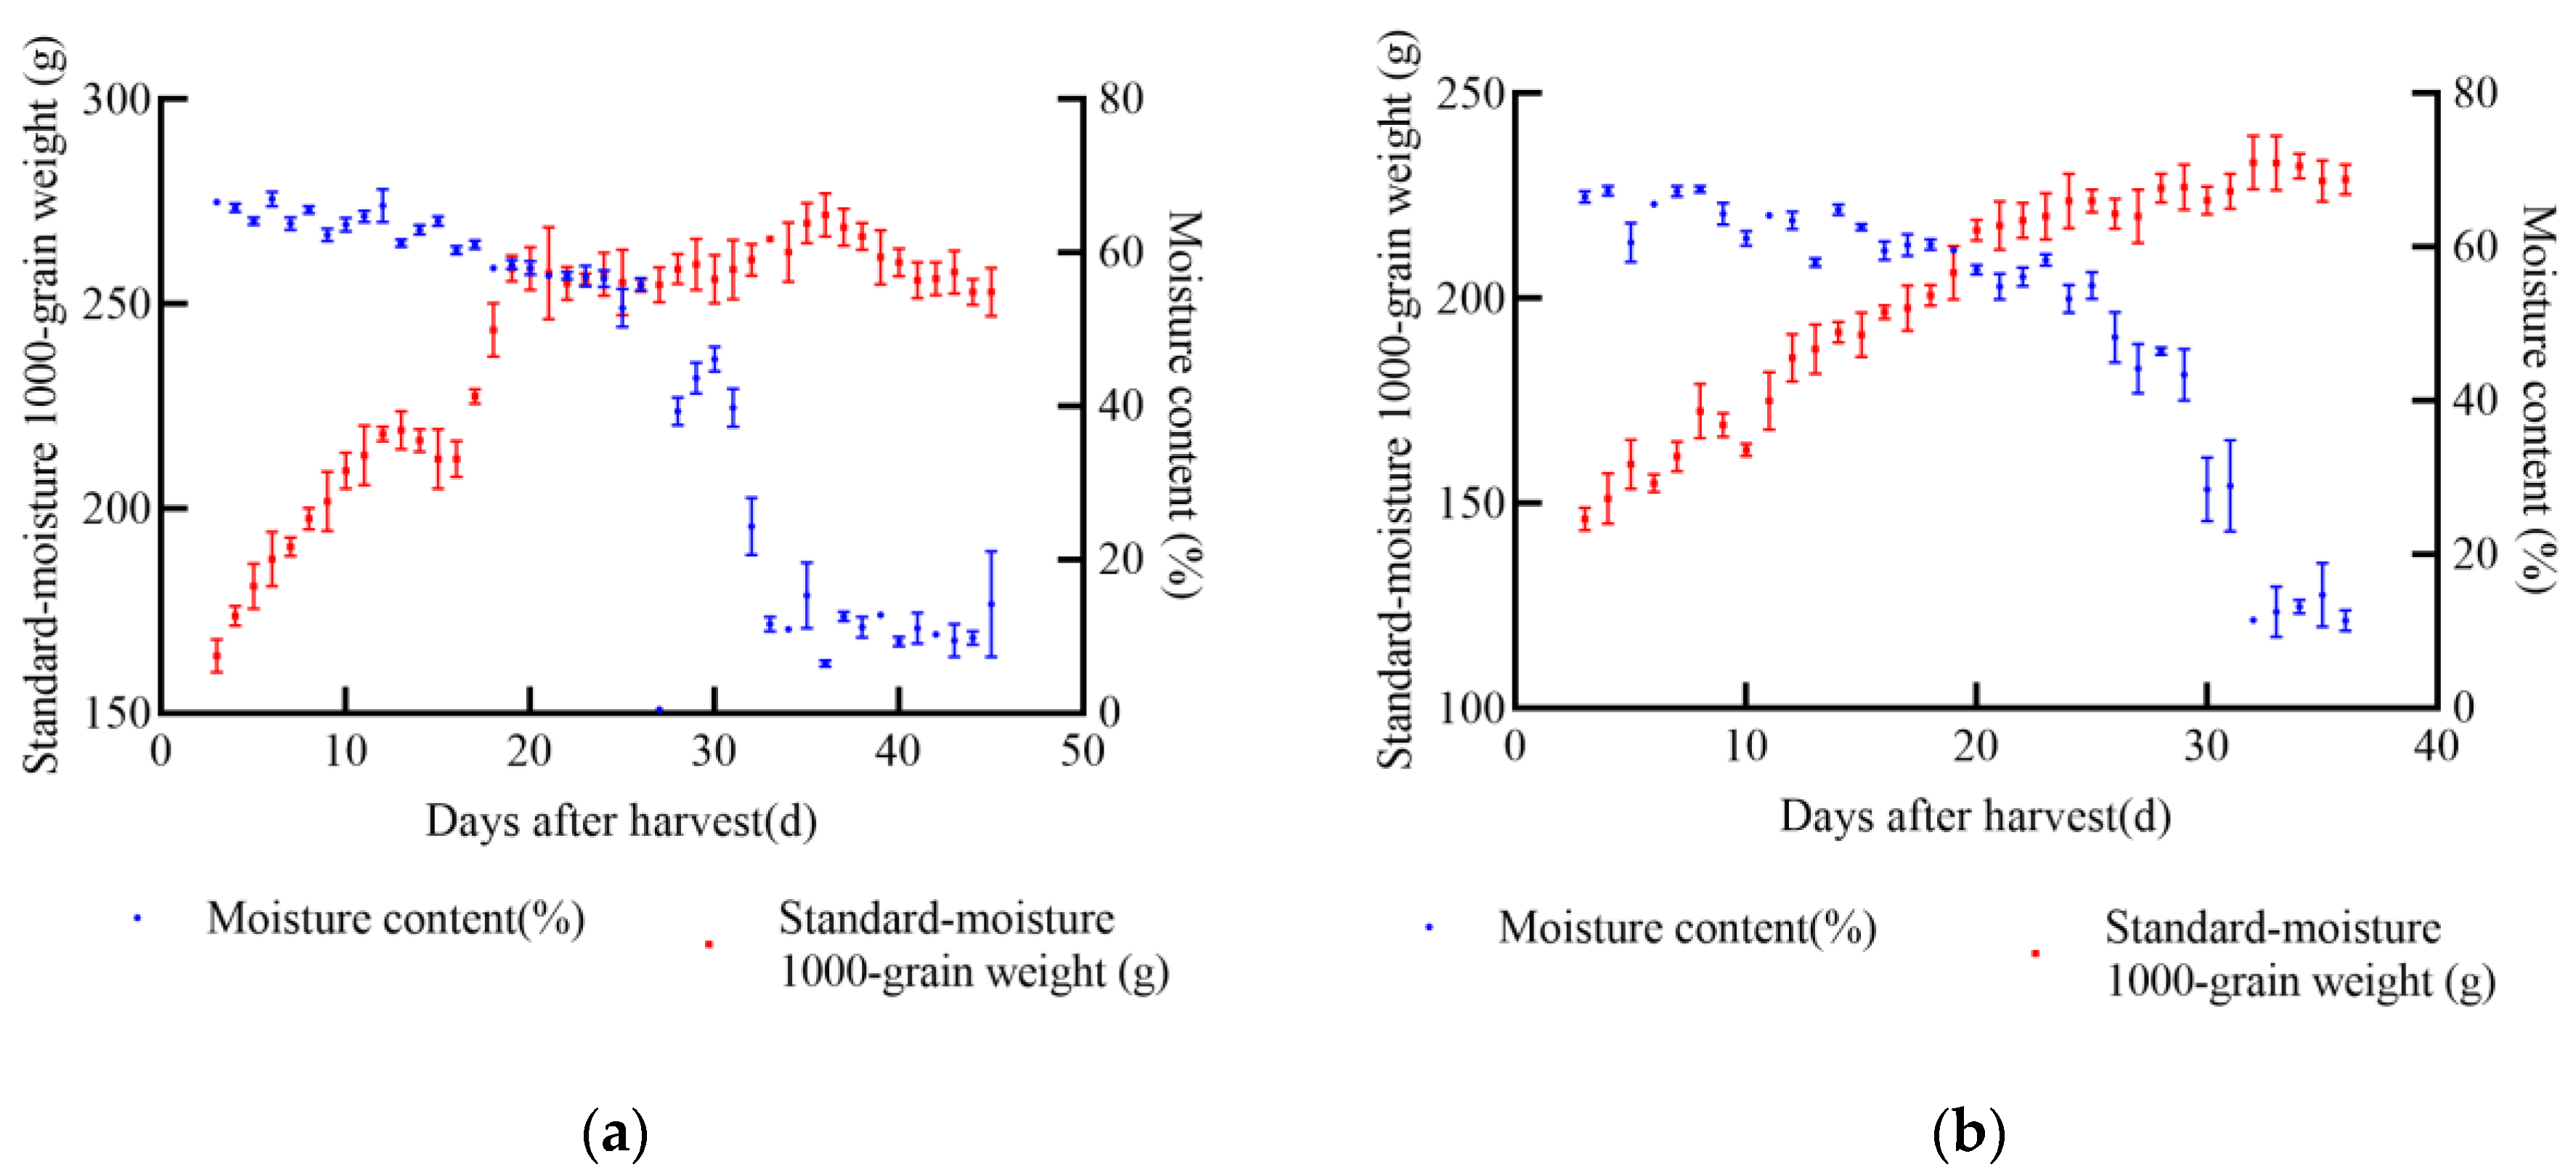
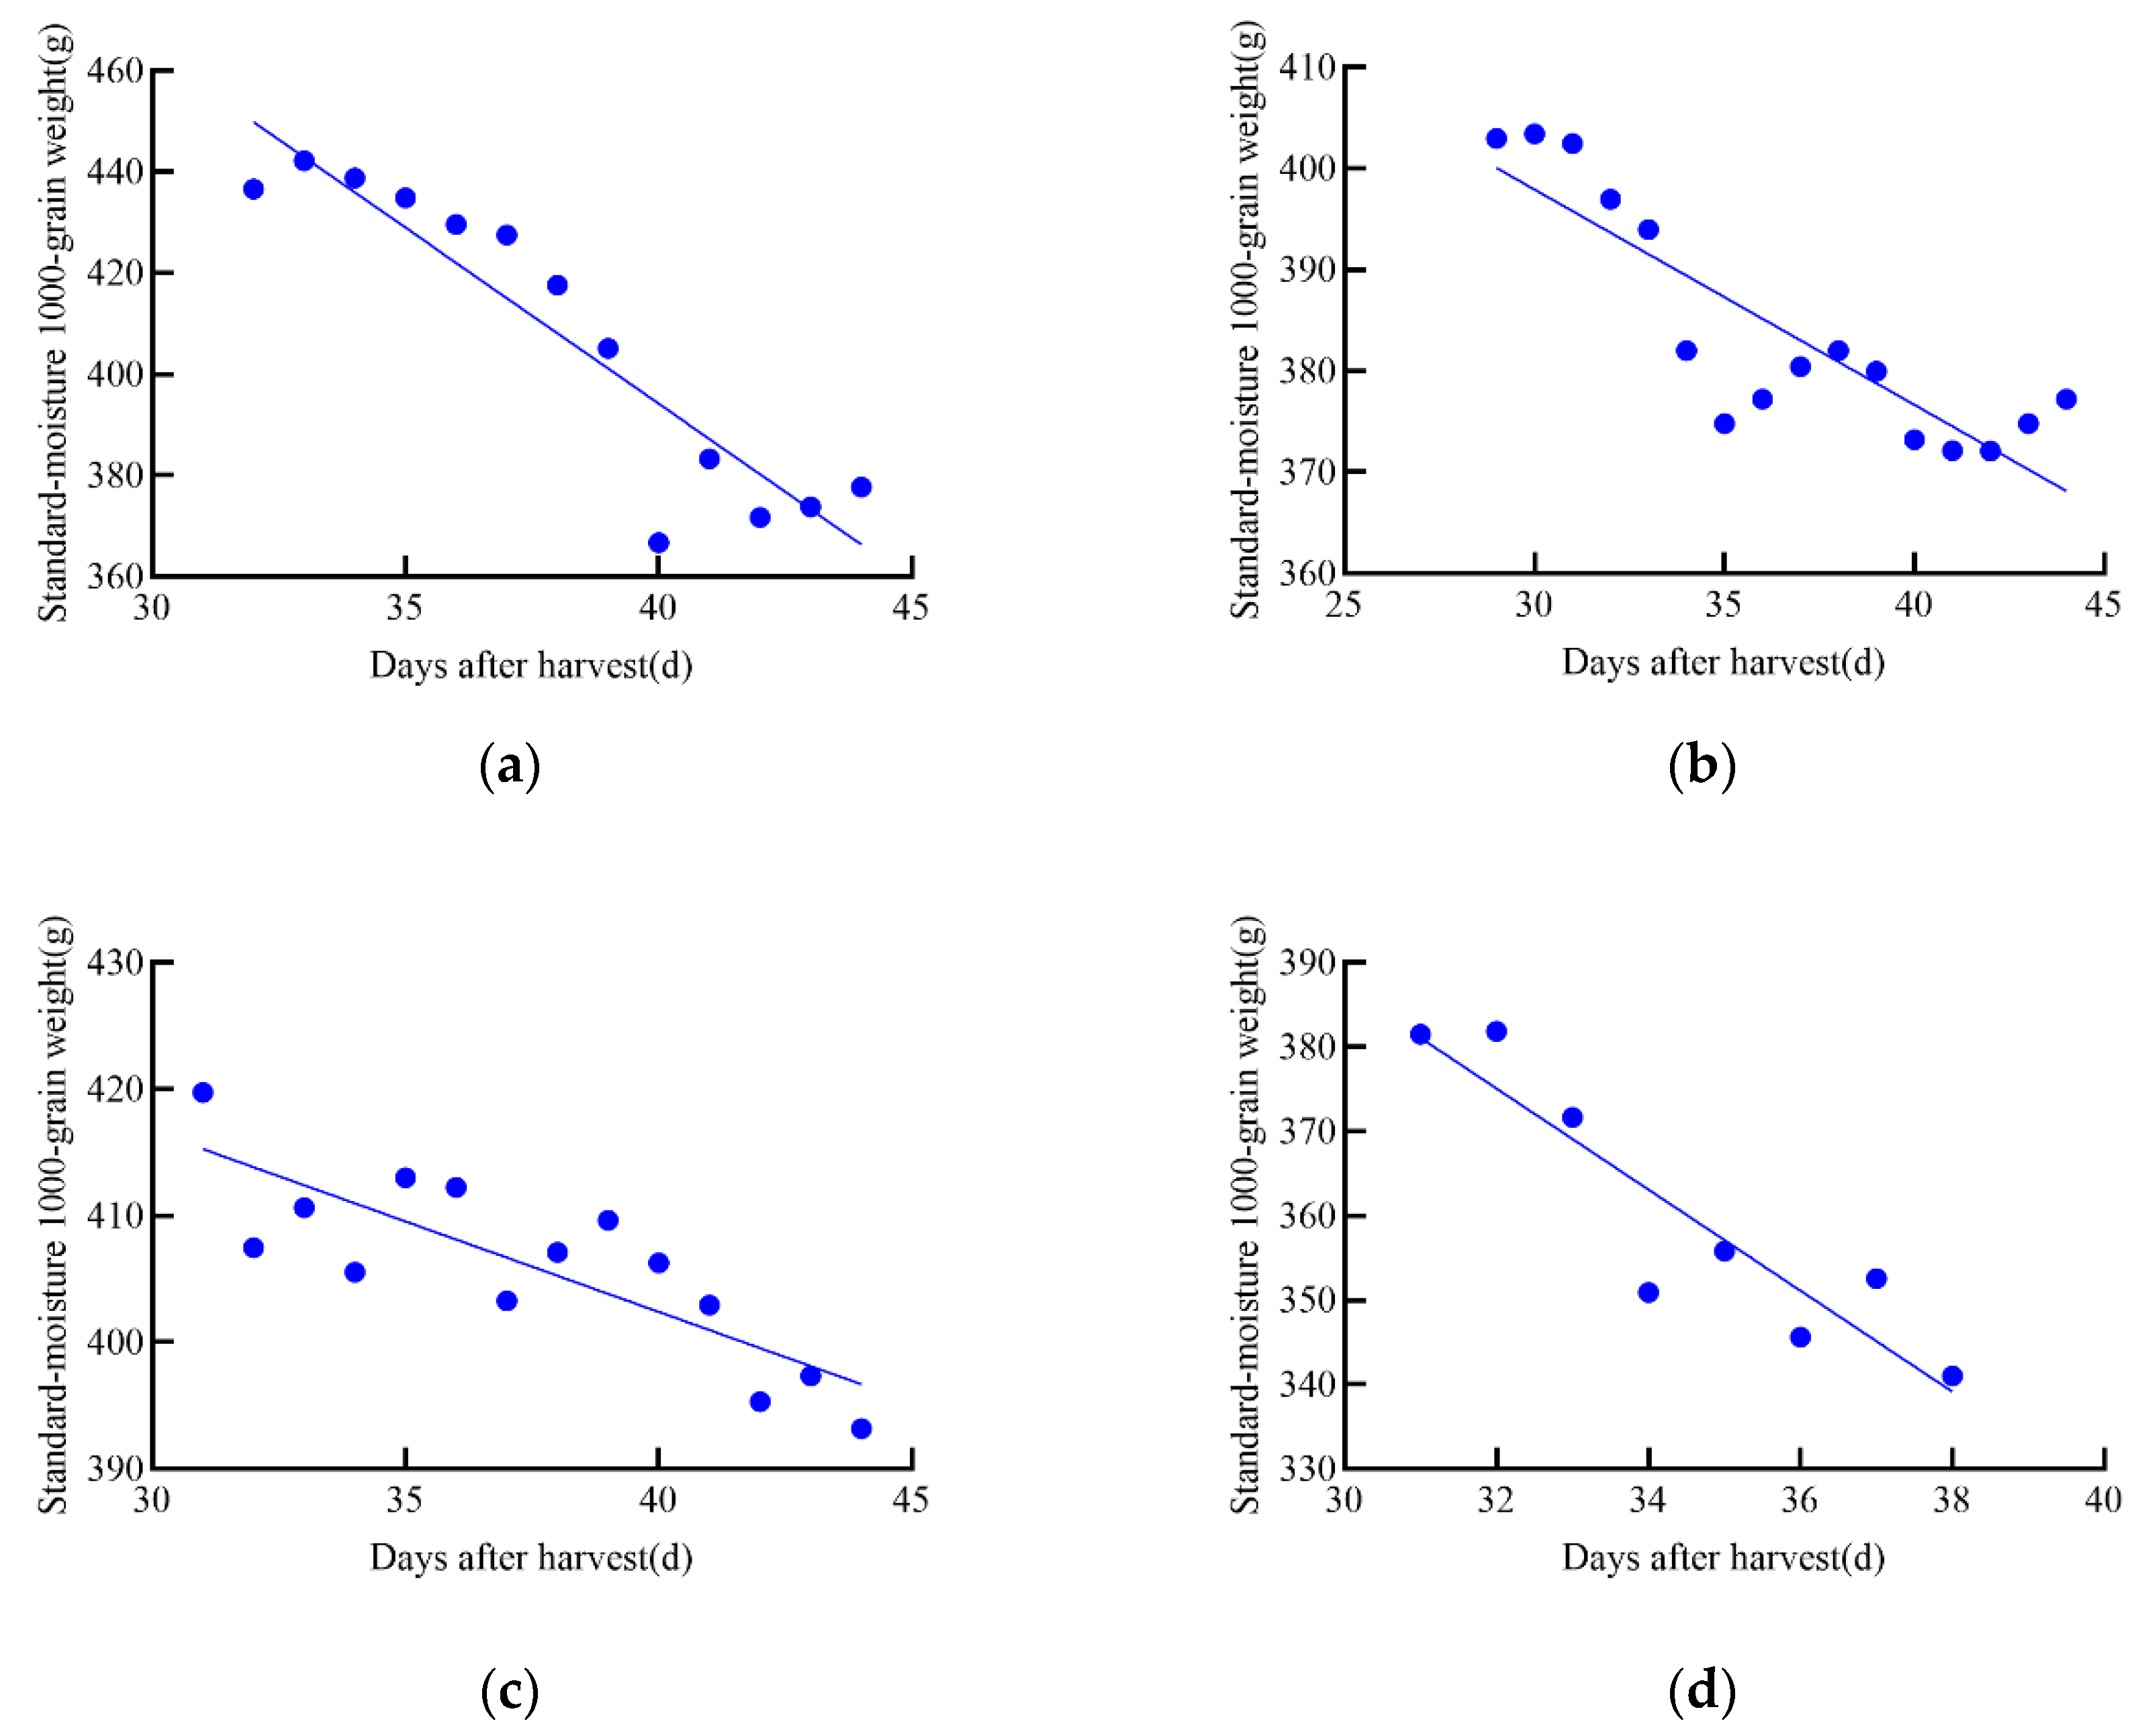
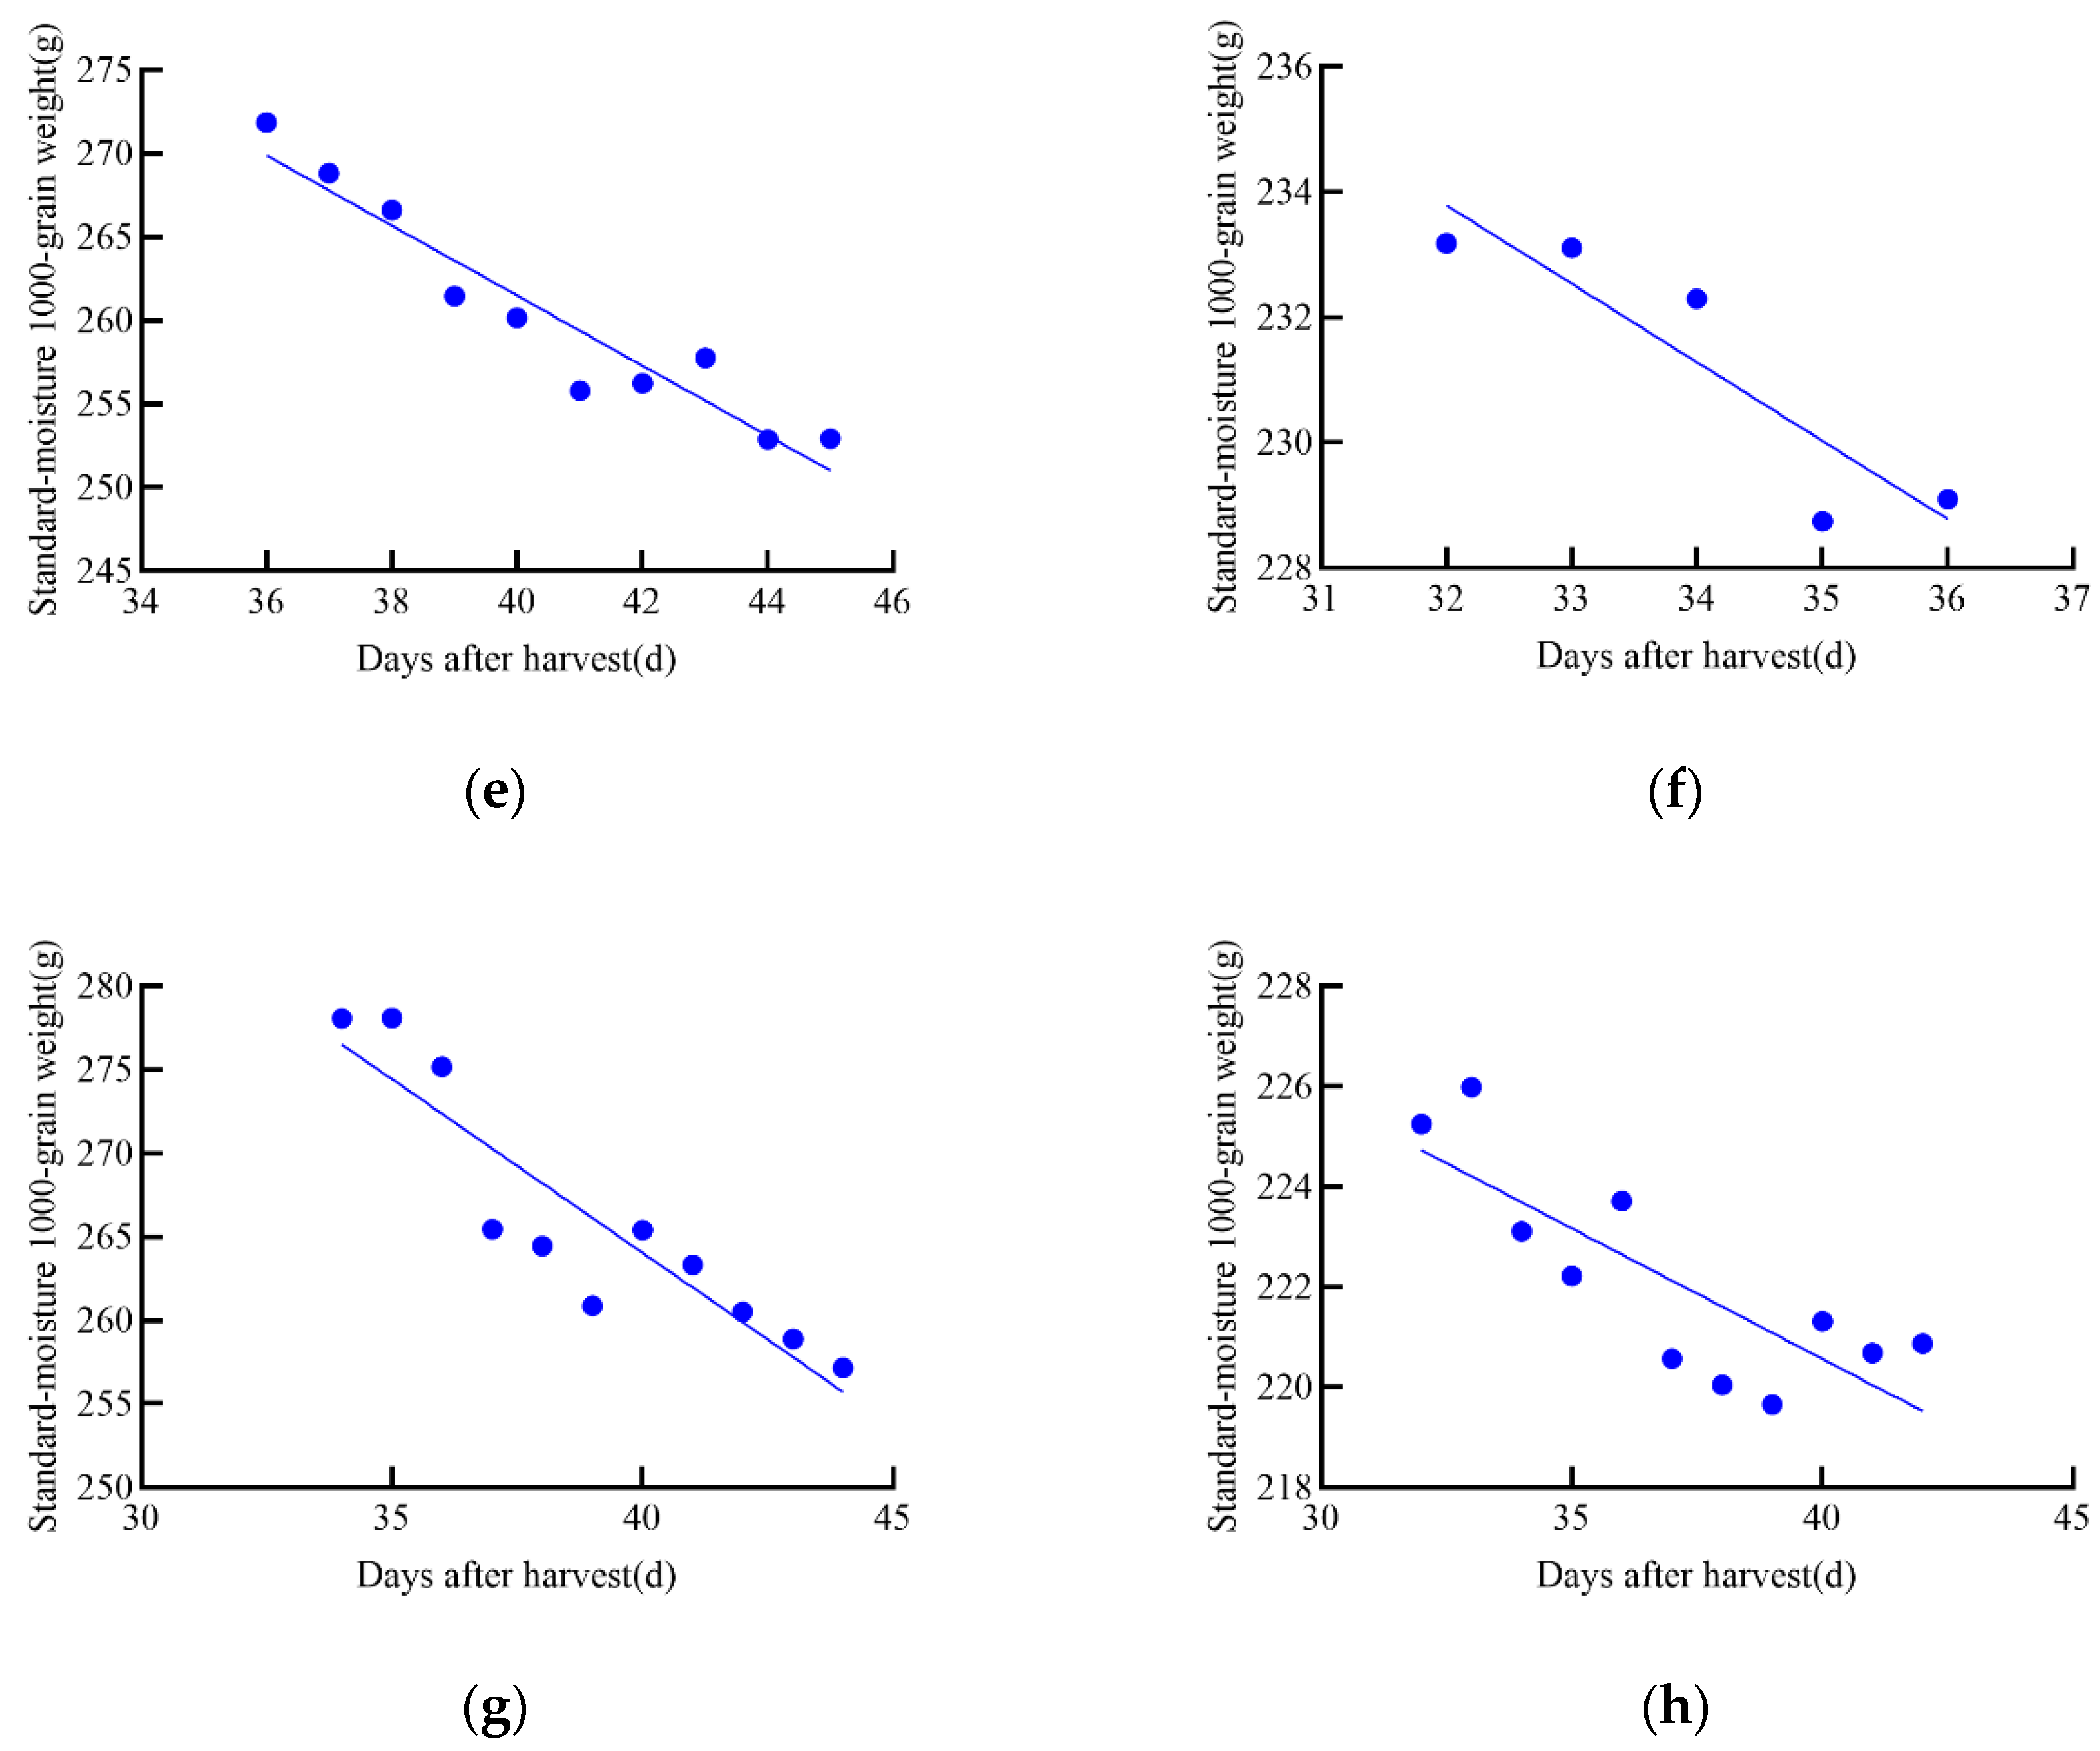
3.1. Determination Results of the Standard Moisture 1000-Grain Weight and Moisture Content of Grain
3.2. Determination Results of Grain Antioxidant Enzyme Activity
3.2.1. Determination Results of POD
3.2.2. Determination Results of SOD
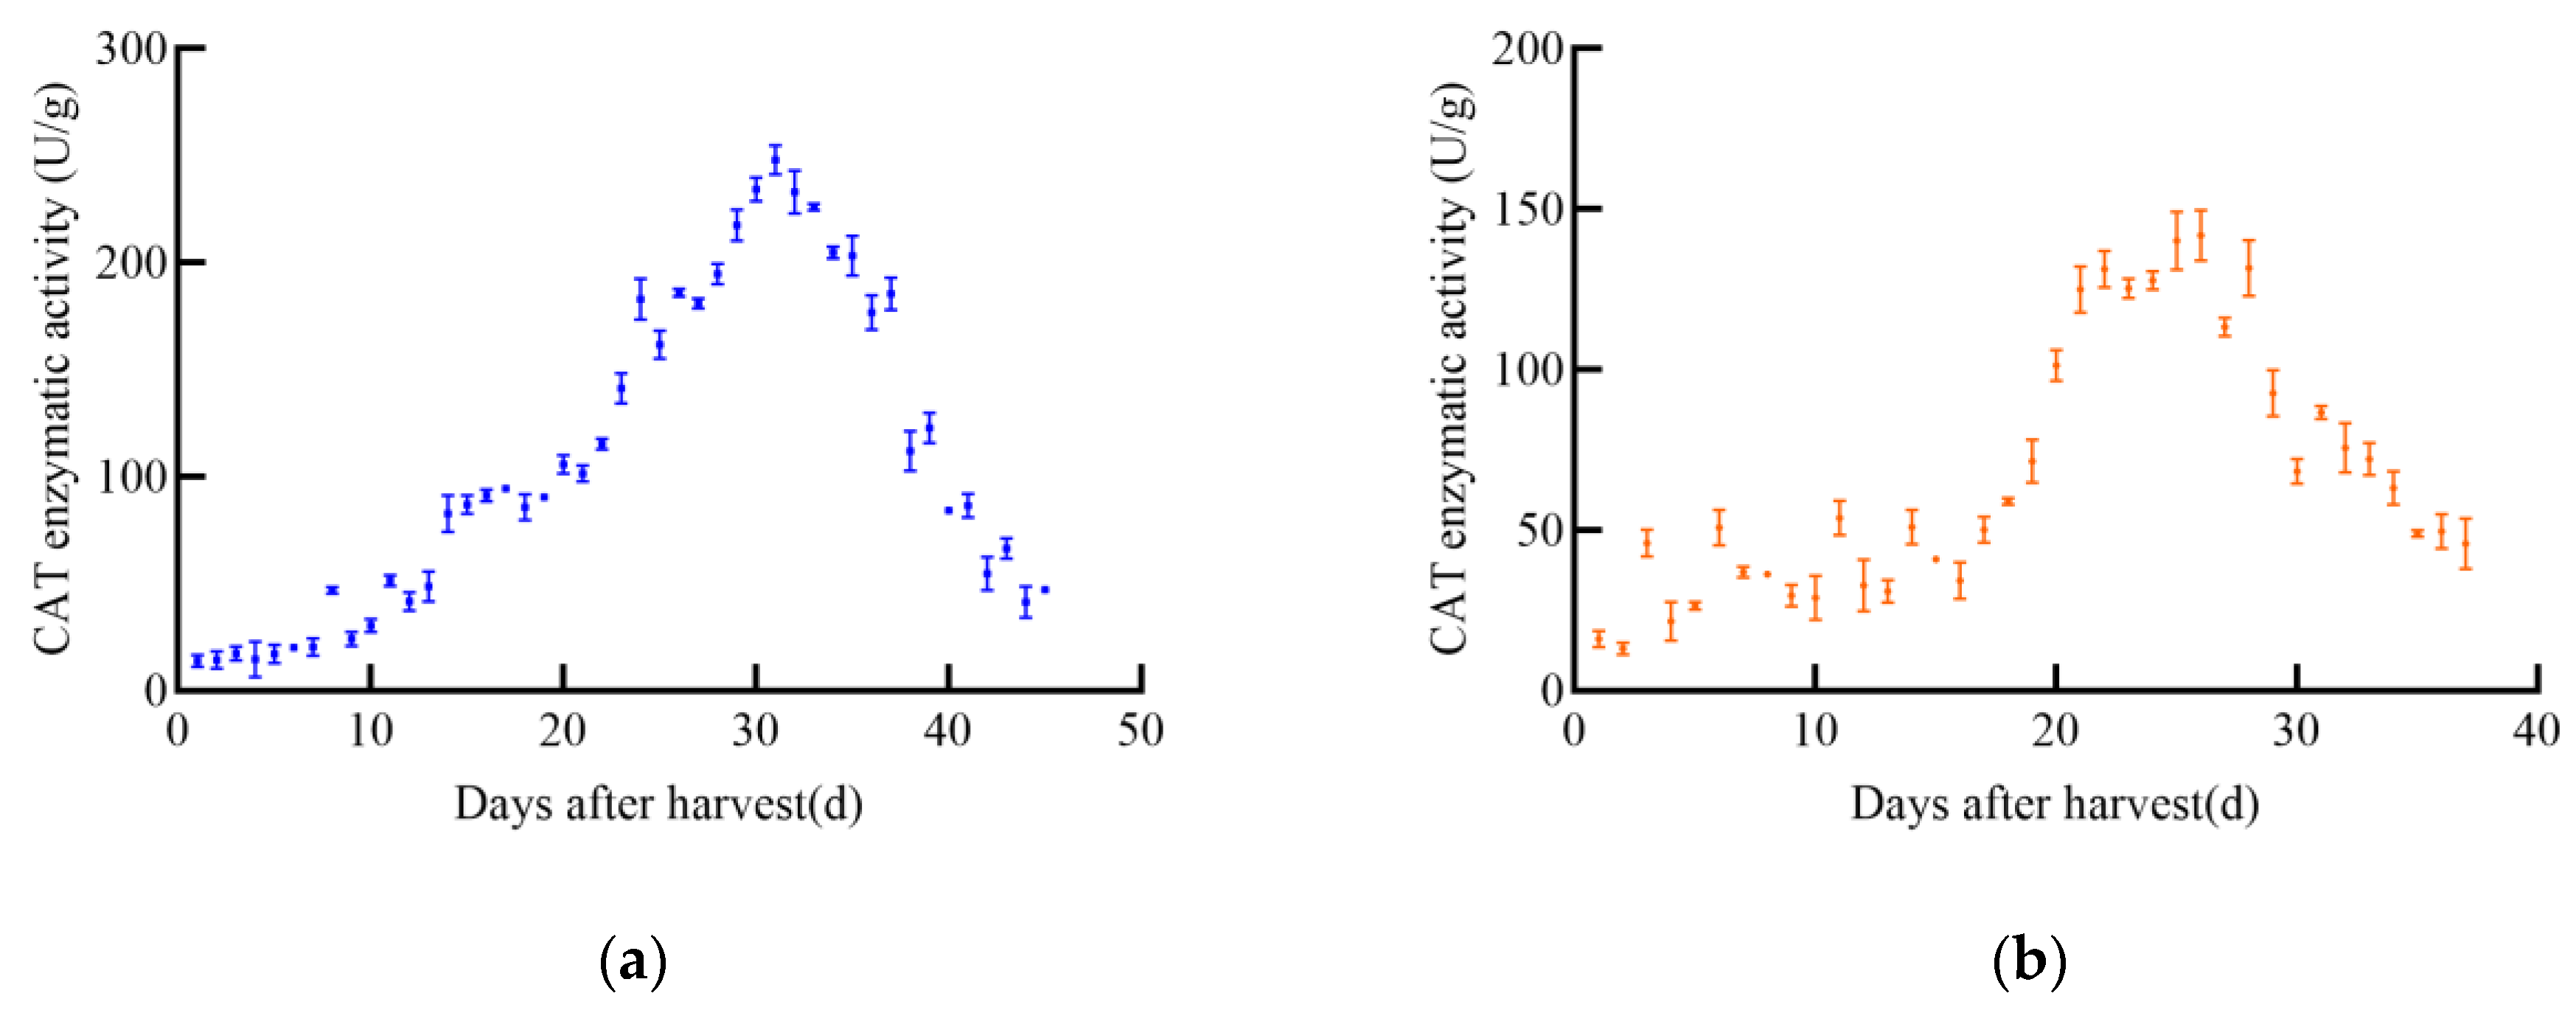
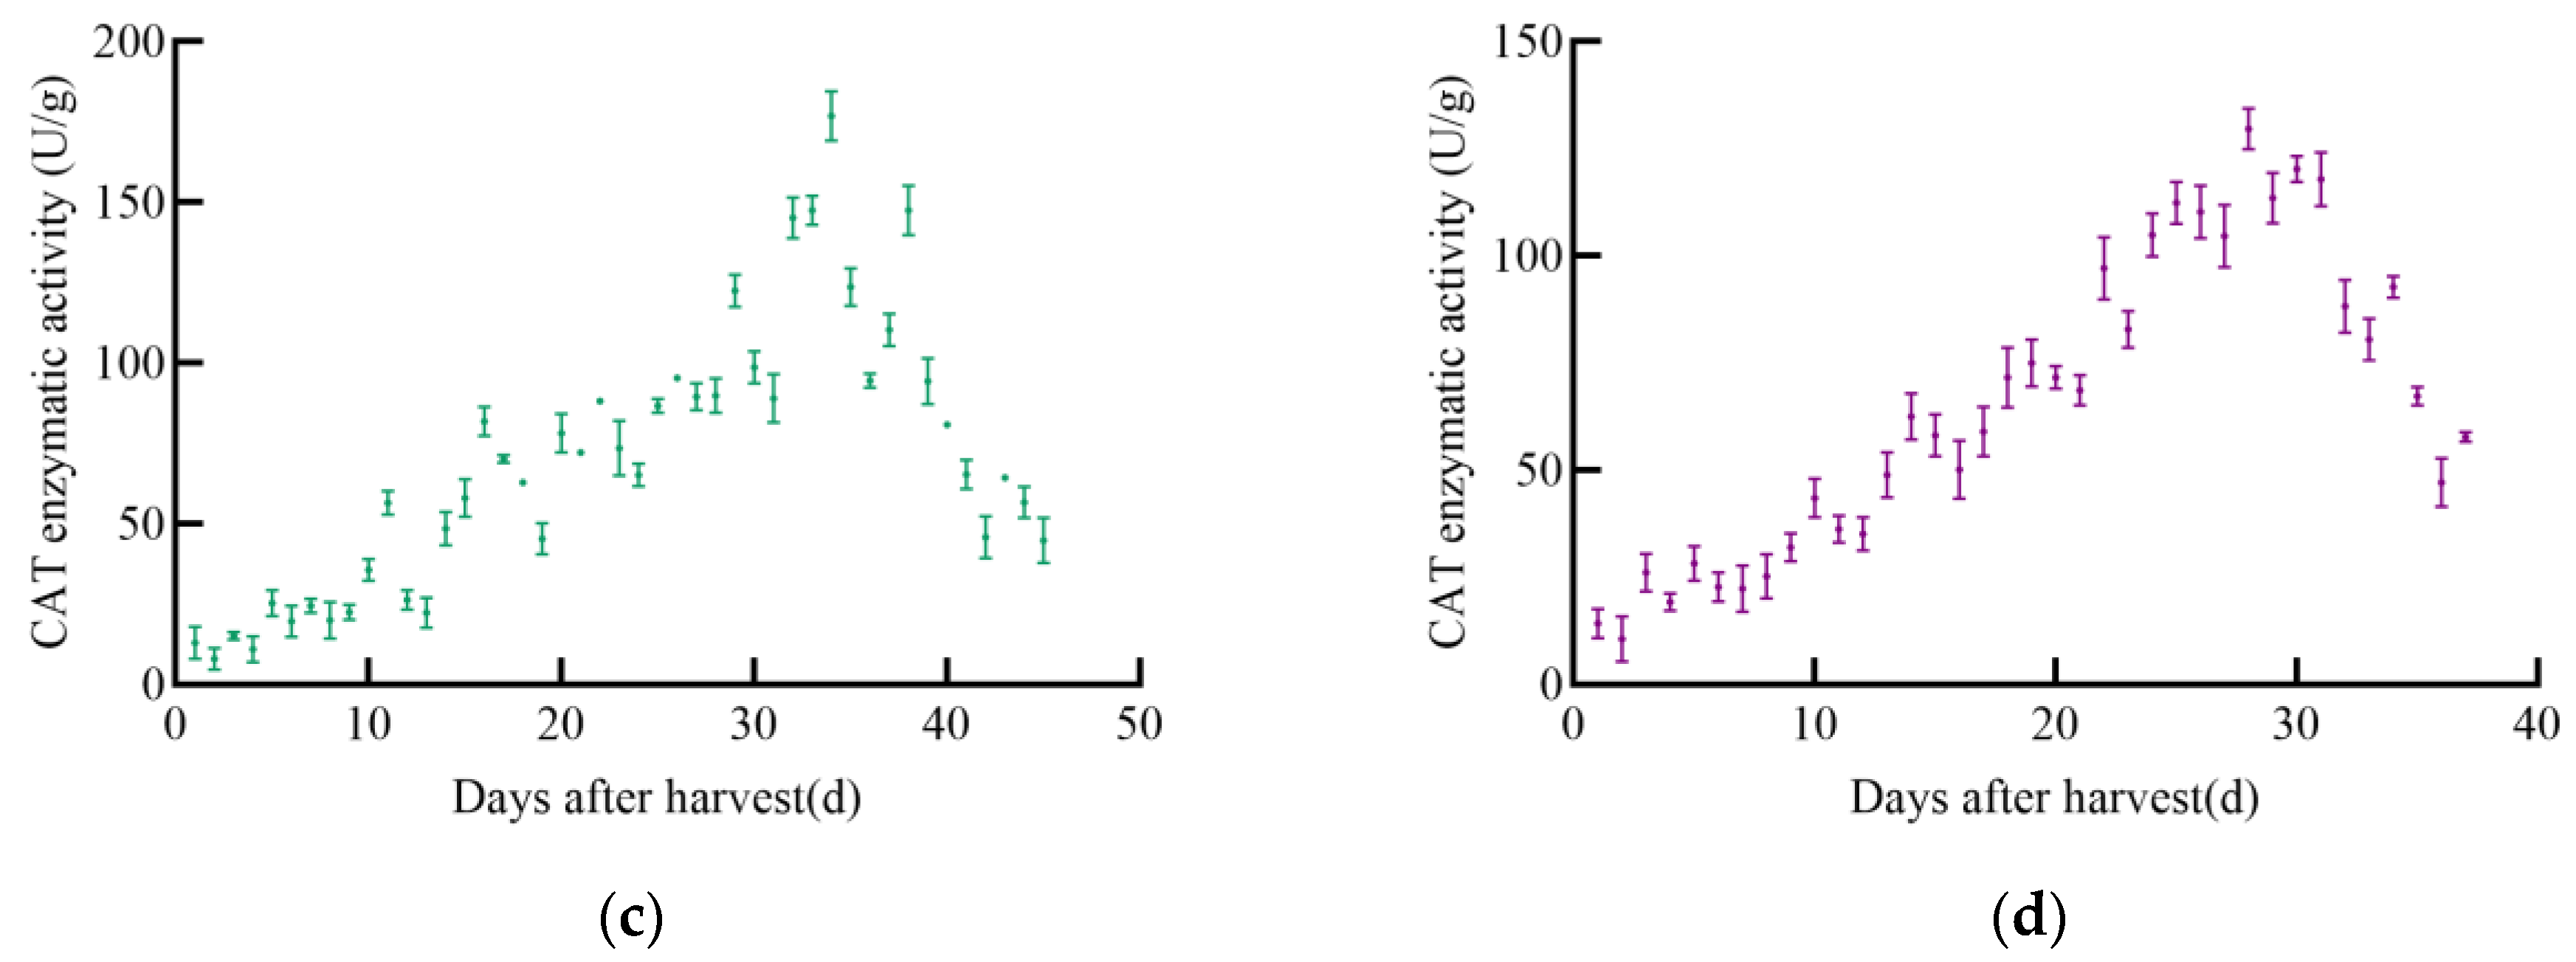
3.2.3. Determination Results of CAT
4. Discussion
4.1. The Existence of Latent Loss and the Calculation of Latent Loss Rate
4.2. Determination of the Timely Harvest Period
5. Conclusions
- Latent Loss of Dry Matter and Its Implications
- 2.
- Antioxidant Enzyme Activities and Its Implications
- 3.
- Research significance and future prospect
Author Contributions
Funding
Institutional Review Board Statement
Informed Consent Statement
Data Availability Statement
Acknowledgments
Conflicts of Interest
References
- Barakat, S.; Cochrane, L.; Vasekha, I. The humanitarian-development-peace nexus for global food security: Responding to the climate crisis, conflict, and supply chain disruptions. Int. J. Disaster Risk Reduct. 2023, 98, 104106. [Google Scholar] [CrossRef]
- FAO; IFAD; UNICEF; WFP; WHO. The State of Food Security and Nutrition in the World 2023. Urbanization, Agrifood Systems Transformation and Healthy Diets Across the Rural—Urban Continuum; FAO: Rome, Italy, 2023. [Google Scholar]
- FAO. The State of Food and Agriculture 2019. Moving Forward on Food Loss and Waste Reduction; FAO: Rome, Italy, 2019. [Google Scholar]
- Jie, X.; Hao, S.; Liu, Y.; Liu, H.; Bao, C.; Ma, Y.; Wu, W. Research Progress on the Effects of Timely Harvest on Yield and Quality of Japonica Rice in China and Japan. China Rice 2023, 29, 67–72. [Google Scholar] [CrossRef]
- Riaz, M.; Ismail, T.; Akhtar, S. Harvesting, Threshing, Processing, and Products of Rice. In Rice Production Worldwide; Chauhan, B.S., Jabran, K., Mahajan, G., Eds.; Springer International Publishing: Cham, Switzerland, 2017; pp. 419–453. [Google Scholar]
- Wang, J. Timely Harvest and Storage of Rice. 2018. Available online: https://www.kepuchina.cn/xc/201808/t20180807_669450.shtml (accessed on 30 August 2024).
- Matsue, Y. Development direction of rice production technology as staple food. Agric. Hortic. 2019, 94, 15–20. [Google Scholar]
- Hayes, M.J.; Decker, W.L. Using satellite and real-time weather data to predict maize production. Int. J. Biometeorol. 1998, 42, 10–15. [Google Scholar] [CrossRef]
- DB22/T 3113−2020 5T; Post-Harvest Management Technique Code for High Quality Paddy. Jilin Market Supervision and Management Department: Jilin, China, 2020.
- Li, L. “Six-year-old Fresh Rice Fine Control Technology” Protects the Fresh Quality of Hazelnut Rice in the Whole Industrial Chain. Sci. Technol. Dly. 2021, 3. [Google Scholar] [CrossRef]
- Qi, M. Practice of Precision Agriculture Promotes Innovation and Development of Smart Agriculture—Interview with Wang Maohua, Academician of China Academy of Engineering and International Eurasian Academy of Sciences. China Natl. Cond. Strength 2018, 7, 5–7. [Google Scholar] [CrossRef]
- Zhu, G. Research and Popularization of Rice Field Variety Optimization and Supporting Technology; Chuzhou Agriculture Technology Popularizing Center: Chuzhou, China, 2007. [Google Scholar]
- Li, D. Breeding and Popularization of New Spirogyra Varieties with High Yield and Good Quality; Anhui Jinpeiyin Technology Co., Ltd.: Hefei, China, 2018. [Google Scholar]
- Zhang, N.; Wu, W.; Wang, Y.; Li, S. Hazard Analysis of Traditional Post-Harvest Operation Methods and the Loss Reduction Effect Based on Five Time (5T) Management: The Case of Rice in Jilin Province, China. Agriculture 2021, 11, 877. [Google Scholar] [CrossRef]
- Wang, Y.; Wu, W.; Wu, Z.; Zhang, N.; Li, S.; Meng, X. Revealing a Significant Latent Loss of Dry Matter in Rice Based on Accurate Measurement of Grain Growth Curve. Agriculture 2022, 12, 465. [Google Scholar] [CrossRef]
- Wu, W.; Zhang, N.; Li, S.; Wang, Y.; Xu, W.; Meng, X.; Zhu, H.; Qi, J.; Zhou, X.; Liu, H. Construction and application exploration of 5T smart farm management systems. Trans. Chin. Soc. Agric. Eng. 2021, 37, 340–349. [Google Scholar]
- Mishra, P.; Sharma, P. Superoxide Dismutases (SODs) and Their Role in Regulating Abiotic Stress induced Oxidative Stress in Plants. In Reactive Oxygen, Nitrogen and Sulfur Species in Plants; John Wiley & Sons: Hoboken, NJ, USA, 2019; pp. 53–88. [Google Scholar]
- Saxena, P.; Selvaraj, K.; Khare, S.K.; Chaudhary, N. Superoxide dismutase as multipotent therapeutic antioxidant enzyme: Role in human diseases. Biotechnol. Lett. 2022, 44, 1–22. [Google Scholar] [CrossRef]
- Lu, Y.; Wang, F.; Luo, H.; He, W.; Li, D.; Bao, Y.; Zhang, Z.; Zhou, C. Changes in phytochemical profiles, relevant enzyme activity and antioxidant capacity of different germinated maize varieties. Food Biosci. 2023, 56, 103410. [Google Scholar] [CrossRef]
- Little, B.; Hopkins, R. Superoxide Dismutases in Biology and Medicine: Essentials and Recent Advances. React. Oxyg. Species 2020, 9, 13–21. [Google Scholar] [CrossRef]
- Wang, J.; Liu, H.-x.; Xu, T. The role of superoxide dismutase (SOD) in stress physiology and senescence physiology of plant. Plant Physiol. Commun. 1989, 1, 1–7. [Google Scholar] [CrossRef]
- Niu, Y.; Xie, G.; Xiao, Y.; Liu, J.; Wang, Y.; Luo, Q.; Zou, H.; Gan, S.; Qin, K.; Huang, M. Spatiotemporal Patterns and Determinants of Grain Self-Sufficiency in China. Foods 2021, 10, 747. [Google Scholar] [CrossRef]
- Ai, H.; Wang, J. Building the Northeast Granary and Stabilizing China’s Rice Bowl. Window Northeast 2022, 14–15. [Google Scholar]
- Wei, H.; Du, Z. China Rural Development Report 2020: Focus on China’s Rural Development During the “14th Five-Year Plan” Period; China Social Sciences Press: Beijing, China, 2020. [Google Scholar]
- Anderson, K.; Strutt, A. Food security policy options for China: Lessons from other countries. Food Policy 2014, 49, 50–58. [Google Scholar] [CrossRef]
- Kostić, D.A.; Dimitrijević, D.S.; Stojanović, G.S.; Palić, I.R.; Đorđević, A.S.; Ickovski, J.D. Xanthine Oxidase: Isolation, Assays of Activity, and Inhibition. J. Chem. 2015, 2015, 294858. [Google Scholar] [CrossRef]
- Abdel-Monsef, M.; Darwish, D.; Masoud, H.; Helmy, M.; Ibrahim, M. Xanthine oxidase from milk of the water buffalo (Bubalus bubalis): Purification, characterization and a pplication in SOD assay diagnostic kit. Res. J. Pharm. Biol. Chem. Sci. 2017, 8, 1735–1744. [Google Scholar]
- Zeng, C.; Liu, W.; Hao, J.; Fan, D.; Chen, L.; Xu, H.; Li, K. Measuring the expression and activity of the CAT enzyme to determine Al resistance in soybean. Plant Physiol. Biochem. 2019, 144, 254–263. [Google Scholar] [CrossRef]
- Shang, Y.-Z.; Miao, H.; Cheng, J.-J.; Qi, J.-M. Effects of Amelioration of Total Flavonoids from Stems and Leaves of Scutellaria baicalensis Georgi on Cognitive Deficits, Neuronal Damage and Free Radicals Disorder Induced by Cerebral Ischemia in Rats. Biol. Pharm. Bull. 2006, 29, 805–810. [Google Scholar] [CrossRef]
- Du, H.; Zhou, P.; Huang, B. Antioxidant enzymatic activities and gene expression associated with heat tolerance in a cool-season perennial grass species. Environ. Exp. Bot. 2013, 87, 159–166. [Google Scholar] [CrossRef]
- Statistics, N.B.O. Notice of the National Bureau of Statistics on the 2024 Grain Output Data. 2024. Available online: https://www.stats.gov.cn/sj/zxfb/202412/t20241213_1957744.html (accessed on 8 February 2025).
- Hunan Province High-quality Rice Production Technology System and Application Theory Research Cooperation Group. Effect of harvest time on rice yield and milling quality. Res. Agric. Mod. 1989, 37–38. [Google Scholar]
- MINORASU. When is the Best Time to Cut Rice? Key Points and Latest Technology of Timely Harvest in Practice. Available online: https://minorasu.basf.co.jp/komeney/proper-harvest (accessed on 15 March 2025).
- Zhang, N. Research on Information Technology and System of 5T Event-correlation Management for High Quality Paddy Harvest-Storage. Doctor’s Thesis, Jilin University, Changchun, China, 2023. [Google Scholar]
- Dong, W.; Han, L.; Zhang, Y. Effects of planting patterns on growth, yield and grain quality of maize. J. Gansu Agric. Univ. 2020, 55, 48–57. [Google Scholar] [CrossRef]
- Wang, Y.; Yang, J.; Yuan, C.; Liu, J.; Li, D.; Dong, S. Characteristics of Senescence and Antioxidant Enzyme Activities in Leaves at Different Plant Parts of Summer Maize with the Super-high Yielding Potential after Anthesis. Acta Agron. Sin. 2013, 39, 2183–2191. [Google Scholar]
- Wei, L.; Zhang, L.; Wang, W.; Yu, Z.; Yu, D.; Liu, L. Bioinformatics Analysis of Class III Peroxidases in Glycine max. Mol. Plant Breed. 2015, 13, 2453–2460. [Google Scholar] [CrossRef]
- Dong, L.; Yang, C.; Chen, L.; Song, L. Bioinformatics analysis of soybean catalase family and the response to abiotic stress. Soybean Sci. 2022, 41, 663–671. [Google Scholar] [CrossRef]
- Loizou, E.; Karelakis, C.; Galanopoulos, K.; Mattas, K. The role of agriculture as a development tool for a regional economy. Agric. Syst. 2019, 173, 482–490. [Google Scholar] [CrossRef]


| Variety | Mature Period | Spike Type | Grain Color | |
|---|---|---|---|---|
| Maize | JD31 | Medium–early maturing | Long tube type | Yellow |
| FM985 | Medium maturing | Long tube type | Yellow | |
| XY335 | Medium maturing | Long tube type | Yellow | |
| KX3564 | Medium maturing | Long tube type | Yellow | |
| Soybean | JY52 | Medium maturing | Round particle type | Yellow |
| JL16 | Medium maturing | Elliptic granular type | Green | |
| JY47 | Medium maturing | Elliptic granular type | Yellow | |
| JL8 | Early maturing | Elliptic granular type | Green | |
| Source | Type III Sum of Squares | df | Mean Square | F | p | Partial Eta Squared |
|---|---|---|---|---|---|---|
| Corrected Model | 1,819,043.574 a | 8 | 227,380.447 | 726.554 | <0.0001 | 0.949 |
| Intercept | 4,626,006.499 | 1 | 4,626,006.499 | 14,781.575 | <0.0001 | 0.979 |
| Variety | 1,667,100.477 | 7 | 238,157.211 | 760.989 | <0.0001 | 0.945 |
| Days After Harvest | 118,651.998 | 1 | 118,651.998 | 379.131 | <0.0001 | 0.549 |
| Error | 97,642.774 | 312 | 312.958 | |||
| Total | 30,851,907.731 | 321 | ||||
| Corrected Total | 1,916,686.348 | 320 |
| Variety | Regression Equation | R2 | p | |
|---|---|---|---|---|
| Maize | JD31 | Y = −6.961×X + 672.6 | 0.8536 | <0.0001 |
| FM985 | Y = −2.127×X + 461.8 | 0.7534 | <0.0001 | |
| XY335 | Y = −1.430×X + 459.6 | 0.6784 | 0.0003 | |
| KX3564 | Y = −5.992×X + 566.9 | 0.8373 | 0.0014 | |
| Soybean | JY52 | Y = −2.098×X + 345.4 | 0.9086 | <0.0001 |
| JL16 | Y = −1.306×X + 275.6 | 0.8780 | 0.0006 | |
| JY47 | Y = −2.080×X + 347.3 | 0.8317 | <0.0001 | |
| JL8 | Y = −0.521×X + 241.4 | 0.6581 | 0.0024 | |
| Variety | Loss Weight/g | Average | Loss Rate/% | Average | |
|---|---|---|---|---|---|
| Maize | JD31 | 76.5710 | 49.2108 | 17.2891 | 12.1036 |
| FM985 | 29.7780 | 7.4821 | |||
| XY335 | 18.5900 | 4.4766 | |||
| Kx3564 | 71.9040 | 19.1664 | |||
| Soybean | JY52 | 16.7840 | 14.2262 | 6.2192 | 5.5742 |
| JL16 | 15.6720 | 6.7029 | |||
| JY47 | 18.7200 | 6.8197 | |||
| JL8 | 5.7288 | 2.5551 | |||
| Days After Harvest | Maize | Soybean | ||||||
|---|---|---|---|---|---|---|---|---|
| XY335 | FM985 | JD31 | KX3564 | JY52 | JL16 | JY47 | JL8 | |
| Weight | 27–34 | 27–34 | 29–36 | 26–33 | 33–40 | 30–35 | 32–39 | 29–36 |
| POD | 27–34 | 25–32 | 31–38 | 24–31 | 35–42 | 24–31 | 32–39 | 28–35 |
| CAT | 24–31 | 23–30 | 25–32 | 25–32 | 31–38 | 26–33 | 34–41 | 28–35 |
| SOD | 24–31 | 28–35 | 28–35 | 26–33 | 34–41 | 27–34 | 36–43 | 27–34 |
| Optimal Date | 27 September–7 October | 28 September–8 October | 1 October–11 October | 26 September–6 October | 5 October–15 October | 28 September–8 October | 6 October–16 October | 28 September–8 October |
Disclaimer/Publisher’s Note: The statements, opinions and data contained in all publications are solely those of the individual author(s) and contributor(s) and not of MDPI and/or the editor(s). MDPI and/or the editor(s) disclaim responsibility for any injury to people or property resulting from any ideas, methods, instructions or products referred to in the content. |
© 2025 by the authors. Licensee MDPI, Basel, Switzerland. This article is an open access article distributed under the terms and conditions of the Creative Commons Attribution (CC BY) license (https://creativecommons.org/licenses/by/4.0/).
Share and Cite
Wang, Y.; Wu, W.; Xu, J.; Gao, M.; Wu, Z.; Wang, R.; Liu, H. Optimized Harvest Management Strategy Based on Latent Loss and Antioxidant Enzyme Activity. Foods 2025, 14, 1197. https://doi.org/10.3390/foods14071197
Wang Y, Wu W, Xu J, Gao M, Wu Z, Wang R, Liu H. Optimized Harvest Management Strategy Based on Latent Loss and Antioxidant Enzyme Activity. Foods. 2025; 14(7):1197. https://doi.org/10.3390/foods14071197
Chicago/Turabian StyleWang, Yujia, Wenfu Wu, Jie Xu, Ming Gao, Zidan Wu, Rui Wang, and Houqing Liu. 2025. "Optimized Harvest Management Strategy Based on Latent Loss and Antioxidant Enzyme Activity" Foods 14, no. 7: 1197. https://doi.org/10.3390/foods14071197
APA StyleWang, Y., Wu, W., Xu, J., Gao, M., Wu, Z., Wang, R., & Liu, H. (2025). Optimized Harvest Management Strategy Based on Latent Loss and Antioxidant Enzyme Activity. Foods, 14(7), 1197. https://doi.org/10.3390/foods14071197