
Cost-Benefit Analysis of Enzymatic Hydrolysis Alternatives for Food Waste Management

 ,
, 

Abstract

1. Introduction
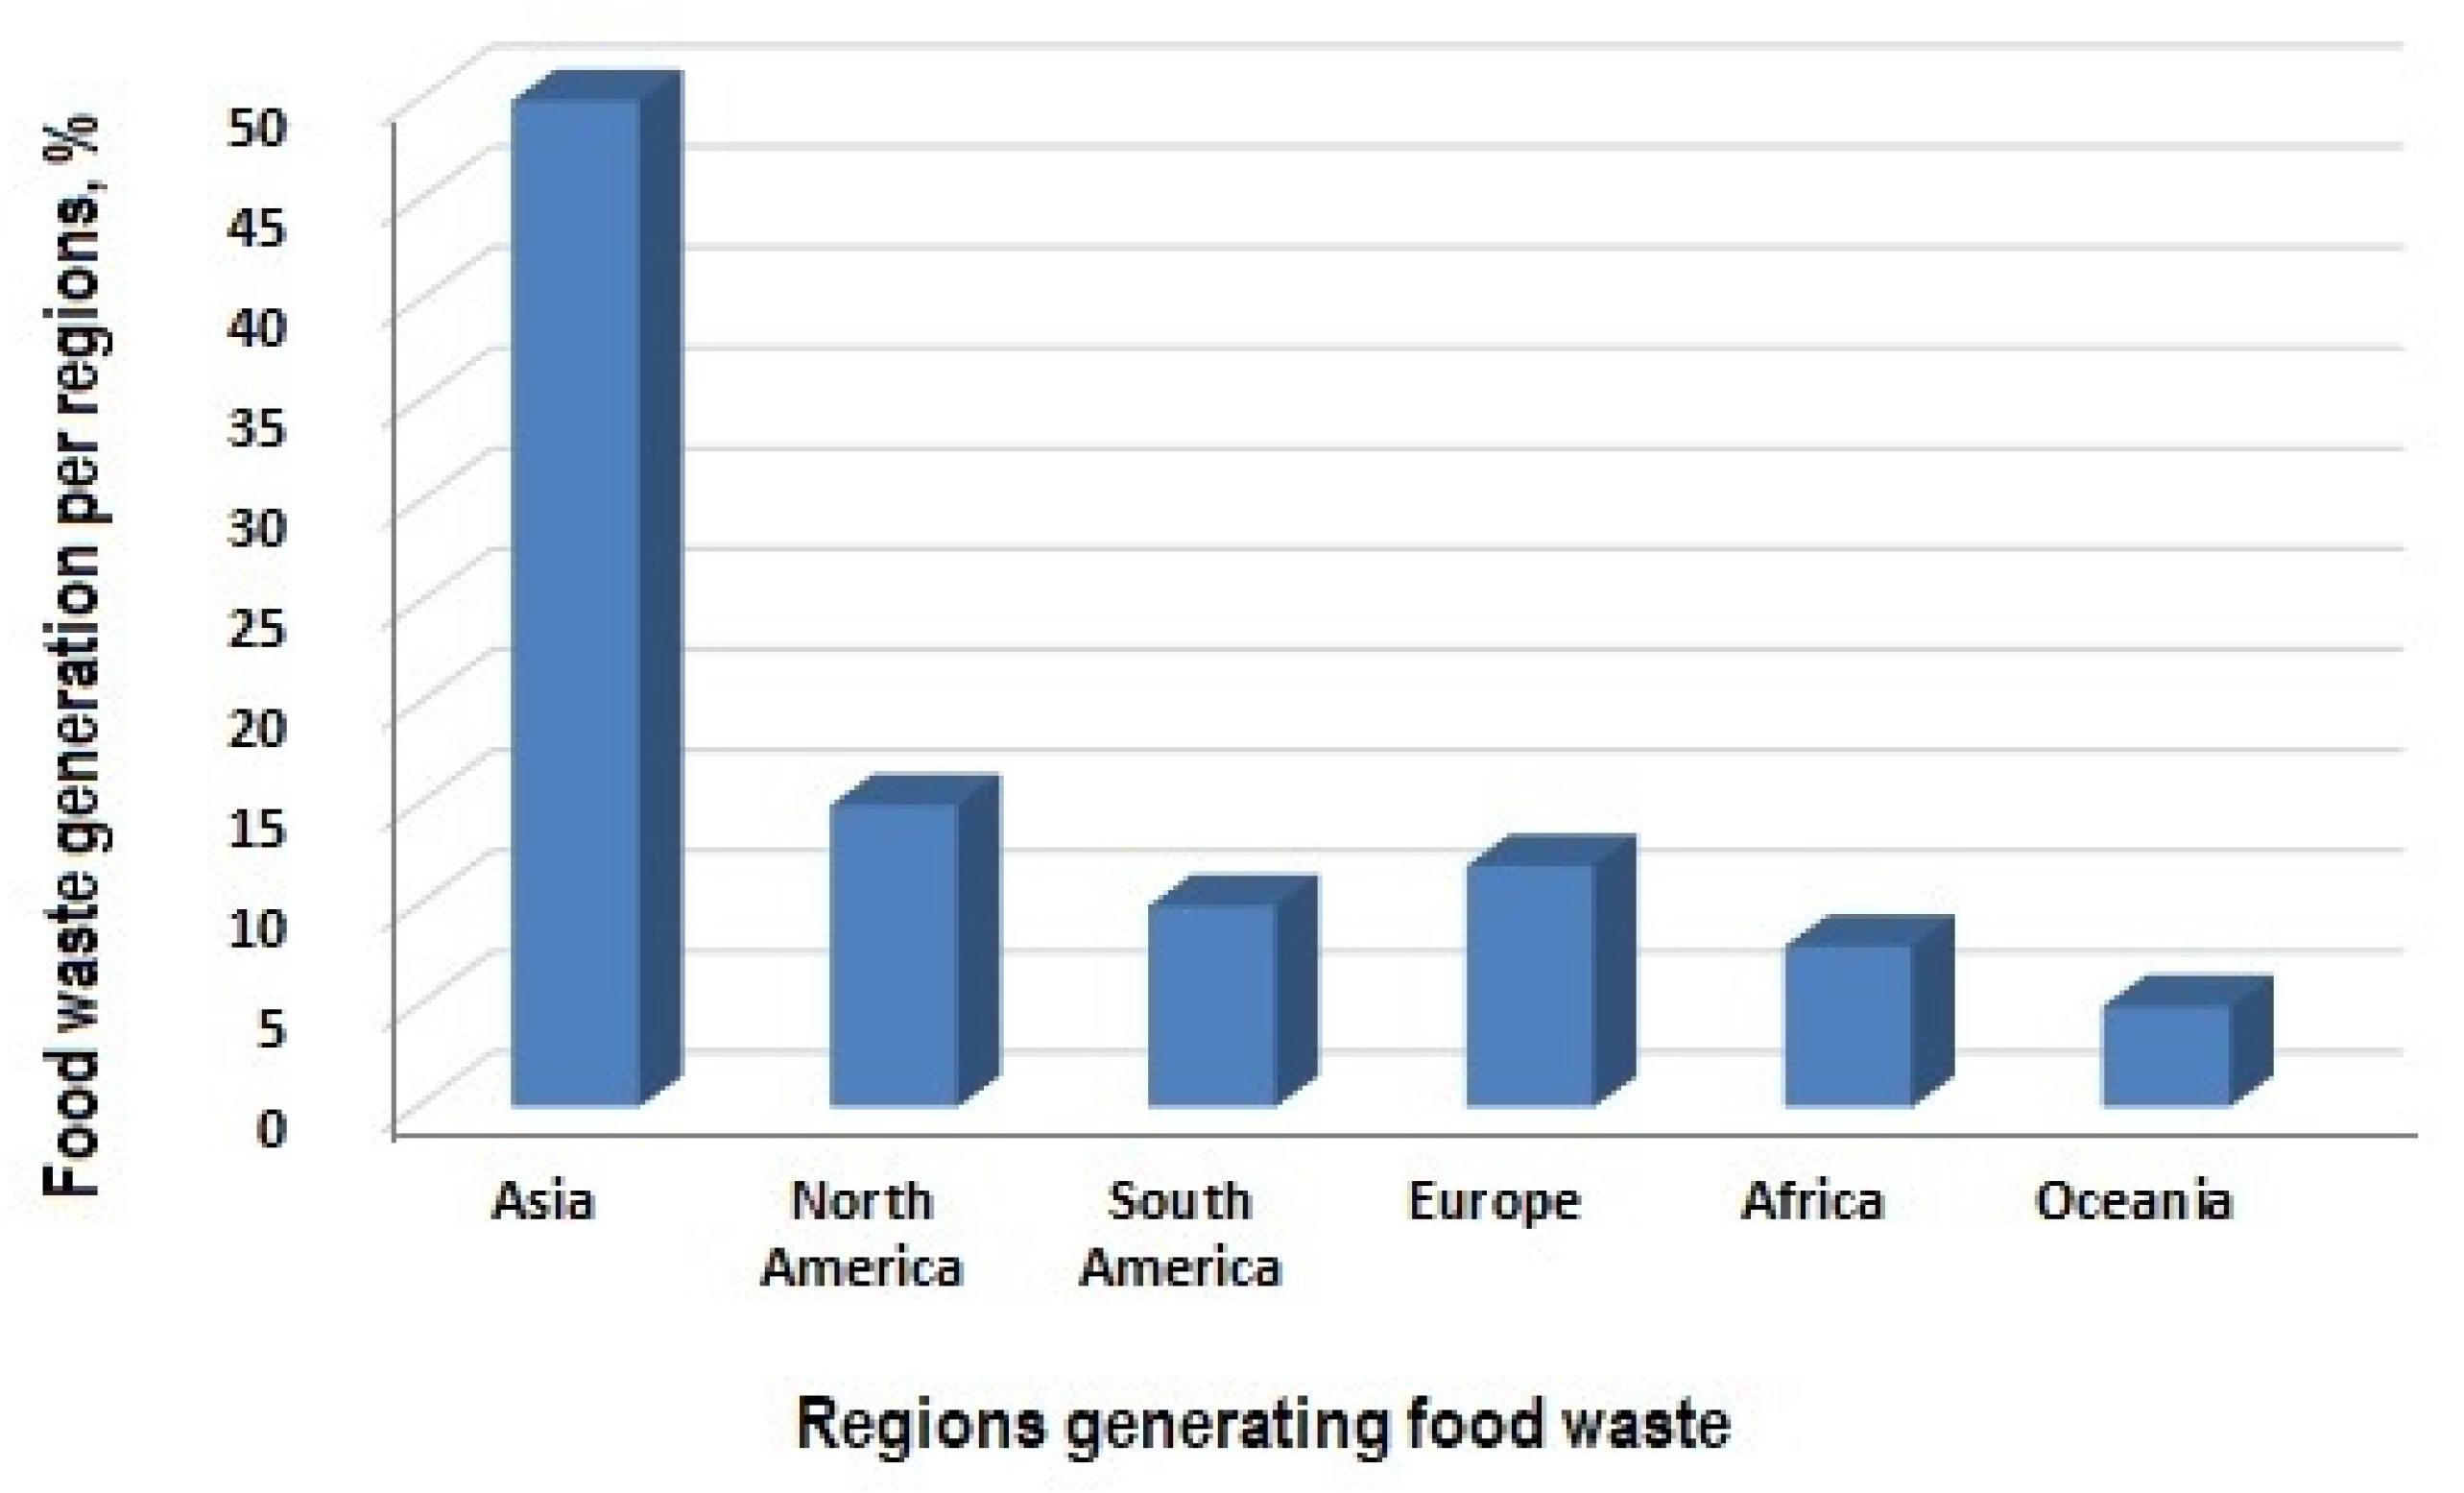
1.1. Sources, Impacts, and Management Strategies of Food Waste
- (a)
- Agricultural production
- (b)
- Processing
- (c)
- Distribution and trade
- (d)
- Final consumers

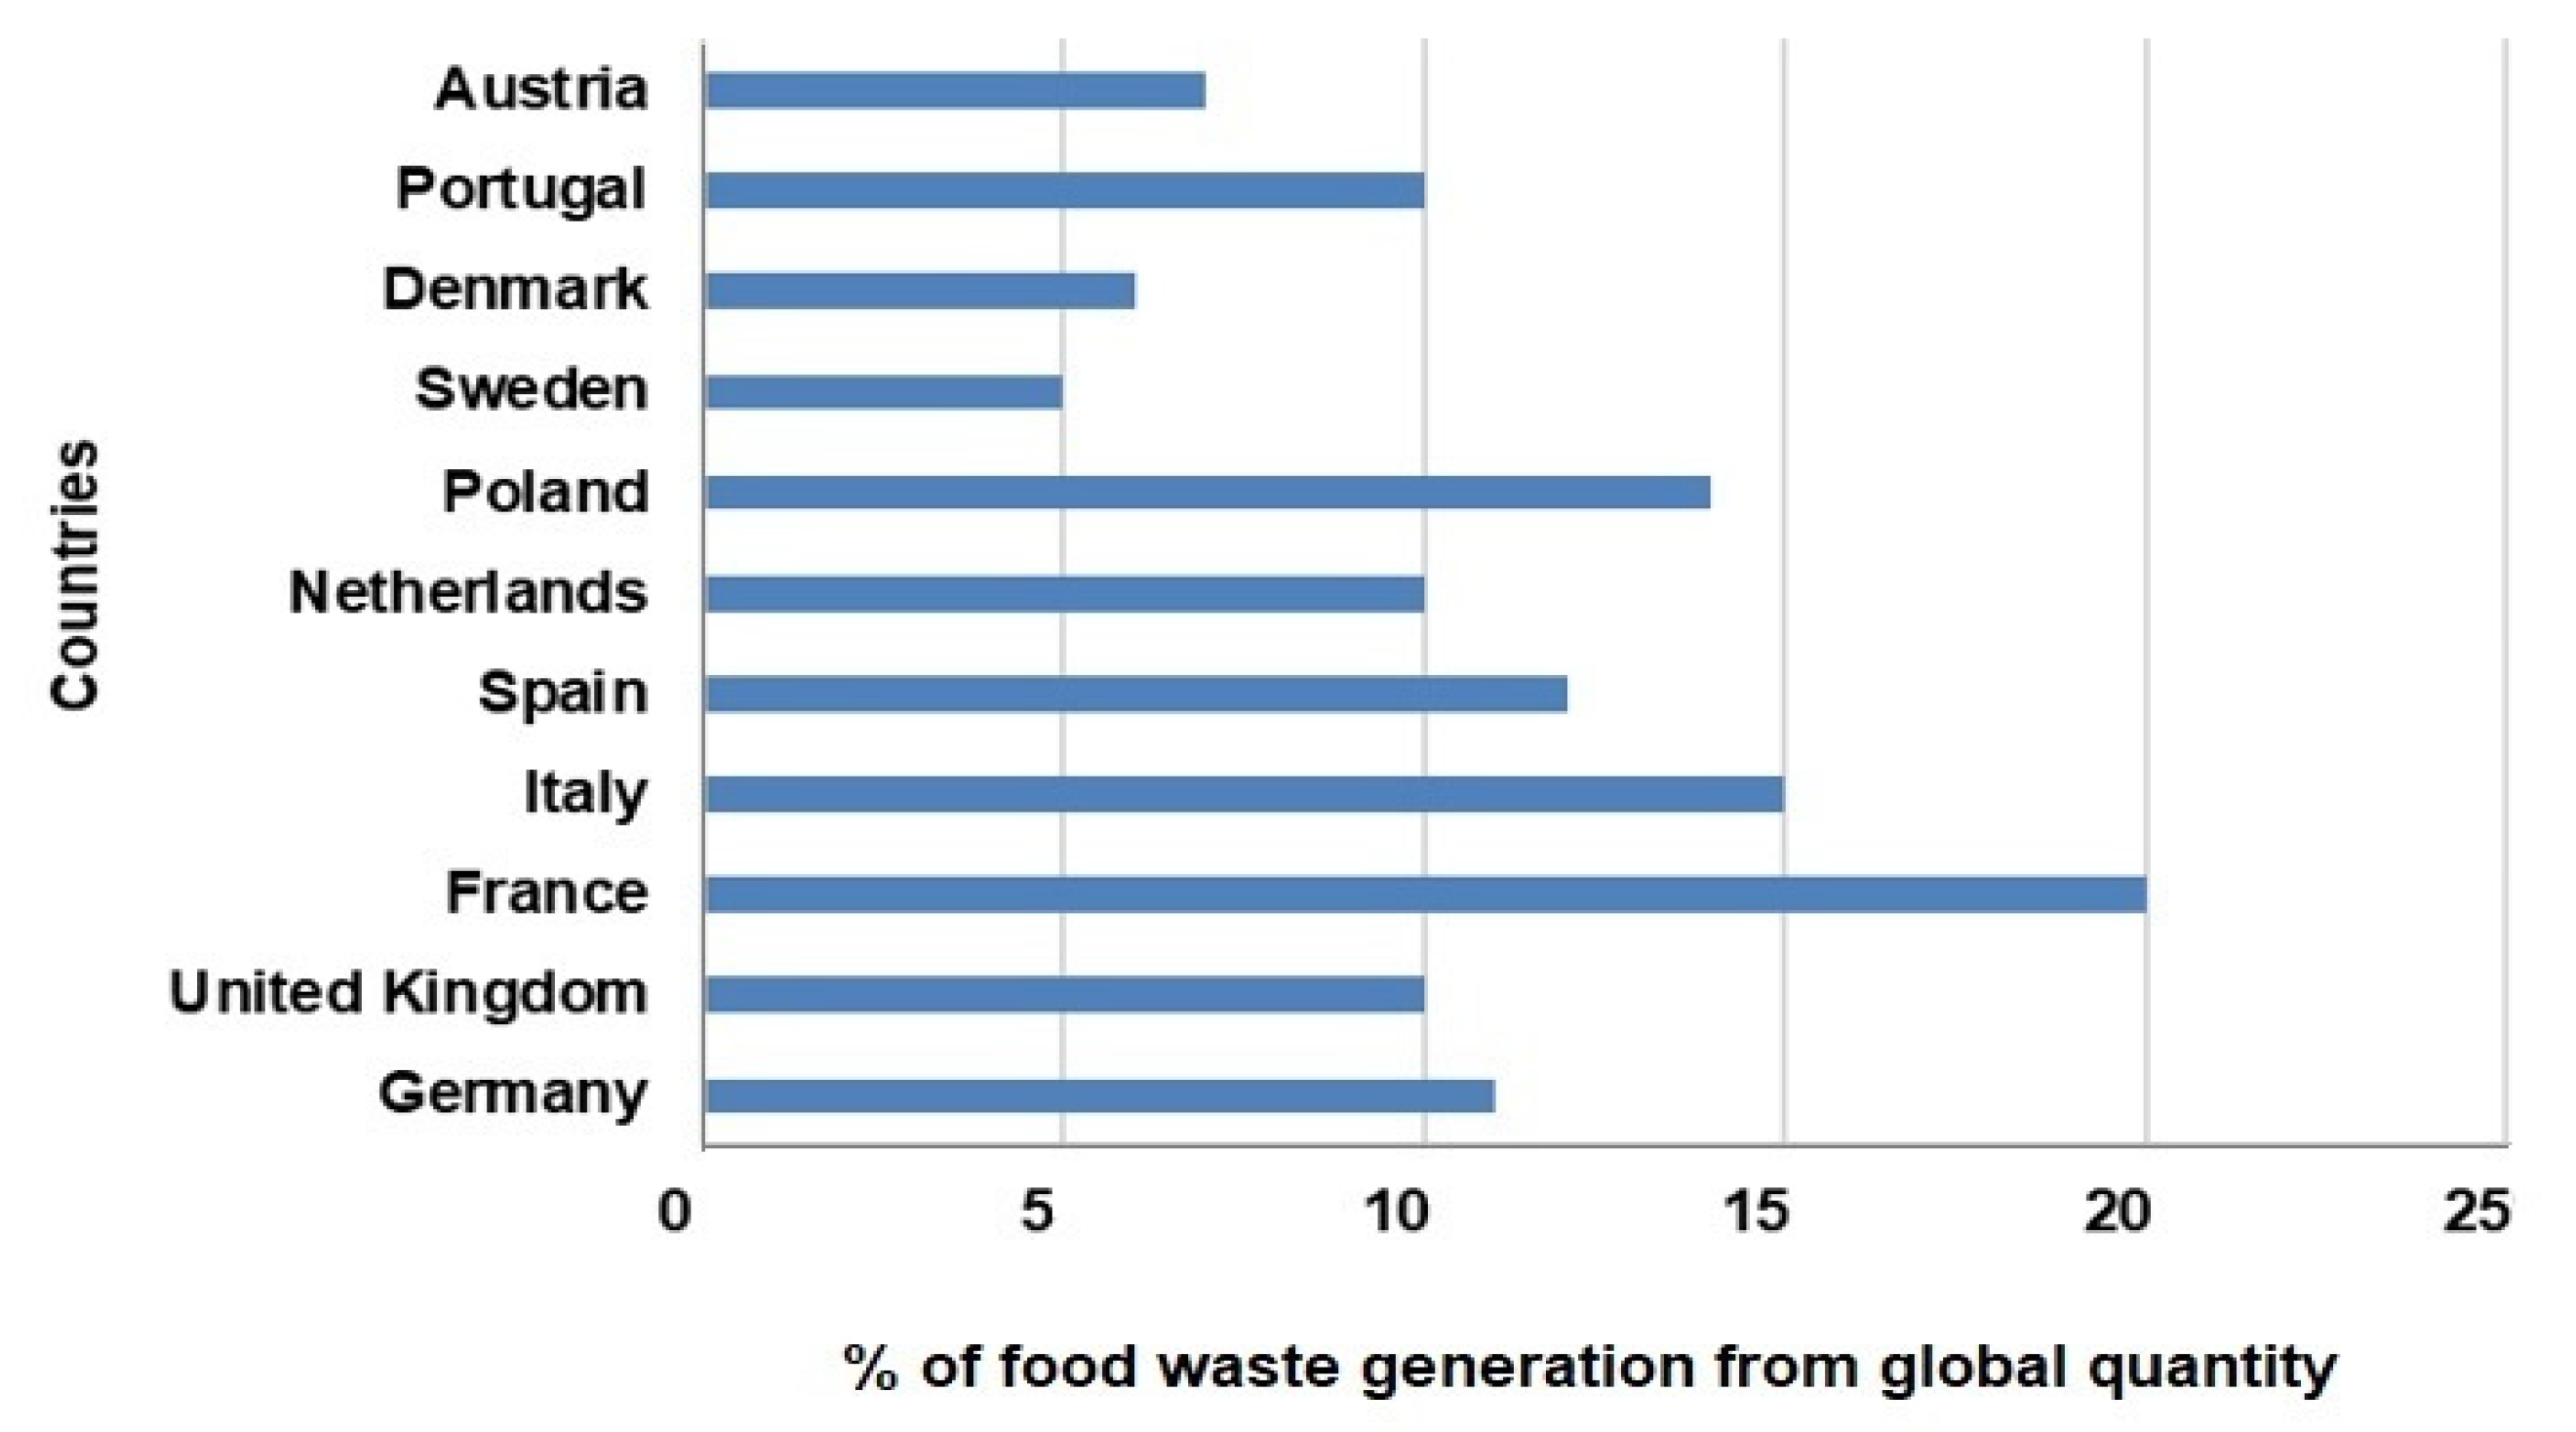
| Country | Household (%) | Retail (%) | Production (%) | Food Service (%) | Total Food Waste (%) |
|---|---|---|---|---|---|
| Germany | 60 | 10 | 20 | 10 | ~11 |
| UK | 50 | 15 | 20 | 15 | ~10 |
| France | 55 | 15 | 20 | 10 | ~20 |
| Italy | 65 | 10 | 15 | 10 | ~15 |
| Spain | 60 | 12 | 15 | 13 | ~12 |
| The Netherlands | 50 | 20 | 20 | 10 | ~10 |
| Poland | 55 | 15 | 20 | 10 | ~14 |
| Sweden | 70 | 10 | 10 | 10 | ~5 |
| Denmark | 65 | 15 | 10 | 10 | ~6 |
| Portugal | 60 | 15 | 15 | 10 | ~10 |
| Austria | 60 | 15 | 15 | 10 | ~7 |
| Romania | 60 | 15 | 15 | 10 | ~13 |
1.2. Impact of Food Waste Generation
- Greenhouse Gas (GHG) emissions
- Wastage of natural resources
- Soil and water pollution
- Biodiversity loss
- Air pollution
- Contribution to climate change
- Air quality and respiratory diseases
- -
- Water and soil contamination
- -
- The decomposition of food waste in landfills generates leachate, a toxic liquid containing heavy metals, pathogenic bacteria, and other harmful substances that can contaminate groundwater, leading to severe gastrointestinal illnesses among populations consuming the affected water [11].
- -
- If improperly treated, the food waste used in compost can introduce harmful bacteria into the food chain, posing risks of contamination and endangering public health [12].
- Disease vectors
- -
- Food waste that is not adequately managed attracts rodents, insects, and other pests, which act as vectors for infectious diseases like leptospirosis, salmonellosis, and malaria. Such diseases are particularly prevalent in urban areas with inadequate waste management systems [13].
- -
- Economic and social impacts
- -
- Food waste represents the loss of valuable agricultural, economic, and natural resources that could otherwise be used to alleviate food insecurity. This inefficiency exacerbates malnutrition, especially in developing regions where access to food is already limited [10].
- -
- Long-term consequences
- -
1.3. Sustainability of Food Waste Management at National and International Levels
1.3.1. National Actions
- Programs to reduce food waste
- -
- National strategies often focus on creating frameworks to minimize food waste. For instance, Romania’s Law 217/2016 encourages the redistribution of near-expiry food to charities, ensuring that surplus food is utilized rather than discarded.
- -
- Tax incentives and similar economic measures are also employed to encourage businesses to adopt sustainable practices and reduce waste.
- Public awareness campaigns
- -
- Recycling and composting programs
- -
- The separate collection of organic waste is a key focus of many national programs, facilitating its transformation into compost or biogas. For example, in Romania, several municipalities have implemented selective organic waste collection programs that enable effective recycling and energy recovery [22,23].
- Public-private partnerships
- -
- Collaboration between government entities, private companies, and non-governmental organizations (NGOs) has been instrumental in advancing technological solutions for food waste valorization. These partnerships support innovative uses of food waste, such as its conversion into bioenergy or other valuable byproducts, driving sustainability and economic efficiency [24].
1.3.2. International Actions
- Sustainable Development Goals (SDGs)
- -
- The United Nations Agenda for Sustainable Development includes Goal 12, which aims to ensure sustainable consumption and production patterns. Specifically, Target 12.3 seeks to halve global food waste per capita by 2030 at both the retail and consumer levels, addressing food losses along the production and supply chains [25].
- Food and Agriculture Organization (FAO)
- -
- The FAO actively supports member states in the development and implementation of food waste reduction policies. These efforts include providing technical expertise, fostering policy dialogue, and facilitating global partnerships to strengthen food systems and reduce waste [26].
- Regional initiatives
- -
- The European Union (EU) has integrated food waste reduction into its broader environmental strategies, such as the European Green Deal and the Circular Economy Action Plan. These policies establish ambitious targets for food waste reduction across all member states and encourage innovative practices to optimize resource use while minimizing waste [27,28].
- Food recovery programs
- -
- In the United States, programs like the “US Food Loss and Waste 2030 Champions” initiative encourage businesses to commit to cutting their food waste by 50% by 2030. Such initiatives foster private sector engagement in achieving national and global food waste reduction goals [29].
- Technological innovations and research
- -
2. Innovative Solutions and Technologies to Reduce Food Waste
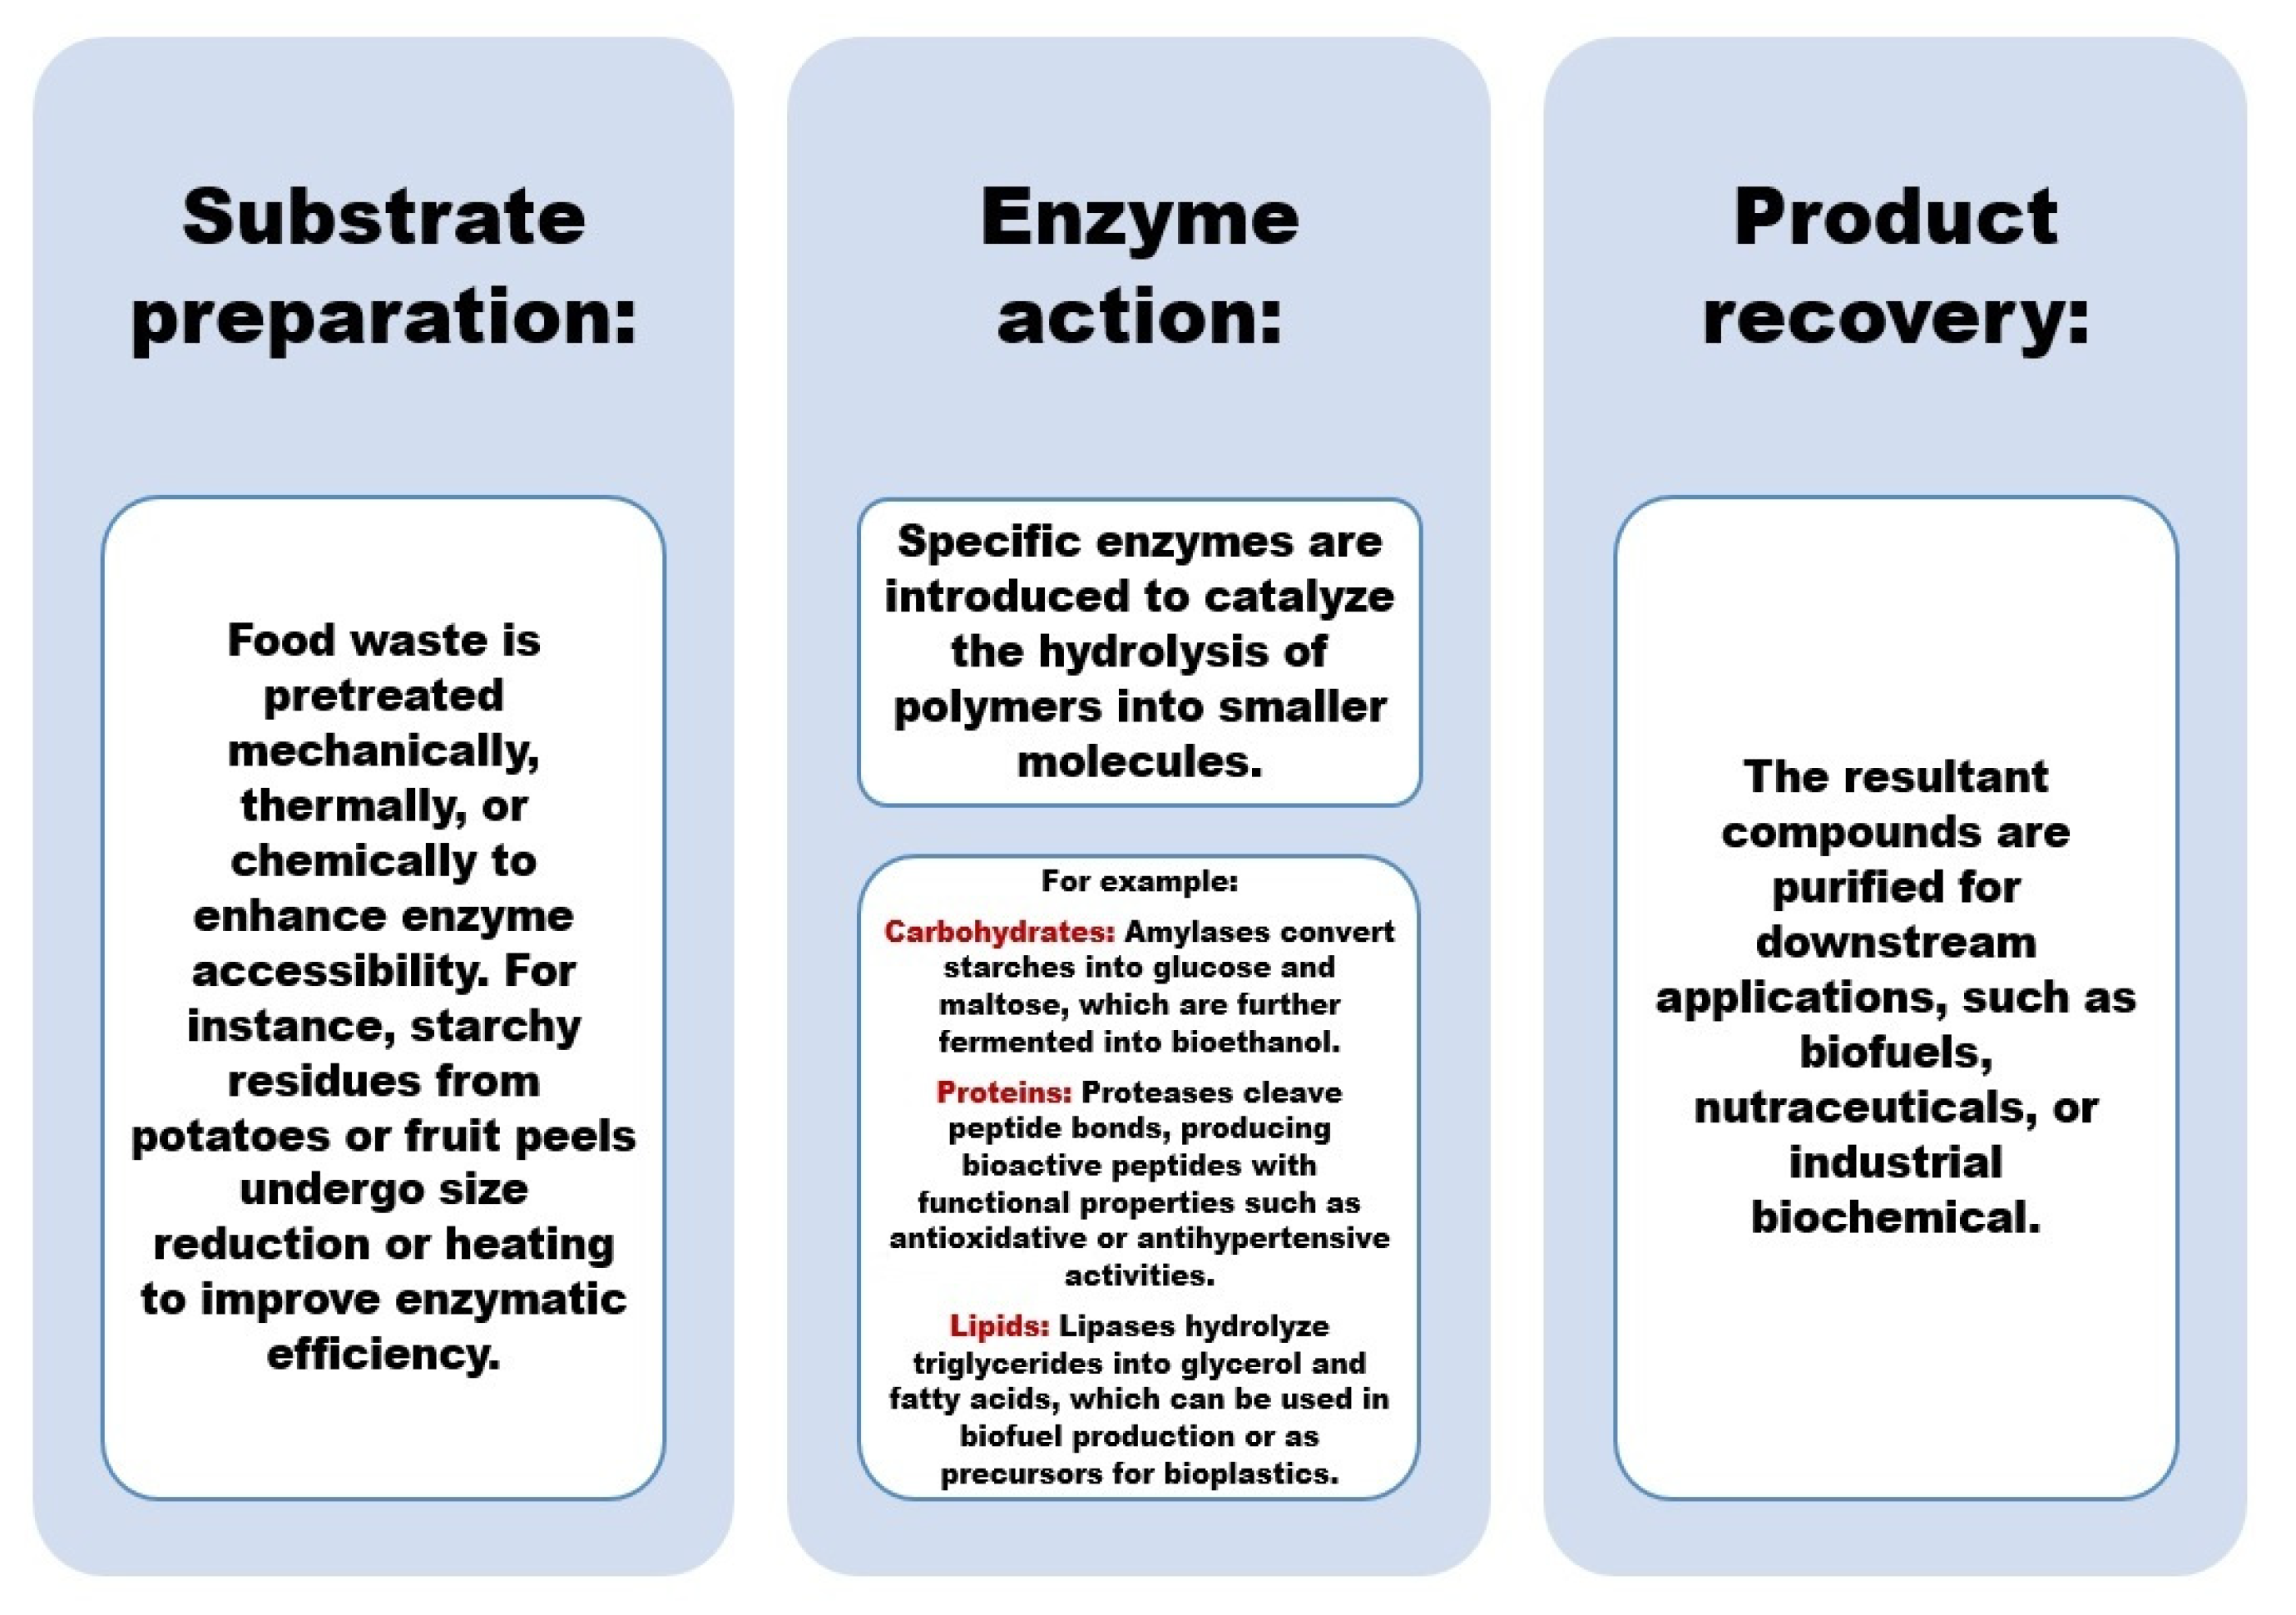
3. Transforming Food Waste into Valuable Products by Enzymatic Processes

4. Evaluating the Sustainability of Food Waste Management Systems
5. Research Goals and Framework
6. Cost-Benefit Analysis: Historical Development, Methodology, and Applications in Food Waste Valorization
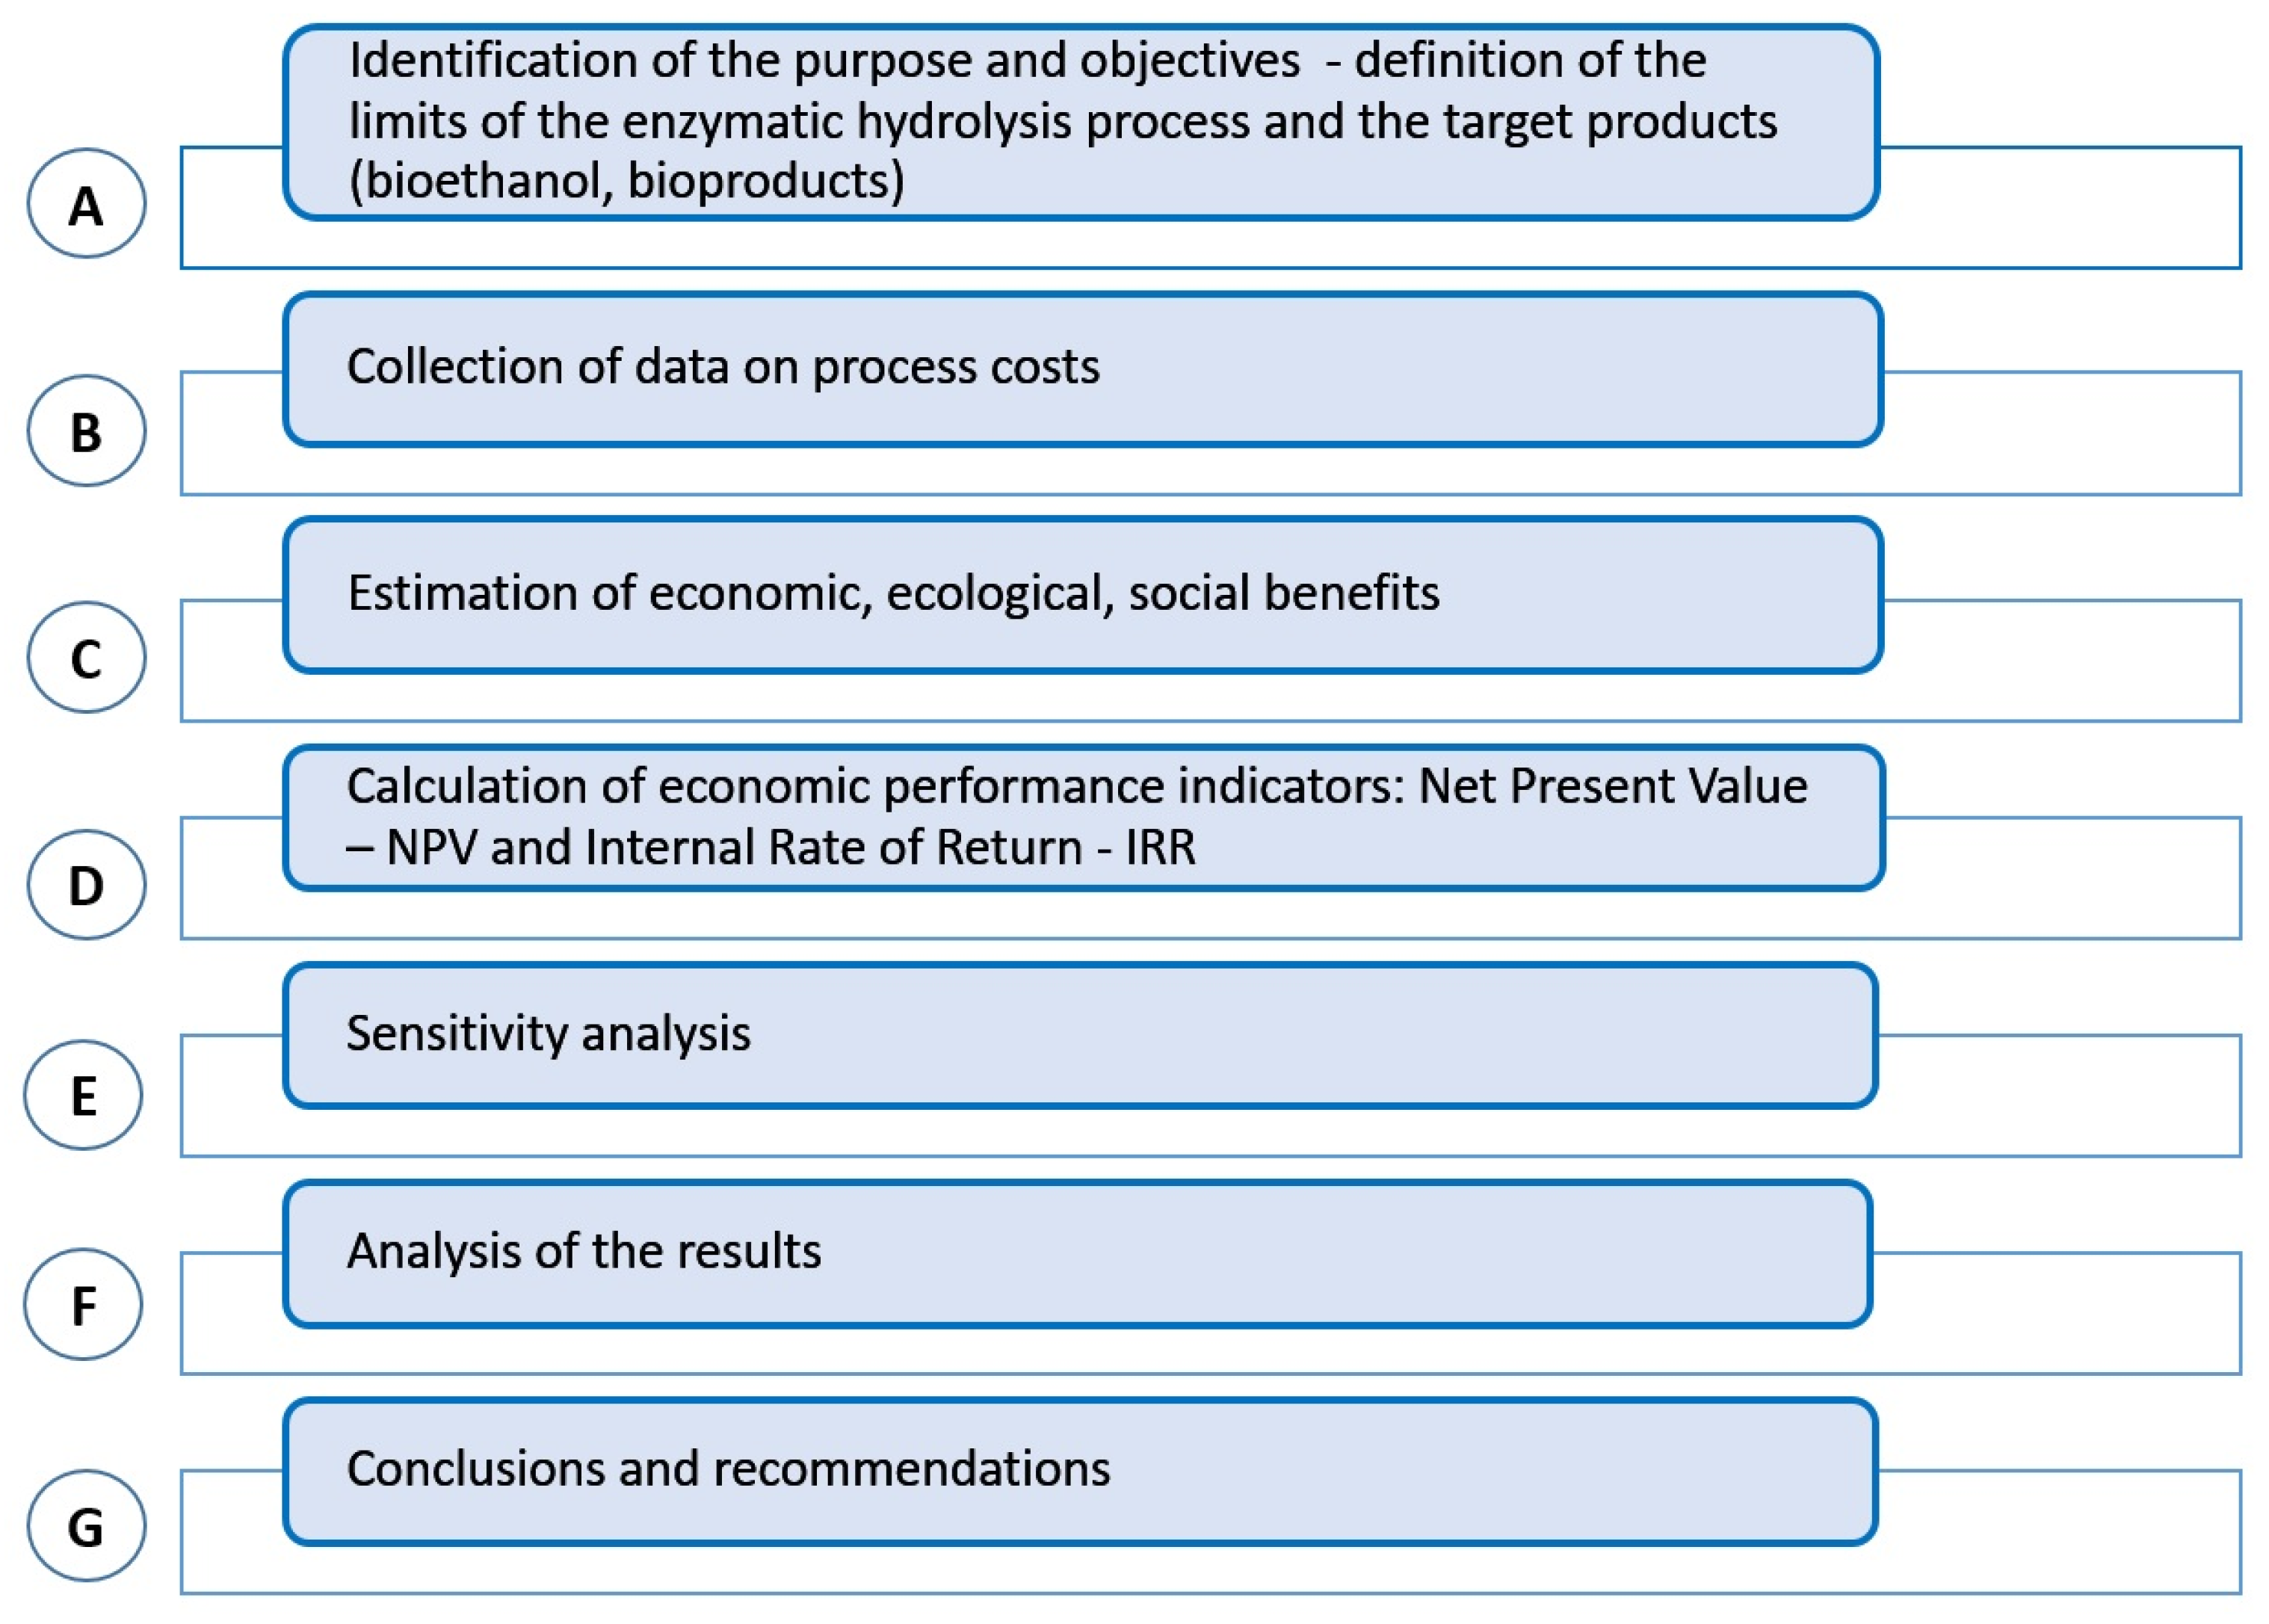
6.1. Steps for the Assessment of Food Waste Reduction and Recovery Scenarios, Estimation of Economic and Environmental Efficiency Through Cost-Benefit Analysis (CBA)
6.2. Defining Application Limits and Scenarios
- ✓
- Scenario A1: Bioethanol Production via Enzymatic Hydrolysis of Food Waste
- Raw material preparation
- b.
- Enzymatic hydrolysis stage
- -
- Substrate preparation: Food waste is shredded, dried, or heat-pretreated to increase substrate accessibility for enzymes.
- -
- Enzyme addition: Specific enzymes, such as cellulases, amylases, and proteases, are introduced to degrade complex carbohydrates, proteins, and lipids into simpler compounds.
- -
- Hydrolysis process: Enzymes act on the chemical bonds within large molecules (e.g., starch or cellulose), breaking them into simple sugars like glucose and fructose.
- -
- Optimization of reaction conditions: Proper temperature, pH, and reaction time are controlled to maximize hydrolysis efficiency.
- -
- Process monitoring: The hydrolysis progress is regularly observed to ensure process consistency.
- c.
- Fermentation stage
- -
- Inoculation with microorganisms: Yeast (e.g., Saccharomyces cerevisiae) is added to the substrate containing sugars from hydrolysis.
- -
- Fermentation process: Microorganisms metabolize sugars, producing bioethanol and carbon dioxide. The optimum temperature is maintained at 30–35 °C.
- -
- Process monitoring: The bioethanol concentration, fermentation time, and pH are closely monitored to ensure process efficiency.
- -
- Completion of fermentation: This process continues until all available sugars are consumed, yielding a high concentration of ethanol.
- -
- Separation and purification: The fermentation mixture is separated from the solid residues via filtration or centrifugation, and the bioethanol is further purified through distillation.
- d.
- Distillation and purification stage
- -
- Pre-distillation: The fermentation mixture containing bioethanol, water, and other substances is heated in a distiller. Ethanol, which has a lower boiling point than water, evaporates first.
- -
- Condensation: The ethanol vapors are condensed in a cooling system and collected in a separate container.
- -
- Further distillation: To increase the ethanol concentration, the distillation process may be repeated or extended in a distillation column, separating ethanol vapor from residual water.
- -
- Dehydration: To remove any remaining water, additional dehydration methods, such as zeolite adsorption or azeotropic distillation, are applied.
- -
- Testing and standardization: The final ethanol product is tested to ensure compliance with purity standards. The ethanol concentration is monitored before use or marketing.
- ✓
- Scenario A2: Bioactive Peptide Production via Enzymatic Hydrolysis of Food Waste
- Raw material selection and preparation
- 2.
- Enzyme activity
- 3.
- Peptide purification
- ✓
- Scenario A3: Organic Acid Production via Enzymatic Hydrolysis of Food Waste
- Preparation of raw materials
- 2.
- Enzyme selection and application
- 3.
- Analysis and use of organic acids
6.3. Development of the Second Step B: Determining and Assessing Costs and Benefits
- -
- Cost identification
- -
- Cost actualization
- -
- Benefits identification
- -
- Benefits actualization
- -
- Calculation of cost-benefit and benefit-cost ratios
- Identification of costs associated with the three scenarios (A1–A3)
- Implementation costs
- 2.
- Maintenance process costs
- 3.
- Post-implementation costs
- Actualization of costs
| fa1 = 1/(1 + 0.05)1 = 0.952 fa2 = 1/(1 + 0.05)2 = 0.907 fa3 = 1/(1 + 0.05)3 = 0.863 fa4 = 1/(1 + 0.05)4 = 0.822 fa5 = 1/(1 + 0.05)5 = 0.783 | fa6 = 1/(1 + 0.05)6 = 0.746 fa7 = 1/(1 + 0.05)7 = 0.710 fa8 = 1/(1 + 0.05)8 = 0.676 fa9 = 1/(1 + 0.05)9 = 0.644 fa10 = 1/(1 + 0.05)10 = 0.613 |
| Cost Type | Cost Value for A1 (EUR) | Total | |
|---|---|---|---|
| (EUR) | |||
| Initial costs for implementation | Pre-treatment equipment | 20,000 | 745,000 |
| Enzymatic hydrolysis equipment | 300,000 | ||
| Fermentation and distillation reactors | 400,000 | ||
| Purification and separation plants | 10,000 | ||
| Enzymes for hydrolysis | 5000 | ||
| Transportation and logistics costs | 4000 | ||
| Legal and license costs | 6000 | ||
| Operation and maintenance costs | Employment costs (salaries) | 40,000 | 105,000 |
| Energy costs (electricity, heat) | 30,000 | ||
| Equipment maintenance costs | 10,000 | ||
| Operating enzyme costs | 6000 | ||
| Operating costs of distillation and fermentation equipment | 16,000 | ||
| Secondary waste management costs | 3000 | ||
| Post-implementation costs | Monitoring and continuous evaluation costs | 5000 | 50,000 |
| Reporting and compliance costs | 10,000 | ||
| Product development: creating new applications or products derived from starch | 20,000 | ||
| Capacity extension: expanding infrastructure to increase production volume | 15,000 | ||
| Total | 900,000 | ||
| Cost Type | Cost Value for A2 (EUR) | Total | |
|---|---|---|---|
| (EUR) | |||
| Initial costs for implementation | Pre-treatment equipment | 16,000 | 92,000 |
| Enzymatic hydrolysis equipment | 24,000 | ||
| Fermentation and distillation reactors | 30,000 | ||
| Purification and separation of plants | 10,000 | ||
| Enzymes for hydrolysis | 6000 | ||
| Transportation and logistics costs | 2000 | ||
| Legal and license costs | 4000 | ||
| Operation and maintenance costs | Employment costs (salaries) | 20,000 | 68,000 |
| Energy costs (electricity, heat) | 8000 | ||
| Equipment maintenance costs | 4000 | ||
| Operating enzyme costs | 12,000 | ||
| Operating costs of distillation and fermentation equipment | 24,000 | ||
| Secondary waste management costs | 1600 | ||
| Post-implementation costs | Monitoring and continuous evaluation costs | 5000 | 14,600 |
| Reporting and compliance costs | 3000 | ||
| Product development: creating new applications or products derived from starch | 1000 | ||
| Capacity extension: expanding infrastructure to increase production volume | 5600 | ||
| Total | 174,600 | ||
| Cost Type | Cost Value for A3 (EUR) | Total | |
|---|---|---|---|
| (EUR) | |||
| Initial costs for implementation | Pre-treatment equipment | 14,000 | 108,000 |
| Enzymatic hydrolysis equipment | 30,000 | ||
| Fermentation and distillation reactors | 36,000 | ||
| Purification and separation of plants | 12,000 | ||
| Enzymes for hydrolysis | 8000 | ||
| Transportation and logistics costs | 3000 | ||
| Legal and license costs | 5000 | ||
| Operation and maintenance costs | Employment costs (salaries) | 36,000 | 93,000 |
| Energy costs (electricity, heat) | 24,000 | ||
| Equipment maintenance costs | 10,000 | ||
| Operating enzyme costs | 6000 | ||
| Operating costs of distillation and fermentation equipment | 14,000 | ||
| Secondary waste management costs | 3000 | ||
| Post-implementation costs | Monitoring and continuous evaluation costs | 1000 | 10,000 |
| Reporting and compliance costs | 2000 | ||
| Product development: creating new applications or products derived from starch | 4000 | ||
| Capacity extension: expanding infrastructure to increase production volume | 3000 | ||
| Total | 211,000 | ||
6.4. Estimation of Economic, Ecological, Social Benefits
| Year (t) | Cit | Cexpt | Ct = Cit + Cexpt | fa | Cat = Ct x fa |
|---|---|---|---|---|---|
| 1 | 115,000 | 0 | 115,000 | 0.95 | 109,250 |
| 2 | 0 | 105,000 | 105,000 | 0.91 | 95,550 |
| 3 | 0 | 105,000 | 105,000 | 0.86 | 90,300 |
| 4 | 0 | 105,000 | 105,000 | 0.82 | 86,100 |
| 5 | 0 | 105,000 | 105,000 | 0.78 | 81,900 |
| 6 | 0 | 105,000 | 105,000 | 0.75 | 78,750 |
| 7 | 0 | 105,000 | 105,000 | 0.71 | 74,550 |
| 8 | 0 | 105,000 | 105,000 | 0.68 | 71,400 |
| 9 | 0 | 105,000 | 105,000 | 0.64 | 67,200 |
| 10 | 10,500 | 0 | 10,500 | 0.61 | 6405 |
| Total | 761,405 | ||||
| Year (t) | Cit | Cexpt | Ct = Cit + Cexpt | fa | Cat = Ct x fa |
|---|---|---|---|---|---|
| 1 | 92,000 | 0 | 92,000 | 0.95 | 87,400 |
| 2 | 0 | 68,000 | 68,000 | 0.91 | 61,880 |
| 3 | 0 | 68,000 | 68,000 | 0.86 | 58,480 |
| 4 | 0 | 68,000 | 68,000 | 0.82 | 55,760 |
| 5 | 0 | 68,000 | 68,000 | 0.78 | 53,040 |
| 6 | 0 | 68,000 | 68,000 | 0.75 | 51,000 |
| 7 | 0 | 68,000 | 68,000 | 0.71 | 48,280 |
| 8 | 0 | 68,000 | 68,000 | 0.68 | 46,240 |
| 9 | 0 | 68,000 | 68,000 | 0.64 | 43,520 |
| 10 | 14,600 | 0 | 14,600 | 0.61 | 8906 |
| Total | 514,506 | ||||
| Year (t) | Cit | Cexpt | Ct = Cit + Cexpt | fa | Cat = Ct x fa |
|---|---|---|---|---|---|
| 1 | 108,000 | 0 | 108,000 | 0.95 | 102,600 |
| 2 | 0 | 93,000 | 93,000 | 0.91 | 84,630 |
| 3 | 0 | 93,000 | 93,000 | 0.86 | 79,980 |
| 4 | 0 | 93,000 | 93,000 | 0.82 | 76,260 |
| 5 | 0 | 93,000 | 93,000 | 0.78 | 72,540 |
| 6 | 0 | 93,000 | 93,000 | 0.75 | 69,750 |
| 7 | 0 | 93,000 | 93,000 | 0.71 | 66,030 |
| 8 | 0 | 93,000 | 93,000 | 0.68 | 63,240 |
| 9 | 0 | 93,000 | 93,000 | 0.64 | 59,520 |
| 10 | 10,000 | 0 | 10,000 | 0.61 | 6100 |
| Total | 680,650 | ||||
- Benefits identification
- Benefits actualization
| Type of Benefit | Bioethanol | Peptides | Organic Acids |
|---|---|---|---|
| Economic | Direct benefits (5% of total costs) | Direct benefits (5% of total costs) | Direct benefits (5% of total costs) |
| Social |
|
|
|
|
|
| |
|
|
| |
| Environmental |
|
|
|
|
|
| |
|
|
|
| Scenario | Economic Benefits (EUR/Year) | Social Benefits (EUR/Year) | Environmental Benefits (EUR/Year) | Total (EUR/Year) |
|---|---|---|---|---|
| A1 | 11,525 | 430,000 | 725,000 | 1,166,525 |
| A2 | 8730 | 315,000 | 564,000 | 887,730 |
| A3 | 10,550 | 280,000 | 425,000 | 715,550 |
| Year | Annual Benefits (Ba) (EUR) | Actualization Factor (fa) | Actualized Benefits (Bat) A1 (EUR) | Actualized Benefits (Bat) A2 (EUR) | Actualized Benefits (Bat) A3 (EUR) |
|---|---|---|---|---|---|
| 1 | 0 | 0.952 | 0 | 0 | 0 |
| 2 | 1,166,525 | 0.907 | 1,058,038.18 | 805,171.11 | 649,003.85 |
| 3 | 1,166,525 | 0.863 | 1,006,711.08 | 766,110.99 | 617,519.65 |
| 4 | 1,166,525 | 0.822 | 958,883.55 | 729,714.06 | 588,182.1 |
| 5 | 1,166,525 | 0.783 | 913,389.075 | 695,092.59 | 560,275.65 |
| 6 | 1,166,525 | 0.746 | 870,227.65 | 662,246.58 | 533,800.3 |
| 7 | 1,166,525 | 0.71 | 828,232.75 | 630,288.3 | 508,040.5 |
| 8 | 1,166,525 | 0.676 | 788,570.9 | 600,105.48 | 483,711.8 |
| 9 | 1,166,525 | 0.644 | 751,242.1 | 571,698.12 | 46,0814.2 |
| 10 | 0 | 0.613 | 0 | 0 | 0 |
| Total | 7,175,295.28 | 5,460,427.23 | 4,401,348.05 | ||
- Calculation and analysis of cost-benefit (C/B) and benefit-cost (B/C) ratios
- Cost-benefit and benefit-cost ratios
- ✓
- Benefit-Cost (B/C) Ratio
- ✓
- Cost-Benefit (C/B) Ratio
6.5. Calculation of Economic Performance Indicators: Net Present Value—NPV and Internal Rate of Return—IRR and Sensitivity Analysis
6.5.1. Net Present Value and Internal Rate of Return
- IRR > cost of capital: when the IRR exceeds the cost of capital (minimum required rate of return), the scenario is deemed profitable and should be considered for implementation.
- IRR = cost of capital: when the IRR equals the cost of capital, the project is marginally profitable, sitting at the threshold of financial viability.
- IRR < cost of capital: when the IRR is lower than the cost of capital, the project is considered unprofitable and is unlikely to be a viable investment.
- NPV > 0: A positive NPV indicates profitability, meaning the present value of benefits exceeds the present value of costs. The project should be accepted.
- NPV = 0: A zero NPV signifies that the project is at the break-even point, where the benefits exactly match the costs. Such a project is marginally acceptable.
- NPV < 0: A negative NPV reflects unprofitability, indicating that costs outweigh benefits and that the project should likely be rejected.
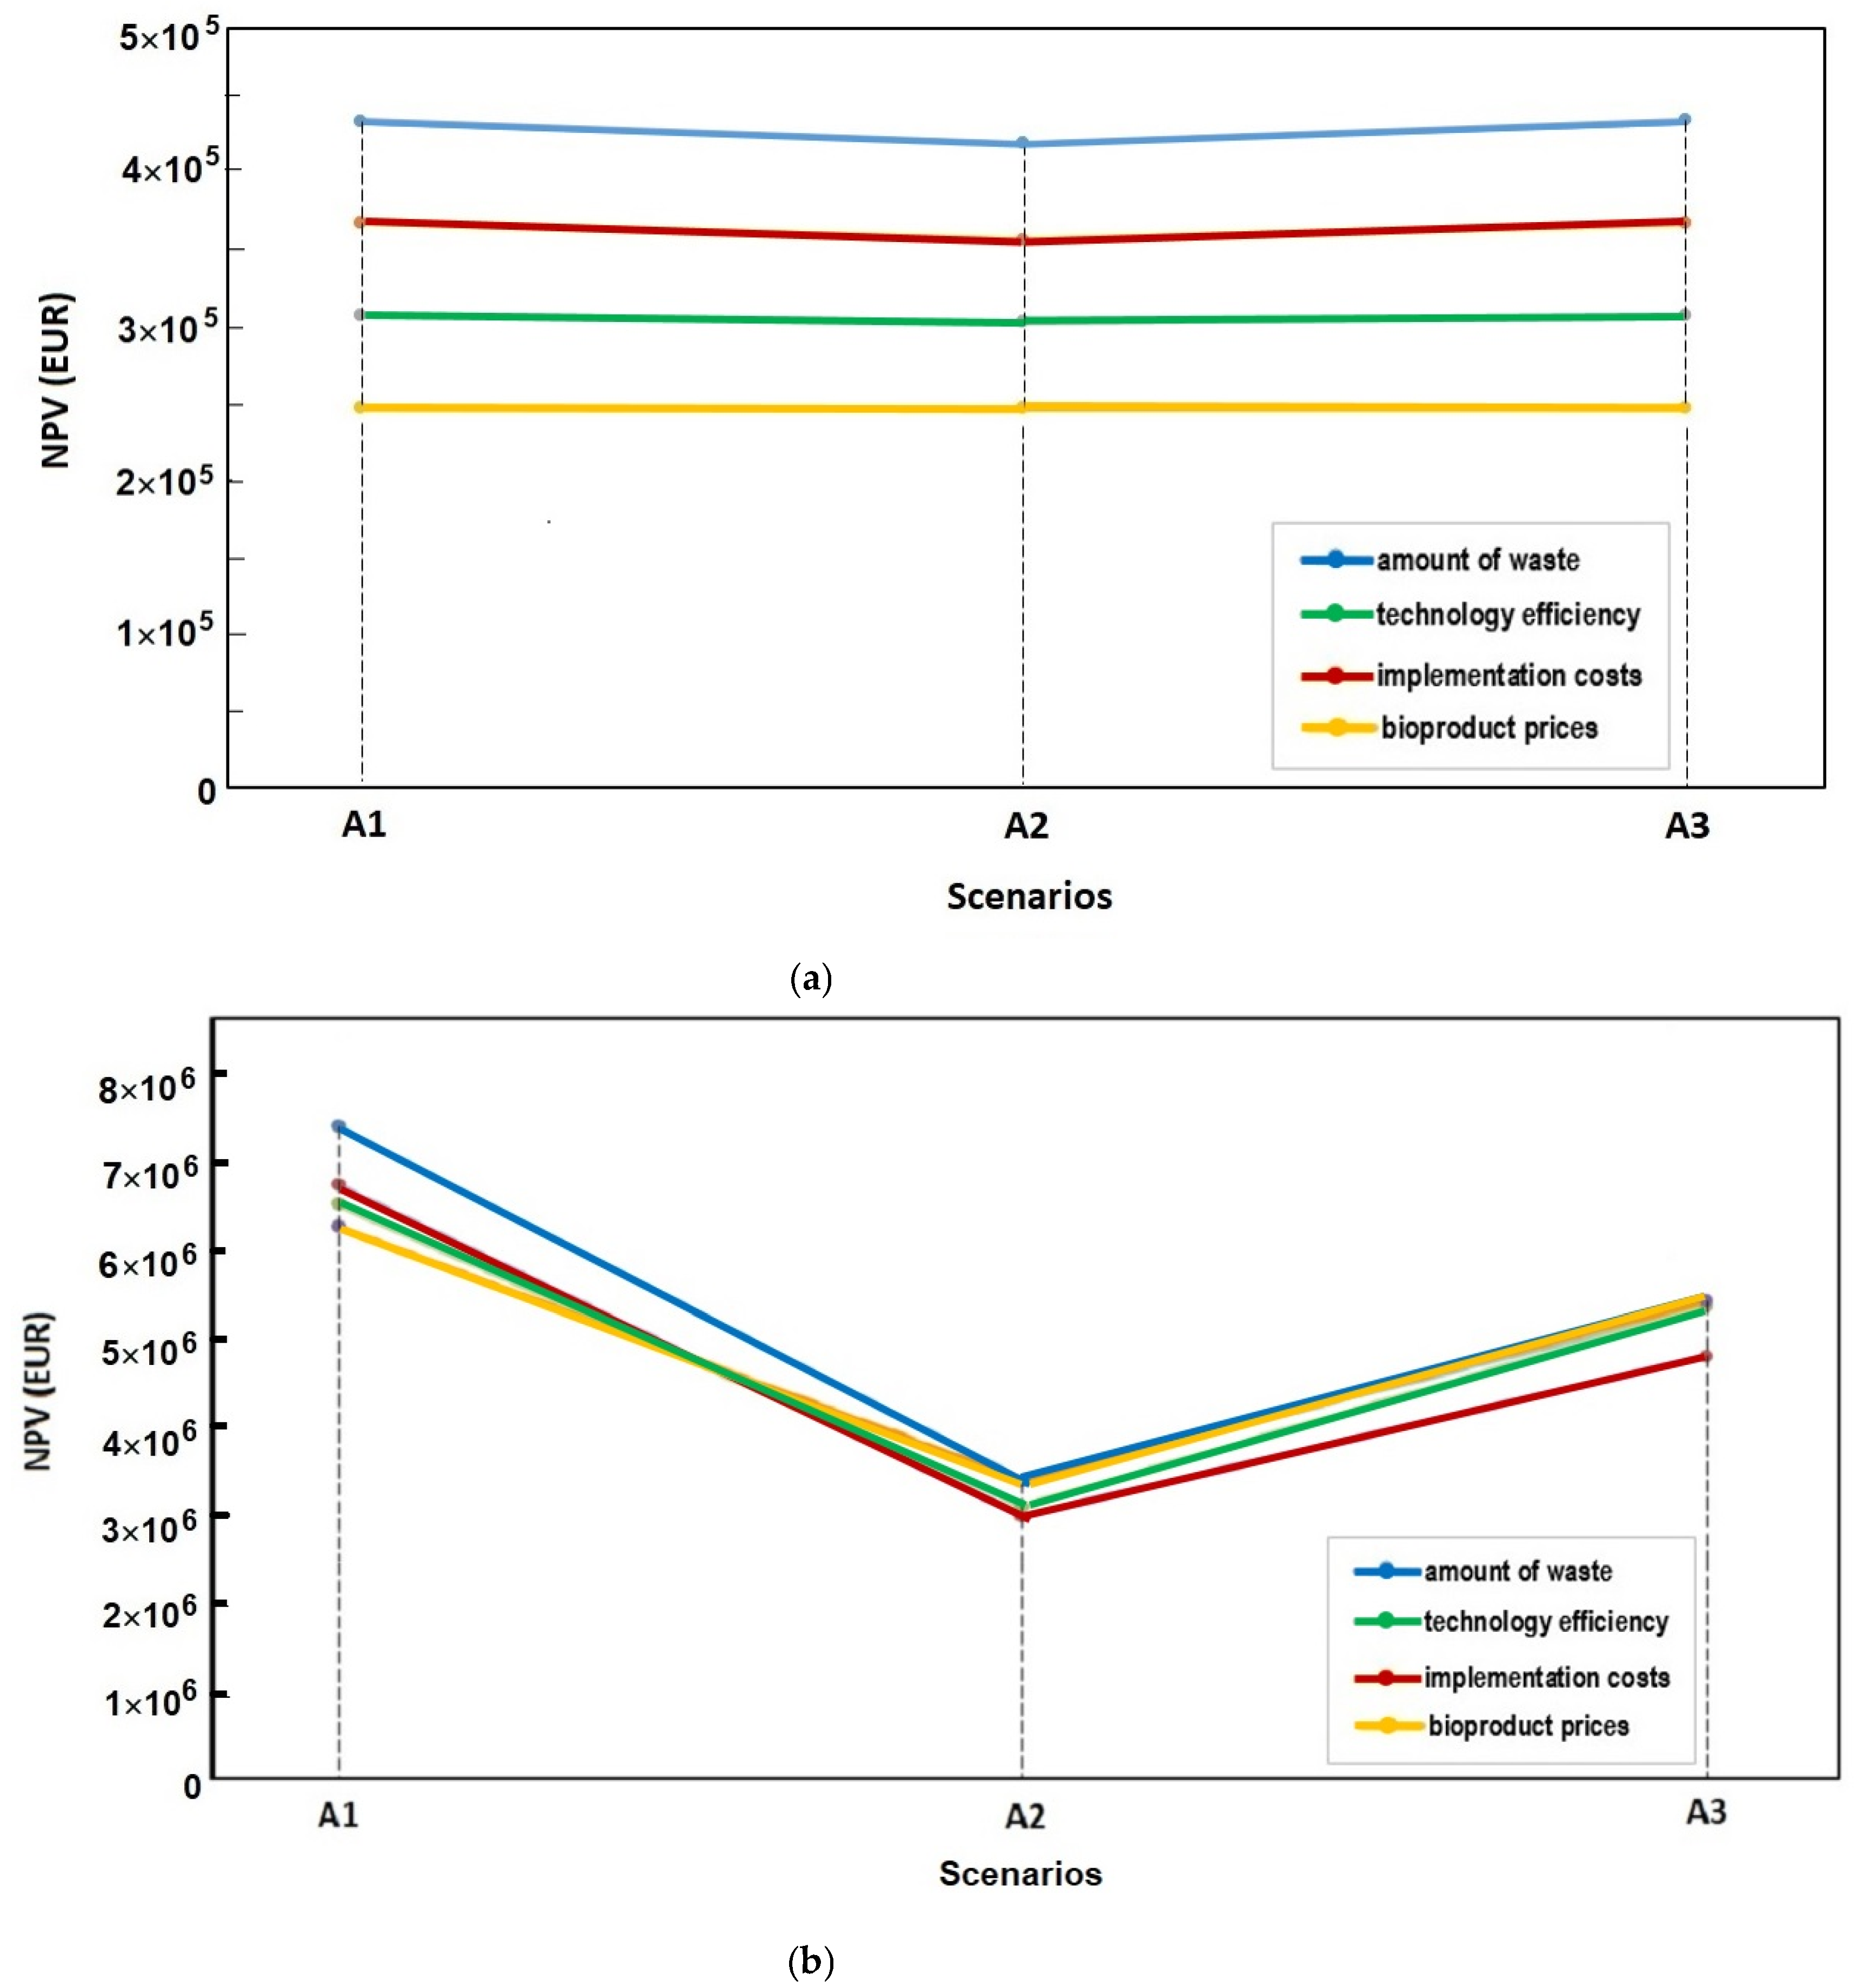
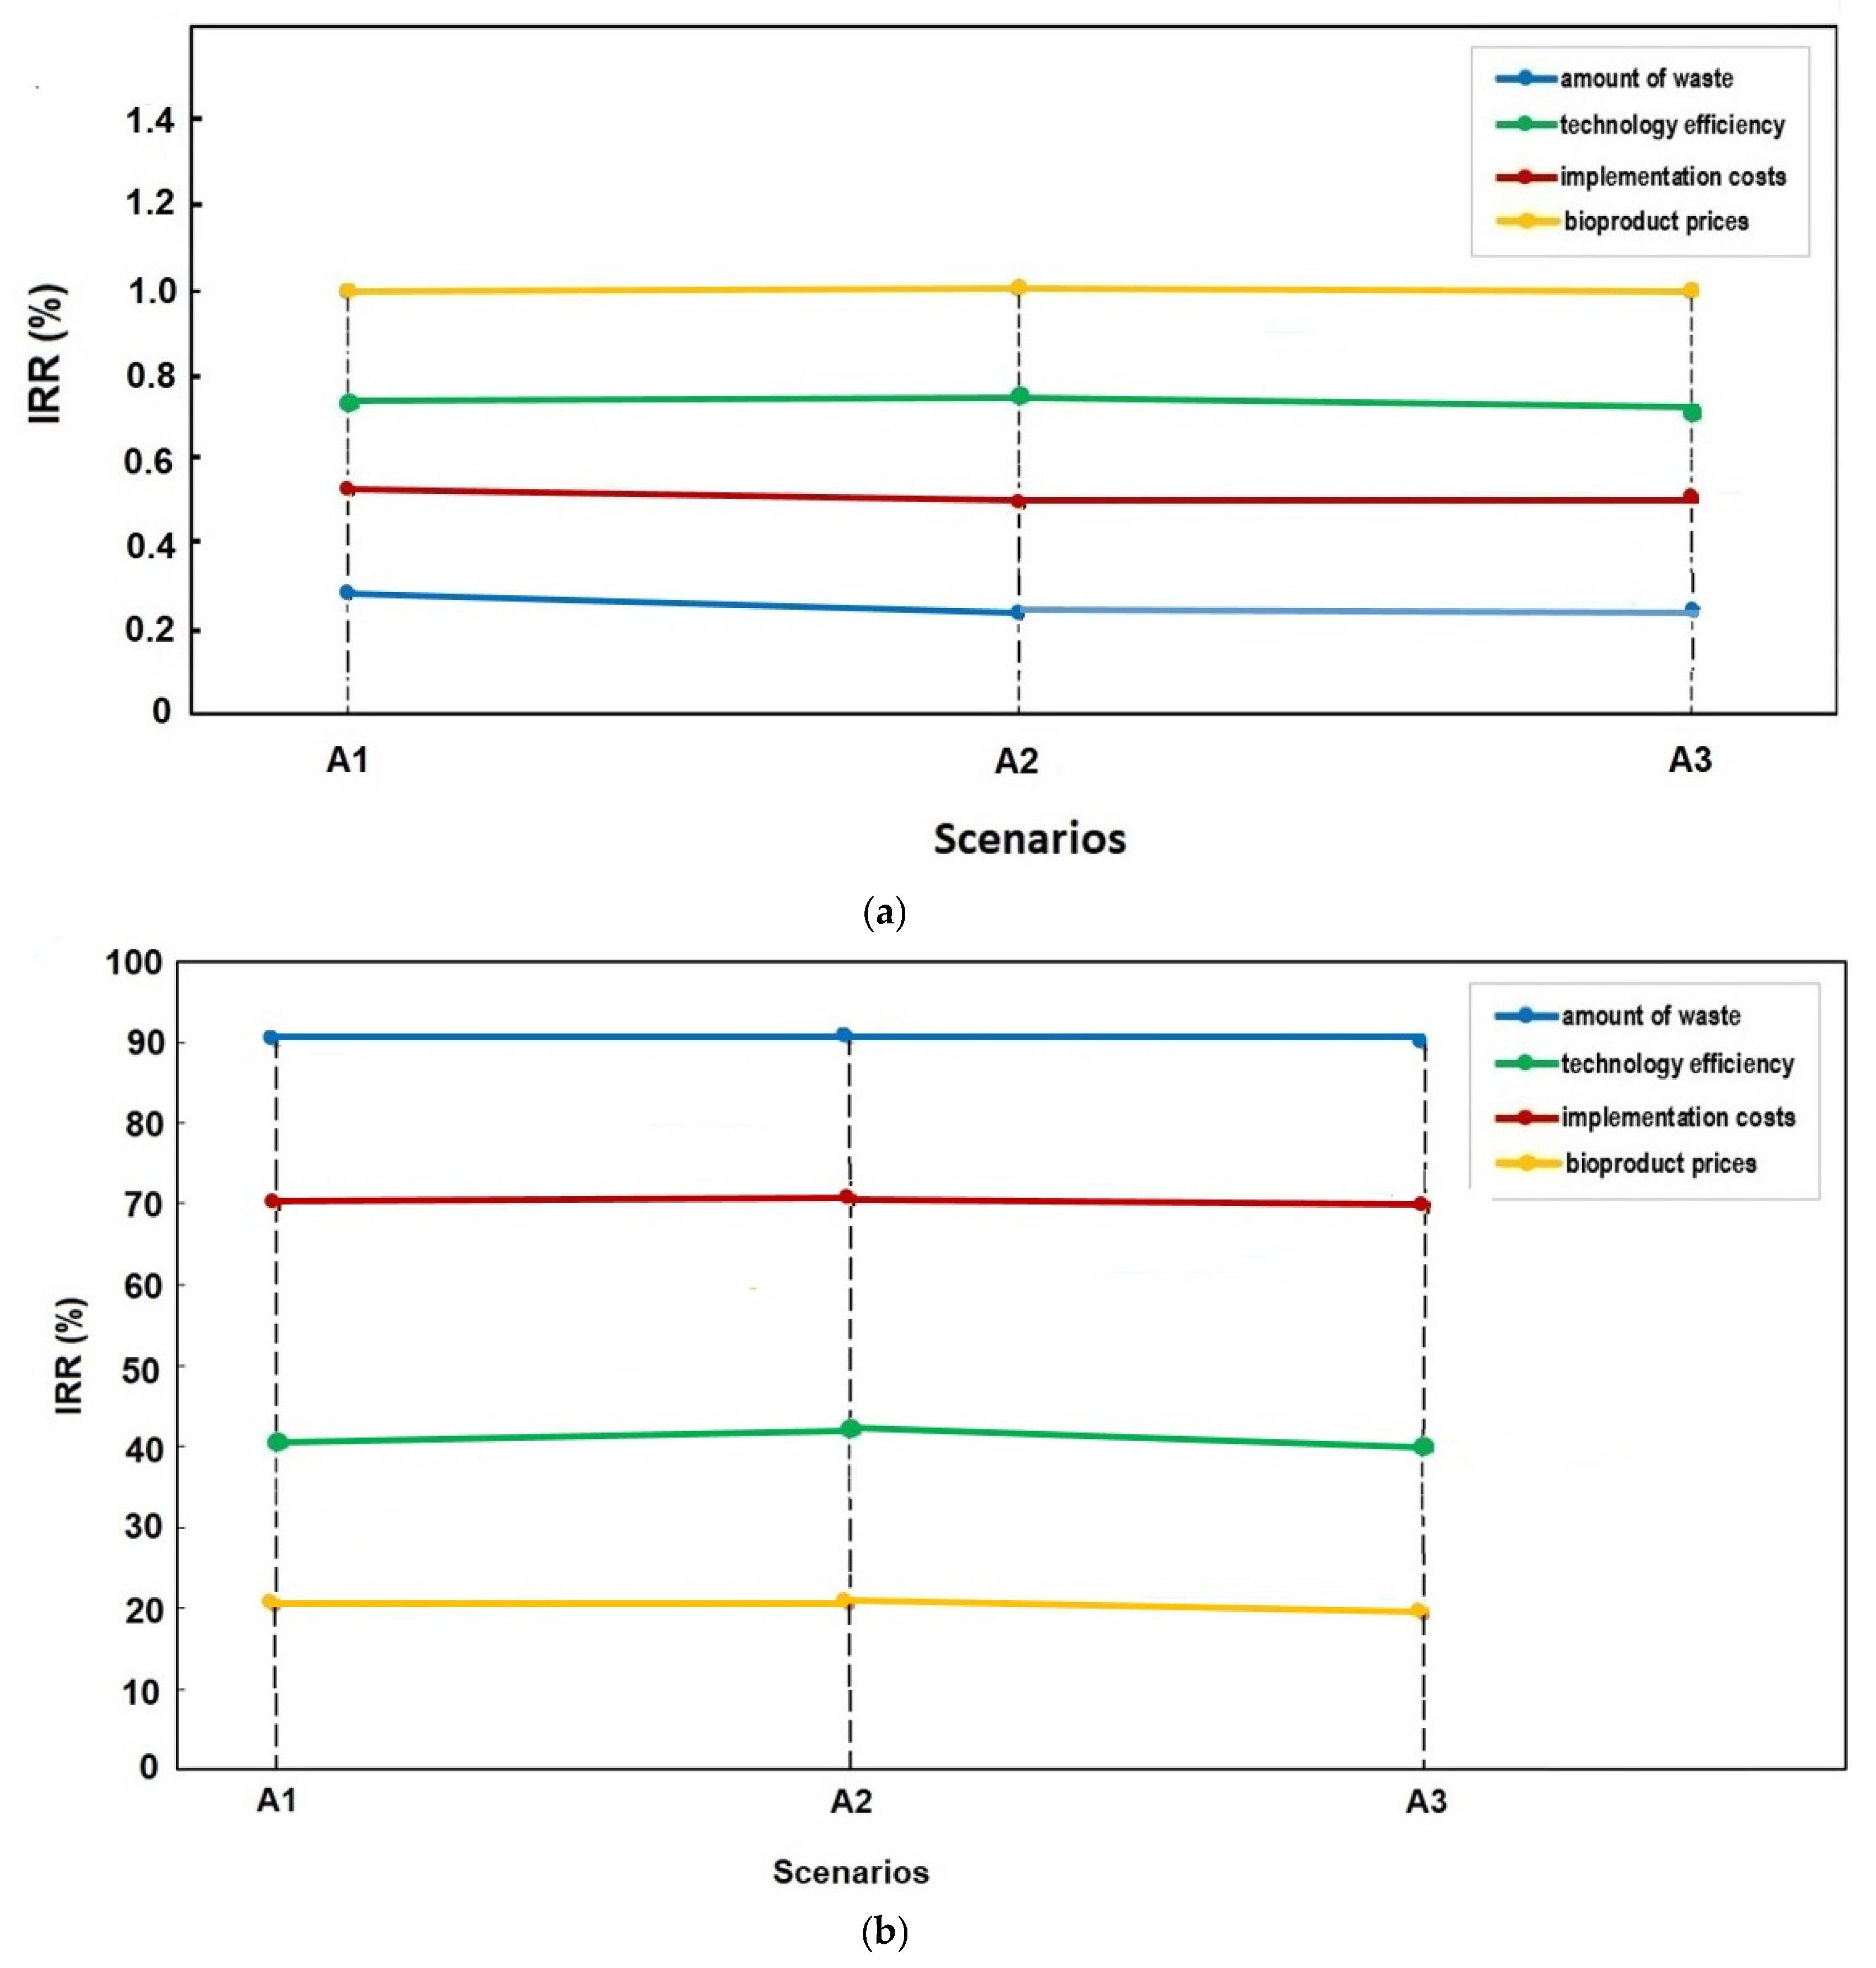
6.5.2. Sensitivity Analysis
7. Conclusions
Author Contributions
Funding
Institutional Review Board Statement
Informed Consent Statement
Data Availability Statement
Acknowledgments
Conflicts of Interest
References
- Kaza, S.; Yao, L.; Bhada-Tata, P.; Van Woerden, F. What a Waste 2.0: A Global Snapshot of Solid Waste Management to 2050; The World Bank: Washington, DC, USA, 2018. Available online: https://www.google.ro/books/edition/What_a_Waste_2_0/bnN_DwAAQBAJ?hl=en&gbpv=1 (accessed on 29 November 2024).
- Hoornweg, D.; Bhada-Tata, P. What a Waste: A Global Review of Solid Waste Management; World Bank Urban Development Series Knowledge Papers; The World Bank: Washington, DC, USA, 2012. Available online: https://openknowledge.worldbank.org (accessed on 22 November 2024).
- FAO. Global Food Losses and Food Waste—Extent, Causes and Prevention; Food and Agriculture Organization: Rome, Italy, 2011. Available online: https://www.fao.org/4/mb060e/mb060e.pdf (accessed on 29 November 2024).
- European Commission. EU Platform on Food Losses and Food Waste; European Commission: Brussels, Belgium, 2015. Available online: https://food.ec.europa.eu/food-safety/food-waste/eu-actions-against-food-waste/eu-platform-food-losses-and-food-waste_en (accessed on 29 November 2024).
- Parfitt, J.; Barthel, M.; Macnaughton, S. Food waste within food supply chains: Quantification and potential for change to 2050. Philos. Trans. R. Soc. B 2010, 365, 3065–3081. [Google Scholar] [CrossRef] [PubMed]
- WRAP. Household Food and Drink Waste in the United Kingdom 2012; Waste & Resources Action Programme: Banbury, UK, 2013. Available online: https://www.wrap.ngo/sites/default/files/2020-12/Household-Food-and-Drink-Waste-in-the-United-Kingdom-2012.pdf (accessed on 29 November 2024).
- FAO. The State of Food Security and Nutrition in the World 2019: Safeguarding Against Economic Slowdowns and Downturns; Food and Agriculture Organization: Rome, Italy, 2019. Available online: https://openknowledge.fao.org/server/api/core/bitstreams/16480532-17e9-4b61-b388-1d6d86414470/content (accessed on 29 November 2024).
- FAO. Food Losses and Waste in the Context of Sustainable Food Systems. Committee on World Food Security (CFS 41, 2014). Policy Recommendations; Food and Agriculture Organization of the United Nations: Rome, Italy, 2014. Available online: https://openknowledge.fao.org/server/api/core/bitstreams/ac8a2fa6-fee0-4473-bfd6-2eddf8c7030c/content (accessed on 29 November 2024).
- IPCC. Special Report on Climate Change and Land Use; Intergovernmental Panel on Climate Change: Geneva, Switzerland, 2019; Available online: https://unfccc.int/documents/196536?gad_source=1&gclid=CjwKCAiAjKu6BhAMEiwAx4UsAvAAhp25k3OKHIwEFvamJDlZaJZxDpzX7uPiW7dR_5aLk3U60cQGARoCrXwQAvD_BwE (accessed on 29 November 2024).
- UNEP. Food and Food Waste; United Nations Environmental Programme: Nairobi, Kenya, 2020. Available online: https://www.unep.org/topics/chemicals-and-pollution-action/circularity-sectors/food-and-food-waste (accessed on 29 November 2024).
- European Commission. Food Loss and Waste Prevention; European Commission: Brussels, Belgium, 2020. Available online: https://food.ec.europa.eu/horizontal-topics/farm-fork-strategy/food-loss-and-waste-prevention_en (accessed on 29 November 2024).
- Maroldi, W.V.; Andrade Arruda Fernandes, I.; Demczuk, B.; Pedro, A.C.; Maciel, G.M.; Haminiuk, C.W.I. Waste from the food industry: Innovations in biorefineries for sustainable use of resources and generation of value. Bioresour. Technol. 2024, 413, 131447. [Google Scholar] [CrossRef]
- Mitchell, S. Health Effects of Waste Mismanagement; World Cleanup Day: Tallinn, Estonia, 2023. Available online: https://www.worldcleanupday.org/post/health-effects-of-waste-mismanagement (accessed on 29 November 2024).
- European Commission. Communication from the Commission to the European Parliament, the Council, the European Economic and Social Committee and the Committee of the Regions. A New Circular Economy Action Plan for a Cleaner and More Competitive Europe; European Commission: Brussels, Belgium, 2020. Available online: https://eur-lex.europa.eu/resource.html?uri=cellar:9903b325-6388-11ea-b735-01aa75ed71a1.0017.02/DOC_1&format=PDF (accessed on 29 November 2024).
- Ghisellini, P.; Cialani, C.; Ulgiati, S. A review on circular economy: The expected transition to balanced interactions of environmental, economic, and social systems. J. Clean. Prod. 2016, 114, 11–32. [Google Scholar] [CrossRef]
- Stahel, W.R. The Circular Economy: A User’s Guide; Routledge: London, UK, 2019. [Google Scholar]
- Ellen MacArthur Foundation. Towards the Circular Economy: Economic and Business Rationale for an Accelerated Transition; Ellen MacArthur Foundation: Cowes, UK, 2012. Available online: https://www.ellenmacarthurfoundation.org (accessed on 29 November 2024).
- UNEP. Global Waste Management Outlook; United Nations Environment Programme: Nairobi, Kenya, 2024. Available online: https://wedocs.unep.org/bitstream/handle/20.500.11822/44939/global_waste_management_outlook_2024.pdf?sequence=1&isAllowed=y (accessed on 29 November 2024).
- FAO. The State of Food and Agriculture 2019: Moving Forward on Food Loss and Waste Reduction; Food and Agriculture Organization of the United Nations: Rome, Italy, 2019. Available online: https://openknowledge.fao.org/server/api/core/bitstreams/11f9288f-dc78-4171-8d02-92235b8d7dc7/content (accessed on 29 November 2024).
- Romanian Government. Law 217/2016 for the Prevention of Food Waste; Romanian Official Monitor: Bucharest, Romania, 2016. Available online: https://www.legi-internet.ro (accessed on 29 November 2024).
- FAO. Tackling Food Loss and Waste: A Triple Win Opportunity; Food and Agriculture Organization: Rome, Italy, 2022. Available online: https://www.fao.org/newsroom/detail/FAO-UNEP-agriculture-environment-food-loss-waste-day-2022/en (accessed on 29 November 2024).
- European Commission. Directive 2008/98/EC of the European Parliament and of the Council of 19 November 2008 on Waste and Repealing Certain Directives; European Commission: Brussels, Belgium, 2008.
- Romanian Ministry of Environment. National Plan for Waste Management; Romanian Ministry of Environment: Bucharest, Romania, 2017. Available online: https://mmediu.ro/app/webroot/uploads/files/PNGD_vers5.pdf (accessed on 29 November 2024).
- Waste Trade. Public-Private Partnerships for Sustainable Food Waste Management; Waste Trade: Gqeberha, South Africa, 2020. Available online: https://www.wastetrade.com/resources/recycling/public-private-partnerships-in-waste-management/ (accessed on 29 November 2024).
- UNDP. Sustainable Development Goal 12: Responsible Consumption and Production. United Nations Development Program: New York, NY, USA. Available online: https://www.undp.org/sustainable-development-goals/responsible-consumption-and-production (accessed on 29 November 2024).
- FAO. The State of Food and Agriculture 2020: Overcoming Water Challenges in Agriculture; Food and Agriculture Organization: Rome, Italy, 2020. Available online: https://openknowledge.fao.org/server/api/core/bitstreams/6e2d2772-5976-4671-9e2a-0b2ad87cb646/content (accessed on 29 November 2024).
- European Commission. Communication from the Commission to the European Parliament, the European Council, the Council, the European Economic and Social Committee and the Committee of the Regions the European Green Deal; European Commission: Brussels, Belgium, 2019. [Google Scholar]
- Woo, S. EU Strategy for the Circular Economy: Overview; HKTDC Research: Hong Kong, China, 2024. Available online: https://research.hktdc.com/en/article/MTgxOTg5NjcxOA (accessed on 29 November 2024).
- USEPA. Learn About Food Recovery Challenge; United States Environmental Protection Agency: Washington, DC, USA, 2024. Available online: https://www.epa.gov/sustainable-management-food/learn-about-food-recovery-challenge (accessed on 29 November 2024).
- Onyeaka, H.; Mansa, R.F.; Wong, C.M.V.L.; Miri, T. Bioconversion of Starch Base Food Waste into Bioethanol. Sustainability 2022, 14, 11401. [Google Scholar] [CrossRef]
- Chavan, S.; Yadav, B.; Atmakuri, A.; Tyagi, R.D.; Wong, J.W.C.; Drogui, P. Bioconversion of Organic Wastes into Value-Added Products: A Review. Bioresour. Technol. 2022, 344, 126398. [Google Scholar] [CrossRef]
- Sharma, V.; Tsai, M.-L.; Nargotra, P.; Chen, C.-W.; Kuo, C.-H.; Sun, P.-P.; Dong, C.-D. Agro-Industrial Food Waste as a Low-Cost Substrate for Sustainable Production of Industrial Enzymes: A Critical Review. Catalysts 2022, 12, 1373. [Google Scholar] [CrossRef]
- Karmee, S.K. Moving towards the Application of Biocatalysis in Food Waste Biorefinery. Fermentation 2023, 9, 73. [Google Scholar] [CrossRef]
- Hwang, S.; Kim, S.; Park, J. Advances in composting technology for organic waste. Bioresour. Technol. 2020, 302, 122889. [Google Scholar] [CrossRef]
- Dutta, S.; He, M.; Xiong, X.; Tsang, D.C.W. Sustainable Management and Recycling of Food Waste Anaerobic Digestate: A Review. Bioresour. Technol. 2021, 341, 125915. [Google Scholar] [CrossRef]
- Mishra, K.; Siwal, S.S.; Nayaka, S.K.; Guan, Z.; Thakur, V.K. Waste-to-chemicals: Green Solutions for Bioeconomy Markets. Sci. Total Environ. 2023, 887, 164006. [Google Scholar] [CrossRef]
- Drago, E.; Campardelli, R.; Pettinato, M.; Perego, P. Innovations in Smart Packaging Concepts for Food: An Extensive Review. Foods 2020, 9, 1628. [Google Scholar] [CrossRef] [PubMed]
- Taner, O.O. Vacuum Freeze Dryer Technology for Extending the Shelf Life of Food and Protecting the Environment: A Scenario Study of the Energy Efficiency. Environ. Sci. Pollut. Res. 2024, 31, 38573–38584. [Google Scholar] [CrossRef] [PubMed]
- Pournader, M.; Ghaderi, H.; Hassanzadegan, A.; Fahimnia, B. Artificial Intelligence Applications in Supply Chain Management. Int. J. Prod. Econ. 2021, 241, 108250. [Google Scholar] [CrossRef]
- Rejeb, A.; Keogh, J.G.; Rejeb, K. Big Data in the Food Supply Chain: A Literature Review. J. Data Inf. Manag. 2022, 4, 33–47. [Google Scholar] [CrossRef]
- de Almeida Oroski, F.; Monteiro da Silva, J. Understanding Food Waste-Reducing Platforms: A Mini-Review. Waste Manag. Res. 2023, 41, 816–827. [Google Scholar] [CrossRef]
- Cane, M.; Parra, C. Digital Platforms: Mapping the Territory of New Technologies to Fight Food Waste. Br. Food J. 2020, 122, 1647–1669. [Google Scholar] [CrossRef]
- Wang, Q.; Li, H.; Feng, K.; Liu, J. Oriented Fermentation of Food Waste towards High-Value Products: A Review. Energies 2020, 13, 5638. [Google Scholar] [CrossRef]
- Salas-Millán, J.Á.; Aguayo, E. Fermentation for Revalorisation of Fruit and Vegetable By-Products: A Sustainable Approach Towards Minimising Food Loss and Waste. Foods 2024, 13, 3680. [Google Scholar] [CrossRef]
- Ungureanu-Comăniță, E.-D.; Coșbuc, E.L.; Cozma, P.; Smaranda, C.; Gavrilescu, M. Human Health Risks Concerning Food Waste Management. In Proceedings of the 2020 International Conference on e-Health and Bioengineering (EHB), Iasi, Romania, 29–30 October 2020; IEEE: New York, NY, USA, 2020. [Google Scholar] [CrossRef]
- Vasic, K.; Knez, Z.; Leitgeb, M. Bioethanol Production by Enzymatic Hydrolysis from Different Lignocellulosic Sources. Molecules 2021, 26, 753. [Google Scholar] [CrossRef]
- Singh, A.; Singhania, R.R.; Soam, S.; Chen, C.-W.; Haldar, D.; Varjani, S.; Chang, J.-S.; Dong, C.-D.; Patel, A.K. Production of bioethanol from food waste: Status and perspectives. Bioresour. Technol. 2022, 360, 127651. [Google Scholar] [CrossRef]
- Zhang, C.; Kang, X.; Wang, F.; Tian, Y.; Liu, T.; Su, Y.; Qian, T.; Zhang, Y. Valorization of Food Waste for Cost-Effective Reducing Sugar Recovery in a Two-Stage Enzymatic Hydrolysis Platform. Energy 2020, 208, 118379. [Google Scholar] [CrossRef]
- Torres-León, C.; Chávez-González, M.L.; Hernández-Almanza, A.; Martínez-Medina, G.A.; Ramírez-Guzmán, N.; Londoño-Hernández, L.; Aguilar, C.N. Recent advances on the microbiological and enzymatic processing for conversion of food wastes to valuable bioproducts. Curr. Opin. Food Sci. 2021, 38, 40–45. [Google Scholar] [CrossRef]
- Schmeier, N.P.; Gomes, L.P.; Rohnelt, M.G.; Wirth, A.; Silva da Silva, G.C.; Flores da Rosa, L.; Schiavo Miranda, L.A.; Oliveira Caetano, M. Evaluation of Potential for Anaerobic Digestion of Source-Segregated Domestic Food Wastes. Environ. Eng. Manag. J. 2022, 21, 579–588. [Google Scholar]
- Westerholm, M.; Liu, T.; Schnurer, A. Comparative Study of Industrial-Scale High-Solid Biogas Production from Food Waste: Process Operation and Microbiology. Bioresour. Technol. 2020, 304, 122981. [Google Scholar] [CrossRef] [PubMed]
- Harvey, J.; Smith, A.; Goulding, J.; Branco Illodo, I. Food Sharing, Redistribution, and Waste Reduction via Mobile Applications: A Social Network Analysis. Ind. Mark. Manag. 2020, 88, 437–448. [Google Scholar] [CrossRef]
- da Costa, T.P.; Gillespie, J.; Cama-Moncunill, X.; Ward, S.; Condell, J.; Ramanathan, R.; Murphy, F. A Systematic Review of Real-Time Monitoring Technologies and Its Potential Application to Reduce Food Loss and Waste: Key Elements of Food Supply Chains and IoT Technologies. Sustainability 2023, 15, 614. [Google Scholar] [CrossRef]
- Du, H.; Sun, X.; Chong, X.; Yang, M.; Zhu, Z.; Wen, Y. A review on smart active packaging systems for food preservation: Applications and future trends. Trends Food Sci. Technol. 2023, 141, 104200. [Google Scholar] [CrossRef]
- Haji, M.; Kerbache, L.; Muhammad, M.; Al-Ansari, T. Roles of Technology in Improving Perishable Food Supply Chains. Logistics 2020, 4, 33. [Google Scholar] [CrossRef]
- Sanciolo, P.; Rivera, E.; Navaratna, D.; Duke, M.C. Food Waste Diversion from Landfills: A Cost–Benefit Analysis of Existing Technological Solutions Based on Greenhouse Gas Emissions. Sustainability 2022, 14, 6753. [Google Scholar] [CrossRef]
- Read, Q.D.; Muth, M.K. Cost-Effectiveness of Four Food Waste Interventions: Is Food Waste Reduction a “Win–Win?”. Resour. Conserv. Recycl. 2021, 168, 105448. [Google Scholar] [CrossRef]
- Bibra, M.; Samanta, D.; Sharma, N.K.; Singh, G.; Johnson, G.R.; Sani, R.K. Food Waste to Bioethanol: Opportunities and Challenges. Fermentation 2023, 9, 8. [Google Scholar] [CrossRef]
- Li, J.; Cheng, W. Comparison of Life-Cycle Energy Consumption, Carbon Emissions and Economic Costs of Coal to Ethanol and Bioethanol. Appl. Energy 2020, 277, 115574. [Google Scholar] [CrossRef]
- Mora, L.; Toldra, F. Advanced Enzymatic Hydrolysis of Food Proteins for the Production of Bioactive Peptides. Curr. Opin. Food Sci. 2023, 49, 100973. [Google Scholar] [CrossRef]
- Najafian, L. A Review of Bioactive Peptides as Functional Food Ingredients: Mechanisms of Action and their Applications in Active Packaging and Food Quality Improvement. Food Funct. 2020, 14, 5835–5857. [Google Scholar] [CrossRef]
- Wang, Q.; Yang, L.; Feng, K.; Li, H.; Deng, Z.; Liu, J. Promote Lactic Acid Production from Food Waste Fermentation using Biogas Slurry Recirculation. Bioresour. Technol. 2021, 337, 125393. [Google Scholar] [CrossRef]
- Swetha, T.A.; Ananthi, V.; Bora, A.; Sengottuvelan, N.; Ponnuchamy, K.; Muthusamy, G.; Arun, A. A review on biodegradable polylactic acid (PLA) production from fermentative food waste—Its applications and degradation. Int. J. Biol. Macromol. 2023, 234, 123703. [Google Scholar] [CrossRef]
- Intasian, P.; Prakinee, K.; Phintha, A.; Trisrivirat, D.; Weeranoppanant, N.; Wongnate, T.; Chaiyen, P. Enzymes, In Vivo Biocatalysis, and Metabolic Engineering for Enabling a Circular Economy and Sustainability. Chem. Rev. 2021, 121, 10367–10451. [Google Scholar] [CrossRef]
- Kumar, M.; Raut, R.D.; Jagtap, S.; Choubey, V.K. Circular Economy Adoption Challenges in the Food Supply Chain for Sustainable Development. Sustain. Dev. Rev. 2022, 3, 112–130. [Google Scholar] [CrossRef]
- Mak, T.M.W.; Xiong, X.; Tsang, D.C.W.; Yu, Y.K.M.; Poon, C.S. Sustainable Food Waste Management Towards Circular Bioeconomy: Policy Review, Limitations and Opportunities. Bioresour. Technol. 2020, 297, 122497. [Google Scholar] [CrossRef]
- Poinsot, P. Jules Dupuit (1804–1866): Cost-Benefit Analysis and Collective Choices. In Great Minds in Regional Science. Footprints of Regional Science; Batey, P., Plane, D., Eds.; Springer: Cham, Switzerland, 2020. [Google Scholar] [CrossRef]
- O’Mahony, T. Cost-Benefit Analysis and the Environment: The Time Horizon is of the Essence. Environ. Impact Assess. Rev. 2021, 89, 106587. [Google Scholar] [CrossRef]
- Florio, M.; Forte, S.; Pancotti, C.; Sirtori, E.; Vignetti, S. Exploring Cost-Benefit Analysis of Research, Development and Innovation Infrastructures: An Evaluation Framework. Res. Policy 2018, 47, 505–517. [Google Scholar] [CrossRef]
- Costanza, R.; Kubiszewski, I.; Stoeckl, N.; Kompas, T. Pluralistic Discounting Recognizing Different Capital Contributions: An Example Estimating the Net Present Value of Global Ecosystem Services. Ecol. Econ. 2021, 183, 106961. [Google Scholar] [CrossRef]
- Li, X.; Mettu, S.; Martin, G.J.O.; Ashokkumar, M.; Lin, C.S.K. Ultrasonic Pretreatment of Food Waste to Accelerate Enzymatic Hydrolysis for Glucose Production. Ultrason. Sonochem. 2019, 53, 77–82. [Google Scholar] [CrossRef] [PubMed]
- Christy, M.P.; Gopinath, L.R.; Divya, D. A review on Anaerobic Decomposition and Enhancement of Biogas Production through Enzymes and Microorganisms. Renew. Sustain. Energy Rev. 2014, 34, 167–173. [Google Scholar] [CrossRef]
- Kiran, E.U.; Trzcinski, A.P.; Liu, Y. Bioconversion of Food Waste to Energy: A Review. Fuel 2014, 134, 389–399. [Google Scholar] [CrossRef]
- Tamaian, R. Enhanced Biohydrogen Production from Food Waste via Separate Hydrolysis and Fermentation: A Sustainable Approach. Biol. Life Sci. Forum 2023, 31, 14. [Google Scholar] [CrossRef]
- Taheri, M.E.; Salimi, E.; Saragas, K.; Novakovic, J.; Barampouti, E.M.; Mai, S.; Malamis, D.; Moustakas, K.; Loizidou, M. Effect of Pretreatment Techniques on Enzymatic Hydrolysis of Food Waste. Biomass Convers. Biorefin. 2021, 11, 219–226. [Google Scholar] [CrossRef]
- Goyal, S.; Esposito, M.; Kapoor, A. Circular Economy Strategies for Combating Climate Change and Other Environmental Issues. Environ. Chem. Lett. 2023, 21, 345–357. [Google Scholar] [CrossRef]
- Ogunmakinde, O.E.; Sher, W.; Egbelakin, T. Circular Economy Pillars: A Semi-Systematic Review. Clean Technol. Environ. Policy 2021, 23, 899–914. [Google Scholar] [CrossRef]
- Santamaria, M.; Azqueta, D. Promoting Biofuels Use in Spain: A Cost-Benefit Analysis. Renew. Sustain. Energy Rev. 2015, 50, 1415–1424. [Google Scholar] [CrossRef]
- Geissdoerfer, M.; Savaget, P.; Bocken, N.M.P.; Hultink, E.J. The Circular Economy—A New Sustainability Paradigm? J. Clean. Prod. 2017, 143, 757–768. [Google Scholar] [CrossRef]
- Scandizzo, P.L. Impact and Cost–Benefit Analysis: A Unifying Approach. Econ. Struct. 2021, 10, 10. [Google Scholar] [CrossRef]
- Bhatia, S.K.; Jagtap, S.S.; Bedekar, A.A.; Bhatia, R.K.; Patel, A.K.; Pant, D.; Rajesh Banu, J.; Rao, C.V.; Kim, Y.G.; Yang, Y.H. Recent Developments in Pretreatment Technologies on Lignocellulosic Biomass: Effect of Key Parameters, Technological Improvements, and Challenges. Bioresour. Technol. 2020, 300, 122724. [Google Scholar] [CrossRef] [PubMed]
- Fagundes, V.D.; Freitag, J.F.; Simon, V.; Colla, L.M. Enzymatic Hydrolysis of Food Waste for Bioethanol Production. Rev. Bras. Cienc. Ambient. 2024, 59, e1978. [Google Scholar] [CrossRef]
- Roukas, T.; Kotzekidou, P. From Food Industry Wastes to Second Generation Bioethanol: A Review. Rev. Environ. Sci. Biotechnol. 2022, 21, 299–329. [Google Scholar] [CrossRef]
- Matsakas, L.; Christakopoulos, P. Ethanol Production from Enzymatically Treated Dried Food Waste Using Enzymes Produced On-Site. Sustainability 2015, 7, 1446–1458. [Google Scholar] [CrossRef]
- Gopinath, P.; Arun, J.; Madhu, S.; Naveen, S. Enhancing the Dilute Acid Hydrolysis Process Using a Machine Learning Approach for Bioethanol Production. Biomass Convers. Biorefin. 2024, 14, 168–180. [Google Scholar] [CrossRef]
- Saeed, M.A.; Ma, H.; Yue, S.; Wang, Q.; Tu, M. Concise Review on Ethanol Production from Food Waste: Development and Sustainability. Environ. Sci. Pollut. Res. 2018, 25, 28851–28863. [Google Scholar] [CrossRef]
- Guzzon, R.; Villega, T.R.; Pedron, M.; Malacarne, M.; Nicolini, G.; Larcher, R. Simultaneous Yeast–Bacteria Inoculum: A Feasible Solution for the Management of Oenological Fermentation in Red Must with Low Nitrogen Content. Ann. Microbiol. 2013, 63, 805–808. [Google Scholar] [CrossRef]
- Kiran, E.U.; Liu, Y. Bioethanol Production from Mixed Food Waste by an Effective Enzymatic Pretreatment. Fuel 2015, 159, 463–469. [Google Scholar] [CrossRef]
- Feng, Y.; Tian, X.; Chen, Y.; Wang, Z.; Xia, J.; Qian, J.; Zhuang, Y.; Chu, J. Real-Time and On-Line Monitoring of Ethanol Fermentation Process by Viable Cell Sensor and Electronic Nose. Bioresour. Bioprocess 2021, 8, 37. [Google Scholar] [CrossRef] [PubMed]
- Seo, H.-B.; Kim, H.-J.; Lee, O.-K.; Ha, J.-H.; Lee, H.-Y.; Jung, K.-H. Measurement of Ethanol Concentration Using Solvent Extraction and Dichromate Oxidation and Its Application to Bioethanol Production Process. J. Ind. Microbiol. Biotechnol. 2009, 36, 285–292. [Google Scholar] [CrossRef] [PubMed]
- Amornraksa, S.; Subsaipin, I.; Simasatitkul, L.; Assabumrungrat, S. Systematic Design of Separation Process for Bioethanol Production from Corn Stover. BMC Chem. Eng. 2020, 2, 10. [Google Scholar] [CrossRef]
- Garcia, V.; Pakkila, J.; Ojamo, H.; Muurinen, E.; Keiski, R.L. Challenges in Bioethanol Production: How to Improve the Process Efficiency? Renew. Sustain. Energy Rev. 2015, 44, 142–154. [Google Scholar] [CrossRef]
- Jankovic, T.; Straathof, A.J.J.; McGregor, I.R.; Kiss, A.A. Design of a Novel Pass-Through Distillation Process for Bioethanol Recovery. Comput. Aided Chem. Eng. 2024, 53, 2443–2448. [Google Scholar] [CrossRef]
- Kiss, A.A.; Ignat, R.M. Enhanced Bioethanol Dehydration by Extractive and Azeotropic Distillation in Dividing-Wall Columns. Sep. Purif. Technol. 2012, 86, 70–78. [Google Scholar] [CrossRef]
- Raeva, V.M. Bioethanol Dehydration: State of the Art. Theor. Found. Chem. Eng. 2010, 44, 545–556. [Google Scholar] [CrossRef]
- Quan, C.; Li, H.M.; Huang, T.; Zhang, W.; Ding, Z.T.; Shen, Y.X. High-precision analysis of ethanol in bioethanol by gas chromatography with flame ionization detector. Accred. Qual. Assur. 2012, 17, 535–541. [Google Scholar] [CrossRef]
- Iavarone, C.; O’Callaghan, Y.; O’Keeffe, M.B. Bioactive Peptides from Food Waste: A Review of Their Generation, Functionality, and Potential Applications. Food Chem. 2019, 272, 93–106. [Google Scholar] [CrossRef]
- Sanchez, A.; Vazquez, A. Bioactive Peptides: A Review. Food Qual. Saf. 2017, 1, 29–46. [Google Scholar] [CrossRef]
- Naveed, M.; Nadeem, F.; Mehmood, T.; Bilal, M.; Anwar, Z.; Amjad, F. Protease—A Versatile and Ecofriendly Biocatalyst with Multi-Industrial Applications: An Updated Review. Catal. Lett. 2021, 151, 307–323. [Google Scholar] [CrossRef]
- He, R.; Aluko, R.E. Structural Characterization of Enzymatic Plant Protein Hydrolysates. Curr. Opin. Food Sci. 2018, 19, 70–75. [Google Scholar] [CrossRef]
- Motte, J.-C.; Escudie, R.; Bernet, N.; Delgenes, J.-P. Dynamic Effect of Initial pH on Biohydrogen Production from a Food Waste Leachate in Repeated Batch Conditions. Int. J. Hydrogen Energy 2013, 38, 15893–15900. [Google Scholar] [CrossRef]
- Komesu, A.; Oliveira, J.A.R.; Martins, L.H.; da Silva Maciel, M.R.W.; Filho, R.M. Lactic Acid Production to Purification: A Review. BioResources 2017, 12, 4364–4383. Available online: https://bioresources.cnr.ncsu.edu/resources/lactic-acid-production-to-purification-a-review/ (accessed on 1 December 2024). [CrossRef]
- Chua, G.K.; Chew, F.N.; Mortan, S.H.; Yazid, N.A. Protease Production from Fishery Wastes for Sustainable Development of Industrial Biotechnology in Malaysia. Environ. Eng. Manag. J. 2023, 22, 671–688. [Google Scholar] [CrossRef]
- Bilal, M.; Niu, D.; Wang, Z. Biotechnological Strategies and Perspectives for Food Waste Treatment: The Role of Lactic Acid and Microbial Biomass. Waste Biomass Valoriz. 2024, 15, 1234–1250. [Google Scholar] [CrossRef]
- Comăniță, E.-D. Tools for Decision Making in the Sustainable Use of Waste as Materials and Energy Resources. Ph.D. Thesis, Gheorghe Asachi Technical University of Iasi, Iasi, Romania, 2016. [Google Scholar]
- Ghiga, S.C.; David, M.; Minuț, M.; Ungureanu-Comăniță, E.-D.; Cozma, P.; Gavrilescu, M. Reducing Health and Ecological Risks by Using WEEE as Secondary Sources for Critical Raw Materials. In Proceedings of the 2020 International Conference on e-Health and Bioengineering (EHB), Iasi, Romania, 29–30 October 2020; IEEE: New York, NY, USA, 2020. [Google Scholar] [CrossRef]
- Comăniță, E.-D.; Ghinea, C.; Roșca, M.; Smaranda, C.; Favier, L.; Gostin, I.; Iordache, Ş.; Gavrilescu, M. Impact of Climate Change on the Production of Polyvinyl Chloride (PVC) and Polyhydroxyalkanoates (PHAS): A Comparative Approach. Sci. Papers J. Hortic. Ser. 2015, 58, 253–260. [Google Scholar]
- Comăniță, E.-D.; Ghinea, C.; Hlihor, R.M.; Simion, I.M.; Smaranda, C.; Favier, L.; Roșca, M.; Gostin, I.; Gavrilescu, M. Challenges and Opportunities in Green Plastics: An Assessment Using the ELECTRE Decision-Aid Method. Environ. Eng. Manag. J. 2015, 14, 689–702. [Google Scholar] [CrossRef]
- Comăniță, E.-D.; Ghinea, C.; Hlihor, R.M.; Gavrilescu, M. Occurrence of Plastic Waste in the Environment: Ecological and Health Risks. Environ. Eng. Manag. J. 2016, 15, 675–687. [Google Scholar] [CrossRef]

| Category | Solutions/Technologies | Description |
|---|---|---|
| Prevention and source reduction | ||
| Smart inventory management | AI-based forecasting, real-time monitoring, freshness-tracking barcodes | Optimizes stock levels and prevents over-purchasing |
| Innovative packaging | Active, intelligent, and biodegradable packaging | Extends shelf life and indicates spoilage |
| Portion control tools | Portioning devices, menu engineering | Reduces over-serving in hospitality and catering |
| Redistribution and donation | ||
| Food rescue platforms | Apps like Too Good to Go, OLIO, FoodCloud | Connects surplus food from businesses to consumers or charities |
| Real-time tracking | Blockchain systems | Ensures traceability and compliance in food donation |
| Policy incentives | Liability protection, tax benefits | Encourages food donations by reducing risks and offering financial incentives |
| Recycling and valorization | ||
| Composting technologies | On-site composters, aerobic digesters | Converts food waste into fertilizer |
| Bioenergy production | Anaerobic digestion, pyrolysis, gasification | Produces biogas, biochar, or bio-oils from food waste |
| Insect bioconversion | Black Soldier Fly larvae (BSFL) systems | Converts waste into protein-rich feed and fertilizer |
| Upcycling and product development | ||
| Upcycled food products | Spent grain-based snacks, fruit peel wraps | Transforms food waste into new consumable products |
| Biorefineries | Extraction of antioxidants, enzymes, and bio-pigments | Converts waste into high-value compounds |
| 3D food printing | Reusing byproducts for printed food items | Creates new, edible items from food waste |
| Data-driven insights and AI | ||
| IoT-enabled smart bins | Sensors in bins measuring waste volume and type | Provides actionable data for reduction strategies |
| Predictive analytics | AI models analyzing consumer behavior | Optimizes supply chain management and prevents overproduction |
| Education and awareness | ||
| Consumer education | Awareness campaigns, apps, workshops | Promotes better storage, planning, and creative use of leftovers |
| Business training | Staff training, certification programs | Encourages waste reduction practices in retail and hospitality sectors |
| Policy and infrastructure support | ||
| Date label standardization | Simplified “use by” vs. “best before” labeling | Prevents premature disposal of safe food |
| Waste reporting | Mandatory tracking of food waste | Helps monitor and reduce waste volumes |
| Centralized composting | Large-scale facilities for waste processing | Produces soil enhancers and supports agricultural sustainability |
| Cold chain improvements | Advanced refrigeration and transport systems | Reduces spoilage during distribution |
| Circular economy initiatives | ||
| Community kitchens | Repurposing surplus food into meals for underserved communities | Supports food security and waste reduction |
| Zero-waste markets | Bulk purchases, reusable packaging | Minimizes packaging waste and encourages sustainable consumer habits |
| Product Type | Source Materials | Processing Methods | Applications |
|---|---|---|---|
| Bioethanol | Carbohydrate-rich food waste (e.g., starchy residues, fruit peels, bread waste) | Fermentation (using yeast or bacteria) | Renewable energy (transport fuels, energy generation), reducing reliance on fossil fuels |
| Bioactive peptides | Protein-rich food waste (e.g., dairy byproducts, meat processing residues) | Enzymatic hydrolysis | Functional foods, nutraceuticals, dietary supplements with health benefits (antioxidant, antihypertensive) |
| Organic acids | Diverse organic waste (e.g., vegetable residues, fruit waste) | Fermentation (microbial processes) | Food preservation, pharmaceuticals, biodegradable plastics (e.g., polylactic acid from lactic acid) |
| Biofertilizers | Organic waste (e.g., food scraps, plant residues) | Composting, anaerobic digestion | Soil enrichment, sustainable agriculture |
| Animal feed | Protein and energy-rich food waste (e.g., bakery waste, fruit pulp) | Processing (drying, bioconversion with insects) | Livestock feed, aquaculture feed, reducing dependence on conventional feedstocks |
| Bioplastics | Starch and sugar-rich waste (e.g., corn waste, potato peels) | Fermentation, polymerization | Sustainable packaging, biodegradable plastic products |
| Enzymes | Food industry byproducts (e.g., fruit peels, dairy whey) | Fermentation, enzyme extraction | Industrial processes (textile, detergent, food industries) |
| Essential oils | Aromatic waste (e.g., citrus peels, herb trimmings) | Steam distillation, solvent extraction | Food flavoring, cosmetics, aromatherapy |
| Pigments | Colorful waste (e.g., beetroot pulp, carrot peels) | Solvent extraction, microbial synthesis | Natural colorants for food, textiles, and cosmetics |
| Biohydrogen | Food waste high in organic matter | Dark fermentation, photoermentation | Clean energy source for fuel cells and power generation |
| Biogas | Organic waste (e.g., food scraps, kitchen waste) | Anaerobic digestion | Renewable energy for heating, electricity, and vehicle fuel |
| Methodology | Key Indicators | Applications | Benefits |
|---|---|---|---|
| Life Cycle Assessment (LCA) | Greenhouse gas emissions, water consumption, energy usage, and land use. | Comparing the environmental performance of landfilling, incineration, composting, anaerobic digestion, and other waste management approaches. | Provides a detailed understanding of the environmental trade-offs and hotspots in waste management systems. |
| Cost-Benefit Analysis (CBA) | Net present value (NPV), benefit-cost ratio (BCR), and payback period. | Assessing the financial viability of implementing recycling programs, energy recovery facilities, and composting initiatives. | Helps decision makers prioritize cost-effective and socially beneficial solutions. |
| Material Flow Analysis (MFA) | Resource recovery rates, waste diversion percentages, and material efficiency. | Evaluating the efficiency of resource recovery strategies like composting and bioenergy production. | Identifies inefficiencies and potential points for intervention within the system. |
| Sustainability Assessment Frameworks |
| Policy evaluation, strategy comparison, and monitoring sustainability goals. | Multi-Criteria Decision Analysis (MCDA) for integrating diverse indicators into decision-making processes. |
| Circular Economy Metrics | Recycling rates, resource utilization efficiency, and the proportion of waste converted into value-added products. | Measuring the success of initiatives like composting, anaerobic digestion, and enzymatic hydrolysis. | Supports the transition toward closed-loop systems that reduce waste and conserve resources. |
| Carbon and Water Footprint Analysis | Total greenhouse gas emissions and water consumption per unit of food waste processed. | Identifying management practices with the lowest carbon and water footprints. | Highlights practices that contribute to climate change mitigation and water conservation. |
| Social Impact Assessments (SIA) | Public health outcomes, employment rates, and social acceptance of waste management technologies. | Assessing the societal benefits of food redistribution programs and community composting initiatives. | Ensures that waste management systems align with social equity and well-being goals. |
| Policy and Governance Analysis | Policy implementation success rates, stakeholder participation, and compliance levels. | Monitoring the impacts of national laws, such as food waste reduction targets, and international agreements like the Sustainable Development Goals (SDGs). | Identifies gaps in regulatory frameworks and areas for improvement in governance structures. |
Disclaimer/Publisher’s Note: The statements, opinions and data contained in all publications are solely those of the individual author(s) and contributor(s) and not of MDPI and/or the editor(s). MDPI and/or the editor(s) disclaim responsibility for any injury to people or property resulting from any ideas, methods, instructions or products referred to in the content. |
© 2025 by the authors. Licensee MDPI, Basel, Switzerland. This article is an open access article distributed under the terms and conditions of the Creative Commons Attribution (CC BY) license (https://creativecommons.org/licenses/by/4.0/).
Share and Cite
Ghinea, C.; Ungureanu-Comăniță, E.-D.; Țâbuleac, R.M.; Oprea, P.S.; Coșbuc, E.D.; Gavrilescu, M. Cost-Benefit Analysis of Enzymatic Hydrolysis Alternatives for Food Waste Management. Foods 2025, 14, 488. https://doi.org/10.3390/foods14030488
Ghinea C, Ungureanu-Comăniță E-D, Țâbuleac RM, Oprea PS, Coșbuc ED, Gavrilescu M. Cost-Benefit Analysis of Enzymatic Hydrolysis Alternatives for Food Waste Management. Foods. 2025; 14(3):488. https://doi.org/10.3390/foods14030488
Chicago/Turabian StyleGhinea, Cristina, Elena-Diana Ungureanu-Comăniță, Raluca Maria Țâbuleac, Paula Sânziana Oprea, Ersilia Daniela Coșbuc, and Maria Gavrilescu. 2025. "Cost-Benefit Analysis of Enzymatic Hydrolysis Alternatives for Food Waste Management" Foods 14, no. 3: 488. https://doi.org/10.3390/foods14030488
APA StyleGhinea, C., Ungureanu-Comăniță, E.-D., Țâbuleac, R. M., Oprea, P. S., Coșbuc, E. D., & Gavrilescu, M. (2025). Cost-Benefit Analysis of Enzymatic Hydrolysis Alternatives for Food Waste Management. Foods, 14(3), 488. https://doi.org/10.3390/foods14030488