Article

Enhancement of Pea–Oat Composite Protein Gel Properties Through Ultrasound Treatment Affects Structural and Functional Characteristics

1
School of Food and Biological Engineering, Zhengzhou University of Light Industry, Zhengzhou 450002, China
2
School of Food and Health Engineering, Zhengzhou University of Technology, Zhengzhou 450044, China
3
China Institute of Functional Food of Shanxi, Shanxi Agricultural University, Taiyuan 030031, China
*
Authors to whom correspondence should be addressed.
Foods 2025, 14(21), 3751; https://doi.org/10.3390/foods14213751 (registering DOI)
Submission received: 10 September 2025 / Revised: 15 October 2025 / Accepted: 29 October 2025 / Published: 31 October 2025

Abstract

With increasing attention to health, plant protein products have gained significant market potential due to their growing consumer demand. This study researches the influence of ultrasonic treatment on the structure and function of pea–oat composite protein gel (POPG) to enhance its elasticity and thermal stability. The ultrasonic treatment parameters were regulated to power (200–600 W for 30 min) and ultrasonic time (20–40 min at 400 W) during the preparation of POPG, and the properties and structure, including gel strength, rheological analysis, water-holding capacity (WHC), thermal characteristics, fluorescence performance, and microstructure, were further evaluated. The results showed that the POPG samples exhibited optimal values in WHC, gel strength, surface hydrophobicity, free sulfhydryl amount, and endogenous fluorescence at 400 W ultrasonic for 30 min compared with the untreated POPG. Rheological analysis indicated that POPG displayed the highest storage modulus and improved viscoelasticity. Ultrasonication resulted in an augmentation in β-sheet content, hence creating a more compact network structure. DSC and TGA revealed improved thermal stability, while SEM and CLSM exhibited a homogeneous and firm gel structure of POPG. This research offers the theory that ultrasonic technology can improve the performance of plant-based composite gels.

1. Introduction

The growing demand for sustainable food production has accelerated the substitution of animal-derived ingredients with plant-based alternatives in food processing. Previous life-cycle assessments indicate that replacing 50% of animal-source proteins with plant-based analogues can decrease diet-related greenhouse gas emissions by 35% and agricultural land use by 56% [1]. Lately, plant proteins are receiving heightened focus as a viable alternative to animal proteins within the food processing sector and consumer market, owing to their abundant resources, cost-effectiveness, and high nutritional value [2]. Among numerous plant protein sources, peas and oats have emerged as key raw materials for development in the food sector, given their specific nutritional compositions, functional characteristics, and excellent processing adaptability. Pea protein, with a high protein content of 21–28%, has a relatively balanced amino acid composition but a relatively low methionine content [3]. However, amino acid complementation can be achieved by blending with oat protein, thereby enhancing the overall nutritional value. Moreover, pea protein is gluten-free and cost-effective, exhibiting excellent functional properties in food processing, including emulsification capacity, gelation capacity, and water-holding capacity, which makes it an ideal choice for gel-based products [4,5].
Oats have a protein content of 12–20%, and their essential amino acid composition is more balanced compared to other grains [6]. This protein possesses high digestibility and biological value, but its limited gelation capacity restricts its application in products [7]. Research indicates that the connections among several proteins may enhance the stability of gel networks during the gelation process while also improving the elasticity and toughness of gels and their structural compactness [8,9]. Therefore, compared to single-protein gels, composite protein gels exhibit superior gel texture and functional properties. Our research findings revealed that the pea–oat composite protein gel (POPG), prepared by mixing pea and oat proteins at a certain ratio, followed by the addition of transglutaminase (TG) and chitosan, exhibited satisfactory hardness and water-holding capacity (WHC). However, it still suffers from several drawbacks, including insufficient elasticity and inadequate thermal stability, which impede its wider use in food processing.
Ultrasound, being a non-thermal mechanical action method, has the characteristics of safety, high efficiency, and sustainable development and shows great potential in food applications [10]. Ultrasonic treatment induces conformational reorganization and aggregation state transition of protein molecules through cavitation effects and mechanical shear forces, diminishes the size of protein clusters, and consequently induces interactions and structural alterations within the protein, thereby effectively regulating the structure and function of gel systems. These alterations resulted in the exposure of reactive groups, including the development of sulfhydryl groups and hydrophobic residues, such as disulfide and dityrosine linkages. This alteration is strongly related to the increase of protein functional qualities, including thermal properties, gel strength, and water retention [11,12]. For instance, Gao, X. et al. [13] reported that ultrasound effectively improved the properties and microstructure of low-salt surimi gel. Xin, Y. et al. [14] reported that the ultrasonic pretreatment can markedly improve the gel strength of soy protein modified with emulsified coagulant and facilitates the development of a stable and homogeneous network structure. Liu, B. et al. [15] demonstrated that high-frequency ultrasonics effectively increased the gel strength, viscoelasticity, and WHC of myofibrillar protein.
The integration of plant proteins into processed foods can enhance high-quality protein content and substitute fat in certain products due to their superior gelling and viscoelastic capabilities, hence facilitating the development of healthier formulations. The current study indicates that research on soybean protein within the legume-cereal composite protein system has advanced; nevertheless, its application in food processing remains constrained due to anti-nutritional effects and the pronounced bean flavor of soybean. Consequently, we endeavored to utilize pea protein as the foundational legume protein, in conjunction with oat protein, to develop a novel plant protein gel and investigate its potential applications in food processing.
Despite our previous optimization of POPG system via enzyme hydrolysis followed by chitosan modification [16], the attributes of POPG are still unsatisfactory. This study is the first to incorporate ultrasound treatment, thereby filling the knowledge gap regarding ultrasound-induced structural and functional regulation of this system, hence enhancing the properties of POPG, aiming to evaluate the feasibility of ultrasonic treatment in the processing of plant protein gel goods.

2. Materials and Methods

2.1. Materials

The oat bran was sourced from Shanxi Huaqishun Food Technology Co., Ltd. (Linyi, China). Pea protein (purity of 92.1%) was purchased from Yawing Ecological Food Industry Co., Ltd. (Yucheng, China). Transglutaminase (TG, 10,000 U/g) was provided by Dongsheng Biotechnology Co., Ltd. (Taixing, China). Chitosan (DDA is 96.1%, Mw ≈ 200 kDa) was procured from Wananga Chemical Technology Co., Ltd. (Zhengzhou, China). All chemical reagents were acquired from Sinopharm Chemical Reagent Co., Ltd. (Shanghai, China).

2.2. Preparation of Oat Protein

Oat protein was made in the laboratory. Oat bran and deionized water were combined in a 1:10 (g:mL) ratio, with the addition of 1.5% β-glucanase. The pH was modified to 6.5 using a NaOH solution (1.0 mol/L), and the enzymatic hydrolysis was conducted at 50 °C for 30 min. The pH was modified to 9.6 using NaOH solution, followed by magnetic stirring for 2 h, centrifugation at 10,000 rpm at 4 °C for 10 min, and collection of the supernatant. The pH of the supernatant was adjusted to 4.4 using a 1.0 mol/L HCl solution, then centrifuged at 10,000 rpm at 4 °C for 10 min. The protein precipitate was thereafter collected and washed twice with water. The pH was modified to 7.0 using NaOH solution to redissolve the protein, after which the protein was freeze-dried. The yield was 16.14% based on the protein content in bran, and the purity of oat protein was 73.62%, as determined by the Kjeldahl method.

2.3. Preparation of POPG by Ultrasonic Treatment

The preparation process of POPG was as follows: Briefly, pea protein and oat protein were combined with deionized water at a ratio of 1:0.4 to prepare a 20% (w/w) aqueous solution. We used a SCIENTZ-IID ultrasonic cell disruptor (Ningbo Scientz Biotechnology Co., Ltd., Ningbo, China) for the ultrasonic treatment. Two sets of experiments were conducted: (1) the power was fixed at 400 W, and the time was varied (20, 25, 30, 35, and 40 min); (2) the ultrasonic time was fixed at 30 min, and the power was varied (200, 300, 400, 500, and 600 W). After ultrasonic treatment, TG (40 U/g) was blended into the protein solution and completely dissolved. The hybrid was then maintained at 45 °C for 1 h by a HH-S6 thermostatic water bath (Beijing Keweiyongxing Instrument Co., Ltd., Beijing, China). Next, chitosan powder was added directly into the dispersion to give a final concentration of 2% (w/w) relative to the total dry mass (pea + oat protein + chitosan), and the mixture was heated at 95 °C for 30 min, instantly cooled to room temperature using an ice-water bath, and then kept at 4 °C for 24 h to get the ultrasonicated POPG. The POPG without ultrasonic treatment served as the control.

2.4. Gel Strength Analysis

The gel strength test method was conducted according to Liu et al. [17] with slight modifications. The sample (diameter: 20 mm; height: 30 mm) was assessed using the XT Plus texture analyzer (Stable Micro Systems, Godalming, Surrey, UK). A TA10 probe was selected to move at a constant velocity of 1.0 mm/s, and the compression distance was 15 mm. The peak force measured during compression was designated as the strength (g) of the gel during the initial compression.

2.5. Water Holding Capacity (WHC) Analysis

The WHC of the sample was measured according to the method of Meng et al. [18]. The sample was sliced into small cubic pieces, and their original mass was accurately noted. The sample was then wrapped with filter paper and centrifuged at 8000 r/min for 10 min. The sample pieces were immediately removed and reweighed. The WHC was determined with the given formula:
W H C ( % ) = m 2 m 1 × 100 %
where m1 and m2 denote the mass (g) before and after centrifugation, respectively.

2.6. Rheological Analysis

2.6.1. Frequency Sweep Test

The method of frequency sweep test was conducted according to Wu et al. [19] with modifications. The sample, cut into cylindrical shapes with a diameter of 1.5 mm and a height of 1 mm using a blade, was tested using a Discovery HR-1 rotational rheometer (TA Instruments Inc., New Castle, DE, USA) at 25 °C. A 40 mm parallel-plate fixture (model PP50) was employed via a 1 mm gap and 0.5% strain amplitude. The storage modulus (G′) and loss modulus (G″) were recorded at frequencies between 0.1 and 100 rad/s.

2.6.2. Strain Sweep Test

The test method was modified from Taktak et al. [20]. The sample was tested with a 40 mm parallel-plate fixture (model PP50) at a fixed frequency of 1 Hz and temperature of 25 °C. A strain sweep ranging from 0.1% to 100% was conducted to measure the G′ and G″.

2.7. Thermal Stability Analysis

2.7.1. Differential Scanning Calorimetry (DSC) Analysis

The method of the thermal characteristics test was modified from Sahraee et al. [21]. Briefly, 8 mg of freeze-dried sample within a sealed aluminum plate was heated from 30 to 120 °C at a rate of 5 °C/min under nitrogen by using a DSC 4000 heat-flow differential scanning calorimeter (PerkinElmer Instruments Co., Ltd., Shanghai, China). An empty aluminum plate served as the control. The To (onset temperature), Tp (peak temperature), and Tc (conclusion temperature) were noted, and ΔH (denaturation enthalpy value) was computed from integration of the peak area.

2.7.2. Thermogravimetric (TGA) Analysis

The method for the thermal stability test was modified from Li et al. [22]. Briefly, by using a Mettler Toledo thermal gravimetric analyzer (Mettler Toledo International Inc., Greifensee, Switzerland), 8 mg of freeze-dried POPG was encapsulated in an aluminum plate and exposed to heating from 40 to 700 °C at an average speed of 10 °C/min under a nitrogen flow. The weight changes and the first derivative of the weight loss rate of the POPG samples were recorded during the heating process.

2.8. Free Sulfhydryl and Disulfide Bonds Analysis

The test method was determined according to Shen et al. [12] with slight modifications. Briefly, 15 mg of the sample was added to 5 mL of Tris-glycine buffer for analysis, while an additional 15 mg was dissolved in 5 mL of Tris-glycine-urea buffer for total sulfhydryl analysis. The mixture was centrifuged at 10,000 r/min for 10 min. Subsequently, 20 µL of Ellman’s reagent (4 mg/mL DTNB) was incorporated into 1 mL of each supernatant. The absorbance was measured at 412 nm. The calculation formulas for free sulfhydryl, total sulfhydryl, and disulfide bonds were as follows:
F r e e   s u l f h y d r y l   ( μ m o l / g ) = 73.53   ×   D   ×   A 412 C
D i s u l f i d e   b o n d s   ( μ m o l / g ) = T o t a l   s u l f h y d r y l f r e e   s u l f h y d r y l 2
where A412 denotes the absorbance of the sample. The dilution factor (D) for the free sulfhydryl groups is 5.02, and the dilution factor for the total sulfhydryl groups is 10. C denotes the mass concentration of the sample (mg·mL−1).

2.9. Surface Hydrophobicity Analysis

The method of the surface hydrophobicity test was modified from Ma et al. [23]. In summary, 1.50 g of the sample was added to 15 mL of 10 mM phosphate buffer (pH 7.0) and centrifuged at 8000 r/min for 5 min. The upper aqueous phase was collected and diluted with the same buffer to obtain protein concentrations of 0.1, 0.2, 0.4, 0.6, and 0.8 mg/mL. An aliquot (2 mL) of each dilution was combined with 10 μL of 8 mM ANS solution and placed in the dark at room temperature for 15 min. The experiment was conducted with the excitation wavelength set at 390 nm and the emission wavelength set at 460 nm.

2.10. Intermolecular Forces Analysis

The test was according to the method of Zhu et al. [24] with slight modifications. The sample was added in four distinct solutions: 0.05 mol/L NaCl solution (S1), 0.6 mol/L NaCl solution (S2), 0.6 mol/L NaCl solution with 1.5 mol/L urea (S3), and 0.6 mol/L NaCl solution with 8 mol/L urea (S4). The mixture was centrifuged at 5000× g for 20 min, determining the protein concentration in the supernatant. The contributions of different intermolecular forces were calculated by measuring the absorbance at 595 nm with a Spectra Max M5 multi-mode microplate reader (Molecular Devices, San José, CA, USA) as follows: ionic bonds (S2-S1), hydrogen bonds (S3-S2), and hydrophobic interactions (S4-S3).

2.11. Endogenous Fluorescence Spectrum Analysis

The test was determined by using an SP-1920 fluorescence spectrophotometer (PerkinElmer Instruments Co., Ltd., Shanghai, China), and according to the method of Cao et al. [25]. The sample was prepared into a 0.5 mg/mL solution using 0.01 M phosphate buffer. Adjust the excitation wavelength to 280 nm and the emission wavelength to from 200 nm to 450 nm, the scanning speed was 1500 nm/min, and both the emission and excitation slits were 2.5 nm.

2.12. Fourier Transform Infrared Spectrophotometer (FTIR) Analysis

The FTIR scanning experiment was conducted on a PerkinElmer Spectrum Two FT-IR spectrometer (Waltham, MA, USA). The lyophilized POPG was combined with KBr at a mass ratio of 1:50, then crushed and compressed into translucent pellets. The ambient temperature was established at 25 °C, with a resolution of 4 cm−1 and a wave number precision of 0.01 cm−1, and the measurement was conducted within the wave number range of 4000–400 cm−1. The scanning dates were derived using OMNIC 9 (ThermoFisher Scientific, Waltham, MA, USA) software to rectify the baseline, with the sample data normalized to yield the absorbance and transmittance spectra. The FTIR spectra of the protein amide I band in the range of 1700–1600 cm−1 were deconvoluted and peak-separated utilizing PEAKFIT v4.12 (SeaSolve Software, San Jose, CA, USA), employing Gaussian solidification fitting of the nine-point Savitzky–Golay derivative function, alongside the protein secondary structure data derived from second-order derivative analysis and curve fitting.

2.13. Morphological Analysis

2.13.1. Scanning Electron Microscope (SEM)

The POPG was freeze-dried, followed by gold coating for SEM analysis by using a Sigma 300 scanning electron microscope (Carl Zeiss AG, Oberkochen, Germany). Subsequently, the microstructure of the gel was analyzed at an operating voltage set at 3.0 kV and a magnification level of 20,000×.

2.13.2. Confocal Laser Scanning Microscope (CLSM)

The imaging was observed using Carl Zeiss AG (Carl Zeiss AG, Germany). The sample with a thickness of 1 mm was immersed in 2.5% glutaraldehyde solution and then stored at 4 °C for 2 h. Subsequently, a 0.05% fluorescein isothiocyanate solution was used to stain the proteins, and the excitation wavelength was adjusted to 488 nm.

2.14. Statistical Analysis

All the assays were conducted three times, with outcomes represented as the mean ± standard deviation. SPSS 24.0 was used for one-way ANOVA with a significance level of p < 0.05. Data visualization was used for Origin 2024.

3. Results

3.1. Effects of Ultrasonic Treatment on the Gel Strength and WHC of POPG

Gel strength and WHC are key indices of gel quality, reflecting network stability and water-retention ability, respectively. Figure 1a,b illustrate that the gel strength of ultrasonicated POPG samples initially increased followed by a decrease, compared with the control samples. In contrast, WHC showed no significant difference under varying ultrasonic conditions. This can be explained by the ultrasound treatment enhancing the stability and density of the gel network structure by tightening the network through modulated protein-protein interactions [10]. Conversely, excessive ultrasonic treatment (>400 W, >30 min) induced protein over-denaturation and disrupted the network, leading to a substantial deterioration in gel properties. Fu, Y. et al. [26] demonstrate a clear biphasic response in Hypomesus olidus surimi, where gel strength initially increases with ultrasonic power and duration up to an optimum point (200 W, 10 min), beyond which excessive treatment may lead to protein network degradation. Xin, Y. et al. [14] demonstrate that more sulfhydryl groups are exposed on the protein surface, which enhances the formation of disulfide bonds during tofu coagulation, thereby improving gel strength following ultrasound treatment. However, excessive ultrasonic power reduces the disulfide bonds in soy milk, converting them into sulfhydryl groups, which ultimately decreases the disulfide bond content in the tofu.

3.2. Effect of Ultrasonic Treatment on the Rheological Properties of POPG

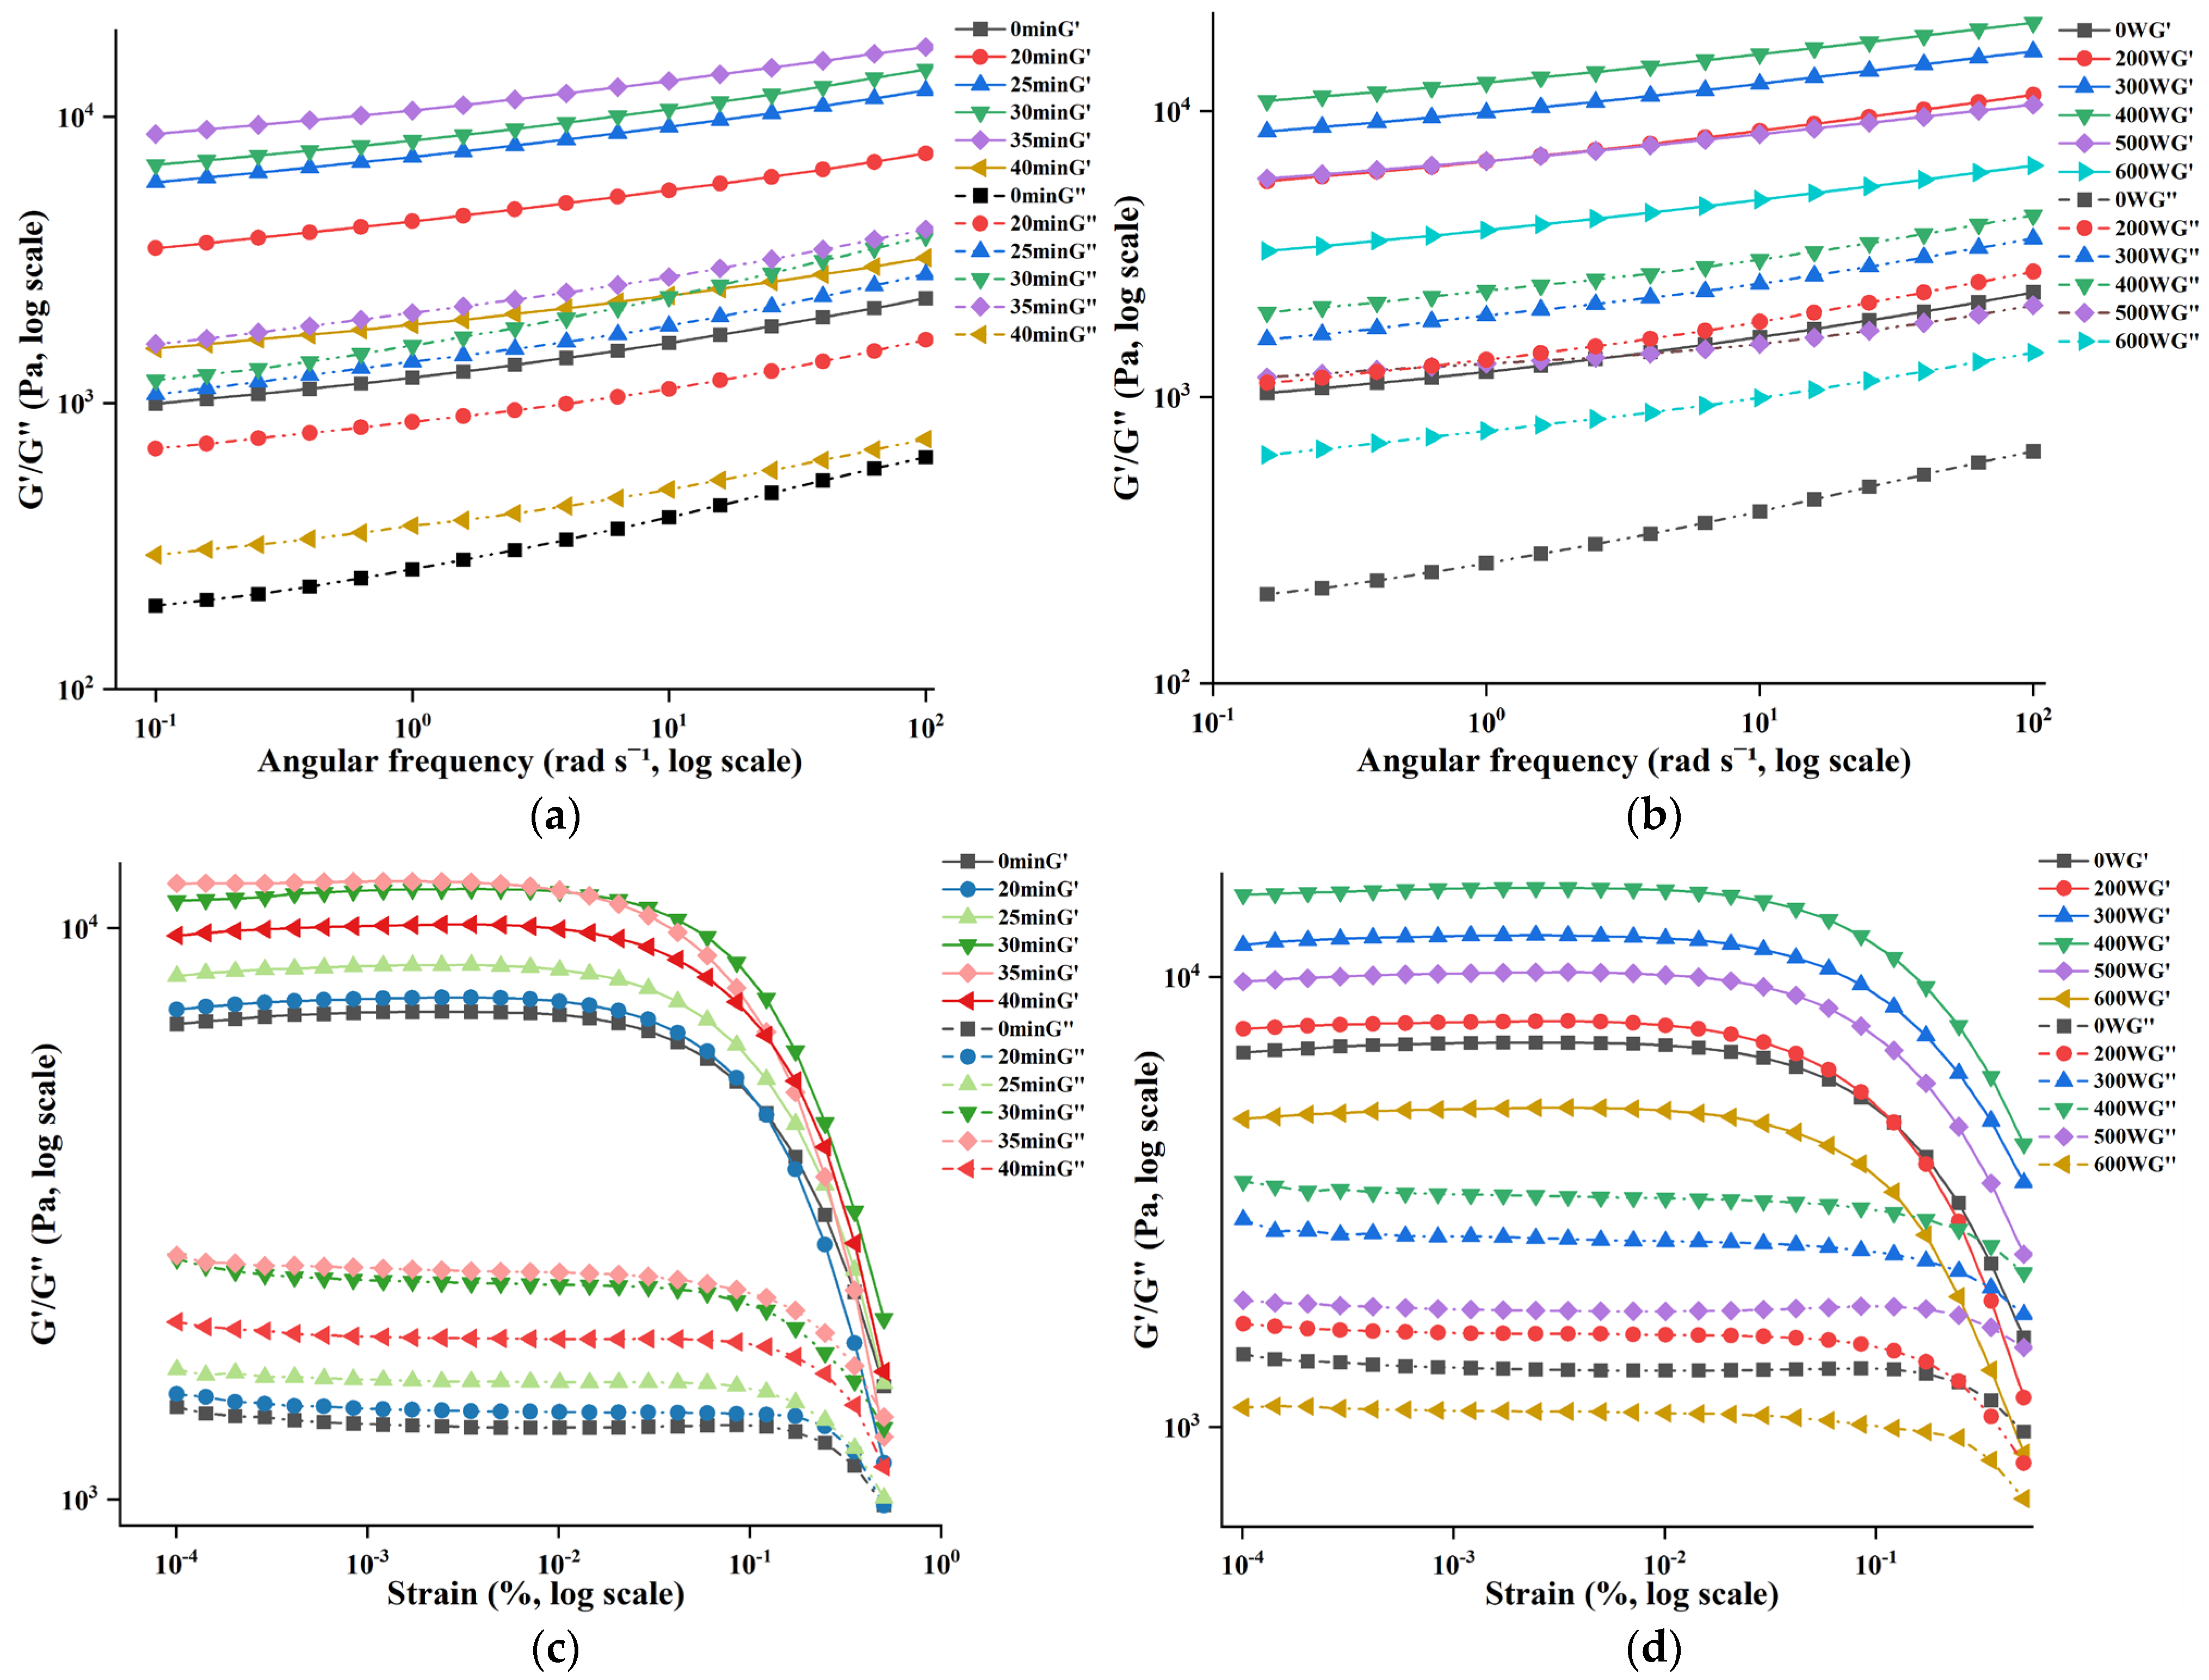
Rheological measurements of G′ and G″ reveal the viscoelastic response and network integrity of the gel, offering quantitative theoretical support for the formulation, process optimization, preparation control, and shelf-life prediction of plant-based meat products, dairy products, and fat-based products in the food industry. As shown in Figure 2a,b, in the frequency range of 0.1–100 rad·s−1, the G′ of each sample always exceeded G″, which indicates pronounced elastic dominance within the linear viscoelastic region [27,28]. Each sample displayed an initial rise in G′ and G″, a reduction with increasing ultrasonic power, which exhibited pronounced frequency dependence, indicating typical viscoelastic behavior consistent with previous reports [29]. Moreover, when compared with the control samples, the G′ and G″ of ultrasonicated POPG samples were significantly elevated under varying ultrasonic conditions. This suggests that ultrasonic treatment can enhance the elastic and viscous characteristics of the gel network [30]. At 400 W ultrasonic power for 30 min, the G′ and G″ values were the highest, which was aligned with the conclusions mentioned above. This is due to the fact that ultrasonic treatment can decrease the gel granularity, increase dissolvability, and expose more active sites, thereby improving the gel strength of POPG [23].
Strain sweep quantifies gel deformation and failure characteristics, providing a theoretical basis for microstructural strength analysis and stability prediction of protein gels. As shown in Figure 2c,d, the strain curve represents the linear viscoelastic (LVE) condition, where, initially, G′ significantly exceeds G″, indicating that POPG possesses viscoelastic features. When the strain is above the LVE limit, the values of G′ and G″ gradually approach each other, attributable to the rupture of the internal bonds within the gel network under elevated strain [31]. Under varying ultrasonic conditions, the G′ of all samples exhibited an initial increase followed by a decrease, while G″ showed no significant change. When the treatment time was 30 min and the power was 400 W, both G′ and G″ in the strain sweep reached their maximum values. This phenomenon can be attributed to ultrasound-induced protein molecular rearrangement, which forms forming a densified cross-linked network, and thereby boosts the viscoelastic strength because of significantly enhancing G′. The ultrasonic treated POPG exhibited a more gradual modulus decline curve due to improved structural homogeneity [32]. Mozafarpour, R. et al. [33] reported that the emulsion gels treated with 300 W ultrasonic power were more resistant to fracture than the untreated.

3.3. Effect of Ultrasonic Treatment on Thermal Properties of POPG

DSC was conducted to evaluate the impact of ultrasonic processing on the thermal characteristics of POPG, including To, Tp, Tc, and ΔH. Tp represents the peak temperature of protein denaturation, while ΔH represents the energy necessary for the denaturation process and can also evaluate the extent of protein unfolding [34]. As shown in Table 1, the protein denaturation peak temperature of ultrasonicated POPG samples was marked higher than that of the untreated with increasing ultrasonic power and treatment time, indicating that ultrasonic treatment increased the denaturation temperature of POPG. At an ultrasonic power of 400 W for 30 min, the Tp values reached their peaks at 106.21 °C and 110.99 °C, respectively. Correspondingly, ΔH increased from 1695.75 J/g to 1822.35 J/g and 1842.35 J/g. The ultrasonic treatment broke the intermolecular bonds of POPG due to cavitation and turbulence forces, exposing hidden hydrophobic groups on the surface. This increases hydrophobic interactions and forms a more stable structure, leading to an increase in ΔH [35,36]. Zhang et al. [37] reported that compared to the untreated samples, the peak temperature of protein denaturation increased from 128.2 °C to 131.9 °C after the soybean protein isolate and pectin emulsion gels were treated with ultrasound at 450 W.
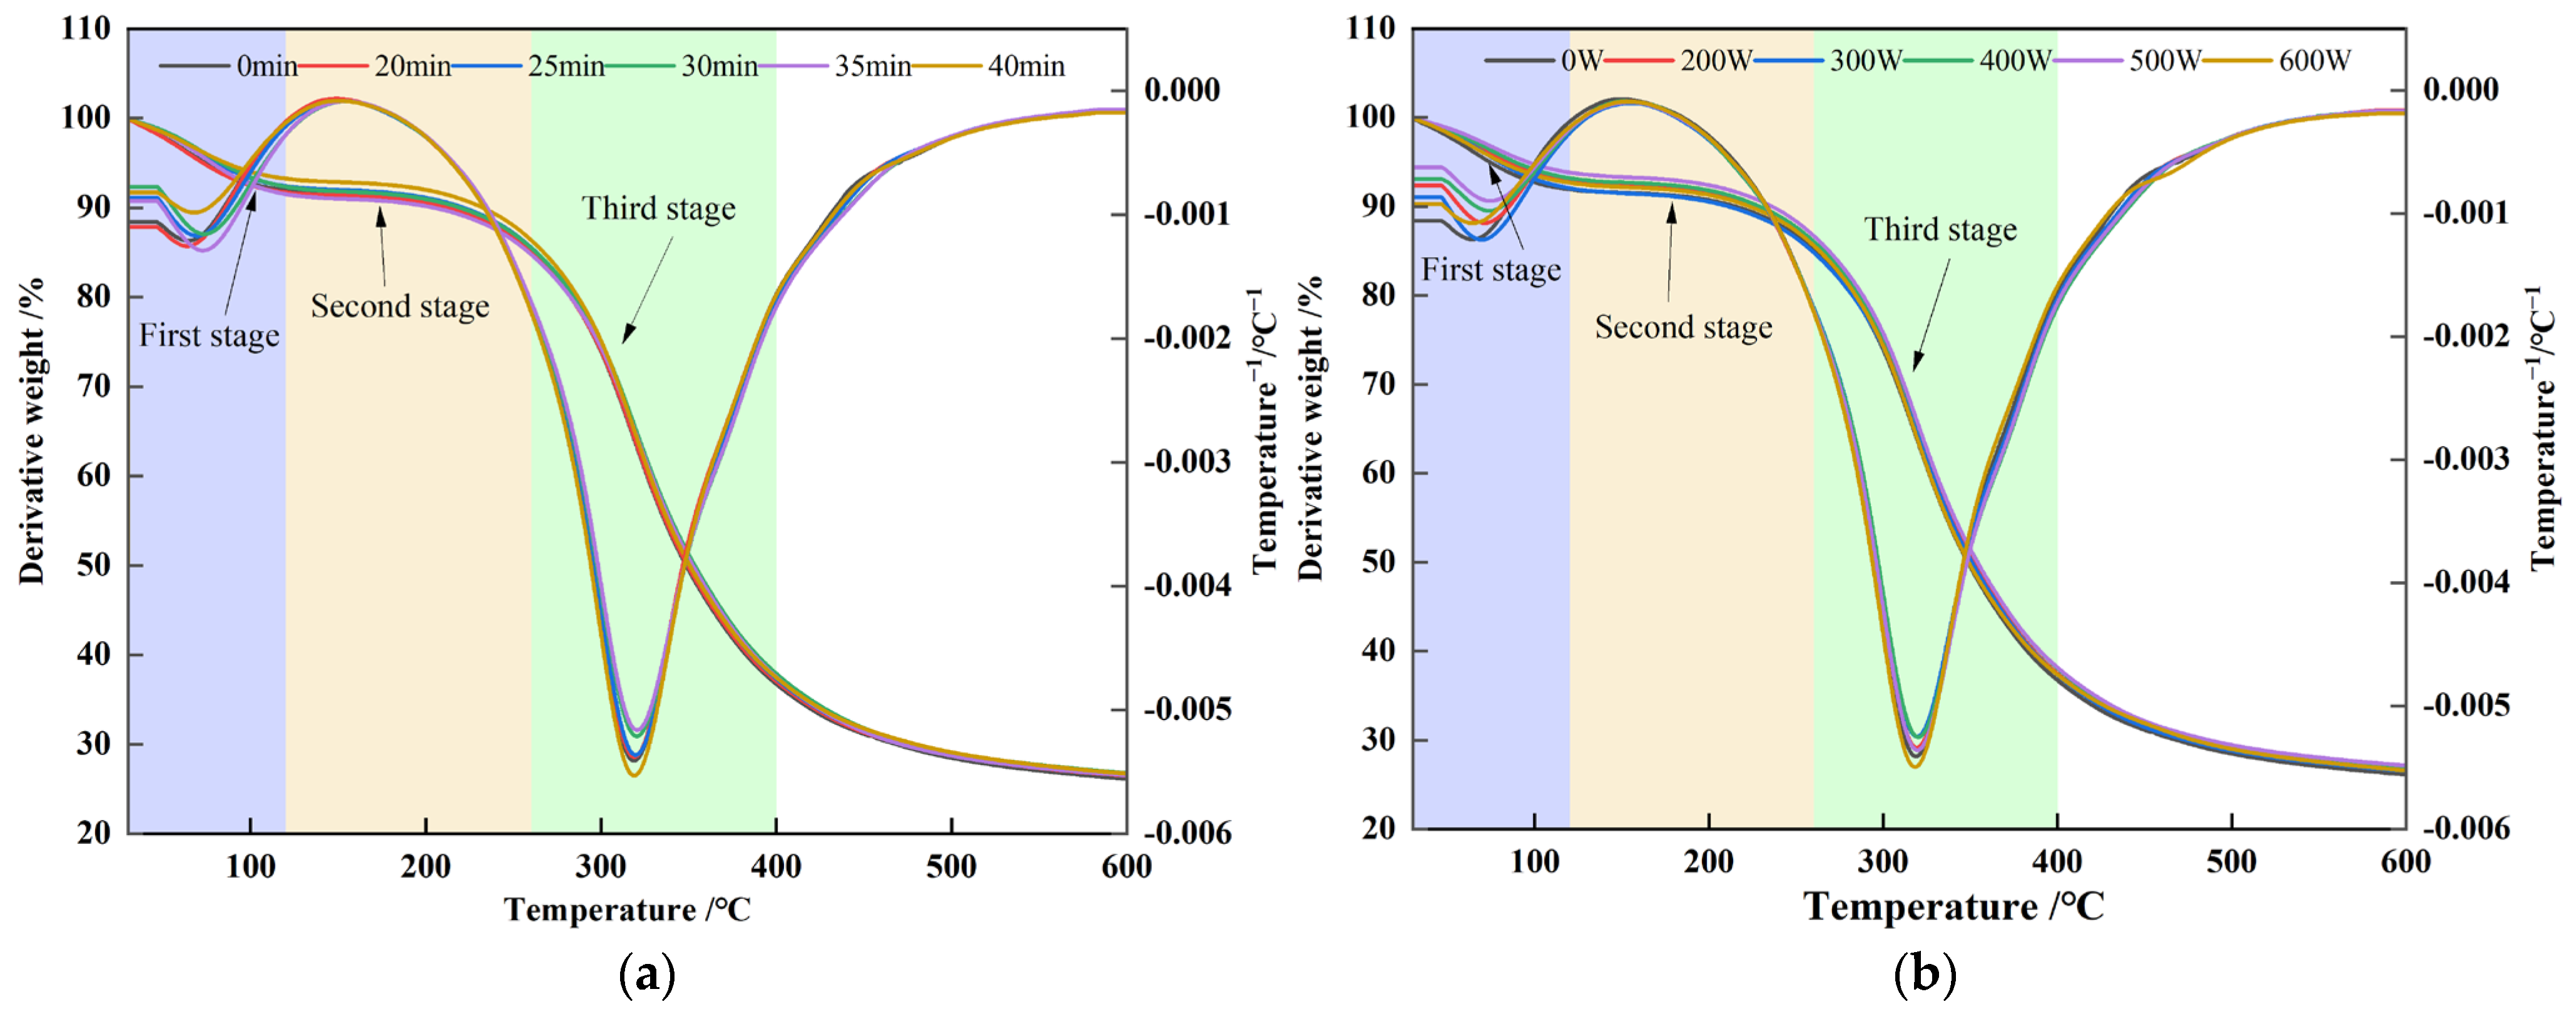
Thermal stability is a crucial determinant influencing the quality and shelf life of gel-type foods. Thermogravimetric analysis (TGA) of POPG was conducted within a temperature range from 40 °C to 700 °C with a heating rate of 10 °C min−1 to monitor the changes in mass during programmed heating. Figure 3a,b illustrate the weight loss curves of all samples, which indicated consistent trends through three distinct stages. In the first stage, from a temperature range of 40 °C to 120 °C, a minor weight loss occurs due to moisture evaporation [38]. In the second stage, which occurs between 120 and 260 °C, the secondary and tertiary structures of proteins are disrupted, during which weaker hydrogen bonds and some peptide bonds are cleaved, leading to more significant weight loss and the onset of structural disintegration [39]. The third stage, approximately from 260 to 400 °C, involves the breakdown of the protein backbone by cleaving stronger covalent bonds, releasing gases such as CO, CO2, NH3, and H2S [40], which results in a marked decrease in weight. Moreover, ultrasonicated POPG samples lost more mass than the untreated POPG under varying ultrasonic conditions. This decrease in weight is attributable to cavitation influence, whereby ultrasound disrupts long protein chains into smaller fragments. These oxidative decomposition and carbonization reactions lead to scission of the polymer backbone, thereby altering the mass of the solid residue [35]. Our findings are consistent with those of Malik et al. [41], where ultrasonication accelerates the thermal degradation of sunflower seed protein.

3.4. Effect of Ultrasonic Treatment on the Free Sulfhydryl Groups and Disulfide Bonds of POPG

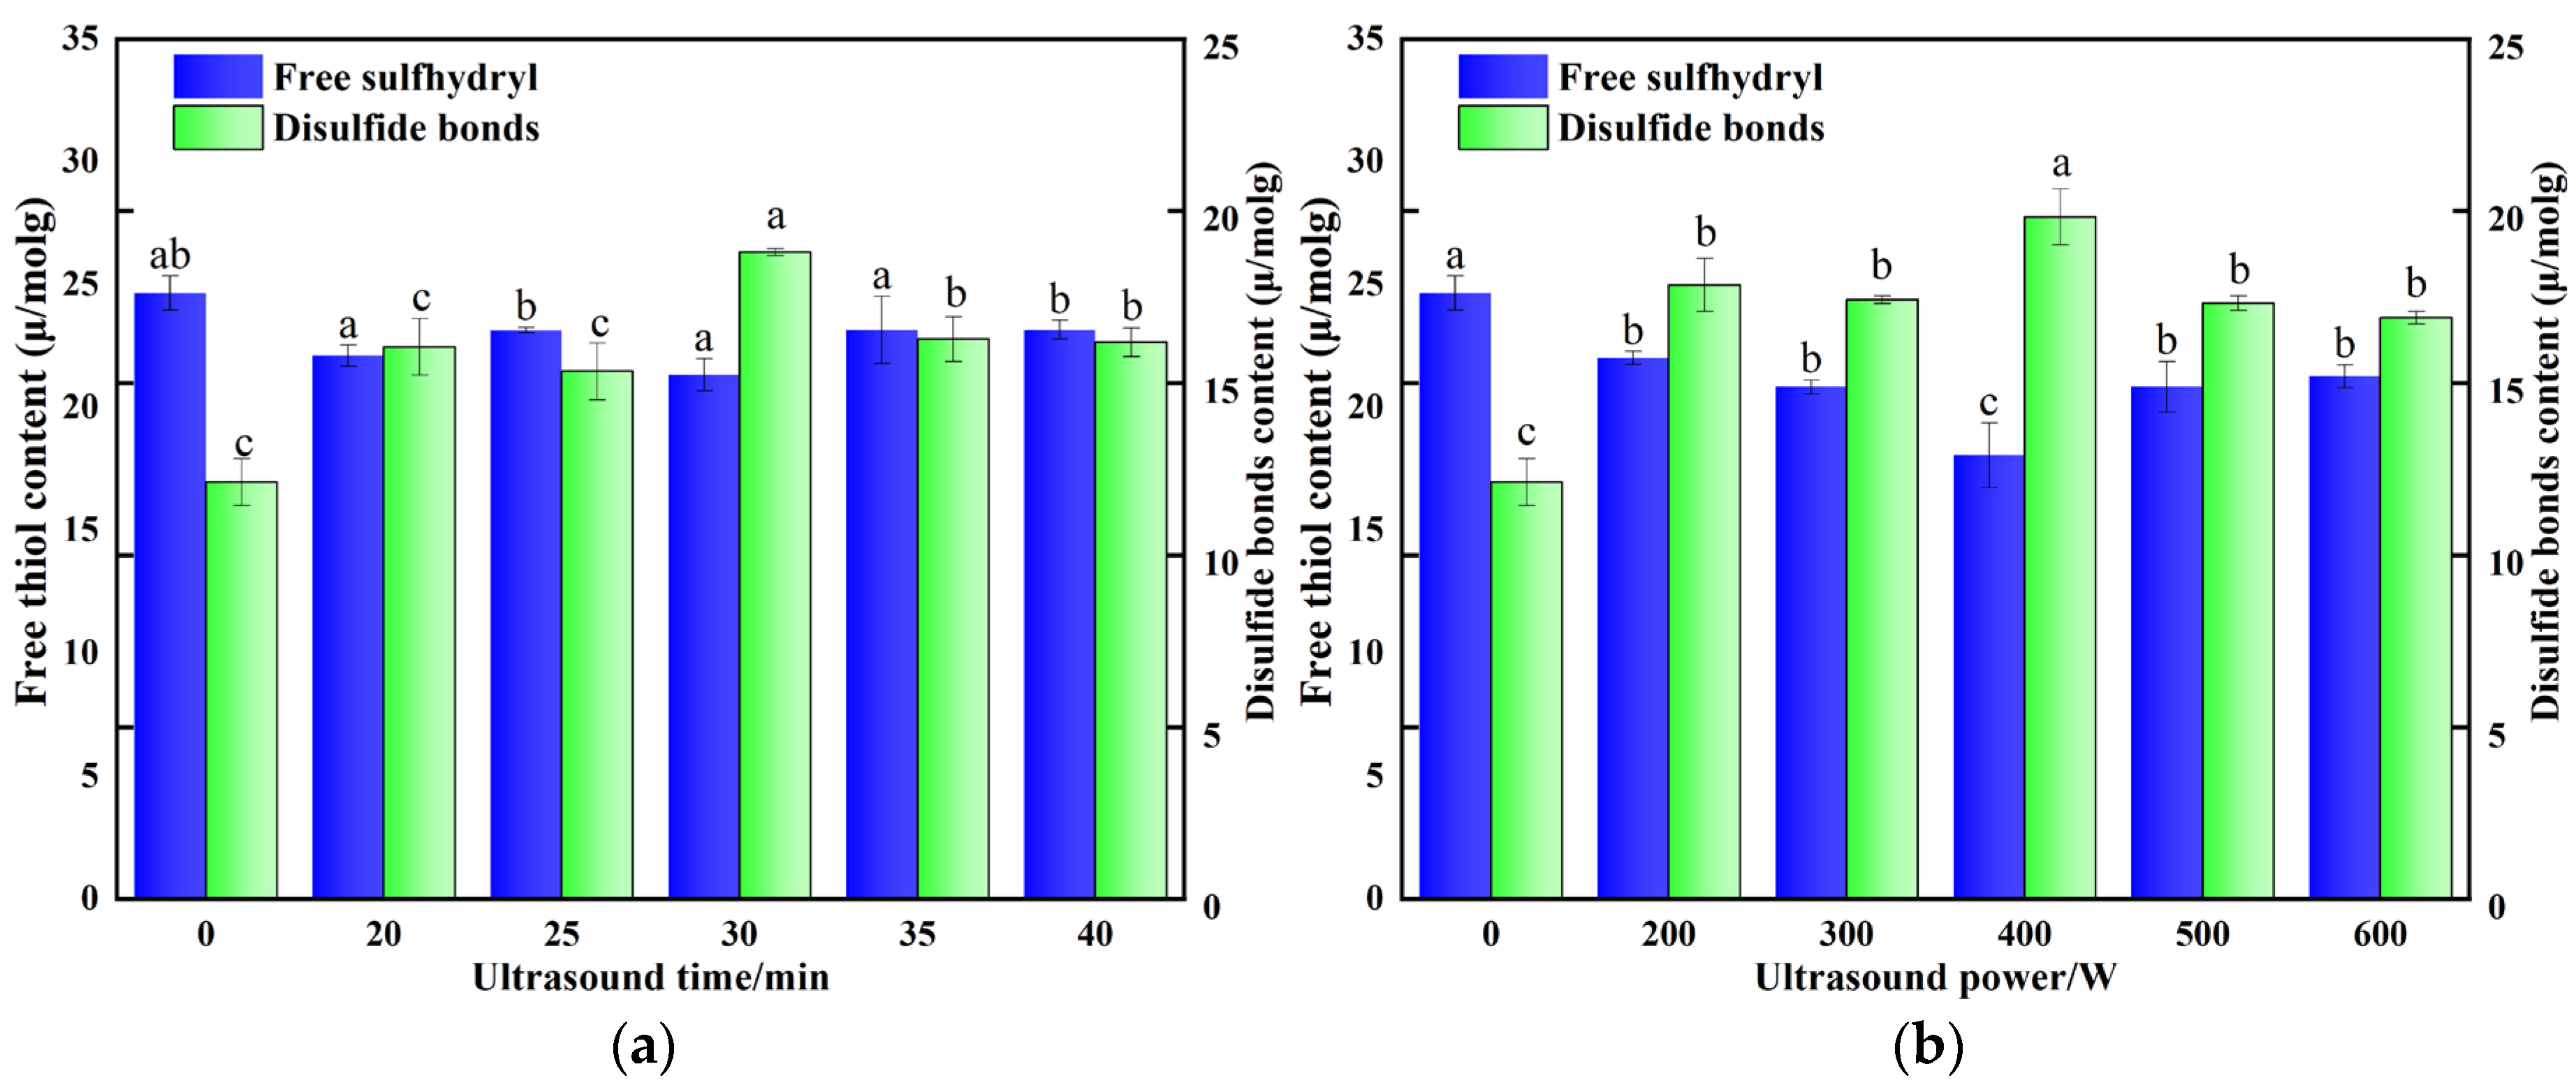
Free sulfhydryl groups can react with other sulfhydryl groups or disulfide bonds to form new disulfide bonds, facilitating the linkage of protein molecules and thus enhancing the network structure and gel strength. Figure 4a,b illustrates that the levels of free sulfhydryl groups and disulfide bonds of POPG after ultrasonic treatment were significantly different from those of the control samples. The free sulfhydryl content was the lowest, decreasing from 24.67 μmol/g to 18.07 μmol/g, while the disulfide bond content was the highest, increasing from 12.12 μmol/g to 19.83 μmol/g, which was at 400 W ultrasonic for 30 min. This phenomenon is related to the fact that the cavitation effect and mechanical shear force induced through ultrasonic treatment expose the concealed free sulfhydryl groups and disulfide bonds in POPG, which are then oxidized to form disulfide bonds, thereby improving the gel strength [42,43]. The alterations in free sulfhydryl and disulfide bonds can effectively validate the changes in gel strength induced by ultrasound. Our findings are consistent with Xin et al. [44], who reported that ultrasound treatment altered the amount of free sulfhydryl groups and disulfide bonds of gels formed by salted egg white and cooked soy protein isolate. However, excessive ultrasonic treatment can break some of the disulfide bonds that have already formed, leading to a loose structure and weakening its network structure [45].

3.5. Effect of Ultrasonic Treatment on the Surface Hydrophobicity of POPG

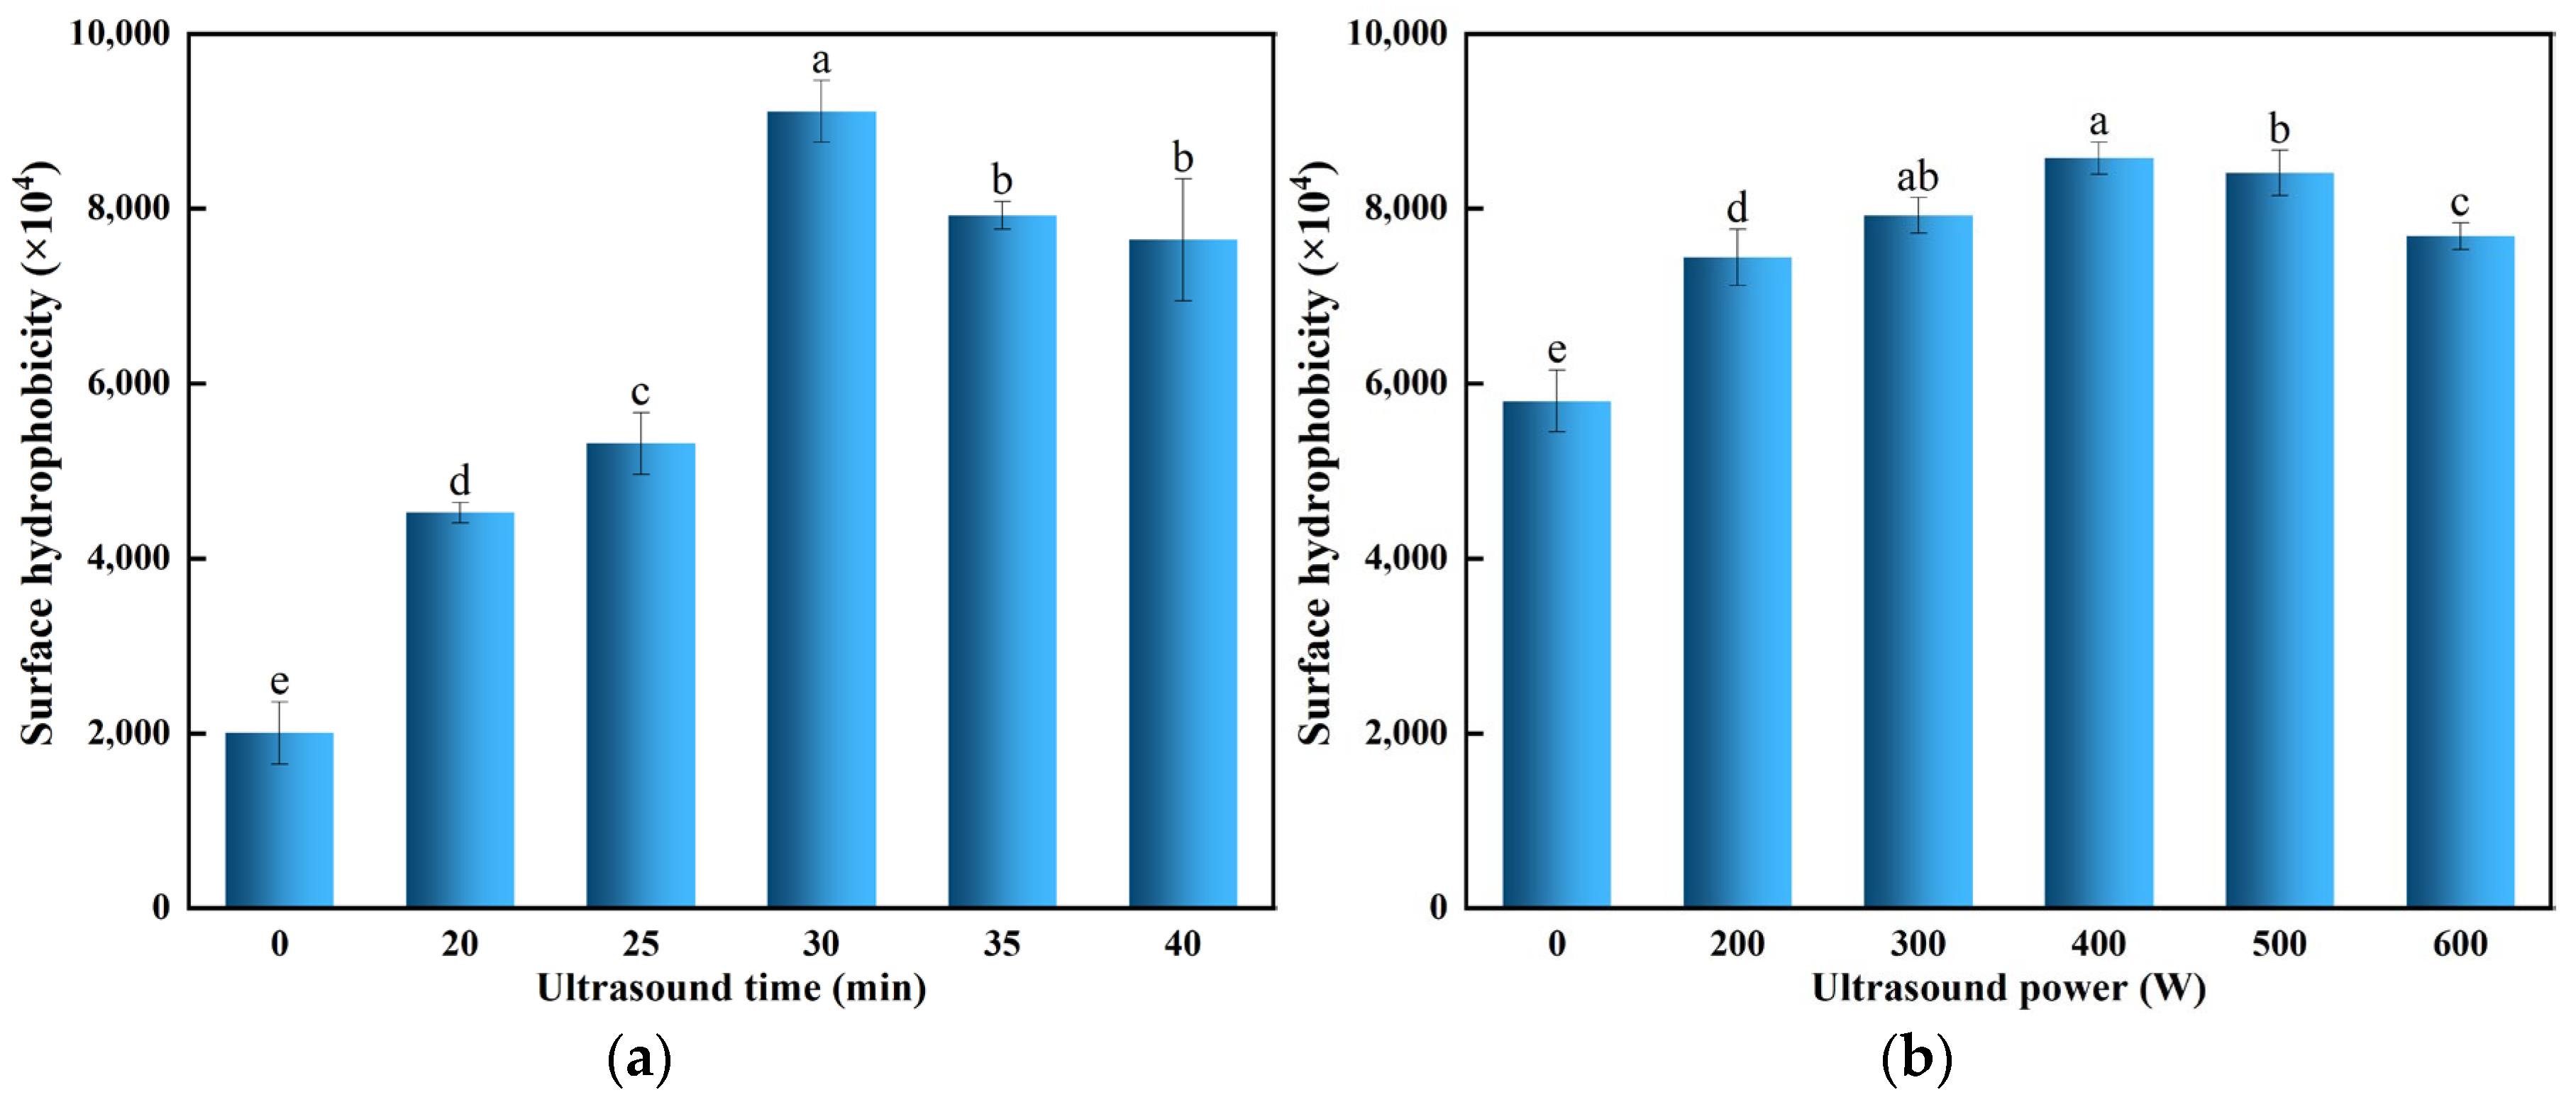
Surface hydrophobicity is essential for maintaining the conformation and functional characteristics of proteins [12]. Figure 5a,b illustrate that, relative to the untreated POPG, the surface hydrophobicity of ultrasonicated POPG initially increases, followed by a decrease under varying ultrasonic conditions. This was due to the cavitation effect and shear forces produced by ultrasonic treatment that break the non-covalent bonds of POPG and facilitate the partial unfolding of proteins, while consequently leading to the hydrophobic groups buried inside polypeptide chains being exposed [46]. However, excessive ultrasonic treatment can cause the re-aggregation of POPG molecules and the hydrophobic groups to be reburied, thereby decreasing the surface hydrophobicity. Our findings are consistent with Chandrapala et al. [47], who reported that excessive ultrasound induces re-aggregation of whey proteins, reducing surface hydrophobicity.

3.6. Effect of Ultrasonic Treatment on the Intermolecular Forces of POPG

Intermolecular forces, specifically ionic bonds, hydrogen bonds, and hydrophobic interactions, are essential for gel formation [48]. As shown in Table 2, the ionic bonds and hydrogen bonds exhibited poor solubility stability, suggesting their secondary role in stabilizing the structural conformation of POPG. In contrast, the solubility stability of hydrophobic interactions greatly exceeds that of ionic and hydrogen bonds, which are the primary forces for the formation of POPG. The hydrophobic interactions of ultrasonicated POPG samples exhibited a preliminary increase succeeded by a reduction under varying ultrasonic conditions compared to the untreated, which are consistent with the change of the surface hydrophobicity. When the treatment time was 30 min, the hydrophobic interactions increased from 0.765 to 0.965, and when the power was 400 W, it reached 1.240. This can be attributed to the fact that moderate ultrasonic treatment can enhance hydrophobic interactions [49]. However, excessive ultrasonic treatment disrupts the molecular structure among POPG molecules and reduces the content of free thiol, consequently leading to a decline in hydrophobic interactions [50].

3.7. Effects of Ultrasonic Treatment on the Fluorescence Intensity of POPG

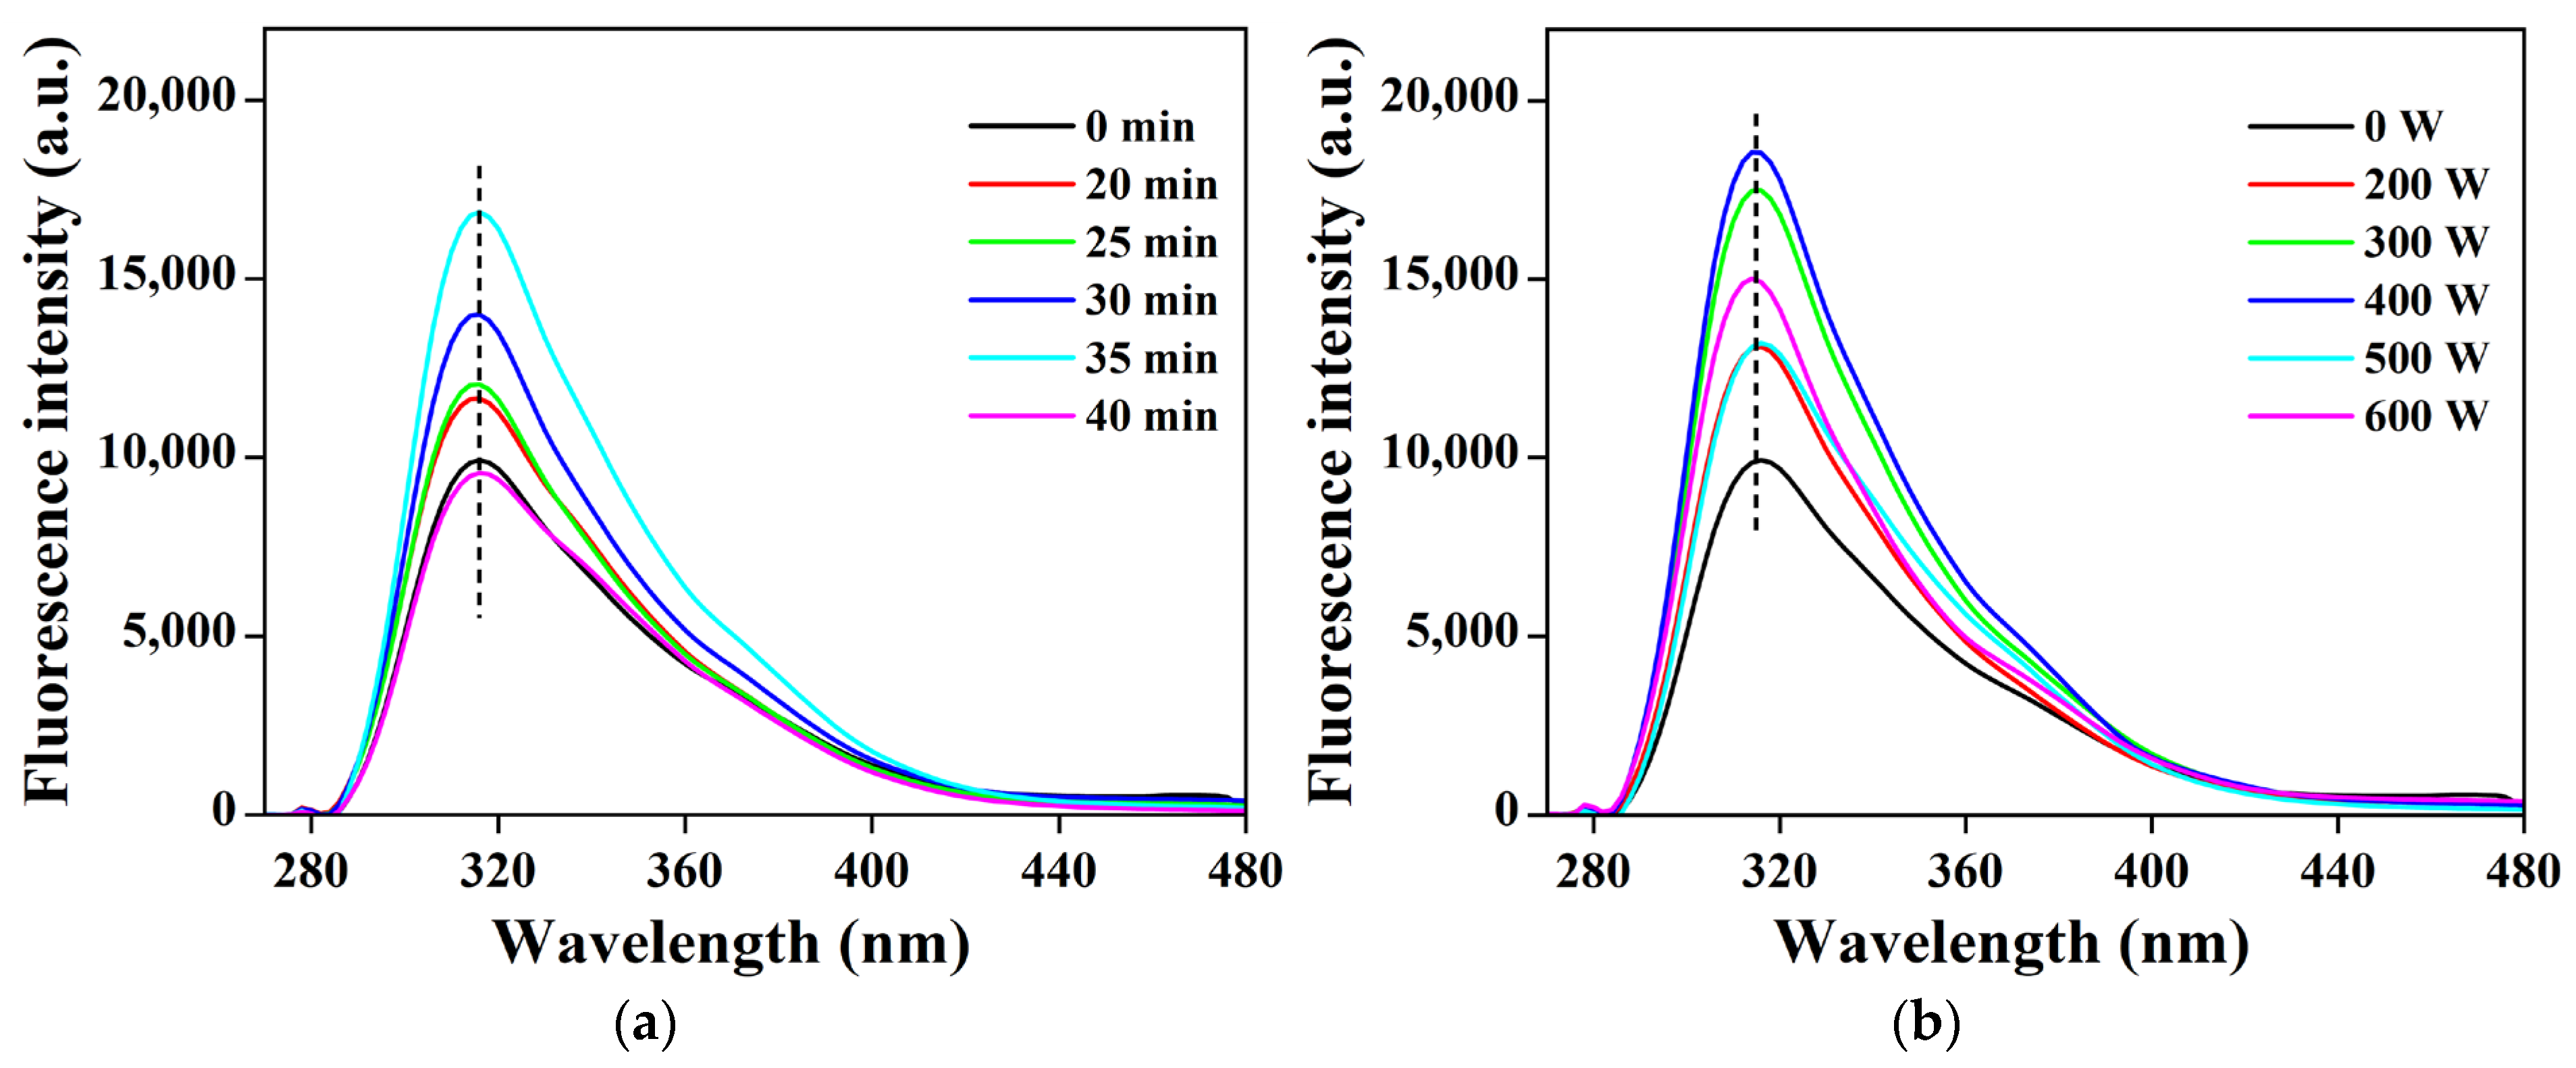
Protein thermal unfolding can be quantified by the fluorescence intensity of residual sites. Tryptophan moieties are excited at 280 nanometers, so the fluctuations in their fluorescence intensity can reveal alterations in the tertiary structure of the protein [51]. As shown in Figure 6a,b, the fluorescence spectrum of ultrasonicated POPG aligned with those of untreated and exhibited no red or blue shifts. However, the intensity initially increased, followed by a decrease with increasing ultrasonic power and time. The highest fluorescence intensity of POPG was observed with ultrasonic 400 W for 35 min. This is due to moderate ultrasonic treatment facilitating the rearrangement of non-covalent bonds in protein molecules, exposing buried tryptophan chromophores and increasing fluorescence intensity [52]. However, excessive ultrasonic treatment causes protein molecules to aggregate and form particles, resulting in a significant decrease in the fluorescence signal [53].

3.8. Fourier Transform Infrared Spectra (FTIR) Analysis of POPG

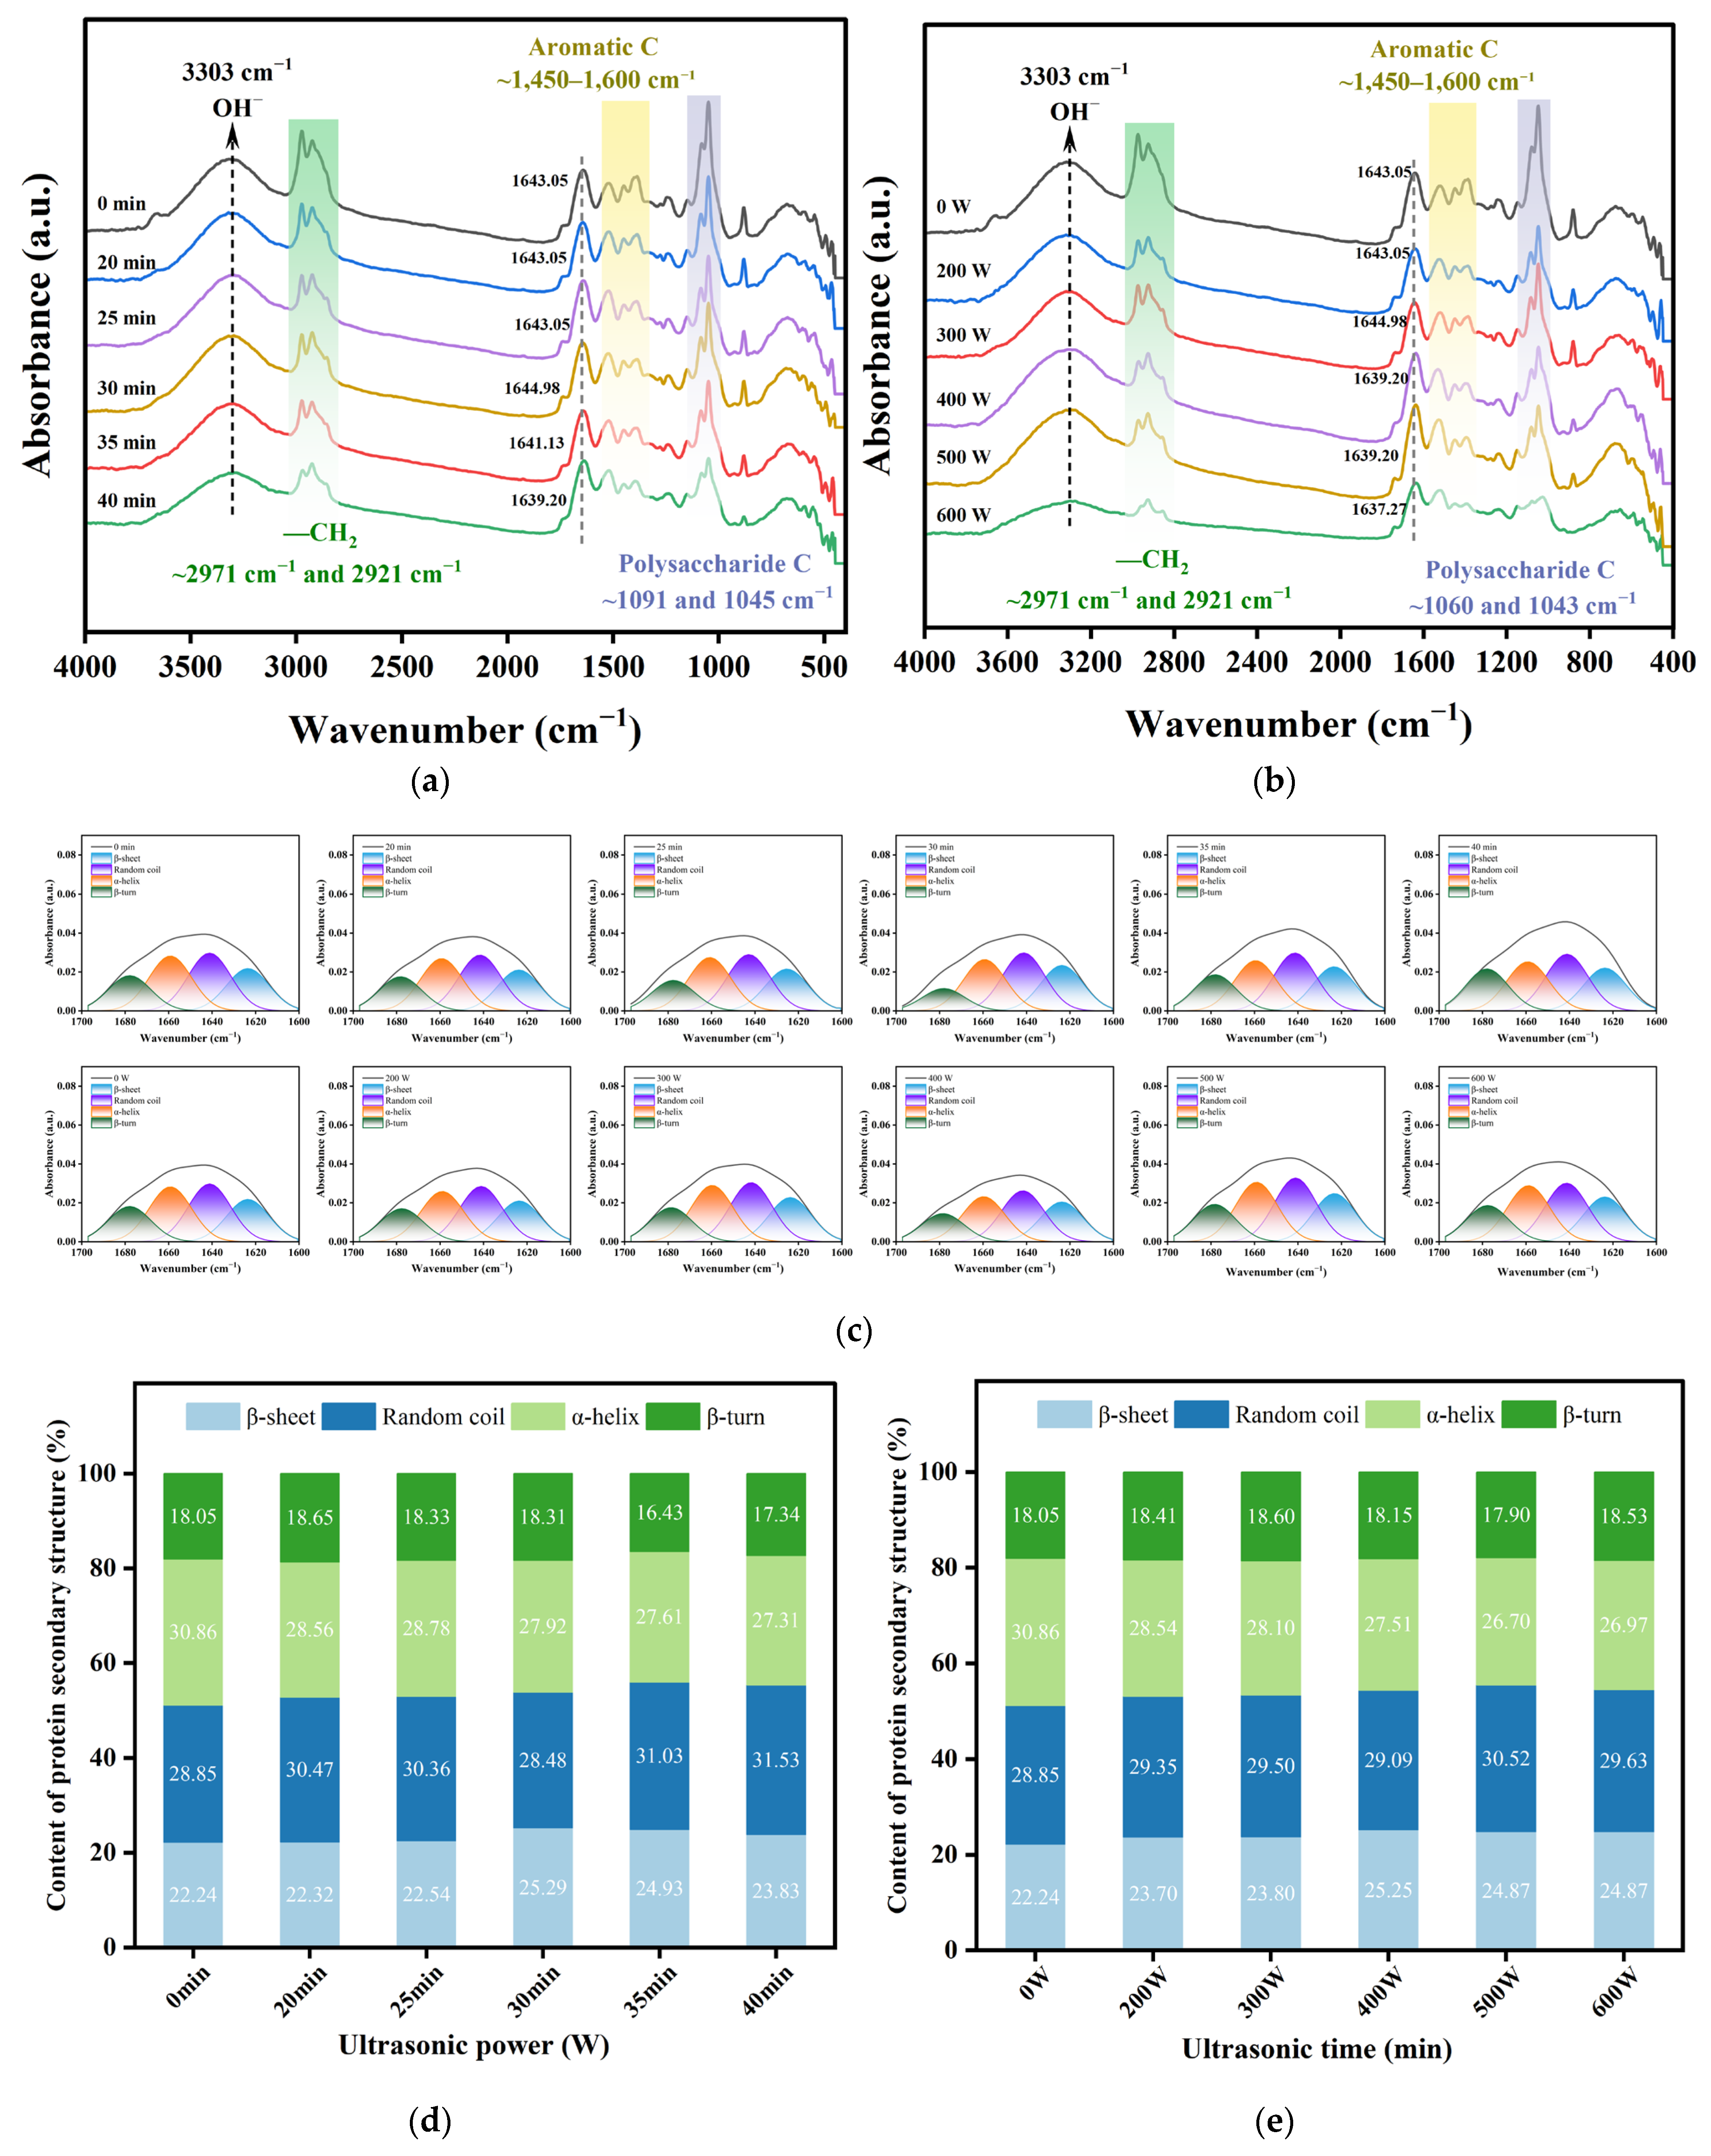
The alterations in the main conformation and secondary structure of the protein were assessed using infrared spectral analysis of POPG. As shown in Figure 7a,b, the broad peak at 3303 cm−1 is associated with the stretching vibration of O-H and N-H [54], while the typical characteristic peak of -CH2 is 2971 cm−1 and 2921 cm−1. The bending vibration of N-H and C=O generates the broad peak at 1600 cm−1 and 1450 cm−1 [55]. The inclusion of chitosan during the POPG preparation procedure is the cause of the more noticeable polysaccharide C at 1091 cm−1 and 1045 cm−1.
The spectrum reflecting the protein’s secondary structure was dispersed between 1600 cm−1 and 1700 cm−1 (amide I band). Figure 7a,b reveal that the amide I band of the ultrasonically treated sample exhibited varying degrees of subtle red shift, suggesting a potential alteration in the protein’s secondary structure. Gursel et al. [56] conducted analogous treatment on bovine serum albumin and observed a shift in the peak position of the amide-I region following ultrasonic treatment. Figure 7c displays the spectrum of materials subjected to various ultrasonic treatments within the amide I band (1600 cm−1–1700 cm−1). Figure 7d,e illustrate that under ultrasonic conditions of 400 W, the α-helix content diminishes greatly from 30.85% (untreated) to 27.51%. The α-helix mostly consists of intramolecular hydrogen bonds, which minimally contribute to the three-dimensional network, while ultrasonic wave cavitation results in the disruption of hydrogen bonds [57]. Conversely, the β-sheet content peaked, and the ultrasonic wave facilitated the conversion of α-helix to β-sheet structure, likely due to the ultrasonic wave augmenting protein interactions and altering protein structure [58]. Comparable phenomena were also noted when the ultrasonic treatment duration was 35 min. The augmentation of β-sheet content is pivotal for gel aggregation and network development, and the discovery of the microstructure confirms this.

3.9. Effect of Ultrasonic Treatment on the Microstructure of POPG

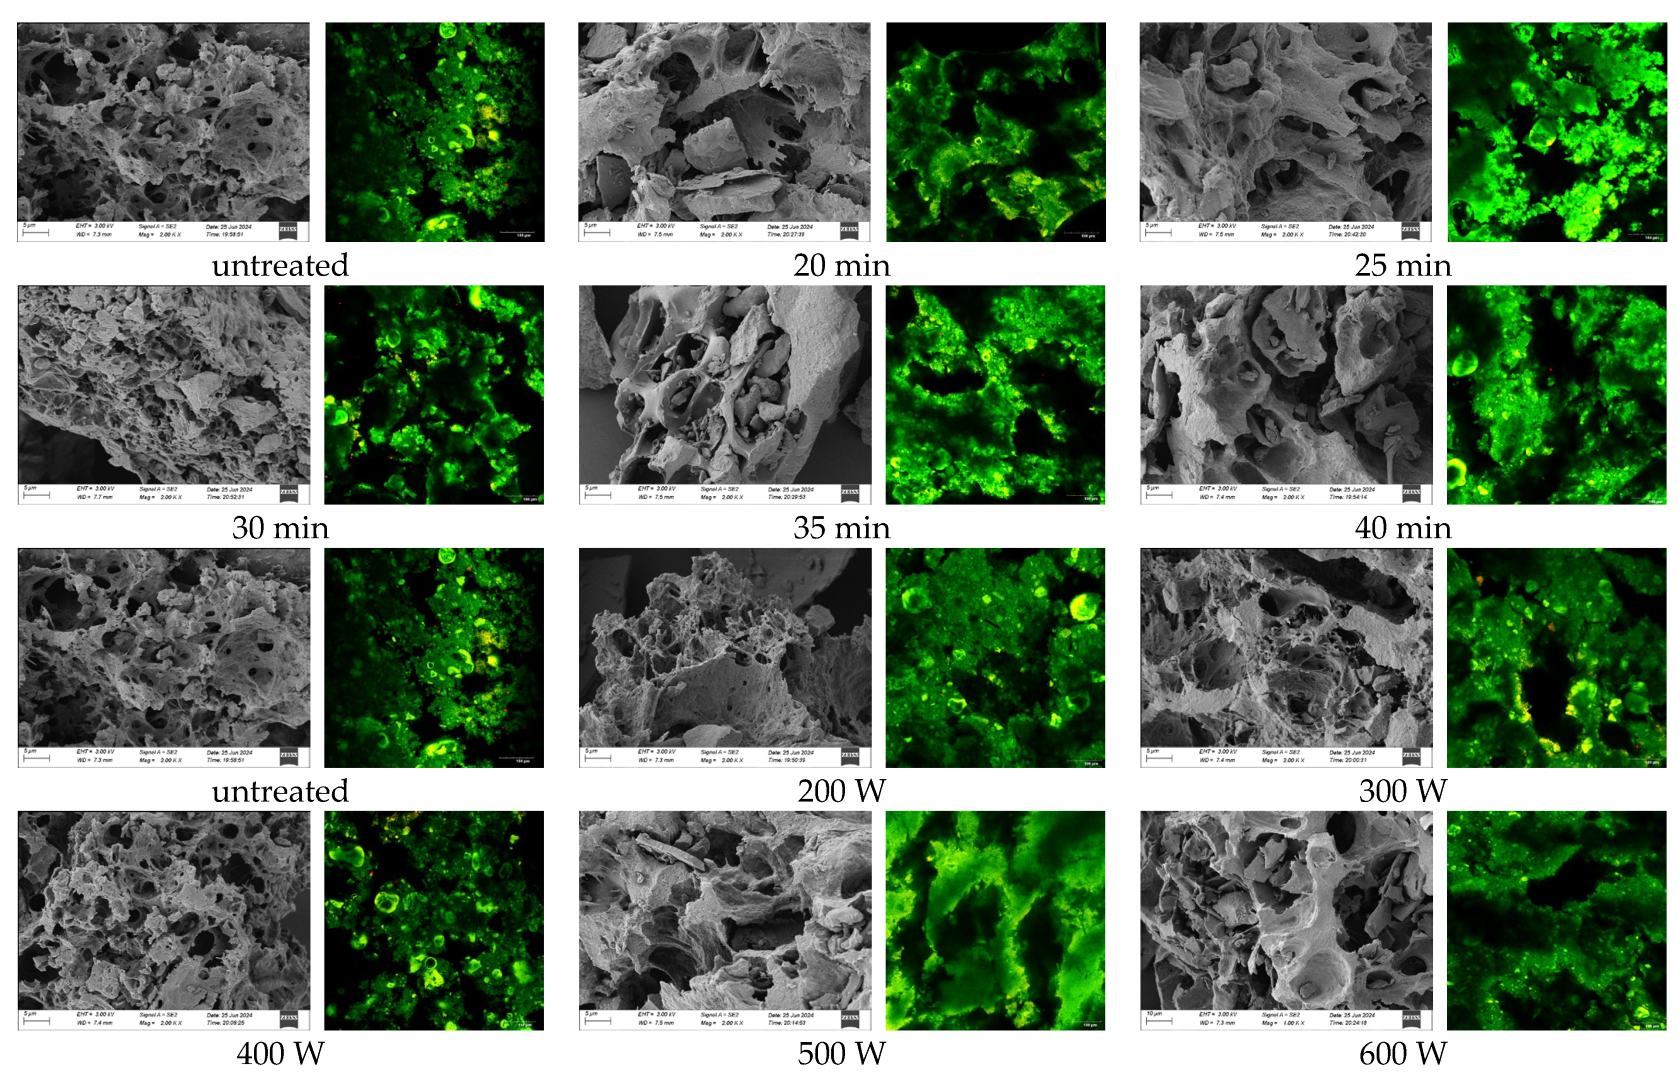
As shown in Figure 8, each pair of panels comprises an SEM image (left) and a CLSM image (right), the SEM image of ultrasonicated POPG samples, compared with the untreated samples, exhibited a more homogeneous and tight microstructure under varying ultrasonic conditions. Ultrasonic treatment causes smaller protein aggregates through mechanical forces, increasing the specific surface area [59]. The gel network structure is denser and more uniform with ultrasonic at 400 W for 30 min, exhibiting a reduced porosity microstructure. This improvement resulted in the exposure of functional groups in POPG, which promoted the formation of soluble protein polymers that filled network structure pores and improved gel network density [49,60]. However, excessive treatment may result in an enlarged size and uneven distribution of the gel structure due to excessive protein aggregation or denaturation [53], which covered active groups and reduced the surface area of POPG.
According to the analysis of the CLSM image (the right one in each pair of images in Figure 8), the green region represents the protein area, whereas the black region denotes the pores created between the protein structures following ultrasonic therapy. We observe that an increase in ultrasonic duration and strength results in smaller, more uniform, and denser holes within the protein structures. The image indicates that the sample treated for 30 min at 400 W exhibited optimal performance; however, with prolonged treatment time and increased power, larger black holes emerged, likely resulting from excessive ultrasound leading to protein molecule aggregation and disruption of the network structure [61]. A comparable phenomenon was likewise detected in the scanning electron microscope images.
The SEM and CLSM images indicate that with an ultrasonic power of 400 W and a treatment duration of 30 min, a dense and compact three-dimensional network structure was detected. This microscopic characteristic aligned with the assessment of gel strength, viscoelasticity, and thermal stability conducted before, and further corroborated the trend of intermolecular forces and protein secondary structure alterations under these conditions. Furthermore, the densely cross-linked protein framework depicted in the figure shows a substantial reduction in free sulfhydryl groups, a boost in disulphide bond content, and a slight increase in surface hydrophobicity. Nearly all of them support our hypothesis that “ultrasound can enhance the properties of POPG”. These outcome findings are consistent with Zhao et al., who reported that ultrasonic treatment leads to a denser and more uniform microstructure of soy protein gel [62].

4. Conclusions

This research investigated the effects of ultrasonic treatment on the characteristics of POPG by adjusting ultrasonic power (200–600 W, 30 min) and ultrasonic time (20–40 min, 400 W). Results showed that, with increasing ultrasonic time and power, the gel strength, WHC, free sulfhydryl content, surface hydrophobicity, and endogenous fluorescence intensity of POPG all exhibited a first increasing and then decreasing trend. When the ultrasonic parameters were set to 400 W and 30 min, all the aforementioned performance indicators of POPG reached their maximum values and were markedly superior to the control samples. Rheological analysis indicated that POPG displayed the highest storage modulus and better viscoelasticity. The thermal stability was significantly improved as confirmed by DSC and TGA. Analysis of intermolecular forces revealed that ultrasonic treatment facilitated the ordered aggregation of protein molecules by enhancing the hydrophobic interactions in POPG. The infrared spectrum indicates that ultrasonic therapy can marginally red-shift the peak of the protein amide I band, revealing the protein’s secondary structure. The augmentation of β-sheet is a significant factor contributing to the improvement of gel structure. This was further validated by observations using SEM and CLSM, which revealed a homogeneous and dense microstructure in POPG. This study indicated that the ultrasonicated POPG, considered a potential ingredient, improves functionality for many food applications in the food sector, contributing to the development of sustainable and nutritious plant-based products.

Author Contributions

Conceptualization, S.W. and J.D.; methodology, S.W.; software, G.D.; validation, M.L.; formal analysis, R.S.; data curation, R.S.; writing—original draft preparation, S.W.; writing—review and editing, G.D.; supervision, J.D.; funding acquisition, Y.L. All authors have read and agreed to the published version of the manuscript.

Funding

This research was supported by the National Oat Buckwheat Industry Technology System Project (Grant No. CARS-07-E2) of the Ministry of Agriculture and Rural Affairs of China, and the Natural Science Foundation of Henan Province (Grant No. 252300420220) of the Henan Provincial Department of Science and Technology.

Institutional Review Board Statement

Not applicable.

Informed Consent Statement

Not applicable.

Data Availability Statement

The original contributions presented in the study are included in the article. Further inquiries can be directed to the corresponding authors.

Conflicts of Interest

The authors declare no conflicts of interest.

Abbreviations

The following abbreviations are used in this manuscript:
POPGPea–oat Protein Gel
TGTransglutaminase
DSC Differential Scanning Calorimetry
TGAThermogravimetric Analysis
FTIRFourier Transform Infrared Spectra
SEMScanning Electron Microscope
CLSMConfocal Laser Scanning Microscope

References

  1. Poore, J.; Nemecek, T. Reducing Food’s Environmental Impacts through Producers and Consumers. Science 2018, 360, 987–992. [Google Scholar] [CrossRef]
  2. Sá, A.G.A.; Moreno, Y.M.F.; Carciofi, B.A.M. Plant Proteins as High-Quality Nutritional Source for Human Diet. Trends Food Sci. Technol. 2020, 97, 170–184. [Google Scholar] [CrossRef]
  3. Lu, Z.X.; He, J.F.; Zhang, Y.C.; Bing, D.J. Composition, Physicochemical Properties of Pea Protein and Its Application in Functional Foods. Crit. Rev. Food Sci. Nutr. 2020, 60, 2593–2605. [Google Scholar] [CrossRef] [PubMed]
  4. D’Alessio, G.; Flamminii, F.; Faieta, M.; Prete, R.; Di Michele, A.; Pittia, P.; Di Mattia, C.D. High Pressure Homogenization to Boost the Technological Functionality of Native Pea Proteins. Curr. Res. Food Sci. 2023, 6, 100499. [Google Scholar] [CrossRef] [PubMed]
  5. Xu, K.; Kuang, J. Unraveling the Mechanisms of Pea Protein Isolate in Modulating Retrogradation Behavior of Pea Starch. Food Hydrocoll. 2024, 156, 110354. [Google Scholar] [CrossRef]
  6. Mäkinen, O.; Sözer, N.; Ercili-Cura, D.; Poutanen, K. Protein from Oat: Structure, Processes, Functionality, and Nutrition. In Oats Nutrition and Technology; Wiley Blackwell: Chichester, UK, 2016; pp. 255–288. [Google Scholar]
  7. Laitinen, M.; Kokkonen, T.; Huang, X.; Jouppila, K.; Maina, N.H.; Mäkelä-Salmi, N. Gelation Potential of Oat Protein Isolate: Influence of Extraction Method, Gelling Conditions, and Enzymatic Modification. Food Chem. 2025, 481, 143968. [Google Scholar] [CrossRef]
  8. Firoozmand, H.; Rousseau, D. Microstructure and Rheology Design in Protein–Protein–Polysaccharide Composites. Food Hydrocoll. 2015, 50, 84–93. [Google Scholar] [CrossRef]
  9. Ngarize, S.; Adams, A.; Howell, N.K. Studies on Egg Albumen and Whey Protein Interactions by FT-Raman Spectroscopy and Rheology. Food Hydrocoll. 2004, 18, 49–59. [Google Scholar] [CrossRef]
  10. Li, M.; Yang, R.; Feng, X.; Fan, X.; Liu, Y.; Xu, X.; Zhou, G.; Zhu, B.; Ullah, N.; Chen, L. Effects of Low-Frequency and High-Intensity Ultrasonic Treatment Combined with Curdlan Gels on the Thermal Gelling Properties and Structural Properties of Soy Protein Isolate. Food Hydrocoll. 2022, 127, 107506. [Google Scholar] [CrossRef]
  11. Yang, R.; Wang, C.; Wu, Z.; Yu, B.; Yu, X.; Li, C.; Cao, Y.; Yuan, C.; Zhang, Z.; Zhao, H.; et al. Structural and Gelation Properties of Soy Protein Isolates–Sesbania Gum Gels: Effects of Ultrasonic Pretreatment and CaSO4 Concentration. Int. J. Biol. Macromol. 2025, 310, 143215. [Google Scholar] [CrossRef]
  12. Shen, X.; Zhao, C.; Guo, M. Effects of High Intensity Ultrasound on Acid-Induced Gelation Properties of Whey Protein Gel. Ultrason. Sonochemistry 2017, 39, 810–815. [Google Scholar] [CrossRef] [PubMed]
  13. Gao, X.; Xie, Y.; Yin, T.; Hu, Y.; You, J.; Xiong, S.; Liu, R. Effect of High Intensity Ultrasound on Gelation Properties of Silver Carp Surimi with Different Salt Contents. Ultrason. Sonochemistry 2021, 70, 105326. [Google Scholar] [CrossRef] [PubMed]
  14. Xin, Y.; Lv, D.; Du, F.; Shi, X.; Yang, J.; Li, T. Ultrasound Pretreatment Combined with Emulsion Coagulant: Synergistic Effects on Soybean Protein Gel Properties and Salt-Coagulated Tofu Quality. Ultrason. Sonochemistry 2025, 120, 107437. [Google Scholar] [CrossRef]
  15. Liu, B.; Wu, Y.; Liang, Q.; Zheng, H. Effects of High-Intensity Ultrasound on Physicochemical and Gel Properties of Myofibrillar Proteins from the Bay Scallop (Argopecten Irradians). Ultrason. Sonochemistry 2024, 107, 106935. [Google Scholar] [CrossRef]
  16. Li, M.; Liu, C.; Zhang, L.; Dong, J.; Shen, R.; Li, Y. Investigation of the preparation and formula optimization of pea-oat complex protein gel. J. Light Ind. 2025, 40, 38–45, 55. (In Chinese) [Google Scholar] [CrossRef]
  17. Liu, S.-Y.; Lei, H.; Li, L.-Q.; Liu, F.; Li, L.; Yan, J.-K. Effects of Direct Addition of Curdlan on the Gelling Characteristics of Thermally Induced Soy Protein Isolate Gels. Int. J. Biol. Macromol. 2023, 253, 127092. [Google Scholar] [CrossRef]
  18. Meng, L.; Jiao, X.; Yan, B.; Huang, J.; Zhao, J.; Zhang, H.; Chen, W.; Fan, D. Effect of Fish Mince Size on Physicochemical and Gelling Properties of Silver Carp (Hypophthalmichthys Molitrix) Surimi Gel. LWT 2021, 149, 111912. [Google Scholar] [CrossRef]
  19. Wu, C.; Wang, J.; Yan, X.; Ma, W.; Wu, D.; Du, M. Effect of Partial Replacement of Water-Soluble Cod Proteins by Soy Proteins on the Heat-Induced Aggregation and Gelation Properties of Mixed Protein Systems. Food Hydrocoll. 2020, 100, 105417. [Google Scholar] [CrossRef]
  20. Taktak, W.; Nasri, R.; Hamdi, M.; Gomez-Mascaraque, L.G.; Lopez-Rubio, A.; Li, S.; Nasri, M.; Karra-Chaâbouni, M. Physicochemical, Textural, Rheological and Microstructural Properties of Protein Isolate Gels Produced from European Eel (Anguilla Anguilla) by Heat-Induced Gelation Process. Food Hydrocoll. 2018, 82, 278–287. [Google Scholar] [CrossRef]
  21. Sahraee, S.; Milani, J.M.; Ghanbarzadeh, B.; Hamishehkar, H. Physicochemical and Antifungal Properties of Bio-Nanocomposite Film Based on Gelatin-Chitin Nanoparticles. Int. J. Biol. Macromol. 2017, 97, 373–381. [Google Scholar] [CrossRef]
  22. Li, Y.; Qi, X.; Rong, L.; Li, J.; Shen, M.; Xie, J. Effect of Gellan Gum on the Rheology, Gelling, and Structural Properties of Thermally Induced Pea Protein Isolate Gel. Food Hydrocoll. 2024, 147, 109379. [Google Scholar] [CrossRef]
  23. Ma, Z.; Li, L.; Wu, C.; Huang, Y.; Teng, F.; Li, Y. Effects of Combined Enzymatic and Ultrasonic Treatments on the Structure and Gel Properties of Soybean Protein Isolate. LWT 2022, 158, 113123. [Google Scholar] [CrossRef]
  24. Zhu, N.; Zang, M.; Wang, S.; Zhang, S.; Zhao, B.; Liu, M.; Li, S.; Wu, Q.; Liu, B.; Zhao, Y.; et al. Modulating the Structure of Lamb Myofibrillar Protein Gel Influenced by Psyllium Husk Powder at Different NaCl Concentrations: Effect of Intermolecular Interactions. Food Chem. 2022, 397, 133852. [Google Scholar] [CrossRef]
  25. Cao, H.; Wang, X.; Wu, W.; Wang, M.; Zhang, Y.; Huang, K.; Song, H.; Sun, Z.; Guan, X. Exploring the Influence of Lysine Incorporation on the Physicochemical Properties of Quinoa Protein Gels Formed under Microwave versus Conventional Heating Conditions. Food Res. Int. 2025, 202, 115678. [Google Scholar] [CrossRef]
  26. Fu, Y.; Jiang, G.; Sun, X.; Yang, S.; Yu, J.; Liu, X.; Wang, L.; Zhu, S. Ultrasound-Assisted Enhancement of Gel Properties in Hypomesus Olidus Surimi. Foods 2025, 14, 2363. [Google Scholar] [CrossRef] [PubMed]
  27. Lin, J.; Liang, C.; Lin, T.; Zhong, R.; Cao, Y.; Lan, Y. Optimizing 3D Food Printing Inks: The Impact of Polysaccharides on Camellia Seed Protein Emulsion Gels. Food Hydrocoll. 2025, 166, 111337. [Google Scholar] [CrossRef]
  28. Yu, J.; Wang, Y.; Li, D.; Wang, L. Freeze-Thaw Stability and Rheological Properties of Soy Protein Isolate Emulsion Gels Induced by NaCl. Food Hydrocoll. 2022, 123, 107113. [Google Scholar] [CrossRef]
  29. Wu, C.; McClements, D.J.; He, M.; Fan, Z.; Li, Y.; Teng, F. Preparation of Okara Cellulose Hydrogels Using Ionic Liquids: Structure, Properties, and Performance. J. Mol. Liq. 2021, 331, 115744. [Google Scholar] [CrossRef]
  30. Yang, T.; Liu, T.-X.; Li, X.-T.; Tang, C.-H. Novel Nanoparticles from Insoluble Soybean Polysaccharides of Okara as Unique Pickering Stabilizers for Oil-in-Water Emulsions. Food Hydrocoll. 2019, 94, 255–267. [Google Scholar] [CrossRef]
  31. Xia, W.; Zhu, L.; Delahaije, R.J.B.M.; Cheng, Z.; Zhou, X.; Sagis, L.M.C. Acid-Induced Gels from Soy and Whey Protein Thermally-Induced Mixed Aggregates: Rheology and Microstructure. Food Hydrocoll. 2022, 125, 107376. [Google Scholar] [CrossRef]
  32. Han, C.; Ren, X.; Shen, X.; Yang, X.; Li, L. Improvement of Physicochemical Properties and Quercetin Delivery Ability of Fermentation-Induced Soy Protein Isolate Emulsion Gel Processed by Ultrasound. Ultrason. Sonochemistry 2024, 107, 106902. [Google Scholar] [CrossRef]
  33. Mozafarpour, R.; Koocheki, A. Effect of Ultrasonic Pretreatment on the Rheology and Structure of Grass Pea (Lathyrus Sativus L.) Protein Emulsion Gels Induced by Transglutaminase. Ultrason. Sonochemistry 2023, 92, 106278. [Google Scholar] [CrossRef]
  34. Yu, M.; Zeng, M.; Qin, F.; He, Z.; Chen, J. Physicochemical and Functional Properties of Protein Extracts from Torreya Grandis Seeds. Food Chem. 2017, 227, 453–460. [Google Scholar] [CrossRef]
  35. Habib, M.; Singh, S.; Ahmad, S.; Jan, S.; Gupta, A.; Jan, K.; Bashir, K. Ultrasonication Modifies the Structural, Thermal and Functional Properties of Pumpkin Seed Protein Isolate (PSPI). Ultrason. Sonochemistry 2025, 112, 107172. [Google Scholar] [CrossRef]
  36. Khatkar, A.B.; Kaur, A.; Khatkar, S.K. Restructuring of Soy Protein Employing Ultrasound: Effect on Hydration, Gelation, Thermal, in-Vitro Protein Digestibility and Structural Attributes. LWT 2020, 132, 109781. [Google Scholar] [CrossRef]
  37. Zhang, X.; Chen, X.; Gong, Y.; Li, Z.; Guo, Y.; Yu, D.; Pan, M. Emulsion Gels Stabilized by Soybean Protein Isolate and Pectin: Effects of High Intensity Ultrasound on the Gel Properties, Stability and β-Carotene Digestive Characteristics. Ultrason. Sonochemistry 2021, 79, 105756. [Google Scholar] [CrossRef] [PubMed]
  38. Yang, W.; Pu, H.; Wang, L.; Hu, Q.; Mariga, A.M.; Zheng, H. Effect of Bound Water on the Quality of Dried Lentinus Edodes during Storage. J. Sci. Food Agric. 2020, 100, 1971–1979. [Google Scholar] [CrossRef] [PubMed]
  39. Dnyaneshwar Patil, N.; Bains, A.; Kaur, S.; Yadav, R.; Ali, N.; Patil, S.; Goksen, G.; Chawla, P. Influence of Dual Succinylation and Ultrasonication Modification on the Amino Acid Content, Structural and Functional Properties of Chickpea (Cicer Arietinum L.) Protein Concentrate. Food Chem. 2024, 445, 138671. [Google Scholar] [CrossRef]
  40. Chen, Y.; Cai, X.-L.; Liu, L.; Zhang, T.; Qin, L.-K.; Jia, Y.-L. Preparation and Performance Characterization of Insoluble Dietary Fiber-Alginate-Pea Protein Ternary Composite Gels. Food Hydrocoll. 2025, 160, 110852. [Google Scholar] [CrossRef]
  41. Malik, M.A.; Saini, C.S. Rheological and Structural Properties of Protein Isolates Extracted from Dephenolized Sunflower Meal: Effect of High Intensity Ultrasound. Food Hydrocoll. 2018, 81, 229–241. [Google Scholar] [CrossRef]
  42. Li, X.; Qi, B.; Zhang, S.; Li, Y. Effects of Ultrasonic Treatment on the Structural and Functional Properties of Cactus (Opuntia Ficus-Indica) Seed Protein. Ultrason. Sonochemistry 2023, 97, 106465. [Google Scholar] [CrossRef] [PubMed]
  43. Zhao, R.; Liu, X.; Liu, W.; Liu, Q.; Zhang, L.; Hu, H. Effect of High-Intensity Ultrasound on the Structural, Rheological, Emulsifying and Gelling Properties of Insoluble Potato Protein Isolates. Ultrason. Sonochemistry 2022, 85, 105969. [Google Scholar] [CrossRef] [PubMed]
  44. Xin, X.; Qiu, W.; Xue, H.; Zhang, G.; Hu, H.; Zhao, Y.; Tu, Y. Improving the Gel Properties of Salted Egg White/Cooked Soybean Protein Isolate Composite Gels by Ultrasound Treatment: Study on the Gelling Properties and Structure. Ultrason. Sonochemistry 2023, 97, 106442. [Google Scholar] [CrossRef]
  45. Jiang, Y.-H.; Cheng, J.-H.; Sun, D.-W. Effects of Plasma Chemistry on the Interfacial Performance of Protein and Polysaccharide in Emulsion. Trends Food Sci. Technol. 2020, 98, 129–139. [Google Scholar] [CrossRef]
  46. Xue, H.; Tu, Y.; Zhang, G.; Xin, X.; Hu, H.; Qiu, W.; Ruan, D.; Zhao, Y. Mechanism of Ultrasound and Tea Polyphenol Assisted Ultrasound Modification of Egg White Protein Gel. Ultrason. Sonochemistry 2021, 81, 105857. [Google Scholar] [CrossRef]
  47. Chandrapala, J.; Zisu, B.; Palmer, M.; Kentish, S.; Ashokkumar, M. Effects of Ultrasound on the Thermal and Structural Characteristics of Proteins in Reconstituted Whey Protein Concentrate. Ultrason. Sonochemistry 2011, 18, 951–957. [Google Scholar] [CrossRef]
  48. Yang, Q.; Wang, Y.-R.; Li-Sha, Y.-J.; Chen, H.-Q. Physicochemical, Structural and Gelation Properties of Arachin-Basil Seed Gum Composite Gels: Effects of Salt Types and Concentrations. Food Hydrocoll. 2021, 113, 106545. [Google Scholar] [CrossRef]
  49. Wang, R.-X.; Li, Y.-Q.; Sun, G.-J.; Wang, C.-Y.; Liang, Y.; Hua, D.-L.; Chen, L.; Mo, H.-Z. The Improvement and Mechanism of Gelation Properties of Mung Bean Protein Treated by Ultrasound. LWT 2023, 182, 114811. [Google Scholar] [CrossRef]
  50. Yang, M.; Li, N.; Tong, L.; Fan, B.; Wang, L.; Wang, F.; Liu, L. Comparison of Physicochemical Properties and Volatile Flavor Compounds of Pea Protein and Mung Bean Protein-Based Yogurt. LWT 2021, 152, 112390. [Google Scholar] [CrossRef]
  51. Shen, L.; Tang, C.-H. Microfluidization as a Potential Technique to Modify Surface Properties of Soy Protein Isolate. Food Res. Int. 2012, 48, 108–118. [Google Scholar] [CrossRef]
  52. Zhao, C.; Miao, Z.; Qi, Q.; Zheng, Q.; Mao, Y.; Chu, Z.; Zhang, H.; Xu, X.; Zheng, M.; Liu, J. Interactions of Soy Protein Isolate with Common and Waxy Corn Starches and Their Effects on Acid-Induced Cold Gelation Properties of Complexes. Food Chem. X 2023, 18, 100671. [Google Scholar] [CrossRef]
  53. Zhao, C.; Miao, Z.; Yan, J.; Liu, J.; Chu, Z.; Yin, H.; Zheng, M.; Liu, J. Ultrasound-Induced Red Bean Protein–Lutein Interactions and Their Effects on Physicochemical Properties, Antioxidant Activities and Digestion Behaviors of Complexes. LWT 2022, 160, 113322. [Google Scholar] [CrossRef]
  54. Ma, Y.; Cao, Y.; Zhang, L.; Yu, Q. Preservation of Chilled Beef Using Active Films Based on Bacterial Cellulose and Polyvinyl Alcohol with the Incorporation of Perilla Essential Oil Pickering Emulsion. Int. J. Biol. Macromol. 2024, 271, 132118. [Google Scholar] [CrossRef] [PubMed]
  55. Huang, S.; Tu, Z.; Sha, X.; Hu, Y.; Chen, N.; Wang, H. Fabrication and Performance Evaluation of Pectin–Fish Gelatin–Resveratrol Preservative Films. Food Chem. 2021, 361, 129832. [Google Scholar] [CrossRef] [PubMed]
  56. Gülseren, İ.; Güzey, D.; Bruce, B.D.; Weiss, J. Structural and Functional Changes in Ultrasonicated Bovine Serum Albumin Solutions. Ultrason. Sonochemistry 2007, 14, 173–183. [Google Scholar] [CrossRef] [PubMed]
  57. Li, J.; Dai, Z.; Chen, Z.; Hao, Y.; Wang, S.; Mao, X. Improved Gelling and Emulsifying Properties of Myofibrillar Protein from Frozen Shrimp (Litopenaeus Vannamei) by High-Intensity Ultrasound. Food Hydrocoll. 2023, 135, 108188. [Google Scholar] [CrossRef]
  58. Lu, Y.; Zhu, Y.; Ye, T.; Nie, Y.; Jiang, S.; Lin, L.; Lu, J. Physicochemical Properties and Microstructure of Composite Surimi Gels: The Effects of Ultrasonic Treatment and Olive Oil Concentration. Ultrason. Sonochemistry 2022, 88, 106065. [Google Scholar] [CrossRef]
  59. Sun, Q.; Kong, B.; Zheng, O.; Liu, S.; Dong, X. Effect of Protein Structure Changes during Different Power Ultrasound Thawing on Emulsification Properties of Common Carp (Cyprinus Carpio) Myofibrillar Protein. Ultrason. Sonochemistry 2023, 101, 106719. [Google Scholar] [CrossRef]
  60. Hu, H.; Li-Chan, E.C.Y.; Wan, L.; Tian, M.; Pan, S. The Effect of High Intensity Ultrasonic Pre-Treatment on the Properties of Soybean Protein Isolate Gel Induced by Calcium Sulfate. Food Hydrocoll. 2013, 32, 303–311. [Google Scholar] [CrossRef]
  61. Liu, M.; Shan, S.; Gao, X.; Shi, Y.; Lu, W. The Effect of Sweet Tea Polysaccharide on the Physicochemical and Structural Properties of Whey Protein Isolate Gels. Int. J. Biol. Macromol. 2023, 240, 124344. [Google Scholar] [CrossRef]
  62. Zhao, C.; Chu, Z.; Miao, Z.; Liu, J.; Liu, J.; Xu, X.; Wu, Y.; Qi, B.; Yan, J. Ultrasound Heat Treatment Effects on Structure and Acid-Induced Cold Set Gel Properties of Soybean Protein Isolate. Food Biosci. 2021, 39, 100827. [Google Scholar] [CrossRef]
Figure 1. Effects of different ultrasonic treatments on gel strength and WHC of POPG: (a) Effects of different ultrasonic time on gel strength and WHC of POPG; (b) Effects of different ultrasonic power on gel strength and WHC of POPG. Different letters in the same column indicate significant differences (p < 0.05).
Foods 14 03751 g001
Figure 2. Effects of different ultrasonic treatments on the rheological properties of POPG: (a) Variation curves of G′ and G″ with angular frequency in different ultrasonic time; (b) Variation curves of G′ and G″ with angular frequency in different ultrasonic power; (c) Variation curves of G′ and G″ with strain in different ultrasonic time; (d) Variation curves of G′ and G″ with strain in different ultrasonic power.
Foods 14 03751 g002
Figure 3. Effects of different ultrasonic treatments on the thermal stability of POPG: (a) Effects of different ultrasonic treatments time on the thermal stability of POPG; (b) Effects of different ultrasonic treatments power on the thermal stability of POPG. The different colors denote the three stages of the thermogravimetric evolution trend.
Foods 14 03751 g003
Figure 4. Effects of different ultrasonic treatments on free sulfhydryl and disulfide bonds of POPG: (a) Effects of different ultrasonic treatments time on free sulfhydryl and disulfide bonds of POPG; (b) Effects of different ultrasonic treatments power on free sulfhydryl and disulfide bonds of POPG. Different letters in the same column indicate significant differences (p < 0.05).
Foods 14 03751 g004
Figure 5. Effects of different ultrasonic treatments on surface hydrophobicity of POPG: (a) Effects of different ultrasonic treatments time on surface hydrophobicity of POPG; (b) Effects of different ultrasonic power treatments on surface hydrophobicity of POPG. Different letters in the same column indicate significant differences (p < 0.05).
Foods 14 03751 g005
Figure 6. Effects of different ultrasonic treatments on fluorescence intensity of POPG: (a) Effects of different ultrasonic treatments time on fluorescence intensity of POPG; (b) Effects of different ultrasonic treatments power on fluorescence intensity of POPG.
Foods 14 03751 g006
Figure 7. FTIR spectrum and distribution of protein secondary structure content: (a) FTIR spectrum of POPG with different ultrasonic treatments time; (b) FTIR spectrum of POPG with different ultrasonic treatments power; (c) Amide I band deconvolution of all the samples; (d) Distribution of protein secondary structure content of POPG with different ultrasonic treatments time; (e) Distribution of protein secondary structure content of POPG with different ultrasonic treatments power.
Foods 14 03751 g007
Figure 8. Effects of different ultrasonic treatments on SEM images of POPG: the left is the SEM image and the right is the CLSM image of each sample.
Foods 14 03751 g008
Table 1. Effect of ultrasonic treatments on the thermal characteristics of POPG.
Ultrasonic ConditionsTo/°CTp/°CTd/°CΔH/J·g−1
Time (min)Control62.37 ± 1.95 d89.76 ± 1.13 c101.88 ± 1.57 c1695.75 ± 7.55 c
2070.66 ± 1.79 c97.36 ± 1.11 b108.11 ± 1.24 bc1724.45 ± 18.85 bc
2582.64 ± 2.22 b101.16 ± 1.42 ab108.82 ± 1.12 b1775.65 ± 19.75 ab
3091.51 ± 0.97 a106.21 ± 2.03 a117.85 ± 4.14 a1822.35 ± 31.85 a
3583.20 ± 1.77 b101.72 ± 1.18 ab110.44 ± 1.09 b1776.30 ± 8.90 ab
4079.01 ± 1.56 b97.24 ± 1.91 b105.78 ± 1.14 bc1774.15 ± 28.45 ab
Power (W)Control62.38 ± 1.95 c89.77 ± 1.13 c101.89 ± 1.57 c1695.75 ± 7.55 b
20073.21 ± 2.89 b97.16 ± 1.74 b107.41 ± 1.98 bc1701.30 ± 19.90 b
30077.30 ± 3.10 b98.84 ± 1.99 b108.56 ± 2.09 b1772.15 ± 18.25 ab
40092.69 ± 2.63 a110.99 ± 2.33 a130.73 ± 2.04 a1842.35 ± 51.05 a
50075.56 ± 3.89 b93.04 ± 2.72 bc105.75 ± 0.55 bc1835.15 ± 48.75 a
60057.77 ± 2.55 c88.00 ± 1.68 c109.35 ± 2.03 b1726.65 ± 18.55 ab
Different letters in the same column indicate significant differences (p < 0.05).
Table 2. Effect of ultrasonic on the intermolecular forces of POPG.
Ultrasonic ConditionsIonic BondsHydrogen BondsHydrophobic Interactions
Time (min)Control0.017 ± 0.010 ab0.131 ± 0.004 b0.765 ± 0.016 c
200.024 ± 0.001 b0.105 ± 0.001 b0.739 ± 0.008 c
250.023 ± 0.001 ab0.149 ± 0.006 b0.791 ± 0.022 bc
300.020 ± 0.005 ab0.199 ± 0.010 a0.965 ± 0.020 a
350.024 ± 0.006 ab0.127 ± 0.001 b0.740 ± 0.036 c
400.048 ± 0.038 a0.219 ± 0.010 a0.848 ± 0.048 b
Power (W)Control0.017 ± 0.010 c0.131 ± 0.004 d0.765 ± 0.016 d
2000.016 ± 0.006 c0.282 ± 0.009 a1.026 ± 0.014 bc
3000.068 ± 0.009 a0.206 ± 0.012 bc1.031 ± 0.029 bc
4000.036 ± 0.004 b0.179 ± 0.011 cd1.240 ± 0.078 a
5000.068 ± 0.133 a0.244 ± 0.008 ab0.995 ± 0.048 c
6000.017 ± 0.010 c0.131 ± 0.004 d0.765 ± 0.016 d
Different letters in the same column indicate significant differences (p < 0.05).
Disclaimer/Publisher’s Note: The statements, opinions and data contained in all publications are solely those of the individual author(s) and contributor(s) and not of MDPI and/or the editor(s). MDPI and/or the editor(s) disclaim responsibility for any injury to people or property resulting from any ideas, methods, instructions or products referred to in the content.