

Morphometric, Nutritional, and Phytochemical Characterization of Eugenia (Syzygium paniculatum Gaertn): A Berry with Under-Discovered Potential
 , ,
, ,  ,
,  ,
,  ,
,  , ,
, , 
Abstract

1. Introduction
2. Materials and Methods
2.1. Raw SPF Berries Characterization
2.1.1. Physicochemical Characterization
2.1.2. Color
2.2. Production of Pulverized SPF Berries
2.3. Pulverized SPF Berries Characterization
2.3.1. Proximate Composition
2.3.2. Scanning Electron Microscopy (SEM) Analysis
2.3.3. Phytochemical Analysis
High-Performance Liquid Chromatography (HPLC) Assay
Phytochemical Compounds Extraction
Total Phenolic Content (TPC) Assay
Antioxidant Activity
- DPPH (2.2-Diphenyl-1-picrylhydrazyl) Assay
- b.
- ABTS [2,2′-Azino-bis (3-ethylbenzothiazoline-6-sulfonic acid)] Assay
- c.
- FRAP (Ferric Reducing Ability of Plasma) Assay
Flavonoid Content
Anthocyanin Content
2.3.4. Spectroscopy
Fourier-Transform Infrared (FTIR) Spectroscopy
RAMAN Spectroscopy
2.3.5. Elemental Analysis by Atomic Absorption Spectroscopy (AAS)
2.4. Statistical Analysis
3. Results and Discussion
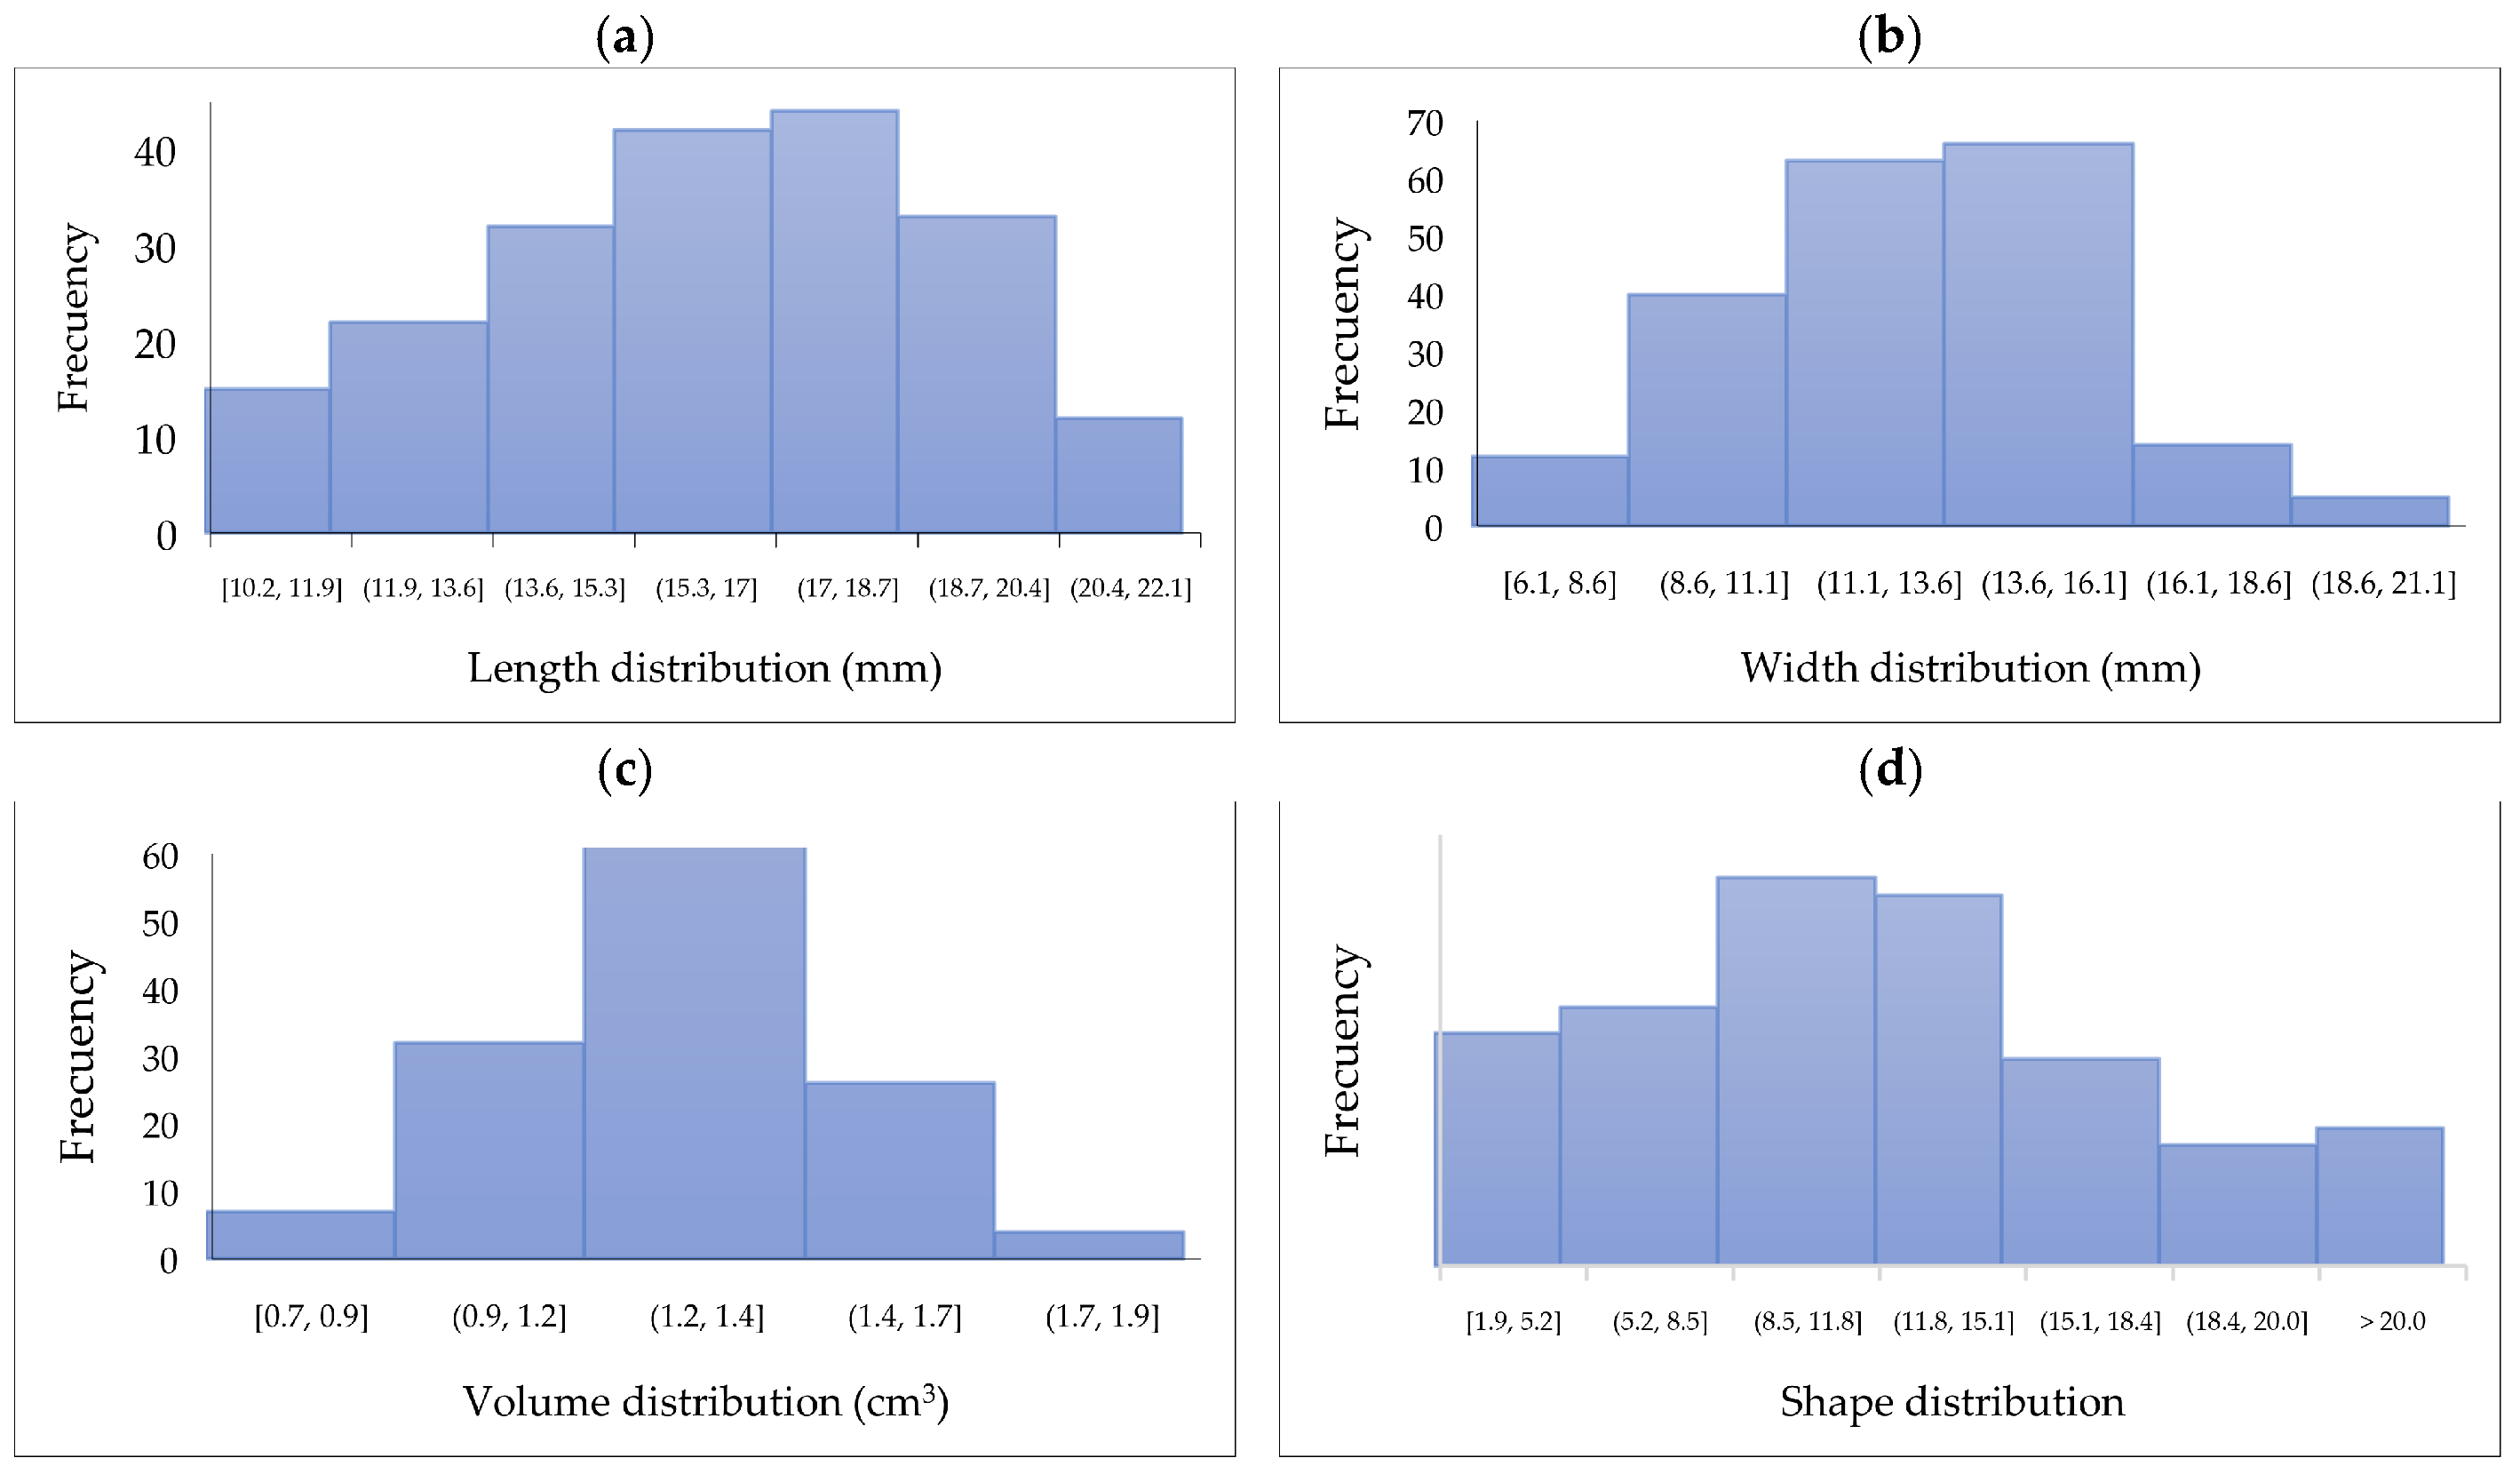
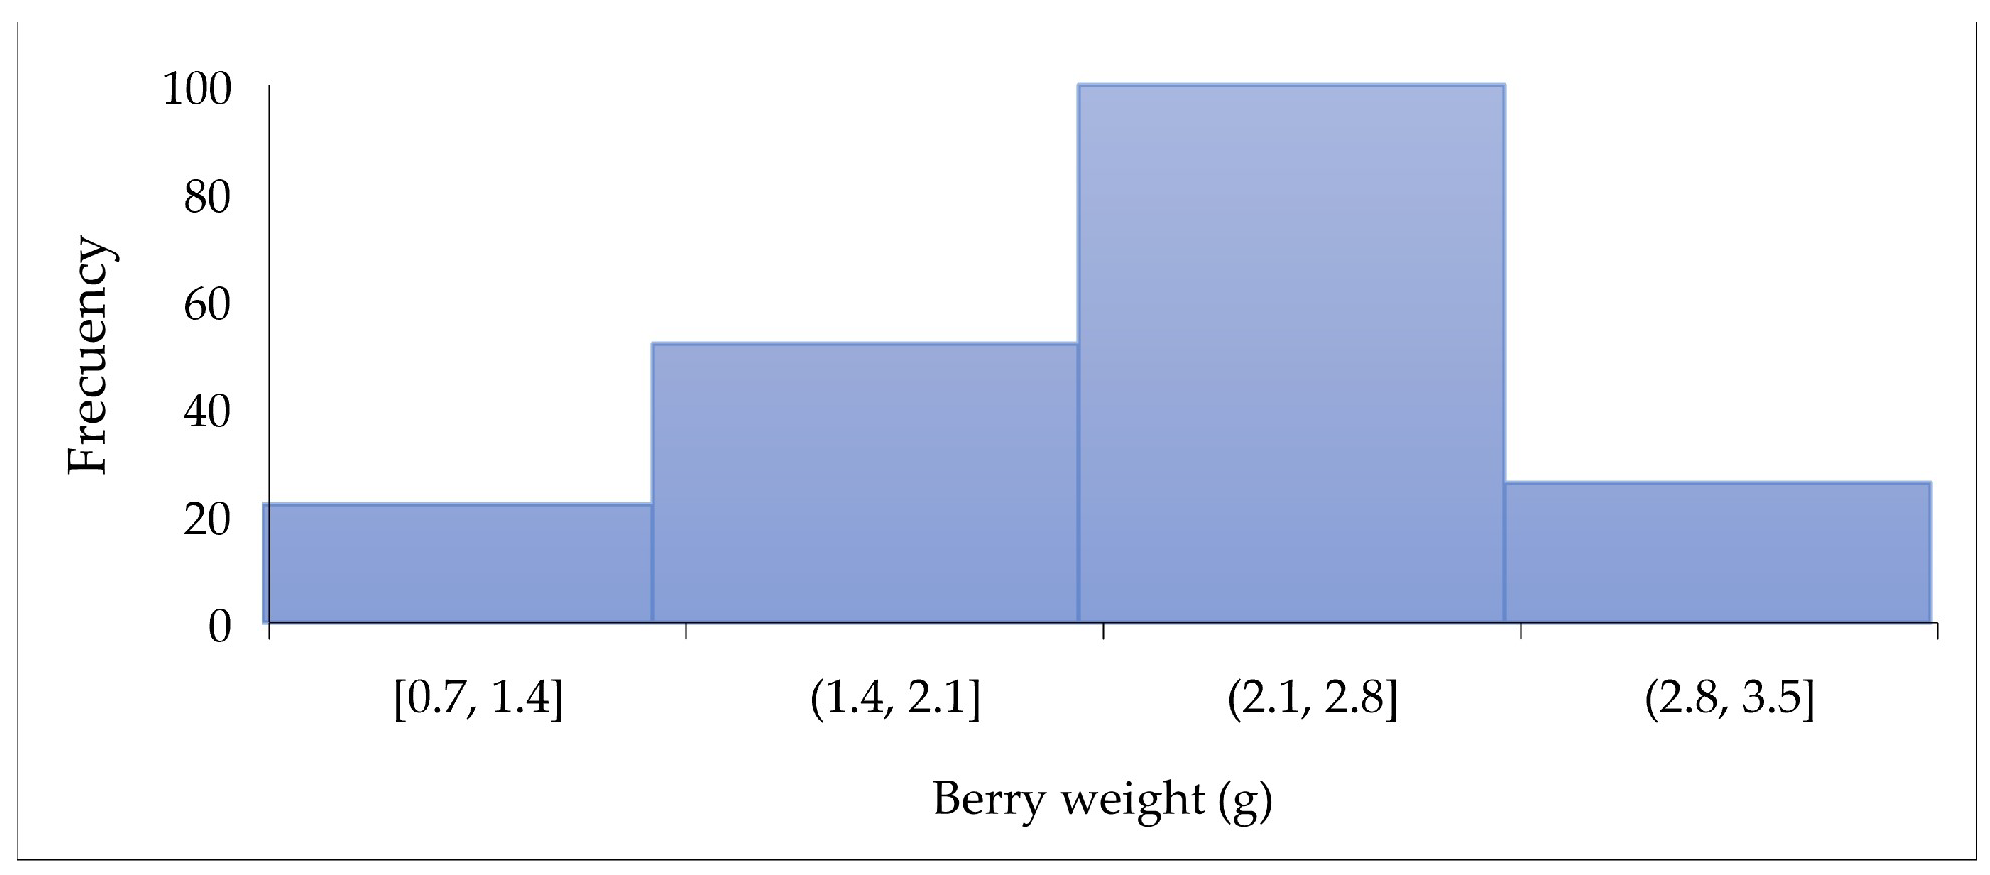
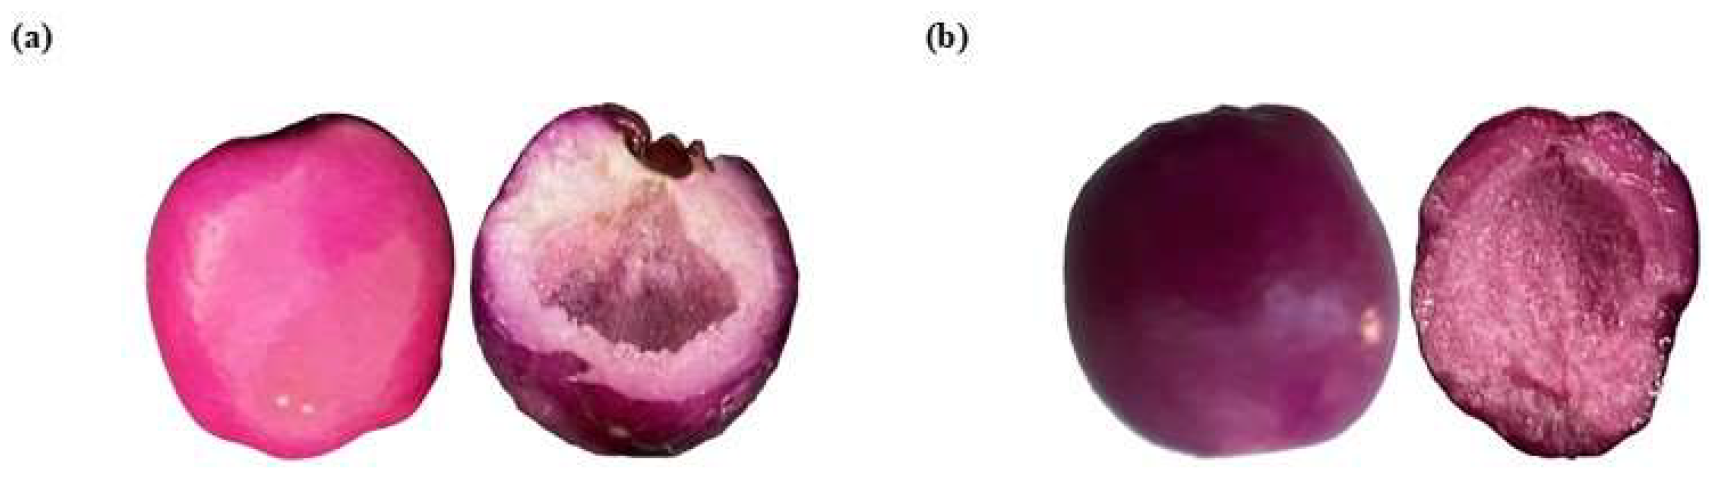
3.1. Raw SPF Berries Characterization
3.1.1. Physicochemical Characterization
3.1.2. Color
3.2. Pulverized SPF Berries Characterization
3.2.1. Proximate Composition
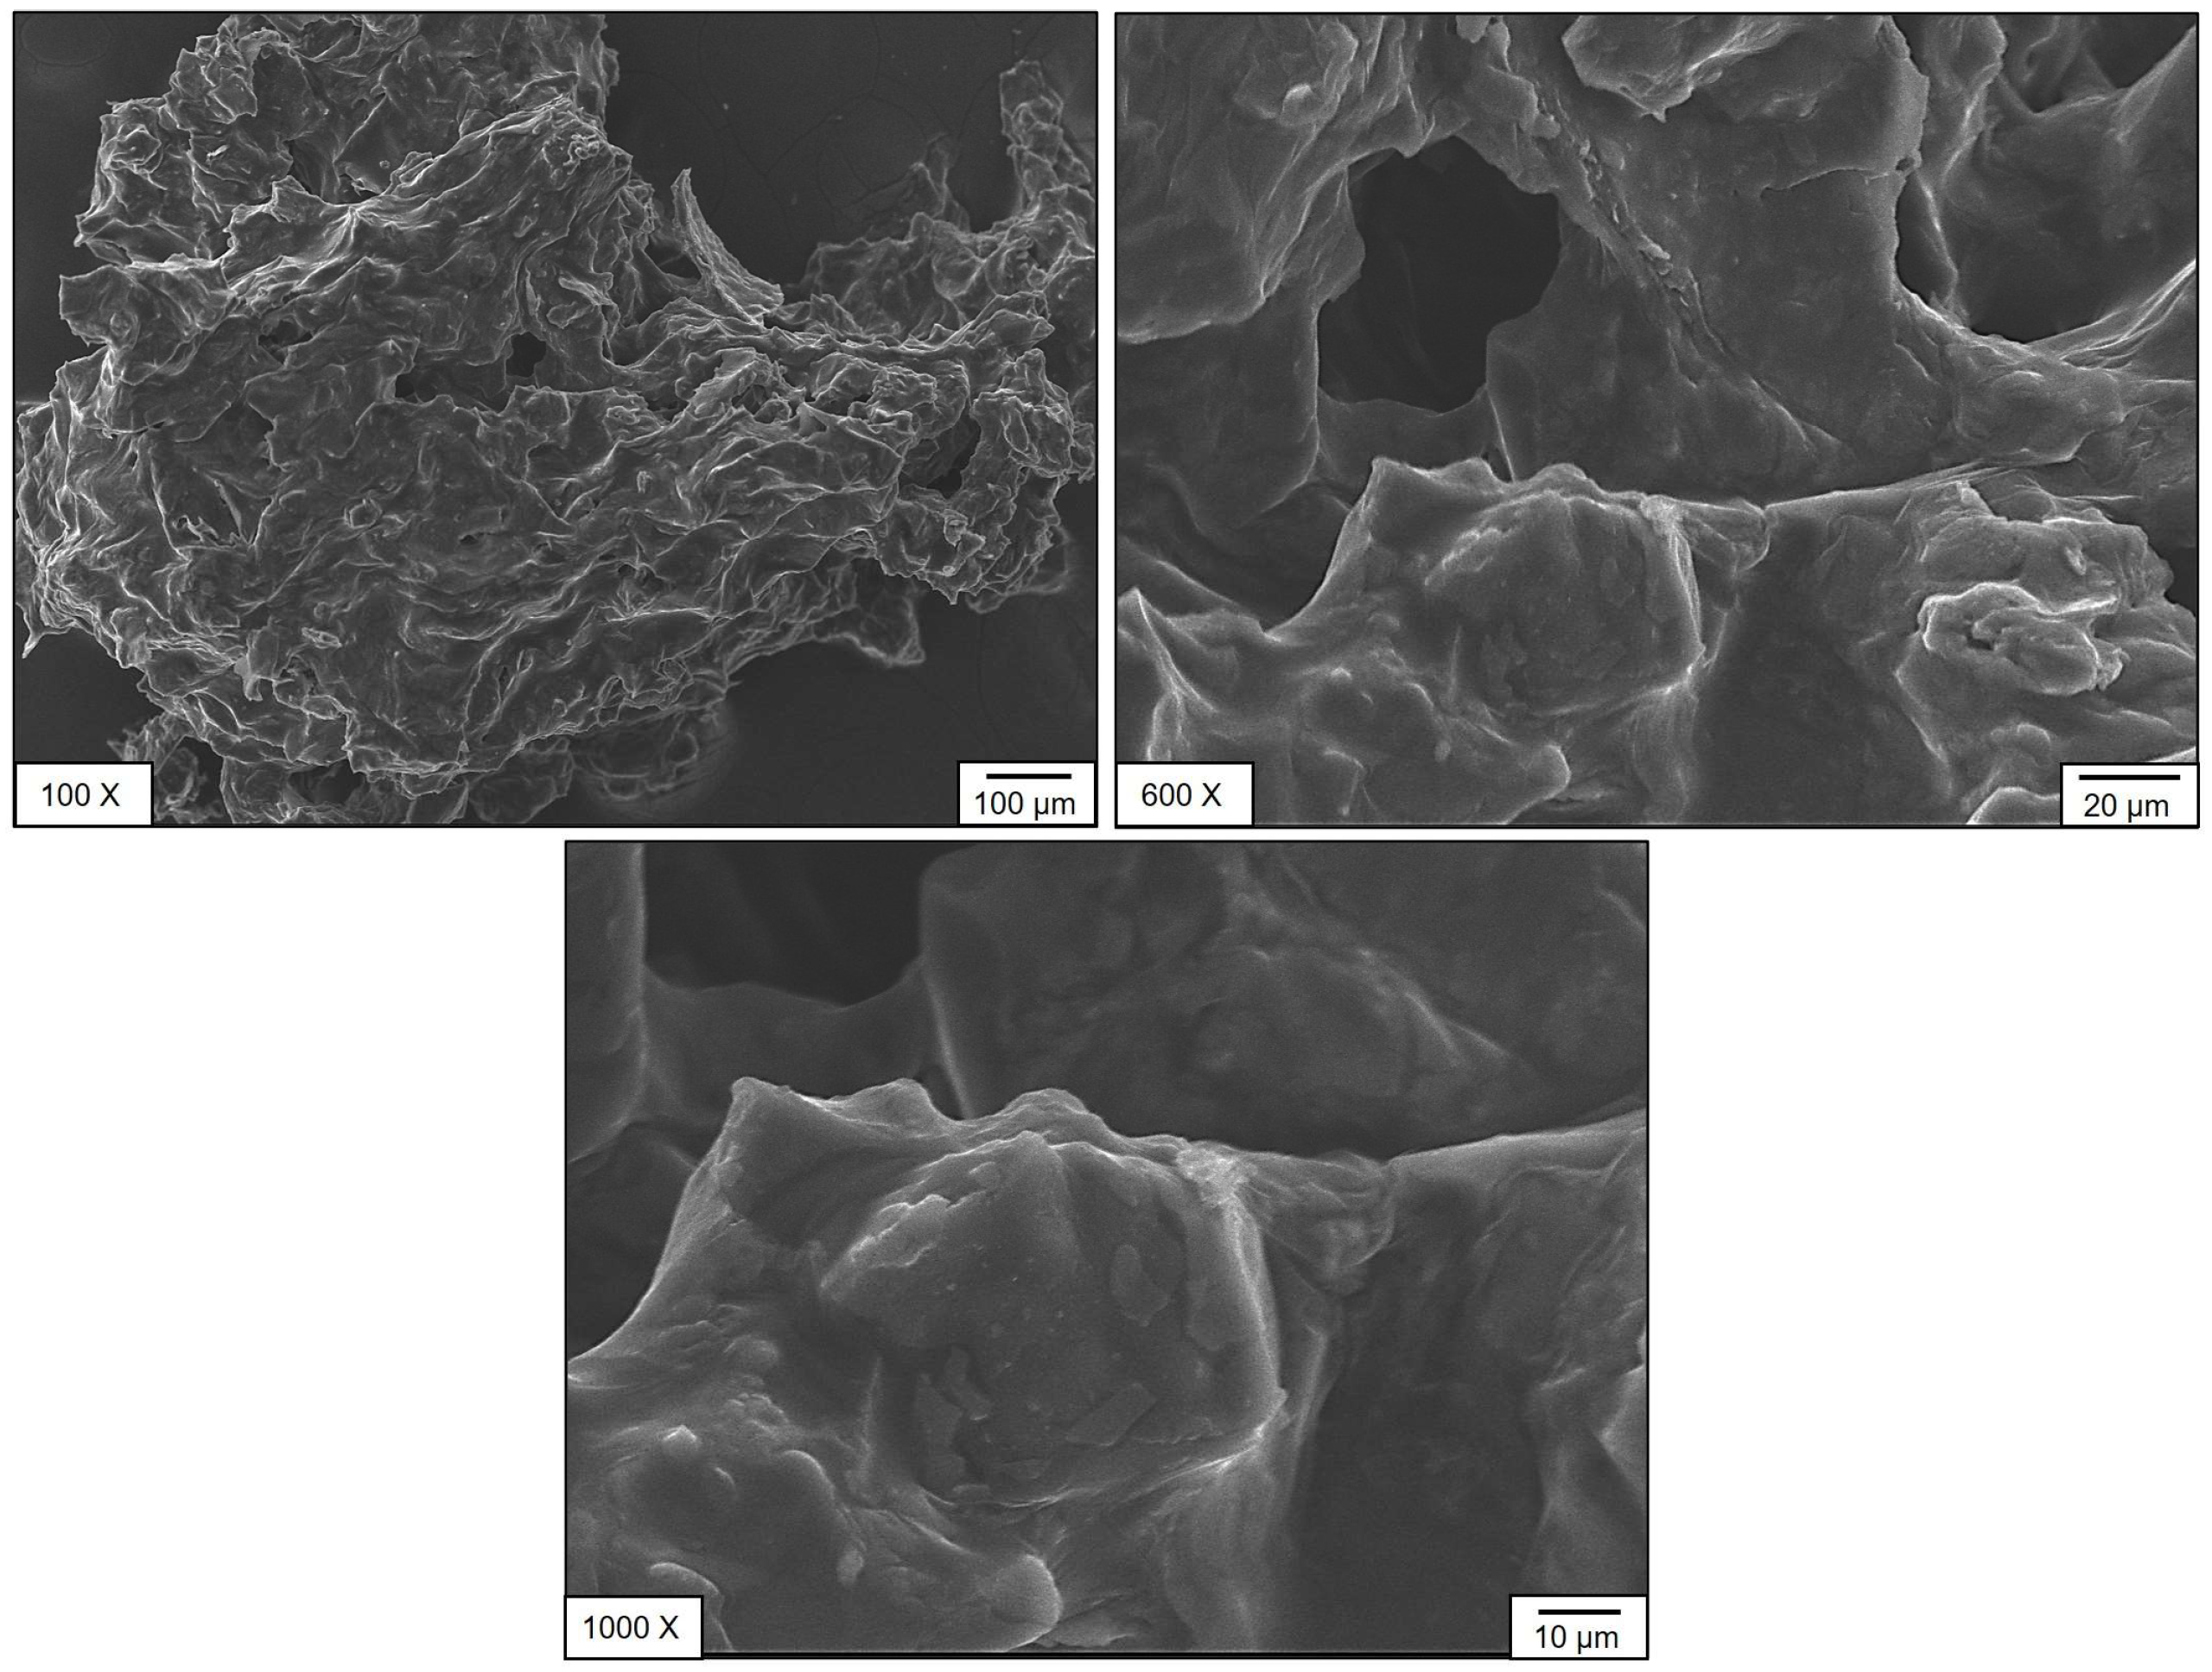
3.2.2. Scanning Electron Microscopy (SEM) Analysis
3.2.3. Phytochemical Analysis
High-Performance Liquid Chromatography (HPLC)
Total Polyphenol Content (TPC)
Antioxidant Activity
- DPPH (2,2-Diphenyl-1-picrylhydrazyl)
- b.
- ABTS [2,2′-Azino-bis (3-ethylbenzothiazoline-6-sulfonic acid)]
- c.
- FRAP (Ferric Reducing Ability of Plasma)
Flavonoid Content
Anthocyanin Content
3.2.4. Spectroscopy
Fourier-Transform Infrared (FTIR) Spectroscopy
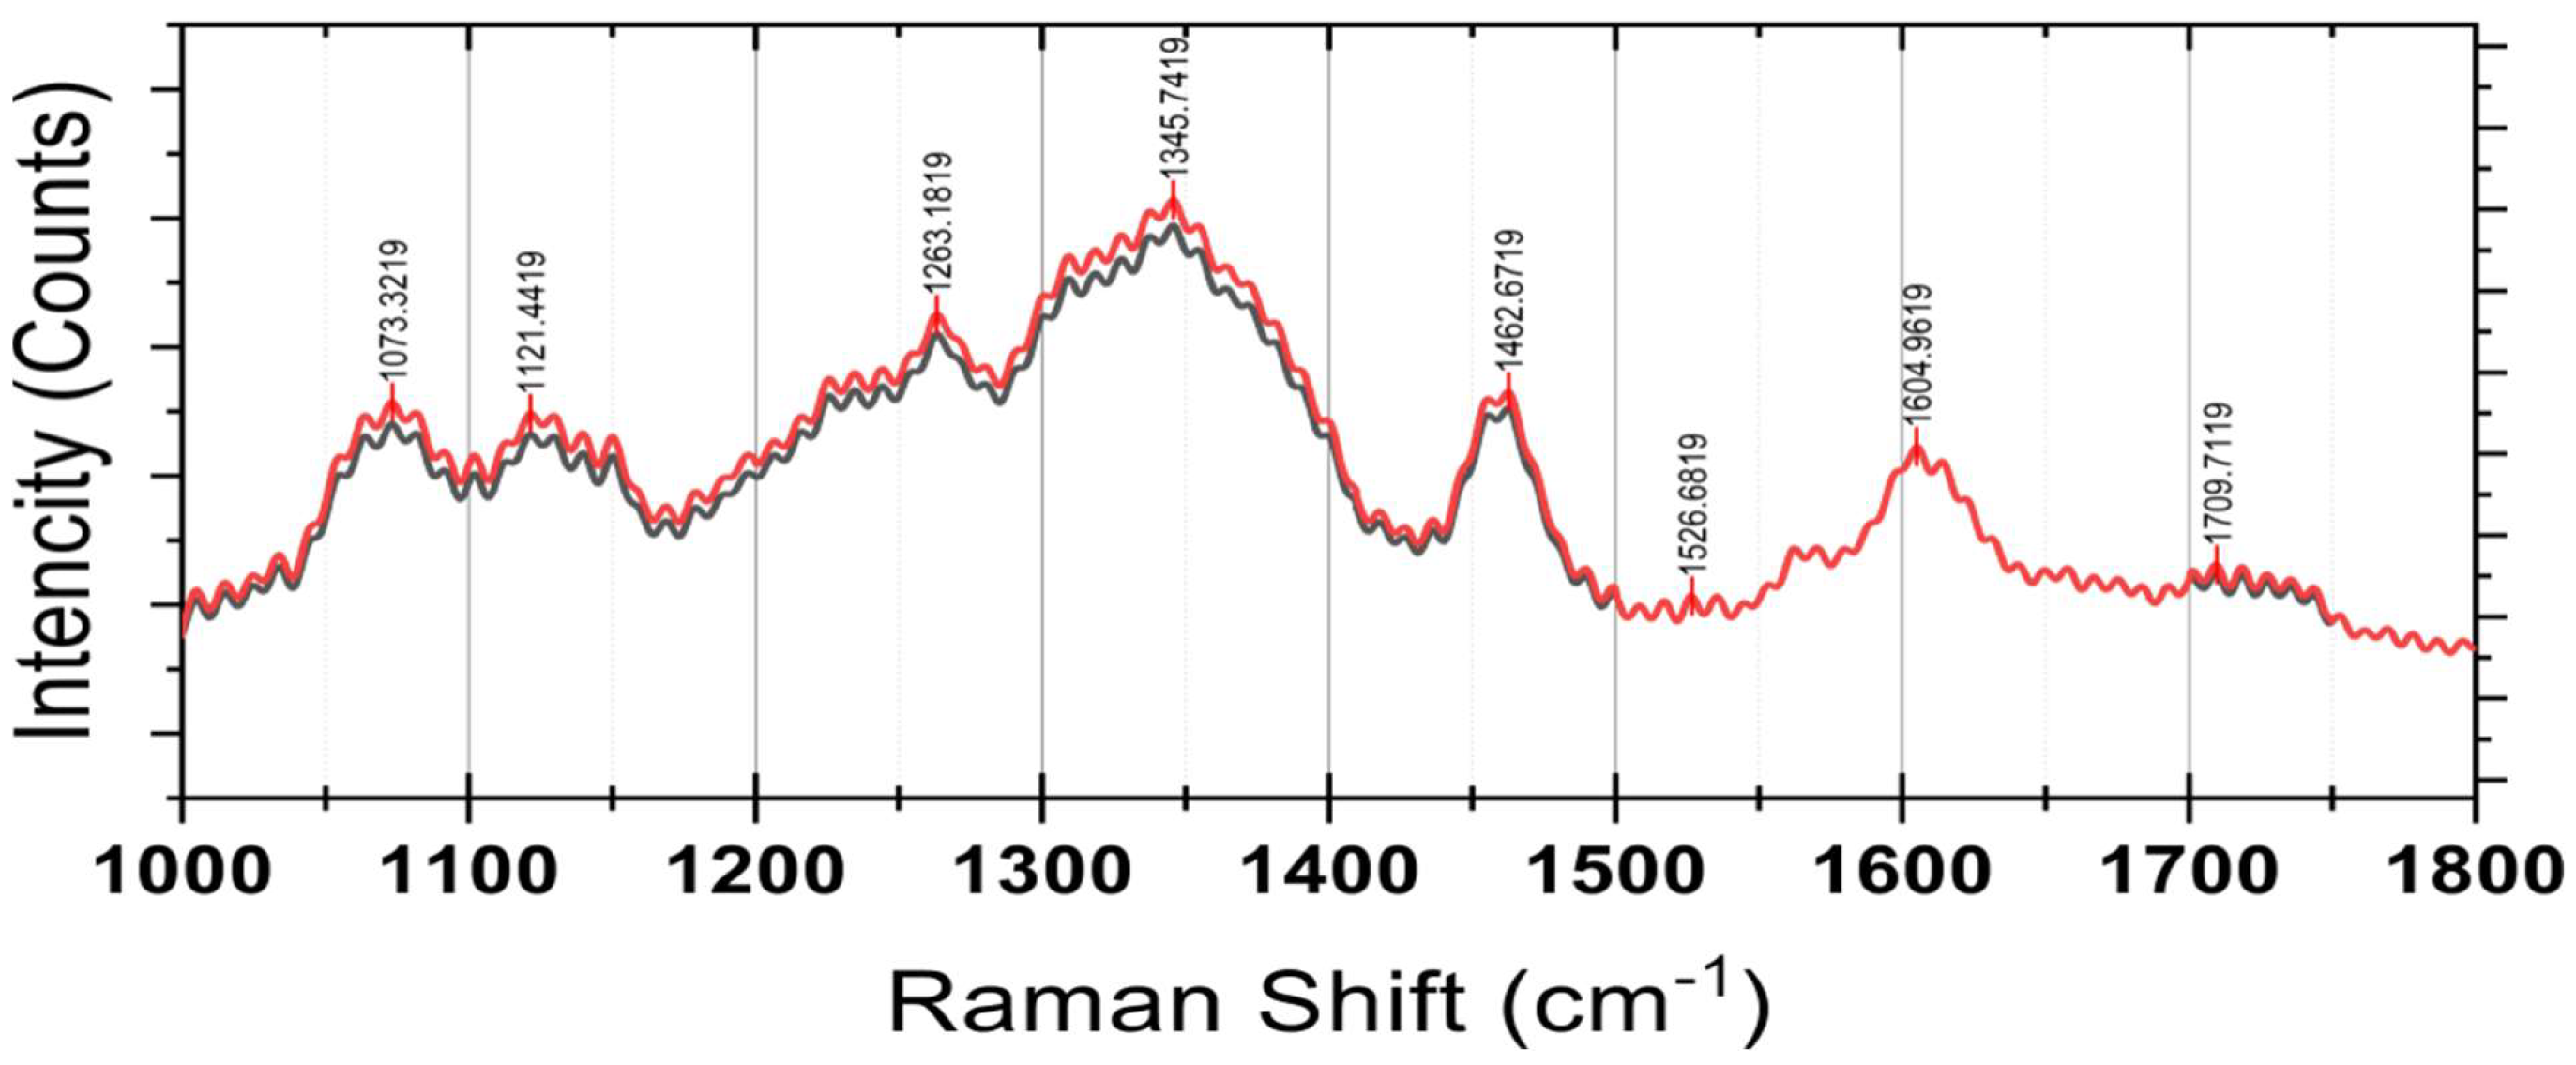
Raman Spectroscopy
3.2.5. Elemental Analysis by Atomic Absorption Spectroscopy (AAS)
4. Conclusions
Author Contributions
Funding
Institutional Review Board Statement
Informed Consent Statement
Data Availability Statement
Conflicts of Interest
References
- Jiménez-Munoz, L.M.; Tavares, G.M.; Corredig, M. Design future foods using plant protein blends for best nutritional and technological functionality. Trends Food Sci. Technol. 2021, 113, 139–150. [Google Scholar] [CrossRef]
- Salazar, D.; Arancibia, M.; Ocaña, I.; Rodríguez-Maecker, R.; Bedón, M.; López-Caballero, M.E.; Montero, M.P. Characterization and technological potential of underutilized ancestral andean crop flours from Ecuador. Agronomy 2021, 11, 1693. [Google Scholar] [CrossRef]
- Galanakis, C.M. Functionality of food components and emerging technologies. Foods 2021, 10, 128. [Google Scholar] [CrossRef]
- Acurio, L.; Salazar, D.; Guanoquiza, I.; García-Segovia, P.; Martínez-Monzó, J.; Igual, M. Ecuadorian roots flours: Bioactive compounds and processing properties. J. Agric. Food Res. 2025, 19, 101740. [Google Scholar] [CrossRef]
- Chagas, M.S.S.; Behrens, M.D.; Moragas-Tellis, C.J.; Penedo, G.X.M.; Silva, A.R.; Gonçalves-de-Albuquerque, C.F. Flavonols and Flavones as Potential anti-Inflammatory, Antioxidant, and Antibacterial Compounds. Oxid. Med. Cell. Longev. 2022, 2022, 9966750. [Google Scholar] [CrossRef] [PubMed]
- Ruiz Rodríguez, L.G.; Zamora Gasga, V.M.; Pescuma, M.; Van Nieuwenhove, C.; Mozzi, F.; Sánchez Burgos, J.A. Fruits and fruit by-products as sources of bioactive compounds. Benefits and trends of lactic acid fermentation in the development of novel fruit-based functional beverages. Food Res. Int. 2021, 140, 109854. [Google Scholar] [CrossRef]
- El Sheikha, A.F. Nutritional Profile and Health Benefits of Ganoderma lucidum “Lingzhi, Reishi, or Mannentake” as Functional Foods: Current Scenario and Future Perspectives. Foods 2022, 11, 1030. [Google Scholar] [CrossRef]
- Nemzer, B.V.; Al-Taher, F.; Yashin, A.; Revelsky, I.; Yashin, Y. Cranberry: Chemical composition, antioxidant activity and impact on human health: Overview. Molecules 2022, 27, 1503. [Google Scholar] [CrossRef] [PubMed]
- Nabeshima, E.H.; Tavares, P.E.R.; Lemos, A.L.S.C.; Moura, S.C.S.R. Emerging ingredients for clean label products and food safety. Braz. J. Food Technol. 2024, 27, e2023160. [Google Scholar] [CrossRef]
- Pérez Mora, W.H.; Mojica Gómez, J. Physicochemical analysis of fruits of Syzygium paniculatum in diff erent stages of maturity. Entre Cienc. E Ing. 2023, 12, 124–129. [Google Scholar] [CrossRef]
- de Amorim, M.S.; Verdan, M.H.; Oliveira, C.S.; Santos, A.D.C. Essential Oils of Neotropical Myrtaceae Species From 2011 Until 2023: An Update. Chem. Biodivers. 2024, 21, e202401503. [Google Scholar] [CrossRef] [PubMed]
- Cumpston, Z. Indigenous Plant Use: A booklet on the Medicinal, Nutritional and Technological Use of Indigenous Plants; Clean Air and Urban Landscapes Hub: Victoria, Australia, 2019. [Google Scholar]
- Saber, F.R.; Munekata, P.E.; Rizwan, K.; El-Nashar, H.A.; Fahmy, N.M.; Aly, S.H.; El-Shazly, M.; Bouyahya, A.; Lorenzo, J.M. Family Myrtaceae: The treasure hidden in the complex/diverse composition. Crit. Rev. Food Sci. Nutr. 2024, 64, 6737–6755. [Google Scholar] [CrossRef]
- Maheshwari, P.; Nair, A.; Shanmugasundaram, P. An overview on diabetic profile of various Syzygium species. J. Pharm. Negat. Results 2022, 13, 1832–1836. [Google Scholar] [CrossRef]
- Pachulicz, R.J.; Yu, L.; Jovcevski, B.; Bulone, V.; Pukala, T.L. Polyphenol characterisation and diverse bioactivities of native Australian lilly pilly (Syzygium paniculatum) extract. Food Funct. 2022, 13, 8585–8592. [Google Scholar] [CrossRef] [PubMed]
- Julizan, N.; Ishmayana, S.; Zainuddin, A.; Van Hung, P.; Kurnia, D. Potential of Syzygnium polyanthum as Natural Food Preservative: A Review. Foods 2023, 12, 2275. [Google Scholar] [CrossRef]
- Armijos, C.; Ramírez, J.; Vidari, G. Poorly Investigated Ecuadorian Medicinal Plants. Plants 2022, 11, 1590. [Google Scholar] [CrossRef]
- Ranghoo-Sanmukhiya, V.; Chellan, Y.; Soulange, J.; Lambrechts, I.; Stapelberg, J.; Crampton, B.; Lall, N. Biochemical and phylogenetic analysis of Eugenia and Syzygium species from Mauritius. J. Appl. Res. Med. Aromat. Plants 2018, 12, 21–29. [Google Scholar] [CrossRef]
- da Silva, J.P.R.; Aragão, A.C.R.; dos Santos Sousa Junior, R.; Crisóstomo Bezerra Costa, C.A.; da Silva Moura, O.F.; Araújo, T.D.S.; da Silva, D.A.; da Silva Neto, A.R.; Silva, K.C.; Lopes, T.O.; et al. Phytochemical analysis, in vitro antioxidant and anticholinesterase activities of Solanum paniculatum L. and an in-silico test with the AChE enzyme. S. Afr. J. Bot. 2023, 156, 342–351. [Google Scholar] [CrossRef]
- Konda, P.Y.; Chennupati, V.; Dasari, S.; Sharma, N.; Muthulingam, M.; Ramakrishnan, R.; Sade, A.; Jagadheeshkumar, V.; Natesan, V.; Jaiswal, K.K. Ethno-pharmacological insulin signaling induction of aqueous extract of Syzygium paniculatum fruits in a high-fat diet induced hepatic insulin resistance. J. Ethnopharmacol. 2021, 268, 113576. [Google Scholar] [CrossRef]
- Amir Rawa, M.S.; Mazlan, M.K.N.; Ahmad, R.; Nogawa, T.; Wahab, H.A. Roles of Syzygium in anti-cholinesterase, anti-diabetic, anti-inflammatory, and antioxidant: From Alzheimer’s perspective. Plants 2022, 11, 1476. [Google Scholar] [CrossRef]
- Acurio, L.; Salazar, D.; García, M.E.; García-Segovia, P.; Martínez-Monzó, J.; Igual, M. Characterization, mathematical modeling of moisture sorption isotherms and bioactive compounds of Andean root flours. Curr. Res. Food Sci. 2024, 8, 100752. [Google Scholar] [CrossRef]
- Association of Analytical Communities. Official Methods of Analysis; Oxford University Press: New York, NY, USA, 2023. [Google Scholar]
- Nurlely, N.; Perdana Putra, A.M.; Nurrochmad, A.; Widyarini, S.; Fakhrudin, N. Extraction, phytochemicals, bioactivities, and toxicity of Syzygium polyanthum: A comprehensive review. J. Herbmed Pharmacol. 2024, 13, 366–380. [Google Scholar] [CrossRef]
- Rocha Martins, G.; Ferreira Monteiro, A.; Lopes do Amaral, F.R.; da Silva, A.S.A. A validated Folin-Ciocalteu method for total phenolics quantification of condensed tannin-rich açaí (Euterpe oleracea Mart.) seeds extract. J. Food Sci. Technol. 2021, 58, 4693–4702. [Google Scholar] [CrossRef] [PubMed]
- Rahman, M.; Buragohain, R.; Das, R.; Islam, M.A.; Hazarika, N.K.; Pathak, K.; Barman, P. Comparative biochemical evaluation of the proximate content, antioxidant properties, and phytochemical constituents of ethnomedicinally important Docynia indica from Northeast India. Vegetos 2024, 1–8. [Google Scholar] [CrossRef]
- Elhassaneen, Y.; Elbassouny, G.; Emam, O.; Hashem, S. Influence of novel freezing and storage technology on nutrient contents, bioactive compounds and antioxidant capacity of black eggplant. J. Agric. Crops. 2023, 9, 338–352. [Google Scholar] [CrossRef]
- Shraim, A.M.; Ahmed, T.A.; Rahman, M.M.; Hijji, Y.M. Determination of total flavonoid content by aluminum chloride assay: A critical evaluation. LWT 2021, 150, 111932. [Google Scholar] [CrossRef]
- Filip, M.; Mihaela, V.; Copaciu, F.; Coman, V. Identification of anthocyanins and anthocyanidins from berry fruits by chromatographic and spectroscopic techniques to establish the juice authenticity from market. JPC J. Planar Chromatogr. 2012, 25, 534–541. [Google Scholar] [CrossRef]
- Jorquera-Fontena, E.; Génard, M.; Ribera-Fonseca, A.; Franck, N. A simple allometric model for estimating blueberry fruit weight from diameter measurements. Sci. Hortic. 2017, 219, 131–134. [Google Scholar] [CrossRef]
- Montgomery, D.R.; Biklé, A. Soil Health and Nutrient Density: Beyond Organic vs. Conventional Farming. Front. Sustain. Food Syst. 2021, 5, 699147. [Google Scholar] [CrossRef]
- Wan, X.; Wu, Z.; Sun, D.; Long, L.; Song, Q.; Gao, C. Cytological characteristics of blueberry fruit development. BMC Plant Biol. 2024, 24, 184. [Google Scholar] [CrossRef]
- Tokunbo Bamise, C.; Obhioneh Oziegbe, E. Laboratory analysis of pH and neutralizable acidity of commercial citrus fruits in Nigeria. Adv. Biol. Res. 2013, 7, 72–76. [Google Scholar] [CrossRef]
- Balaguera-López, H.E.; Fischer, G.; Herrera-Arévalo, A. Postharvest physicochemical aspects of Campomanesia lineatifolia R. & P. fruit, a Myrtaceae with commercial potential. Rev. Colomb. Cienc. Hortic. 2022, 16, e14185. [Google Scholar] [CrossRef]
- Santos, M.; Gonçalves, É. Effect of different extracting solvents on antioxidant activity and phenolic compounds of a fruit and vegetable residue flour. Sci. Agropecu. 2016, 7, 07–14. [Google Scholar] [CrossRef]
- Li, W.; Zhang, X.; Wang, S.; Gao, X.; Zhang, X. Research Progress on Extraction and Detection Technologies of Flavonoid Compounds in Foods. Foods 2024, 13, 628. [Google Scholar] [CrossRef] [PubMed]
- Recinella, L.; Chiavaroli, A.; Veschi, S.; Cama, A.; Acquaviva, A.; Libero, M.L.; Leone, S.; Di Simone, S.C.; Pagano, E.; Zengin, G.; et al. A grape (Vitis vinifera L.) pomace water extract modulates inflammatory and immune response in SW-480 cells and isolated mouse colon. Phytother. Res. 2022, 36, 4620–4630. [Google Scholar] [CrossRef]
- Gibson, L.; Rupasinghe, H.P.; Forney, C.F.; Eaton, L. Characterization of Changes in Polyphenols, Antioxidant Capacity and Physico-Chemical Parameters during Lowbush Blueberry Fruit Ripening. Antioxidants 2013, 2, 216–229. [Google Scholar] [CrossRef]
- Kobori, R.; Yakami, S.; Kawasaki, T.; Saito, A. Changes in the polyphenol content of red raspberry fruits during ripening. Horticulturae 2021, 7, 569. [Google Scholar] [CrossRef]
- Antala, P.A.; Chakote, A.; Varshney, N.; Suthar, K.; Singh, D.; Narwade, A.; Patel, K.; Gandhi, K.; Singh, S.; Karmakar, N. Phytochemical and metabolic changes associated with ripening of Lycopersicon esculentum. Sci. Rep. 2025, 15, 10692. [Google Scholar] [CrossRef]
- Pham, N.M.Q.; Chalmers, A.C.; Vuong, Q.V.; Bowyer, M.C.; Scarlett, C.J. Characterising the Physical, Phytochemical and Antioxidant Properties of the Tuckeroo (Cupaniopsis anacardioides) Fruit. Technologies 2017, 5, 57. [Google Scholar] [CrossRef]
- Makkar, H.P.S. Quantification of Tannins in Tree and Shrub Foliage: A Laboratory Manual; Springer: Dordrecht, The Netherlands, 2003. [Google Scholar]
- Khasanah, U.; Adiningsih, O.R.; Anggraeni, E.D.; Uliyah, F.U.; Ramadhani, A.I.; Saraswati, A.A.D.; Ardiani, G.K. Phytochemical screening, total phenolic content and cytotoxic activity of seed, leaves, and pulp from Syzygium cumini against breast cancer cell culture 4T1. Res. J. Pharmacogn. 2022, 14, 145–149. [Google Scholar] [CrossRef]
- Li, J.; Shi, C.; Shen, D.; Han, T.; Wu, W.; Lyu, L.; Li, W. Composition and Antioxidant Activity of Anthocyanins and Non-Anthocyanin Flavonoids in Blackberry from Different Growth Stages. Foods 2022, 11, 2902. [Google Scholar] [CrossRef] [PubMed]
- Silva, J.D.R.; Arruda, H.S.; Andrade, A.C.; Berilli, P.; Borsoi, F.T.; Monroy, Y.M.; Rodrigues, M.V.N.; Sampaio, K.A.; Pastore, G.M.; Marostica Junior, M.R. Eugenia calycina and Eugenia stigmatosa as Promising Sources of Antioxidant Phenolic Compounds. Plants 2024, 13, 2039. [Google Scholar] [CrossRef]
- Kim, S.; Semple, S.J.; Simpson, B.S.; Deo, P. Antioxidant and Antiglycation Activities of Syzygium paniculatum Gaertn and Inhibition of Digestive Enzymes Relevant to Type 2 Diabetes Mellitus. Plant Foods Hum. Nutr. 2020, 75, 621–627. [Google Scholar] [CrossRef] [PubMed]
- Wang, L.; Li, R.; Zhang, Q.; Liu, J.; Tao, T.; Zhang, T.; Wu, C.; Ren, Q.; Pu, X.; Peng, W. Pyracantha fortuneana (Maxim.) Li: A comprehensive review of its phytochemistry, pharmacological properties, and product development. Front. Sustain. Food Syst. 2022, 6, 940900. [Google Scholar] [CrossRef]
- Lee, J.; Hwang, I.; Park, Y.-S.; Lee, D.Y. Occurrence and health risk assessment of antimony, arsenic, barium, cadmium, chromium, nickel, and lead in fresh fruits consumed in South Korea. Appl. Biol. Chem. 2023, 66, 40. [Google Scholar] [CrossRef]
- Wathon, M.H.; Susilowati, E.; Ariani, S.R.D. Anthocyanins from Java Plum Fruits (Syzygium cumini) and their Stability in Various pHs. J. Biomim. Biomater. Biomed. Eng. 2023, 62, 51–61. [Google Scholar] [CrossRef]
- Belwal, T.; Pandey, A.; Bhatt, I.D.; Rawal, R.S.; Luo, Z. Trends of polyphenolics and anthocyanins accumulation along ripening stages of wild edible fruits of Indian Himalayan region. Sci. Rep. 2019, 9, 5894. [Google Scholar] [CrossRef]
- Govindarajan, N.; Ravichandran, L.; Chelladurai, P.K.; Pandey, A.; Murugesan, V.; Kusuma, G. Pharmacopoeial Compliance of Marketed Formulations containing seeds of Syzygium cumini (L.) Skeels. Res. J. Pharm. Technol. 2023, 16, 5823–5827. [Google Scholar] [CrossRef]
- Gouws, C.A.; Georgouopoulou, E.; Mellor, D.D.; Naumovski, N. The Effect of Juicing Methods on the Phytochemical and Antioxidant Characteristics of the Purple Prickly Pear (Opuntia ficus indica)—Preliminary Findings on Juice and Pomace. Beverages 2019, 5, 28. [Google Scholar] [CrossRef]
- de Paulo Farias, D.; Neri-Numa, I.A.; de Araújo, F.F.; Pastore, G.M. A critical review of some fruit trees from the Myrtaceae family as promising sources for food applications with functional claims. Food Chem. 2020, 306, 125630. [Google Scholar] [CrossRef]
- Barboni, T.; Cannac, M.; Massi, L.; Perez-Ramirez, Y.; Chiaramonti, N. Variability of Polyphenol Compounds in Myrtus Communis L. (Myrtaceae) Berries from Corsica. Molecules 2010, 15, 7849–7860. [Google Scholar] [CrossRef] [PubMed]
- Chirinos, R.; Galarza, J.; Pallardel, I.; Pedreschi, R.; Campos, D. Antioxidant compounds and antioxidant capacity of Peruvian camu camu (Myrciaria dubia (H.B.K.) McVaugh) fruit at different maturity stages. Food Chem. 2010, 120, 1019–1024. [Google Scholar] [CrossRef]
- da Veiga Correia, V.T.; da Silva, P.R.; Ribeiro, C.M.; Ramos, A.L.; Mazzinghy, A.C.; Silva, V.D.; Júnior, A.H.; Nunes, B.V.; Vieira, A.L.; Ribeiro, L.V.; et al. An Integrative Review on the Main Flavonoids Found in Some Species of the Myrtaceae Family: Phytochemical Characterization, Health Benefits and Development of Products. Plants 2022, 11, 2796. [Google Scholar] [CrossRef] [PubMed]
- Gaibor, F.M.; Rodríguez, D.; Fundora, L.; Salas, E.; Rodríguez, J.L.; Falco, A.S.; Casariego, A.; García, M.A. Evaluación de las características físicas, químicas, toxicológicas, antibacterianas y sensoriales del cerezo negro (Syzygium cumini L.): Physical, chemical, toxicological, antibacterial and sensorial assessment of black cherry (Syzygium cumini L.). Cienc. Y Tecnol. De Aliment. 2016, 26, 62–68. [Google Scholar]
- Nguyen, N. Towards a Comprehensive Understanding of the Fruit Development and Ripening Process of Wild Bilberry (Vaccinium myrtillus L.). Ph.D. Thesis, University of Oulu, Oulu, Finland, 2024. [Google Scholar]
- Tosun, I.; Ustun, N.S.; Tekguler, B. Physical and chemical changes during ripening of blackberry fruits. Sci. Agric. 2008, 65, 87–90. [Google Scholar] [CrossRef]
- Medveckienė, B.; Kulaitienė, J.; Vaitkevičienė, N.; Levickienė, D.; Bunevičienė, K. Effect of Harvesting in Different Ripening Stages on the Content of the Mineral Elements of Rosehip (Rosa spp.) Fruit Flesh. Horticulturae 2022, 8, 467. [Google Scholar] [CrossRef]
- Jaime-Guerrero, M.; Álvarez-Herrera, J.G.; Fischer, G. Effect of calcium on fruit quality: A review. Agron. Colomb. 2024, 42, e112026. [Google Scholar] [CrossRef]
- Hocking, B.; Tyerman, S.D.; Burton, R.A.; Gilliham, M. Fruit Calcium: Transport and physiology. Front. Plant Sci. 2016, 7, 569. [Google Scholar] [CrossRef]
- Quddus, M.A.; Siddiky, M.A.; Hussain, M.J.; Rahman, M.A.; Ali, M.R.; Taher Masud, M.A. Magnesium influences growth, yield, nutrient uptake, and fruit quality of tomato. Int. J. Veg. Sci. 2022, 28, 441–464. [Google Scholar] [CrossRef]
- Clausen, T. Na+-K+ pump regulation and skeletal muscle contractility. Physiol. Rev. 2003, 83, 1269–1324. [Google Scholar] [CrossRef]
- Gibbert, L.; Bampi, M.; Kerkhoven, N.C.; Benevide Sereno, A.; de Queiroz Pereira Pinto, C.; Rodrigues Ferreira, S.M.; Tribuzy de Magalhães Cordeiro, A.M.; Lins de Albuquerque Meireles, B.R.; Campelo Borges, G.d.S.; Meira Silveira, J.L. Nutritional potential of Red Jambo fruit: Dietary fibers, minerals, antioxidant potential, and bioaccessibility of phenolic compounds. Res. Soc. Dev. 2022, 11, e33111225578. [Google Scholar] [CrossRef]
- Martinez-Finley, E.J.; Chakraborty, S.; Aschner, M. Manganese in biological systems. In Encyclopedia of Metalloproteins; Springer: Dordrecht, The Netherlands, 2013; pp. 1297–1303. [Google Scholar]
- Tsang, T.; Davis, C.I.; Brady, D.C. Copper biology. Curr. Biol. 2021, 31, R421–R427. [Google Scholar] [CrossRef] [PubMed]
- Sangeetha, V.; Dutta, S.; Moses, J.; Anandharamakrishnan, C. Zinc nutrition and human health: Overview and implications. eFood 2022, 3, e17. [Google Scholar] [CrossRef]
- Behera, P.R.; Chitdeshwari, T.; Malarvizhi, P.; Sivakumar, U.; Vethamoni, P.I. Zinc (Zn) and Iron (Fe) Fertilization for Improving the Antioxidant Enzyme Activity and Biochemical Constituents in Capsicum Hybrids. Int. J. Plant Sci. 2021, 33, 30774. [Google Scholar] [CrossRef]
- Costa, F.; de Lurdes Baeta, M.; Saraiva, D.; Verissimo, M.T.; Ramos, F. Evolution of mineral contents in tomato fruits during the ripening process after harvest. Food Anal. Methods 2011, 4, 410–415. [Google Scholar] [CrossRef]


| Sample | °Brix | pH |
|---|---|---|
| CM | 7.90 ± 0.18 | 3.21 ± 0.01 |
| OM | 8.43 ± 0.18 * | 3.28 ± 0.01 * |
| Sample | Ripening State | L* | a* | b* | C* | h* |
|---|---|---|---|---|---|---|
| Peel | CM | 32.60 ± 2.74 aA | 30.50 ± 3.88 aA | −1.97± 1.38 aB | 29.55 ± 3.08 aA | 356.92 ± 2.43 aA |
| OM | 32.96 ± 3.15 bA | 27.46 ± 2.62 aA | 2.04 ± 0.93 bA | 27.77 ± 2.60 aA | 3.48 ± 0.93 bB | |
| Pulp | CM | 39.70 ± 4.53 aB | 22.13 ± 3.17 bA | −1.71 ± 0.89 aB | 21.70 ± 3.12 bA | 355.65 ± 2.39 aA |
| OM | 50.32 ± 6.05 aA | 9.70 ± 3.07 bB | 6.22 ± 2.46 aA | 10.83 ± 2.87 bB | 42.78 ± 8.60 aB |
| Parameter | Units | Value |
|---|---|---|
| Moisture | % | 88.9 ± 0.2 |
| Total solids | % | 11.1 ± 0.1 |
| Total dietary fiber | % | 3.56 ± 0.02 |
| Total protein | % (N × 6.25) | 0.627 ± 0.001 |
| Fat | % | 0 |
| Ash | % | 0.279 ± 0.001 |
| Total carbohydrates | % | 7 ± 0.1 |
| Extraction Method | Retention Time (min) | Relative Area (%) | Associated Compounds |
|---|---|---|---|
| In EtOH | 4.940 | 13.82 | Phenolic Acids (Gallic, Chlorogenic) |
| 5.093 | 12.57 | Hydroxycinnamic Acid | |
| 6.383 | 11.13 | Ferulic Acid | |
| 19.040 | 13.77 | Flavonoid (Quercetin, Rutin) | |
| 23.130 | 14.84 | Condensed Tannins | |
| In H2O | 4.937 | 32.41 | Phenolic |
| 5.070 | 25.43 | Caffeic | |
| 25.150 | 9.74 | Anthocyanins | |
| CM Stage | 3.75 | 70.12 | Gallic Acid/Phenolic Compound |
| 6.10 | 12.45 | Hydroxycinnamic Acid | |
| 7.25 | 8.34 | Ferulic Acid | |
| 8.10 | 9.09 | Simple Flavonoids | |
| OM Stage | 3.973 | 60.92 | Gallic Acid/Simple Phenolics |
| 4.530 | 10.18 | Caffeic Acid | |
| 5.063 | 6.72 | Condensed Tannins | |
| 6.823 | 19.30 | Flavonoids (Quercetin, Rutin) | |
| 6.980 | 2.88 | Anthocyanins |
| Ripeness Stage | Total Polyphenol Content (mg GAE/g FW) | DPPH (Inhibition%) | ABTS (Inhibition%) | FRAP (µmolTECA/g) |
|---|---|---|---|---|
| CM | 6.8 ± 0.3 | 46.4 ± 1.8 | 67.89 ± 1.78 | 511.20 ±1.34 |
| OM | 8.3 ± 0.6 | 61.9 ± 1.7 * | 82.45 ± 1.52 * | 803.40 ±1.41 * |
| Ripeness Stage | Flavonoid Content (mg QE/g FW) |
|---|---|
| CM | 26.5 ± 1.41 * |
| OM | 16.7 ± 0.67 |
| Ripeness Stage | Wavelength (nm) | Absorbance (A.U.) | Total Anthocyanins (mg/100 g DW) |
|---|---|---|---|
| CM | 535 | 0.186 | 346 ± 0.35346 |
| OM | 535 | 0.307 | 571 ± 0.41 * |
| Metal Element | CM (mg/kg) | OM (mg/kg) |
|---|---|---|
| Calcium (Ca) | 120.5 ± 3.2 | 110.3 ± 2.9 |
| Sodium (Na) | 136.5 ± 0.2 | 138.3 ± 0.9 |
| Potassium (K) | 180.3 ± 4.1 | 190.7 ± 4.3 |
| Magnesium (Mg) | 30.8 ± 1.7 | 28.4 ± 1.6 |
| Iron (Fe) | 4.6 ± 0.3 | 5.0 ± 0.4 |
| Zinc (Zn) | 2.1 ± 0.2 | 2.3 ± 0.2 |
| Manganese (Mn) | 1.5 ± 0.1 | 1.6 ± 0.1 |
| Copper (Cu) | 0.9 ± 0.1 | 1.0 ± 0.1 |
| Lead (Pb) | 0.05 ± 0.01 | 0.04 ± 0.01 |
| Cadmium (Cd) | 0.02 ± 0.005 | 0.018 ± 0.004 |
Disclaimer/Publisher’s Note: The statements, opinions and data contained in all publications are solely those of the individual author(s) and contributor(s) and not of MDPI and/or the editor(s). MDPI and/or the editor(s) disclaim responsibility for any injury to people or property resulting from any ideas, methods, instructions or products referred to in the content. |
© 2025 by the authors. Licensee MDPI, Basel, Switzerland. This article is an open access article distributed under the terms and conditions of the Creative Commons Attribution (CC BY) license (https://creativecommons.org/licenses/by/4.0/).
Share and Cite
Carrera-Cevallos, J.; Muso, C.; Chacón Torres, J.C.; Salazar, D.; Pérez, L.; Landázuri, A.C.; León, M.; López, M.; Jara, O.; Coronel, M.; et al. Morphometric, Nutritional, and Phytochemical Characterization of Eugenia (Syzygium paniculatum Gaertn): A Berry with Under-Discovered Potential. Foods 2025, 14, 2633. https://doi.org/10.3390/foods14152633
Carrera-Cevallos J, Muso C, Chacón Torres JC, Salazar D, Pérez L, Landázuri AC, León M, López M, Jara O, Coronel M, et al. Morphometric, Nutritional, and Phytochemical Characterization of Eugenia (Syzygium paniculatum Gaertn): A Berry with Under-Discovered Potential. Foods. 2025; 14(15):2633. https://doi.org/10.3390/foods14152633
Chicago/Turabian StyleCarrera-Cevallos, Jeanette, Christian Muso, Julio C. Chacón Torres, Diego Salazar, Lander Pérez, Andrea C. Landázuri, Marco León, María López, Oscar Jara, Manuel Coronel, and et al. 2025. "Morphometric, Nutritional, and Phytochemical Characterization of Eugenia (Syzygium paniculatum Gaertn): A Berry with Under-Discovered Potential" Foods 14, no. 15: 2633. https://doi.org/10.3390/foods14152633
APA StyleCarrera-Cevallos, J., Muso, C., Chacón Torres, J. C., Salazar, D., Pérez, L., Landázuri, A. C., León, M., López, M., Jara, O., Coronel, M., Carrera, D., & Acurio, L. (2025). Morphometric, Nutritional, and Phytochemical Characterization of Eugenia (Syzygium paniculatum Gaertn): A Berry with Under-Discovered Potential. Foods, 14(15), 2633. https://doi.org/10.3390/foods14152633