
Protective Effects of Zein/Ferulic Acid (FA)–Pectin (PEC)/Chitosan (CS) Nanocomplexes on DSS-Induced Ulcerative Colitis in Mice

Abstract
1. Introduction
2. Materials and Methods
2.1. Materials
2.2. Preparation of Nanocomplexes
2.3. Particle Size and ζ-Potential Measurements
2.4. EE and LC
2.5. Scanning Electron Microscopy (SEM)
2.6. Fourier Transform Infrared Spectroscopy (FTIR)
2.7. Circular Dichroism Spectroscopy (CD)
2.8. Differential Scanning Calorimetry (DSC)
2.9. Storage Particle Size Stability
2.10. In Vitro Release of Zein/FA-PEC/CS Nanocomplexes
2.11. Animal Treatments and Experiments
2.11.1. Mice Treatment and Drug Administration
2.11.2. Clinical Observations and Organometric Indices
2.11.3. Histopathological Examination
2.11.4. Determination of Biochemical Indices In Serum and Colonic Tissues
2.11.5. Gut Microbial Analysis
2.12. Statistical Analysis
3. Results and Discussion
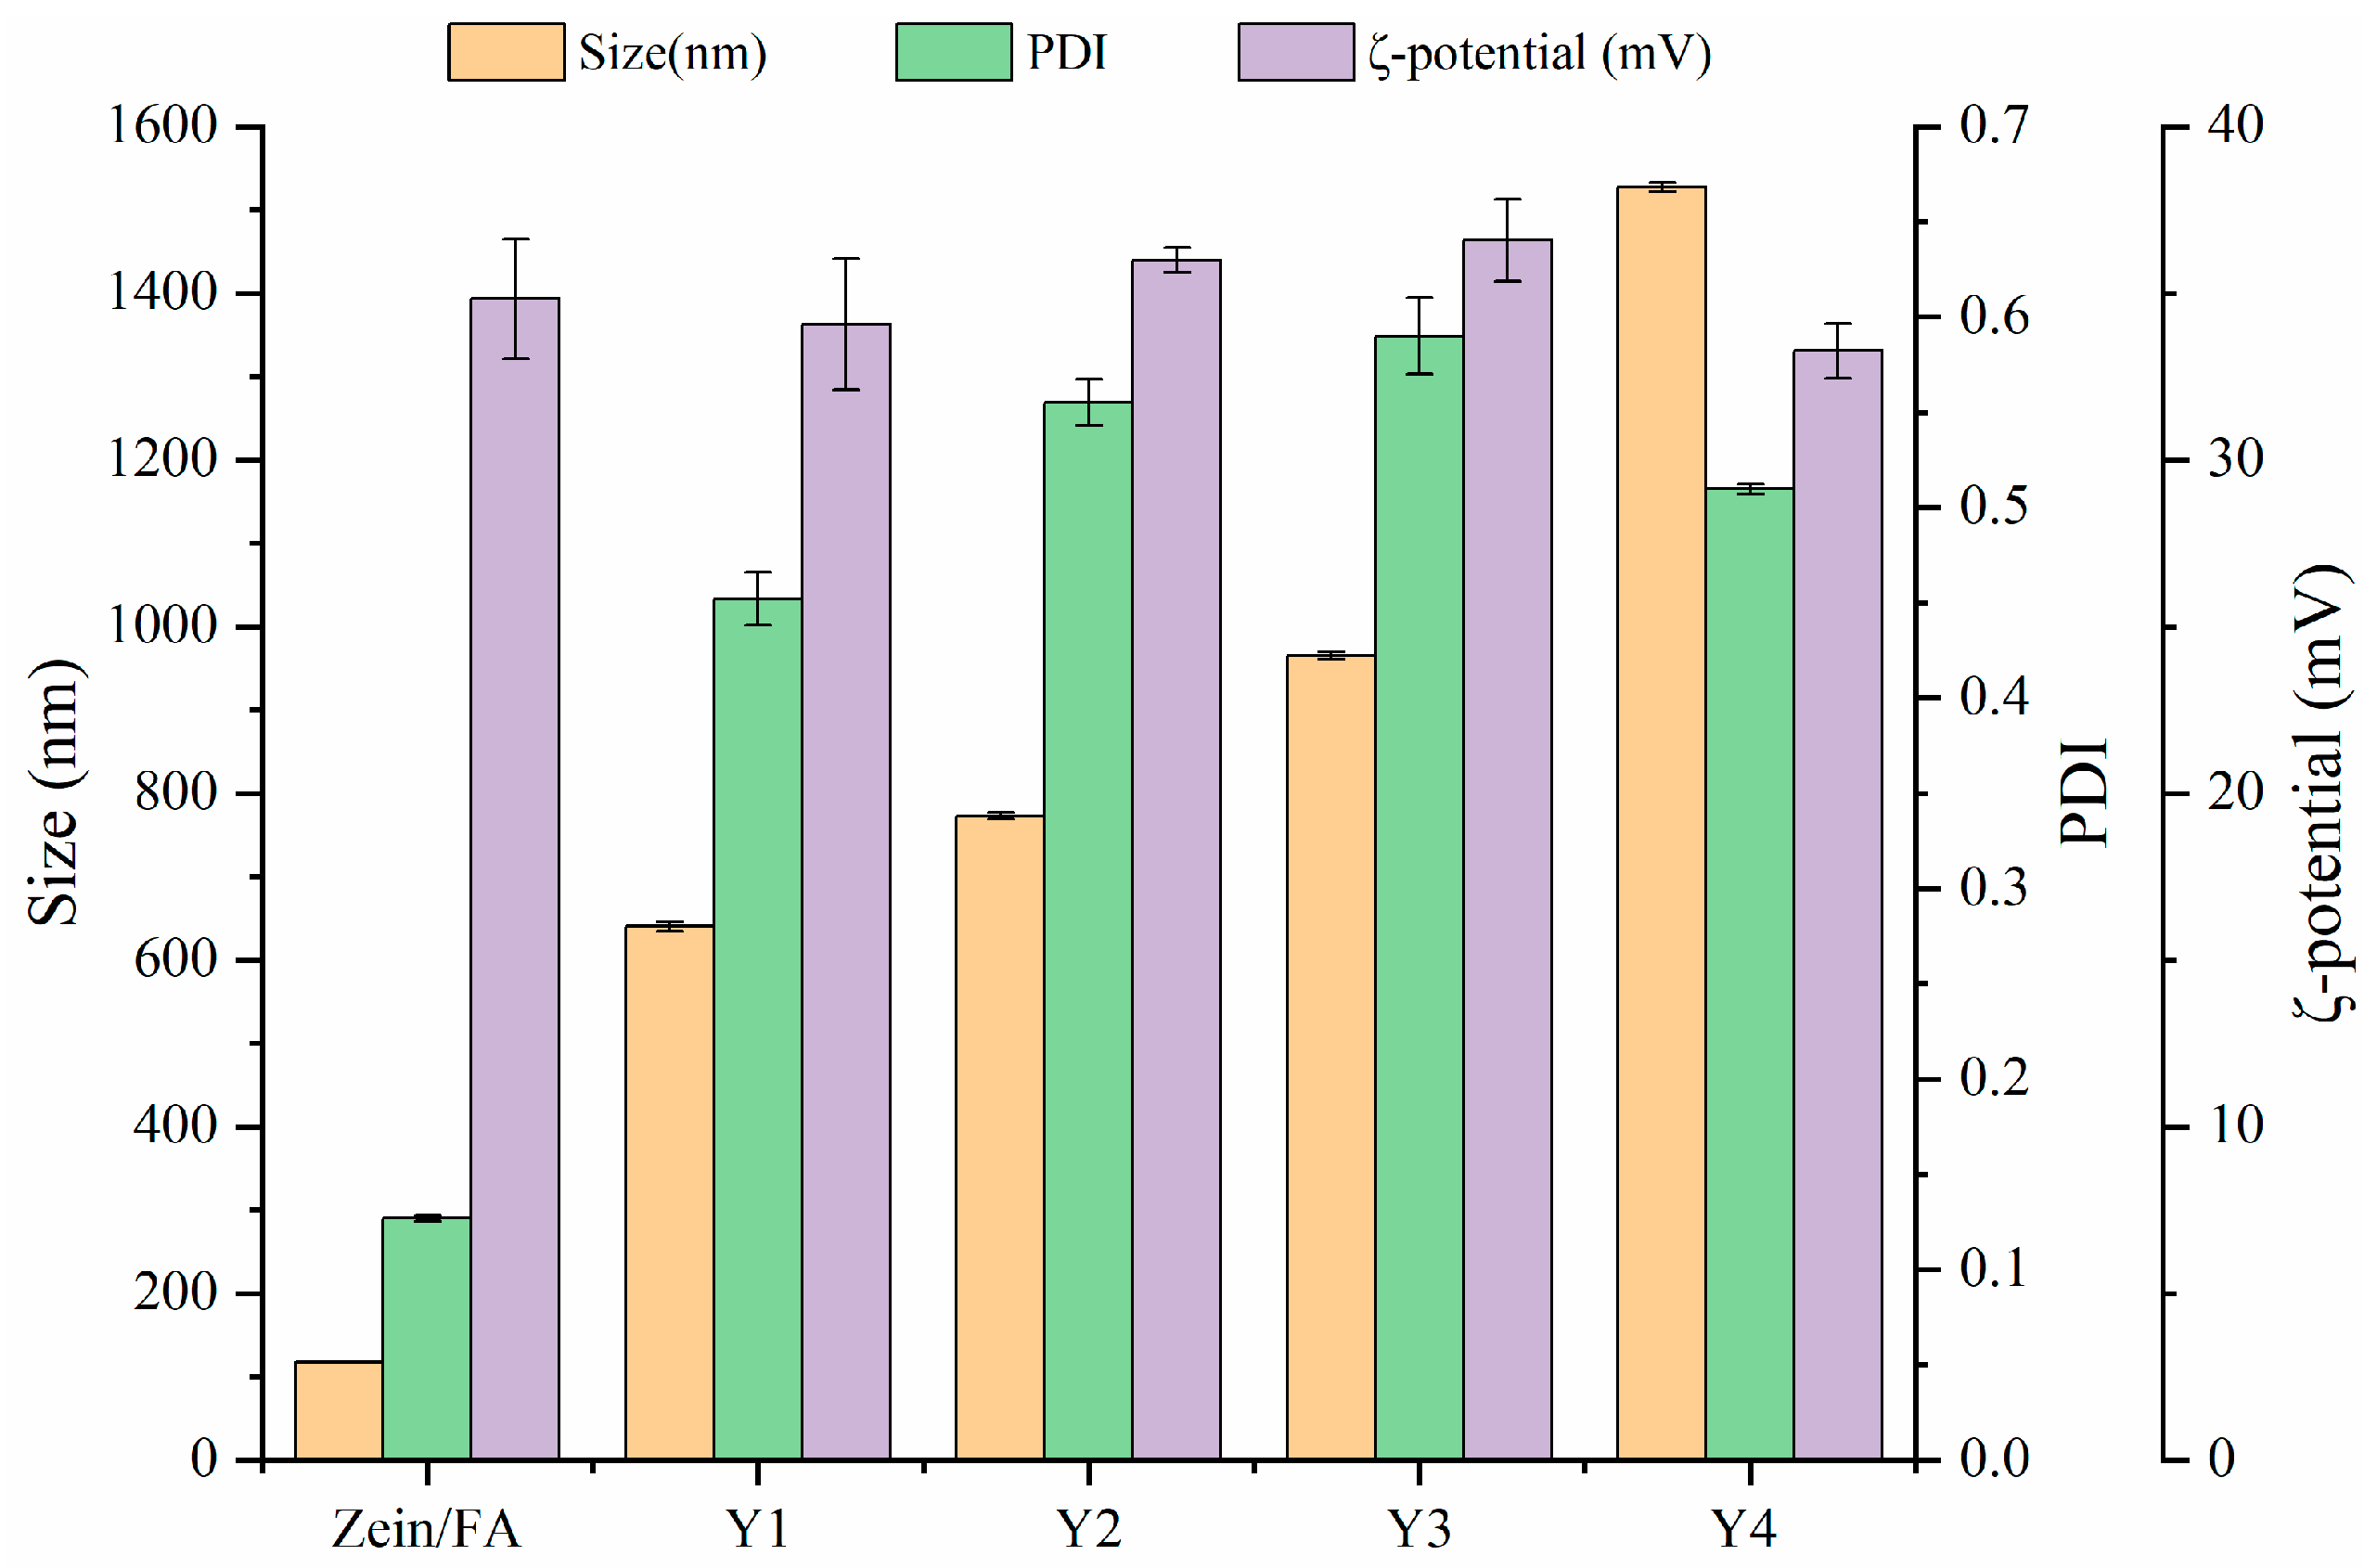
3.1. Particle Size and ζ-Potential
3.2. EE and LC
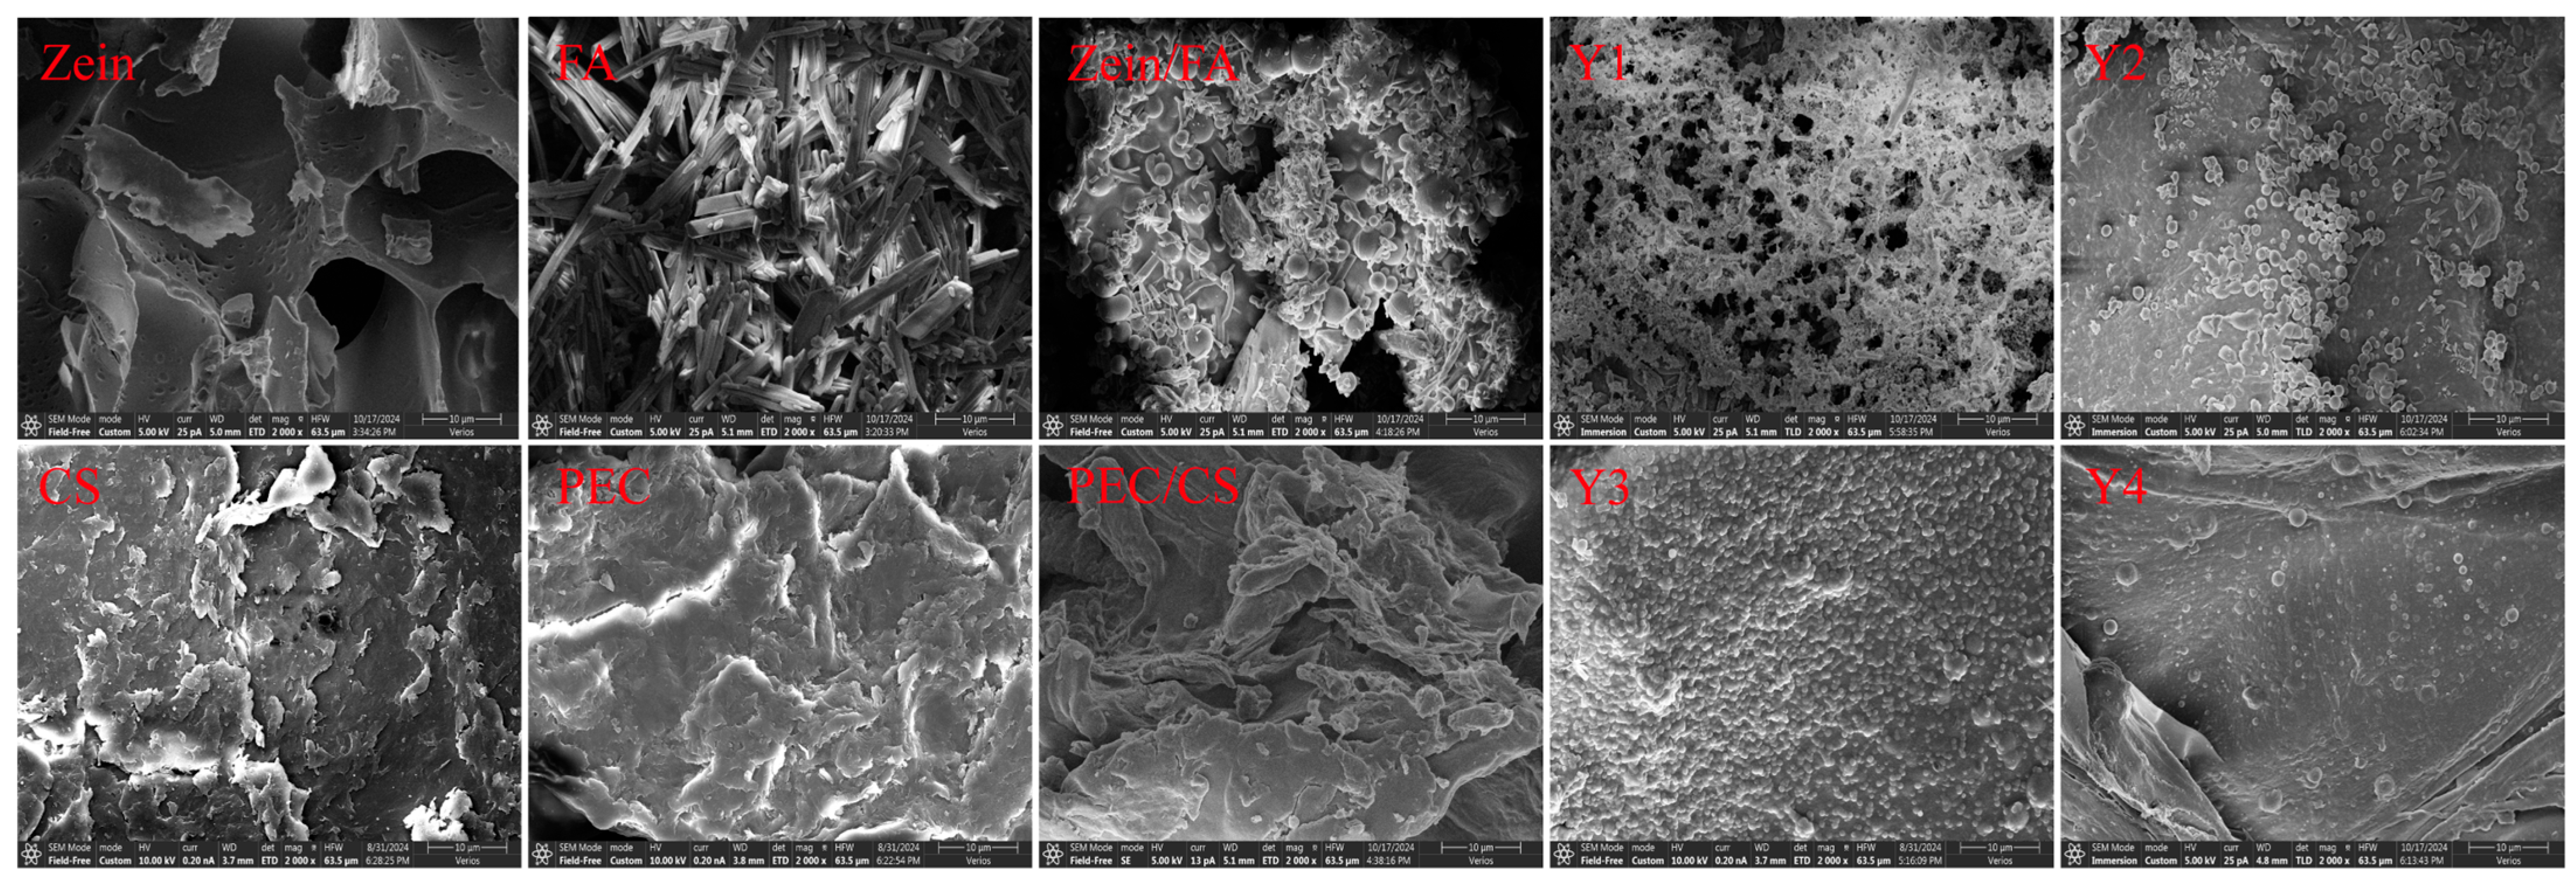
3.3. Micromorphology of Complex Nanoparticles
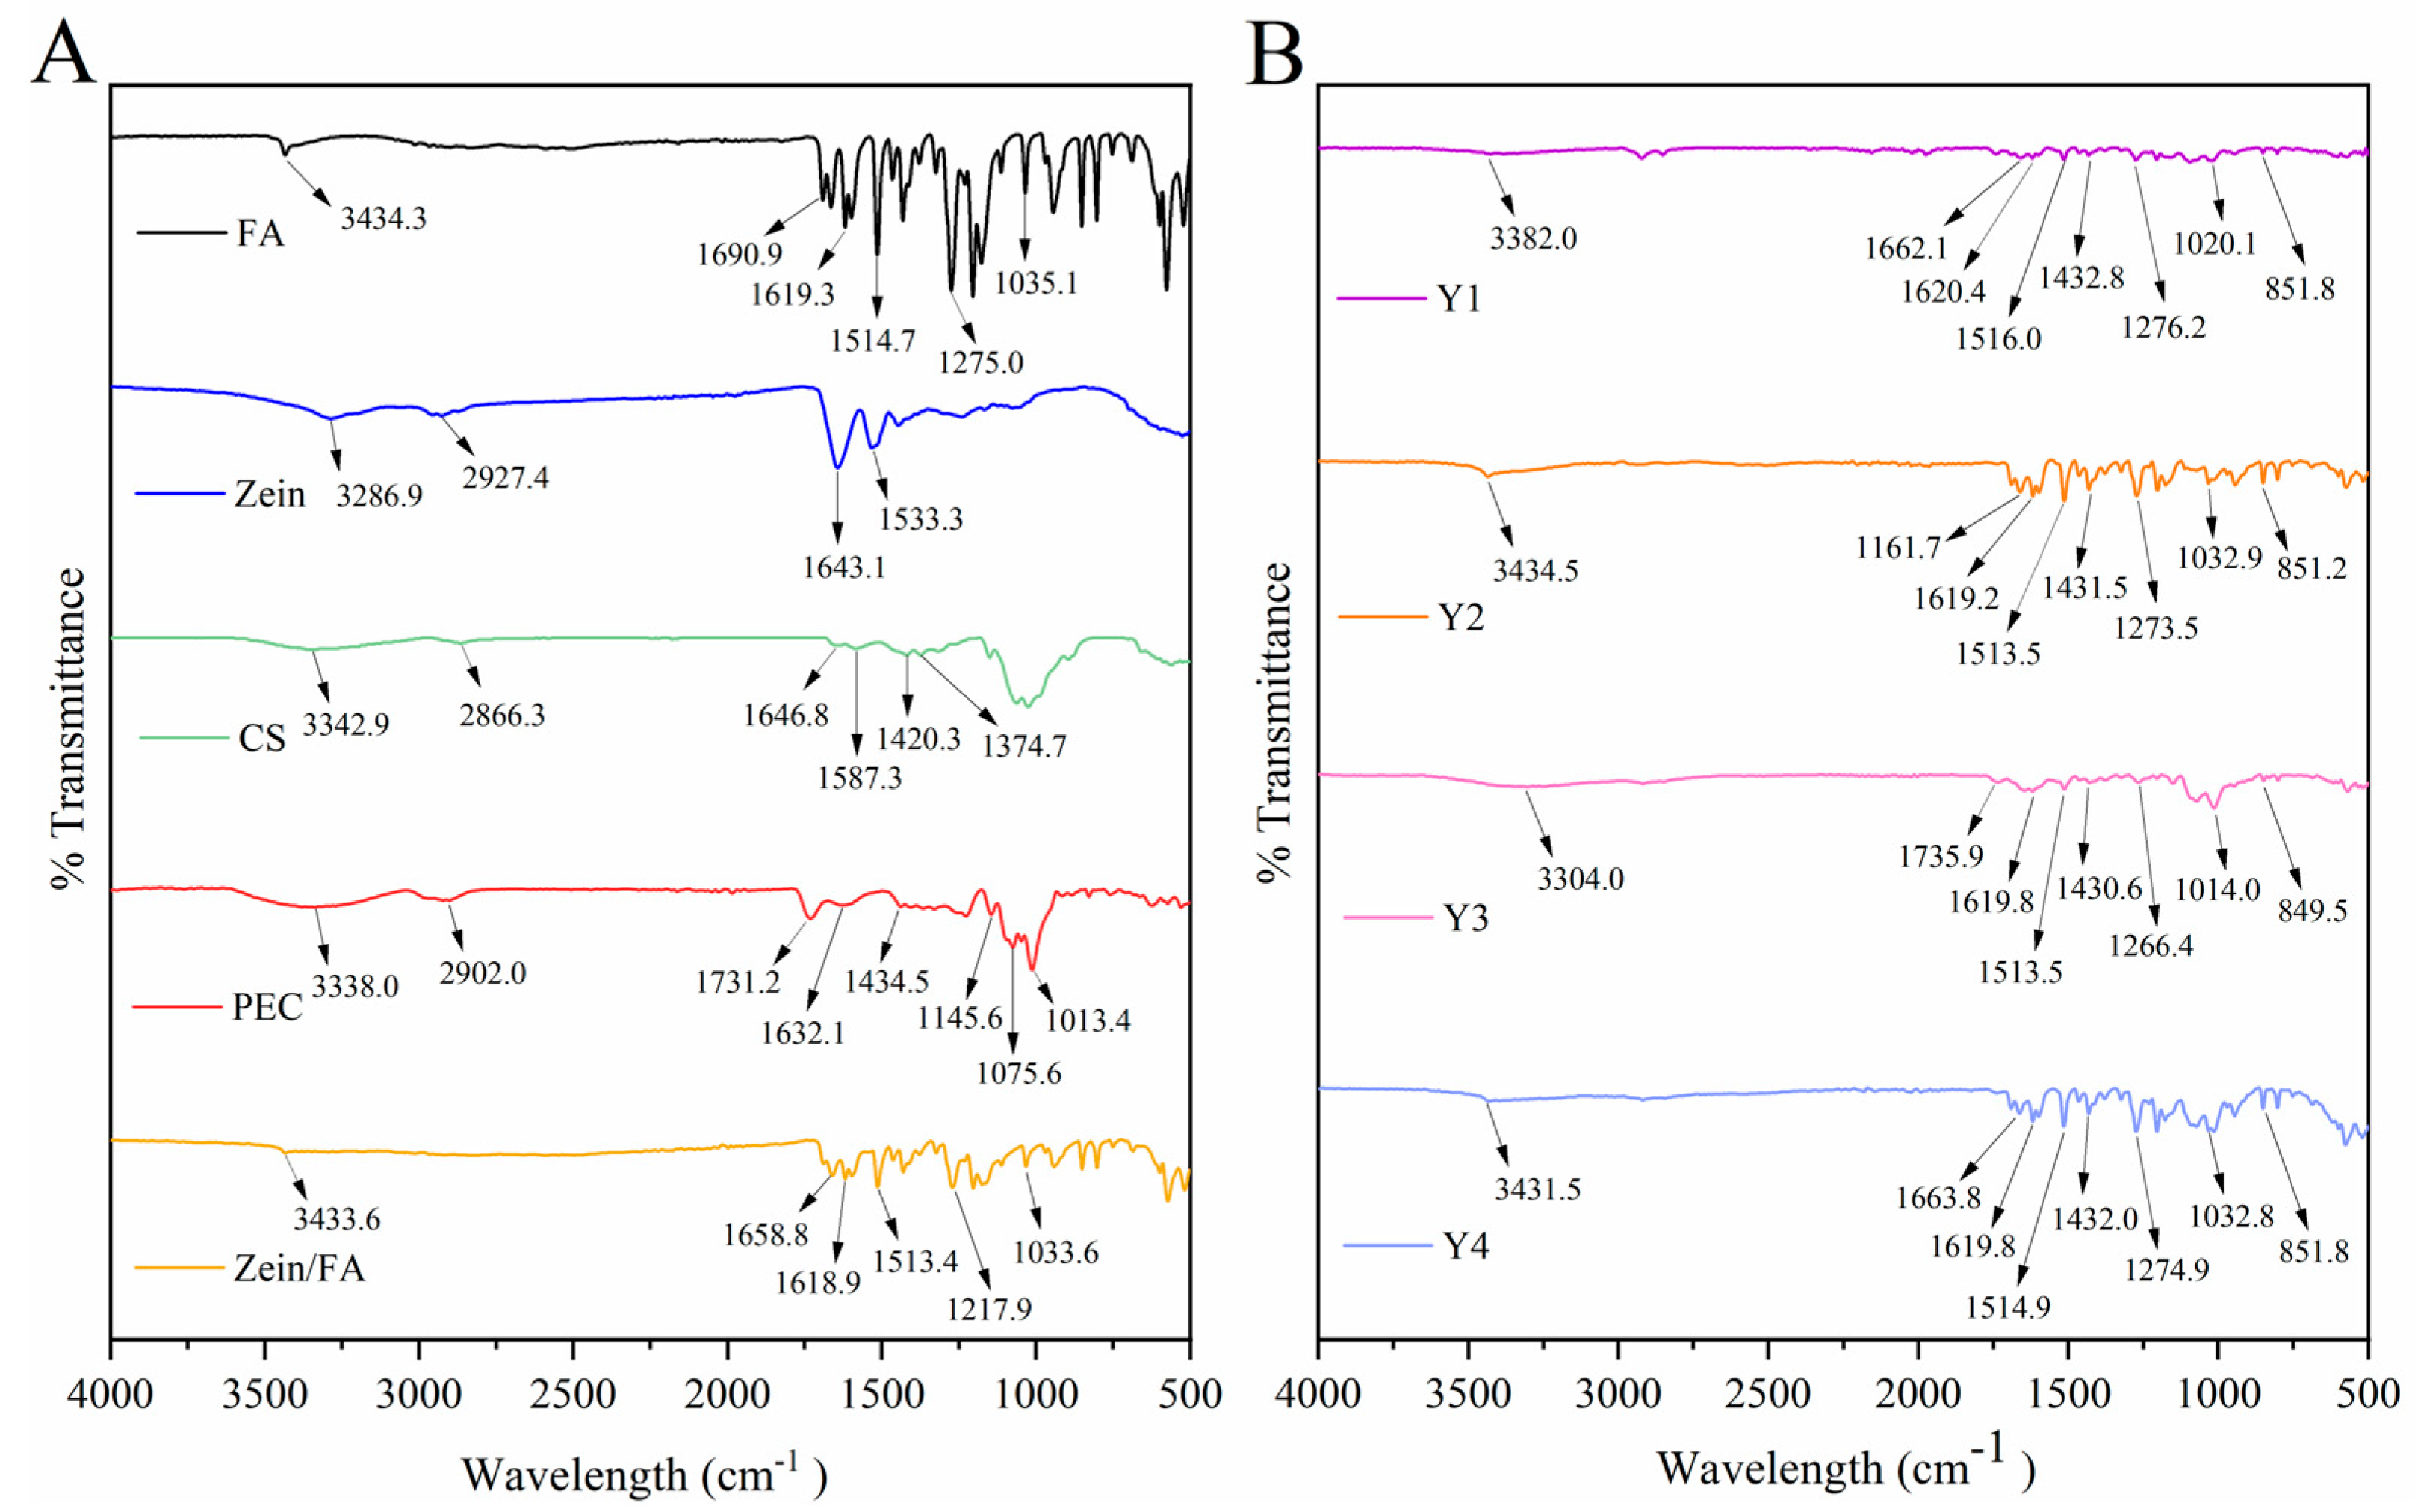
3.4. FTIR Analysis
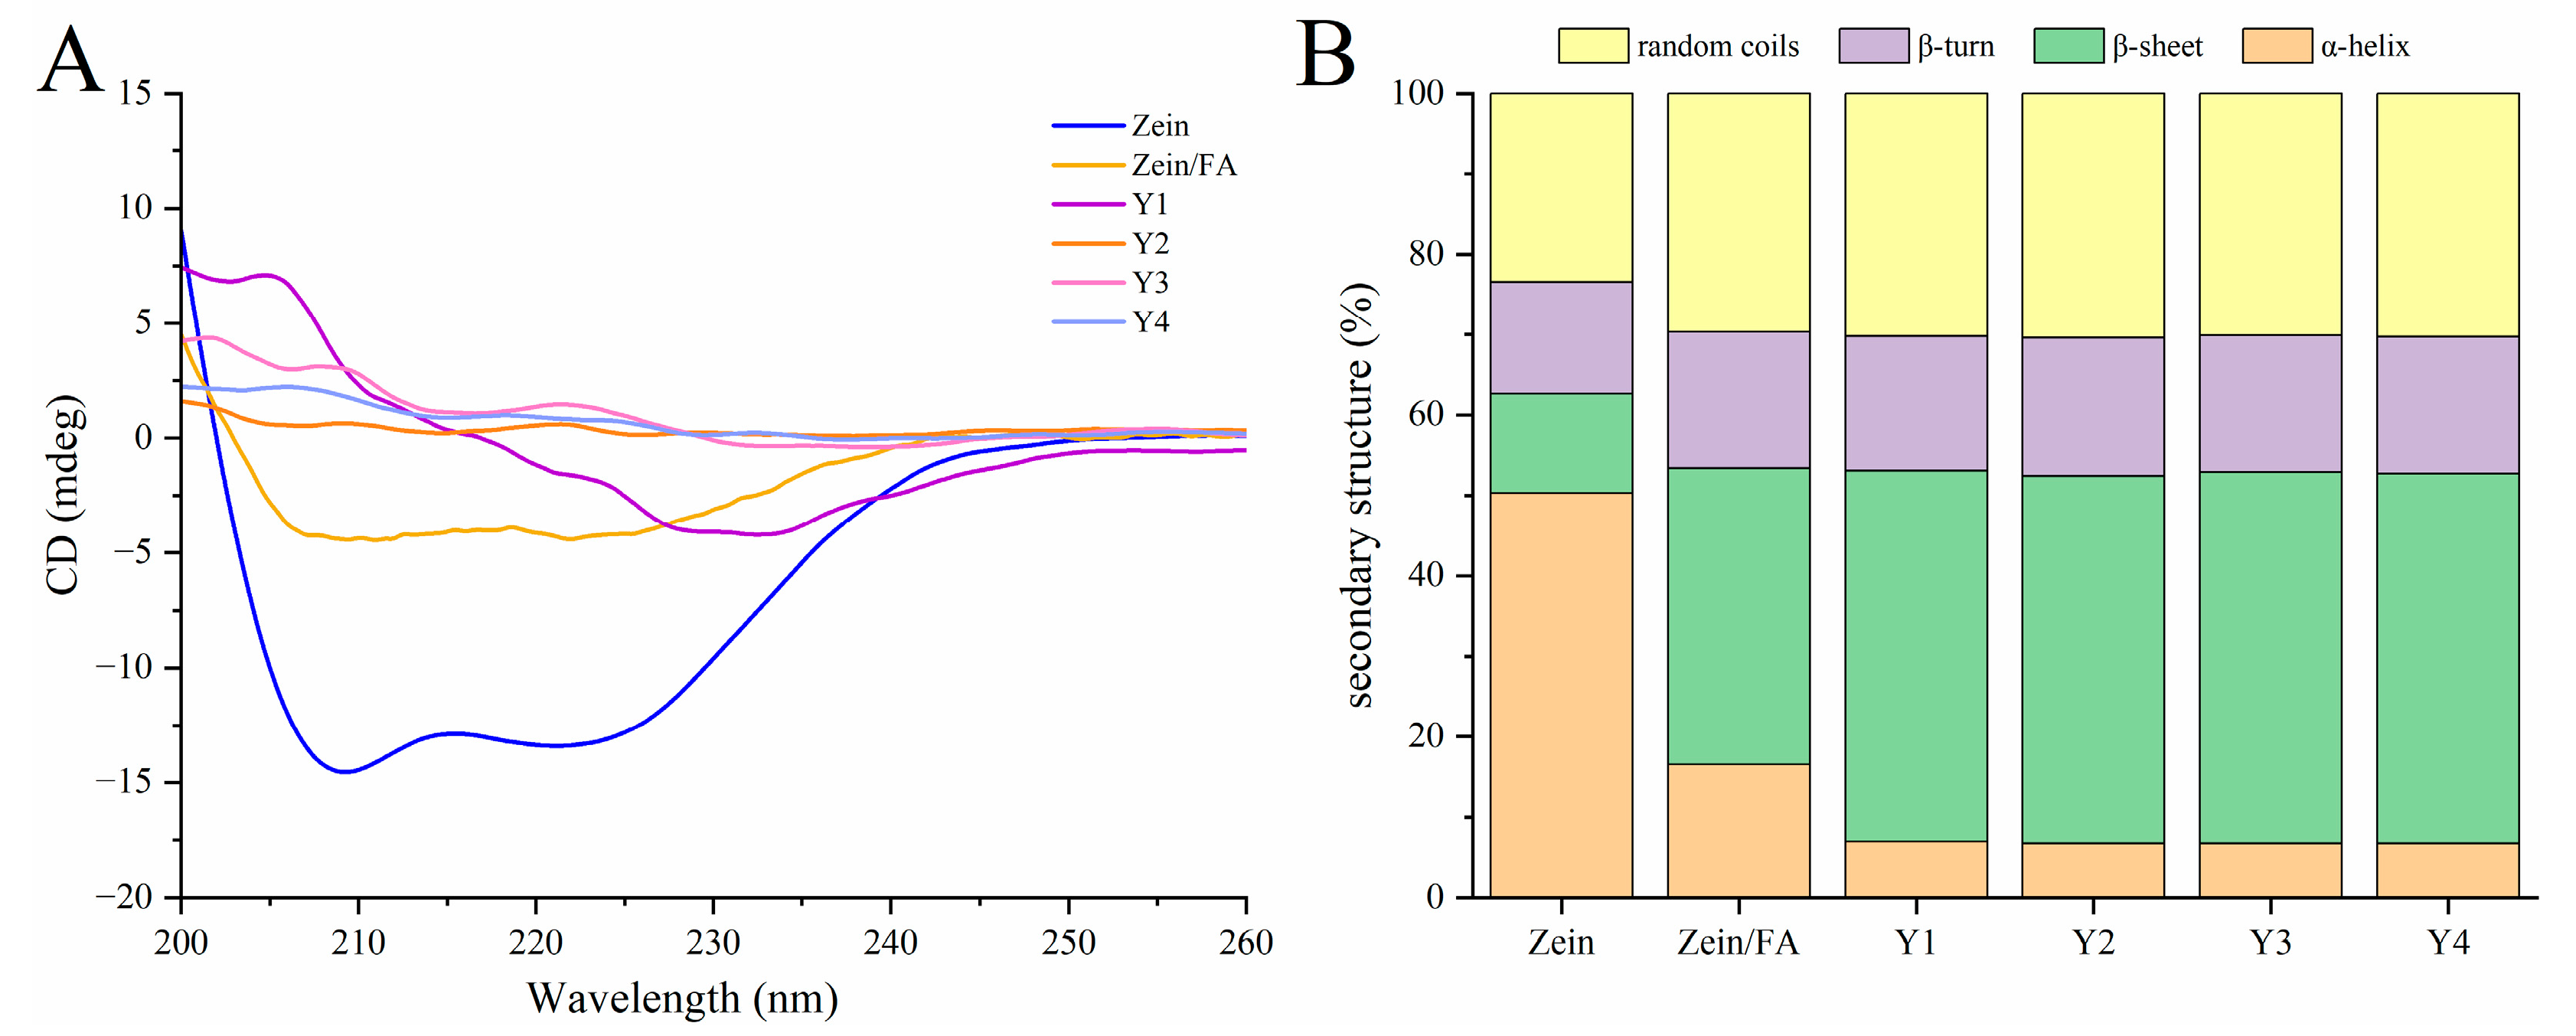
3.5. CD Analysis
3.6. DSC Analysis
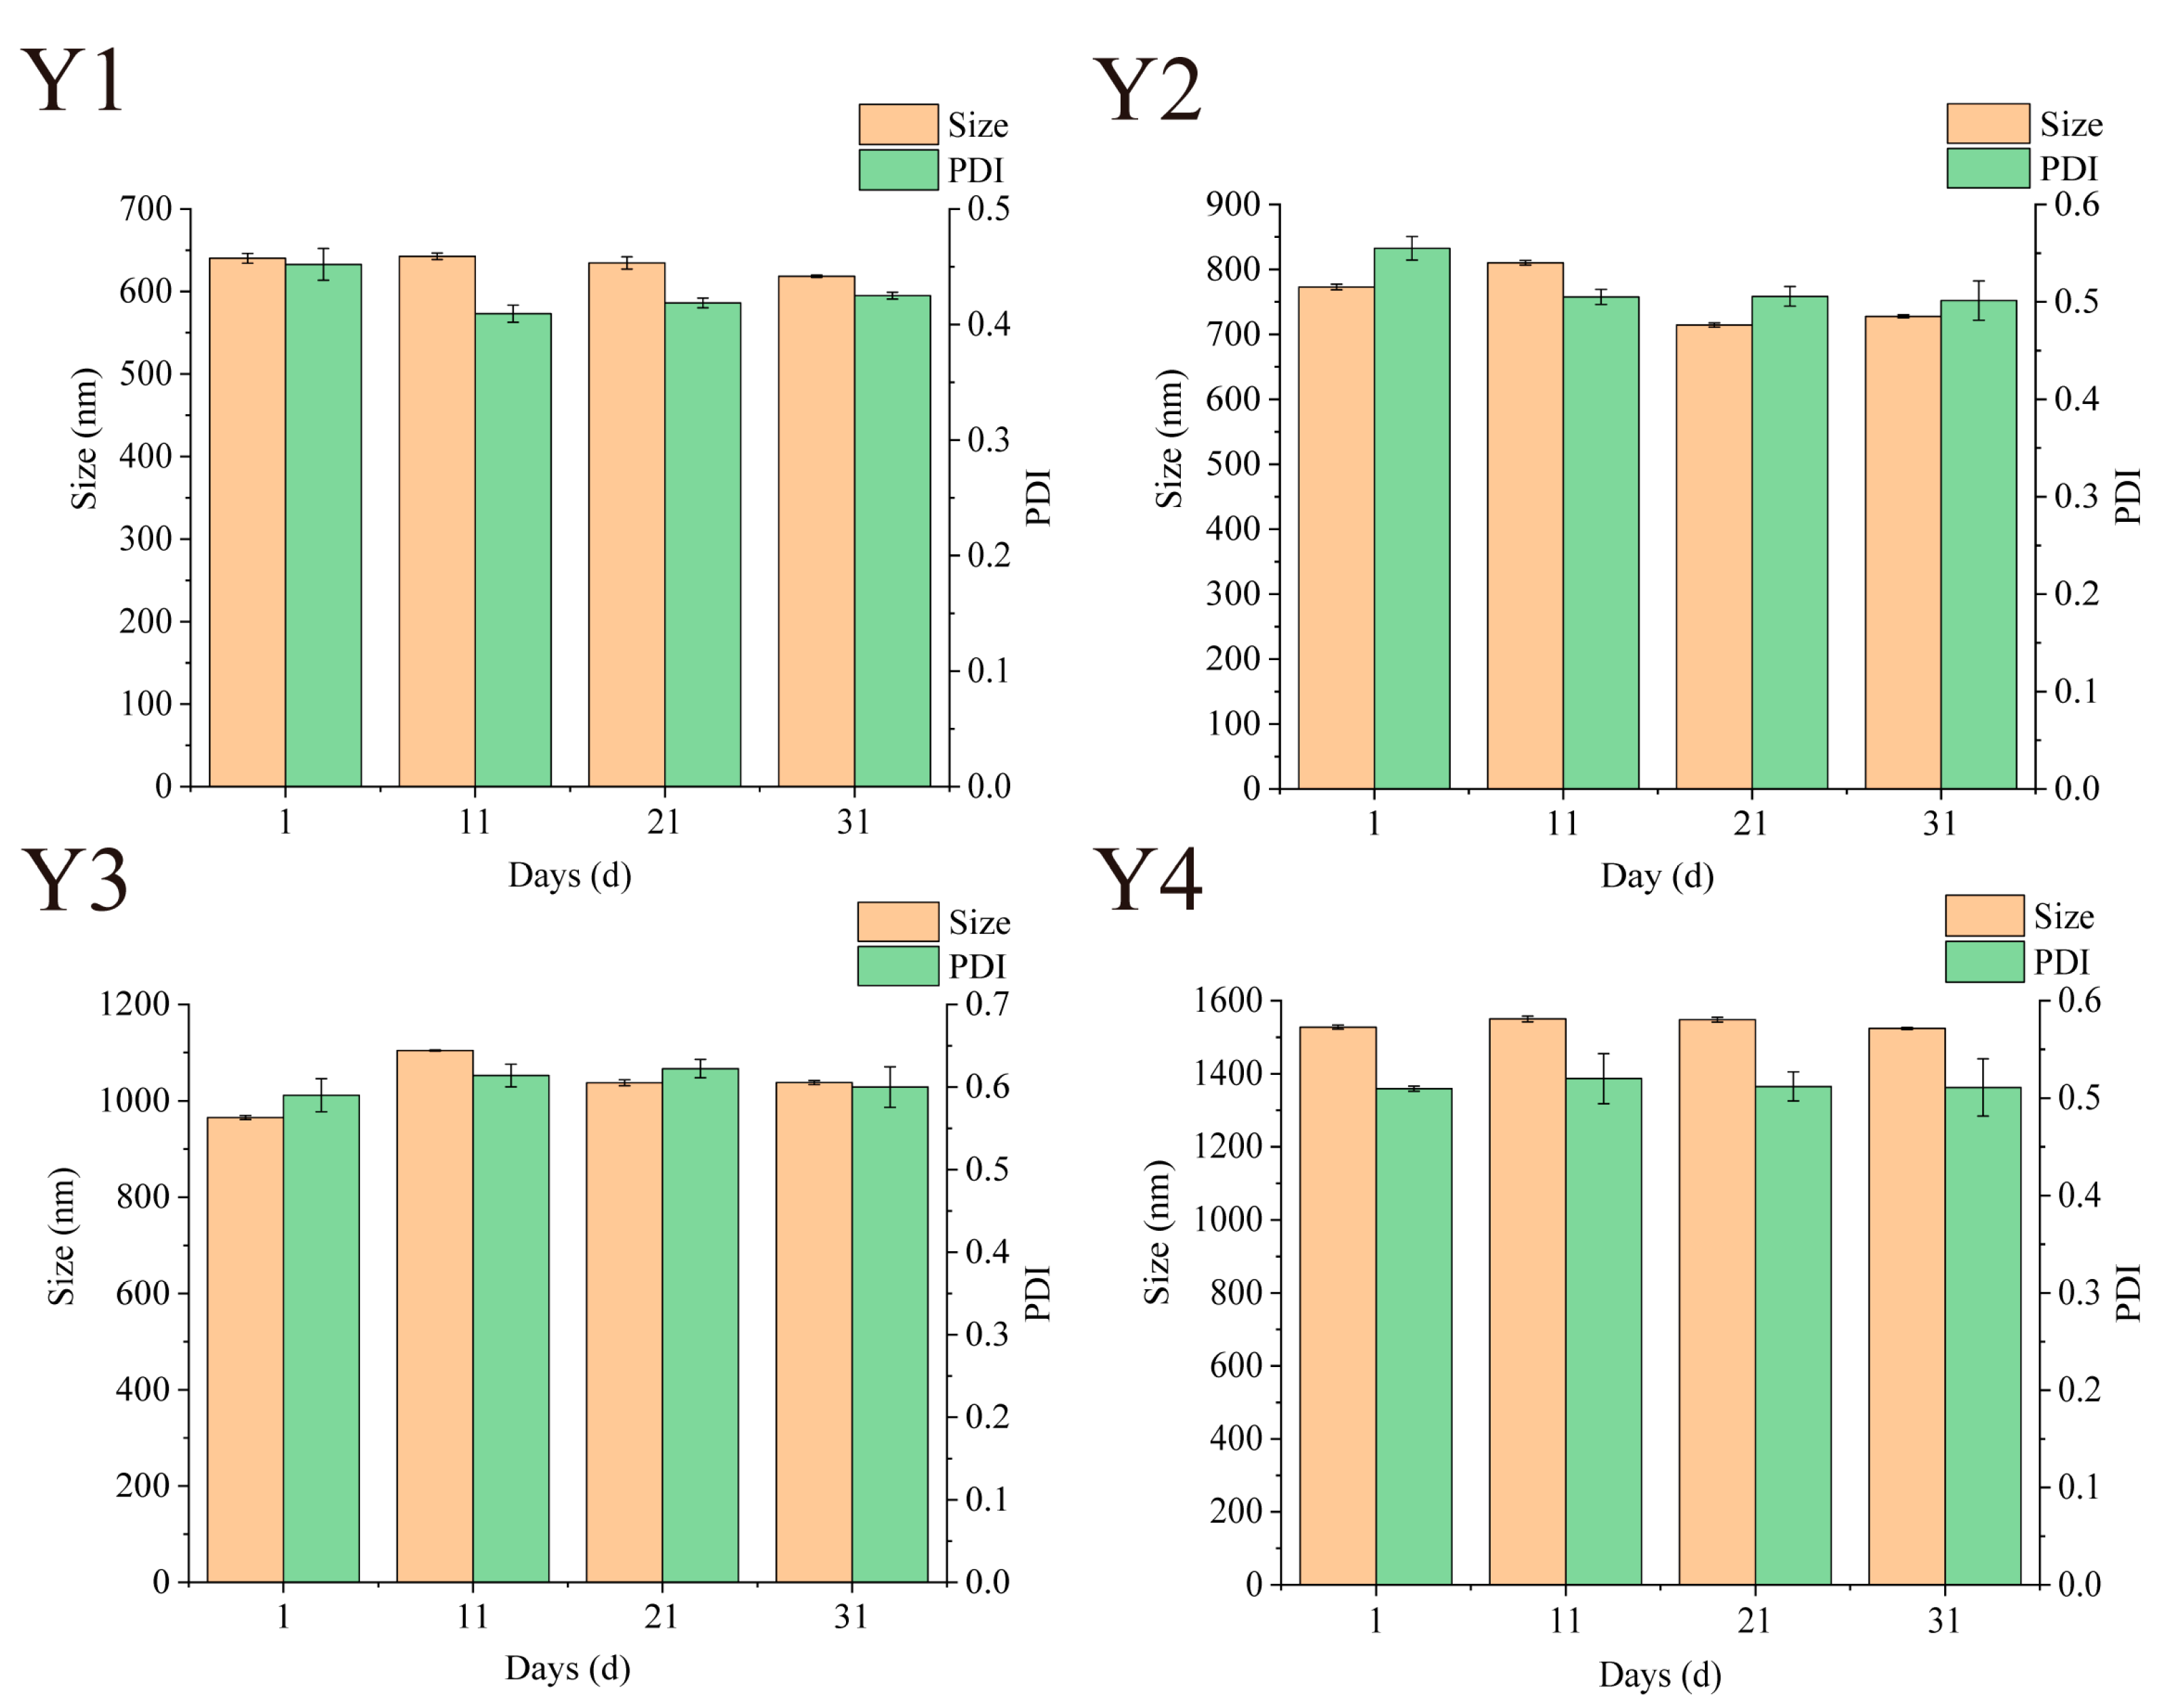
3.7. Storage Particle Size Stability
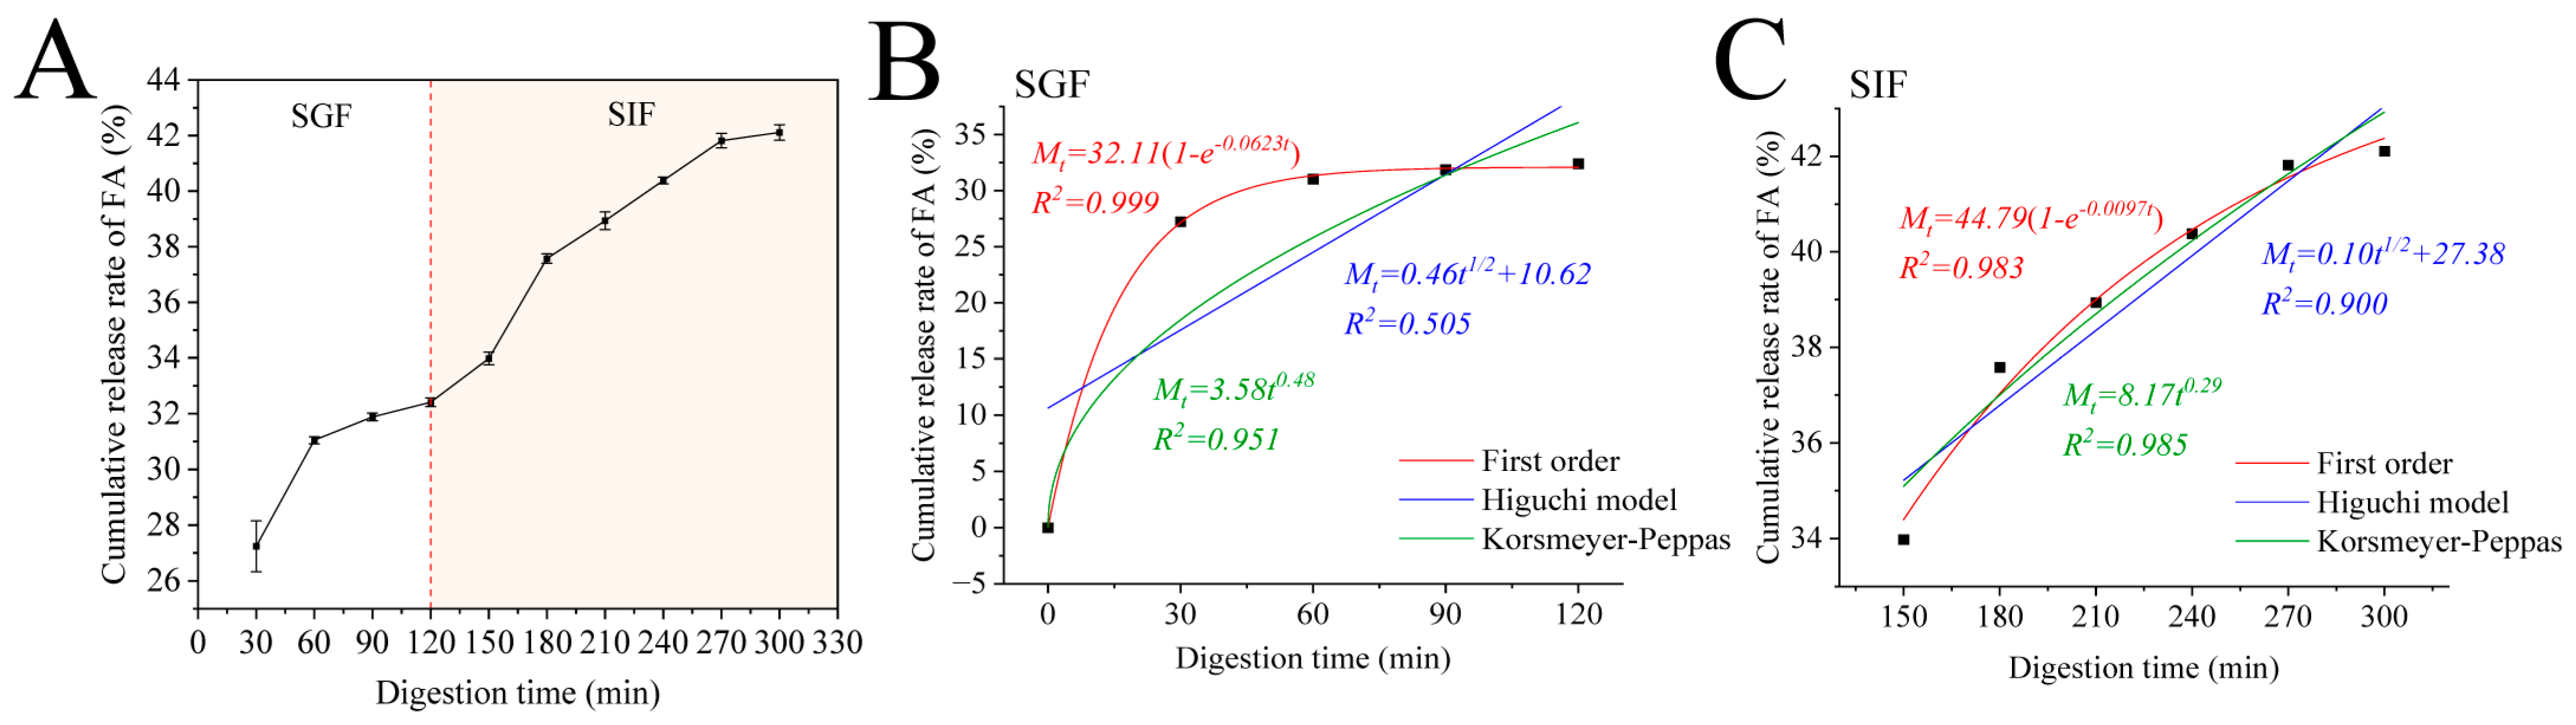
3.8. Release Kinetics
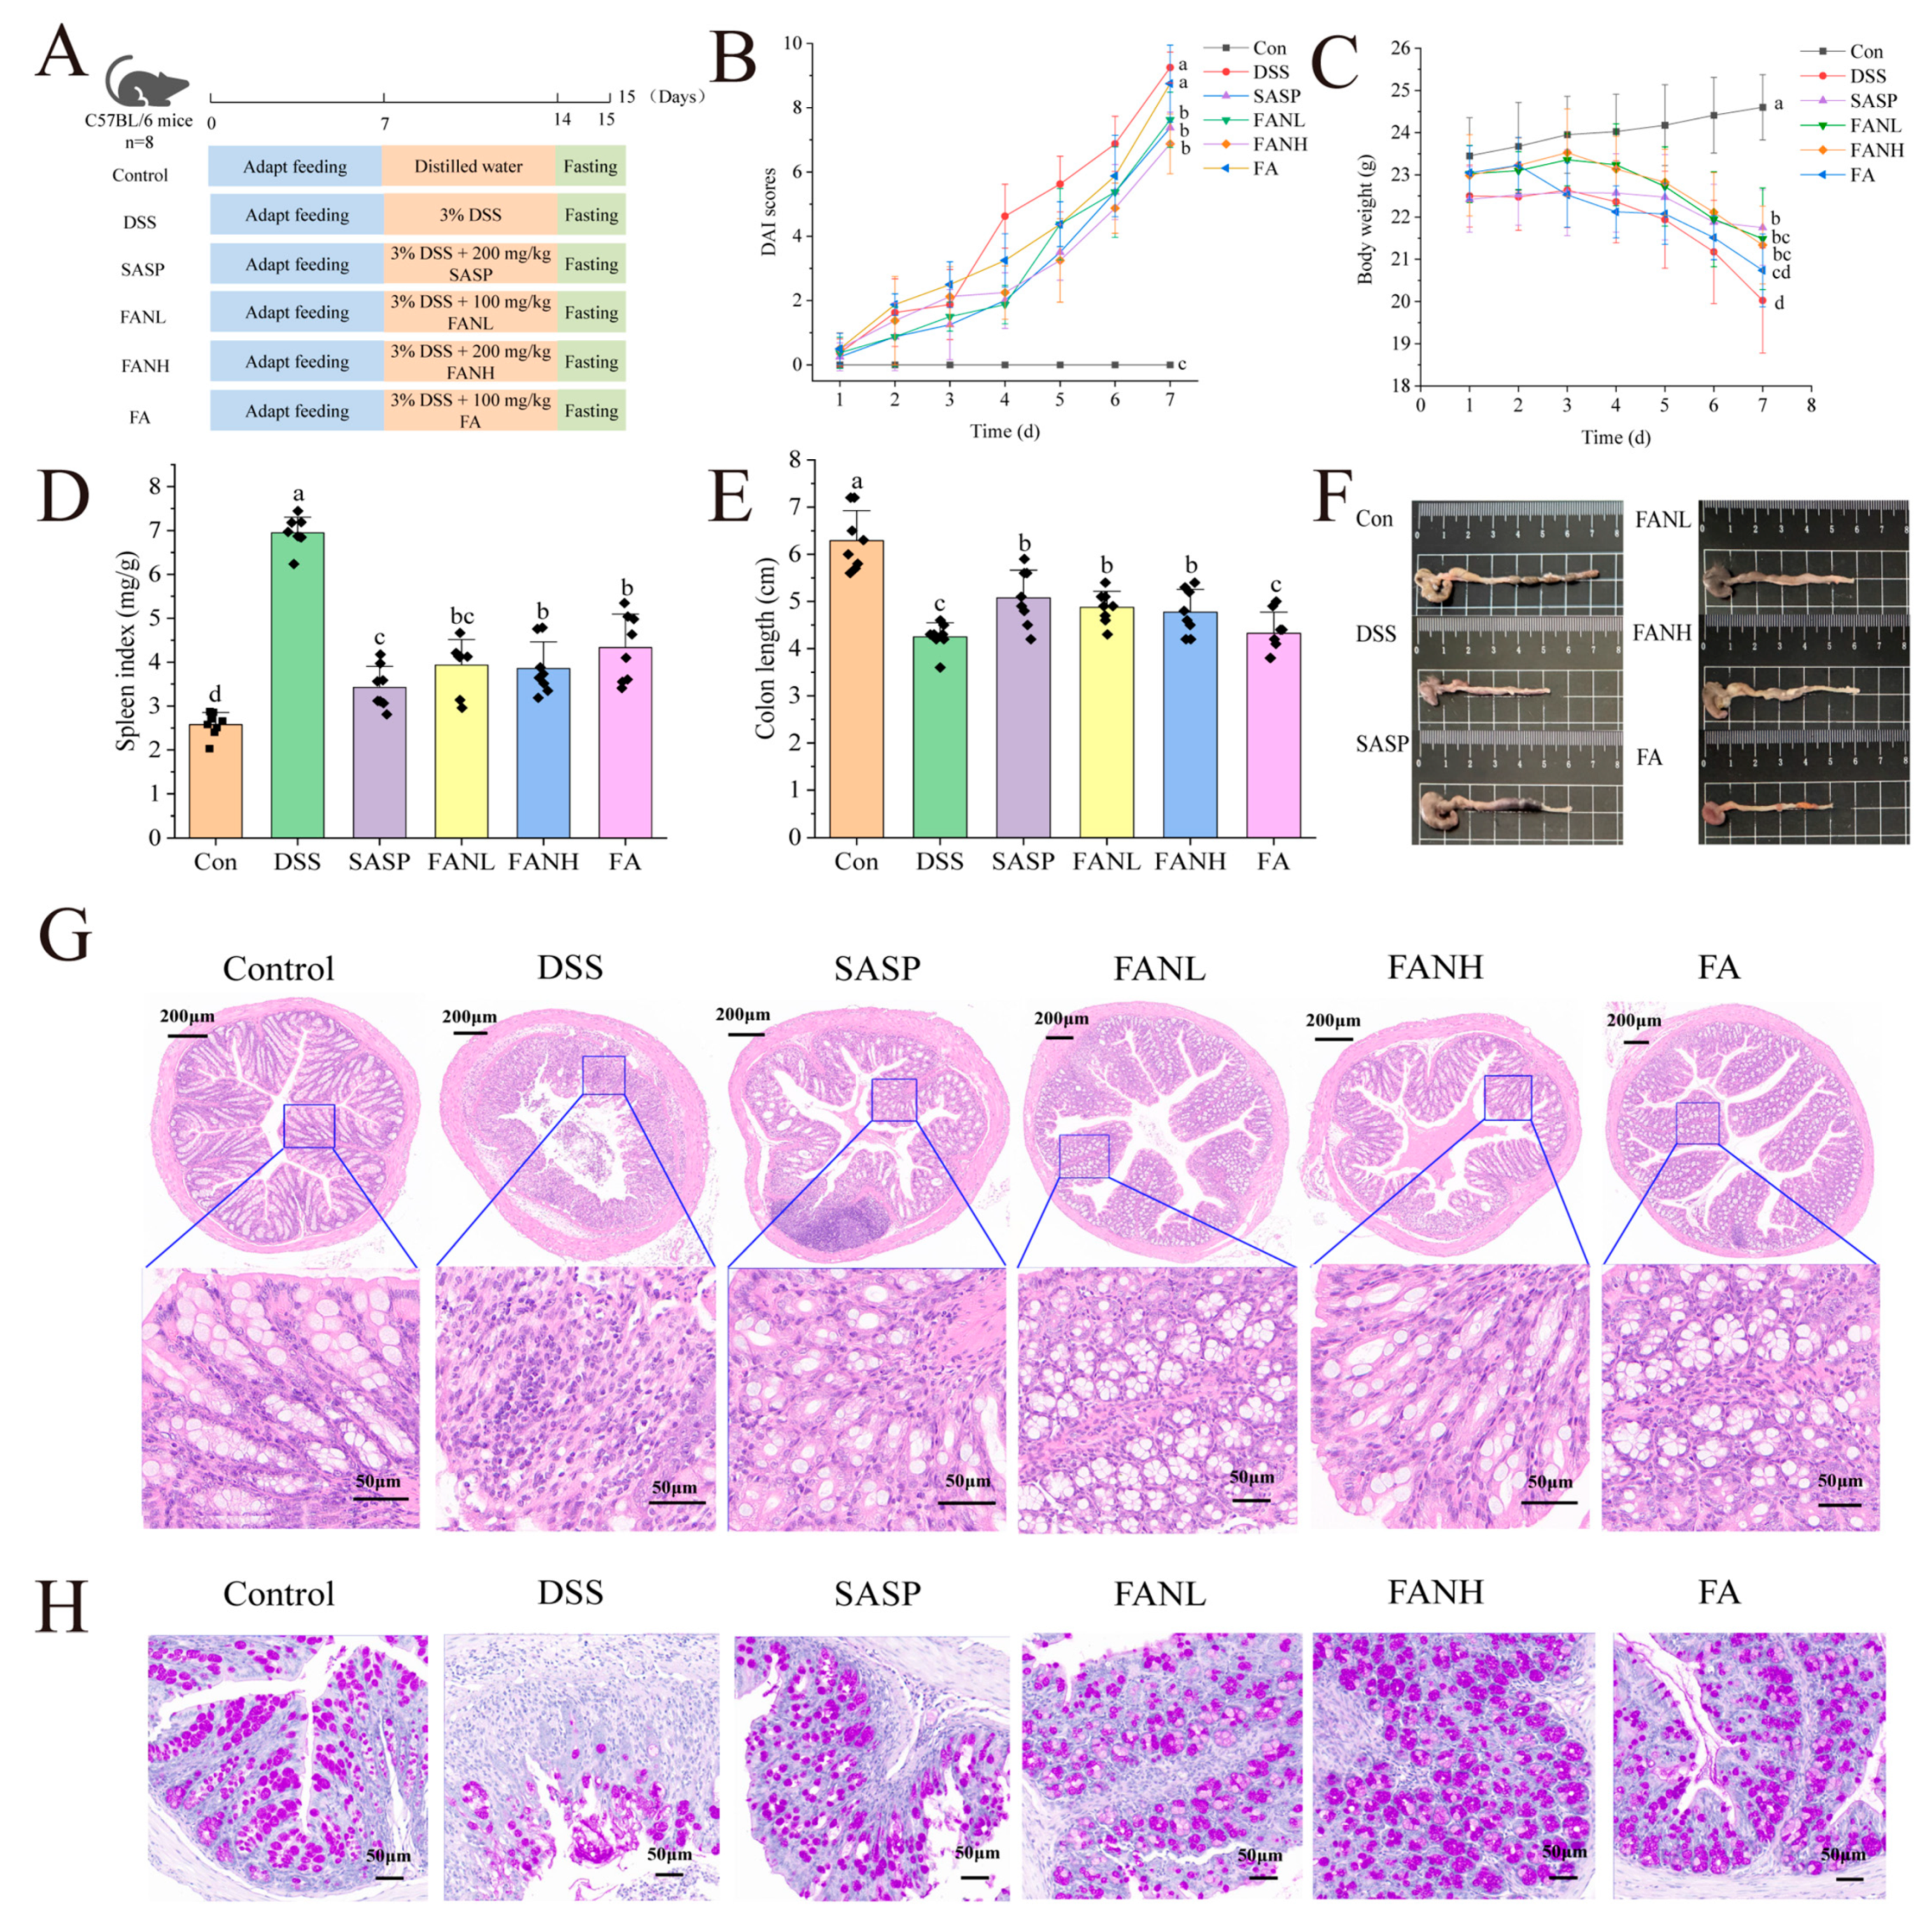
3.9. Zein/FA–PEC/CS Alleviated the Symptoms of UC Induced by DSS in Mice
3.10. Zein/FA–PEC/CS Improved the Histological Changes of the Colon Tissue
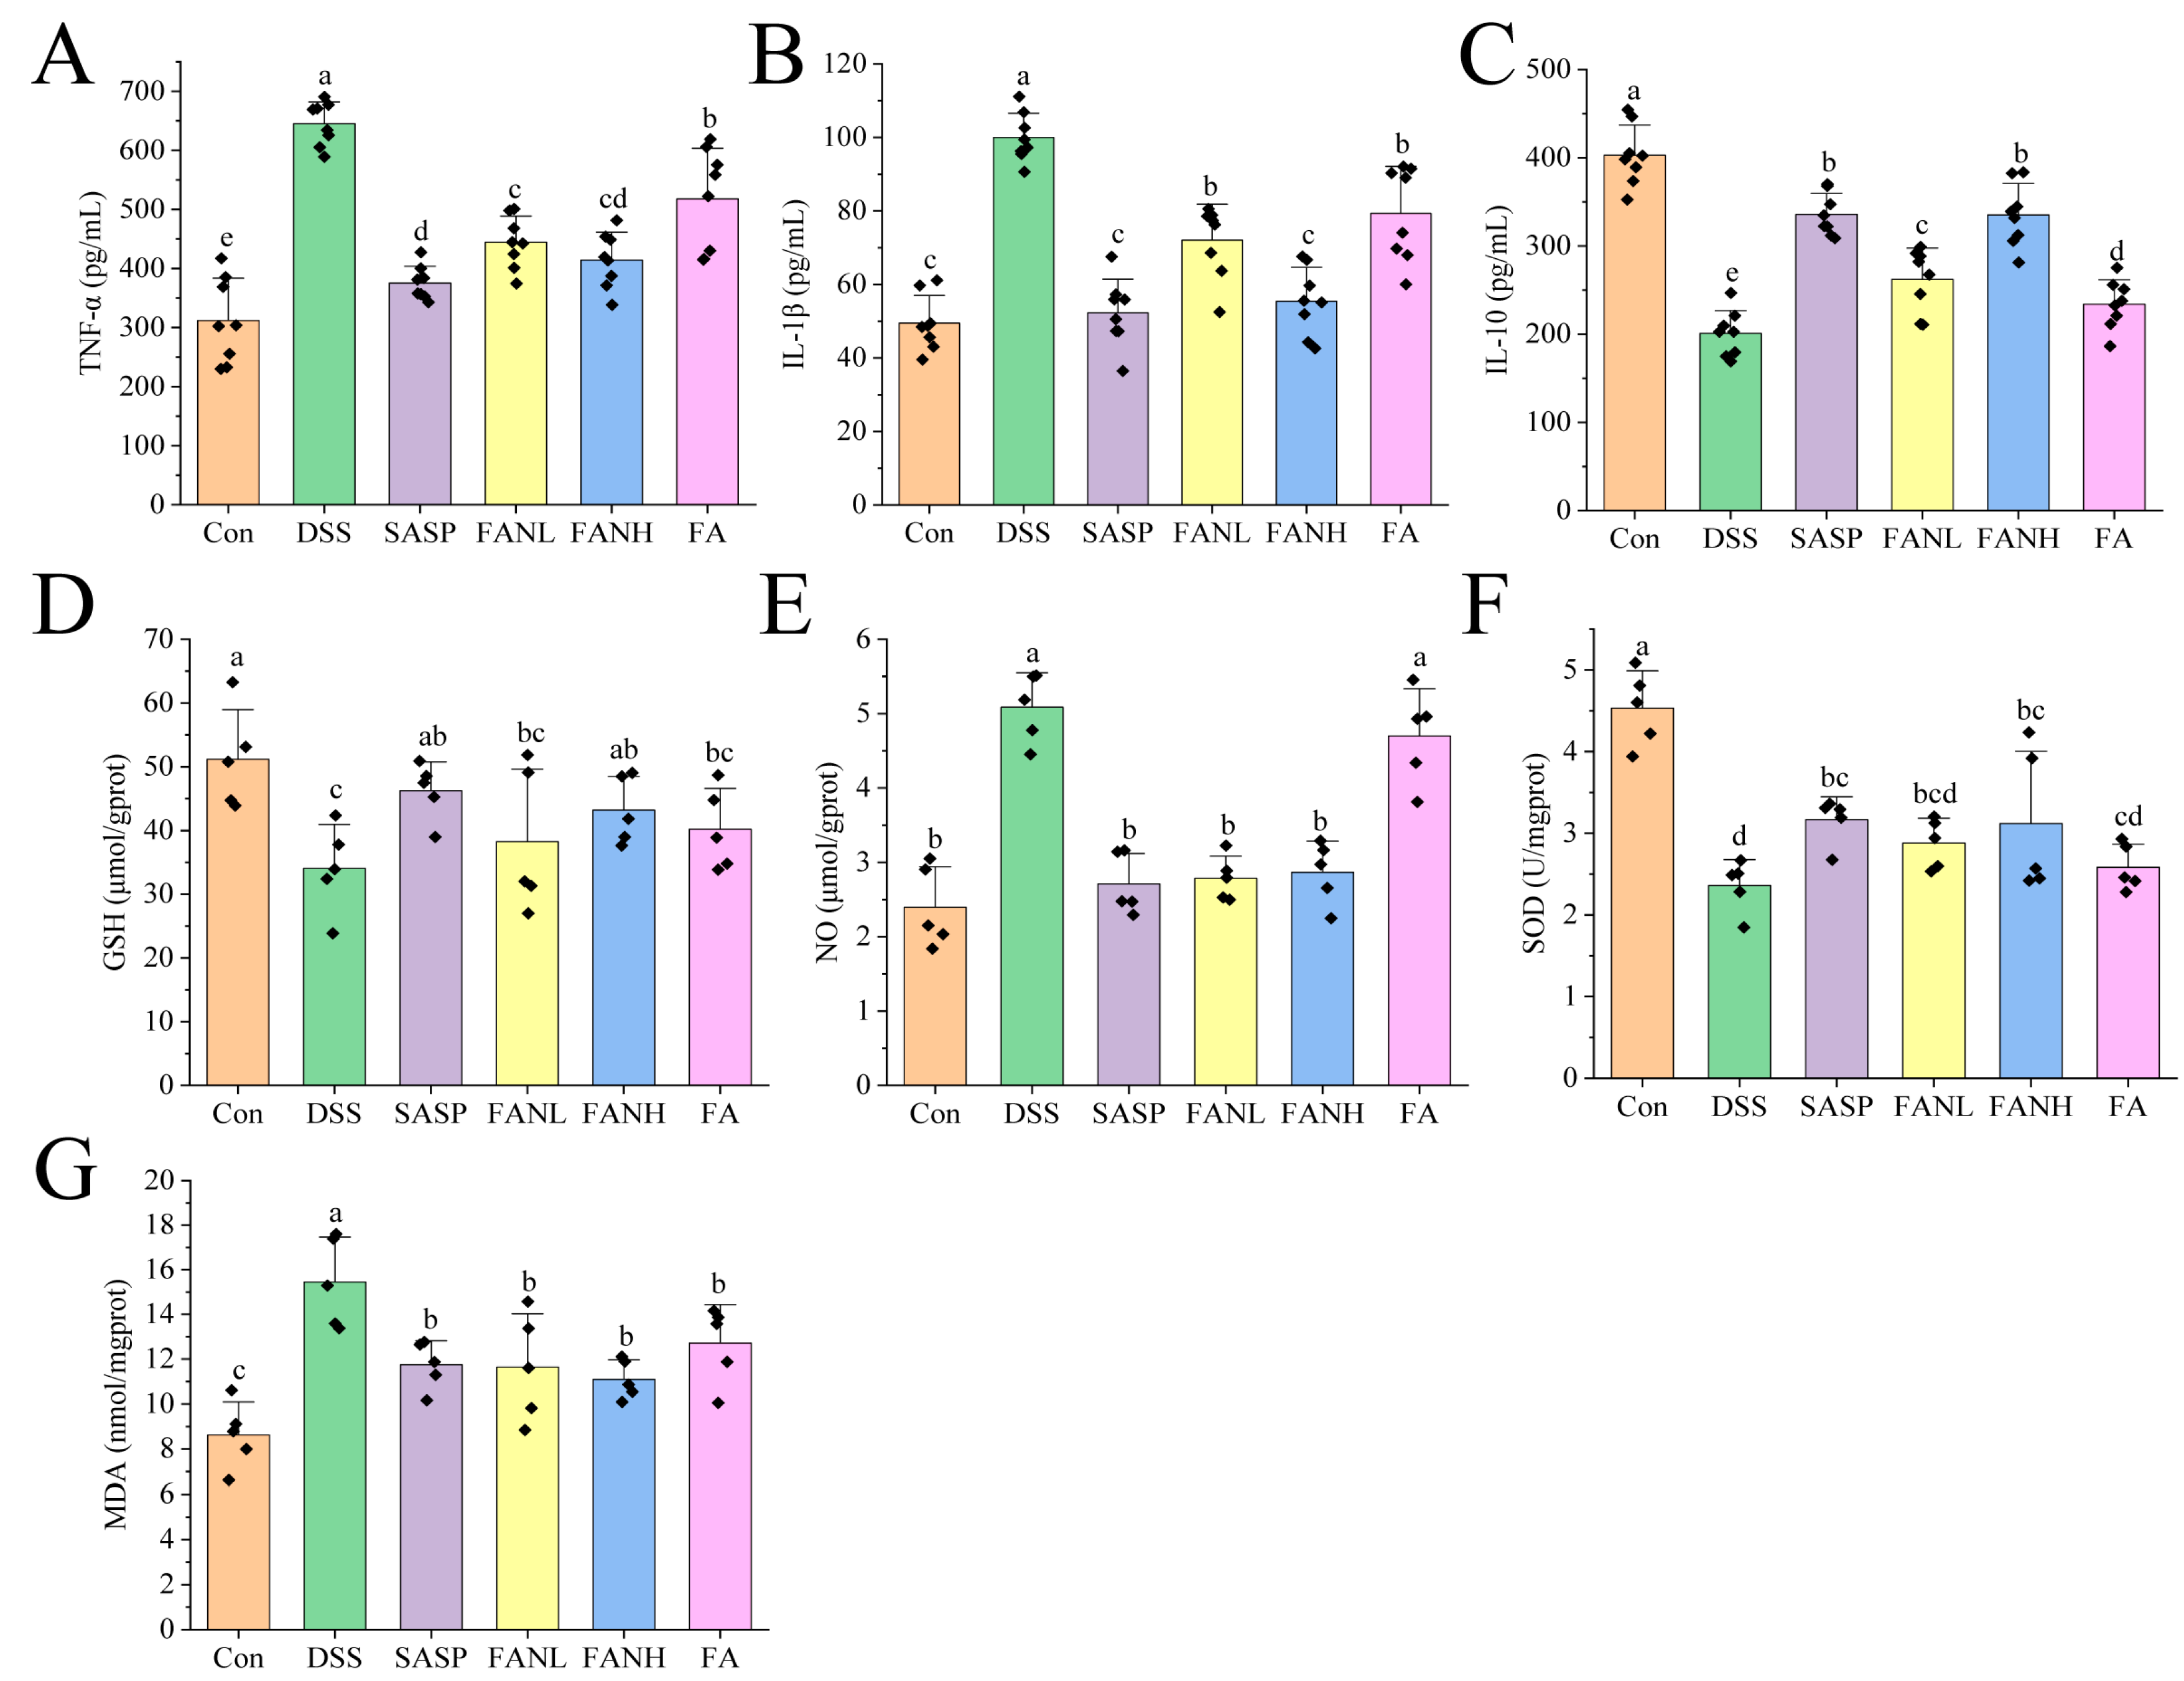
3.11. Zein/FA–PEC/CS Modulates Inflammatory Cytokine Secretion and Oxidative Stress in Colitis Mice
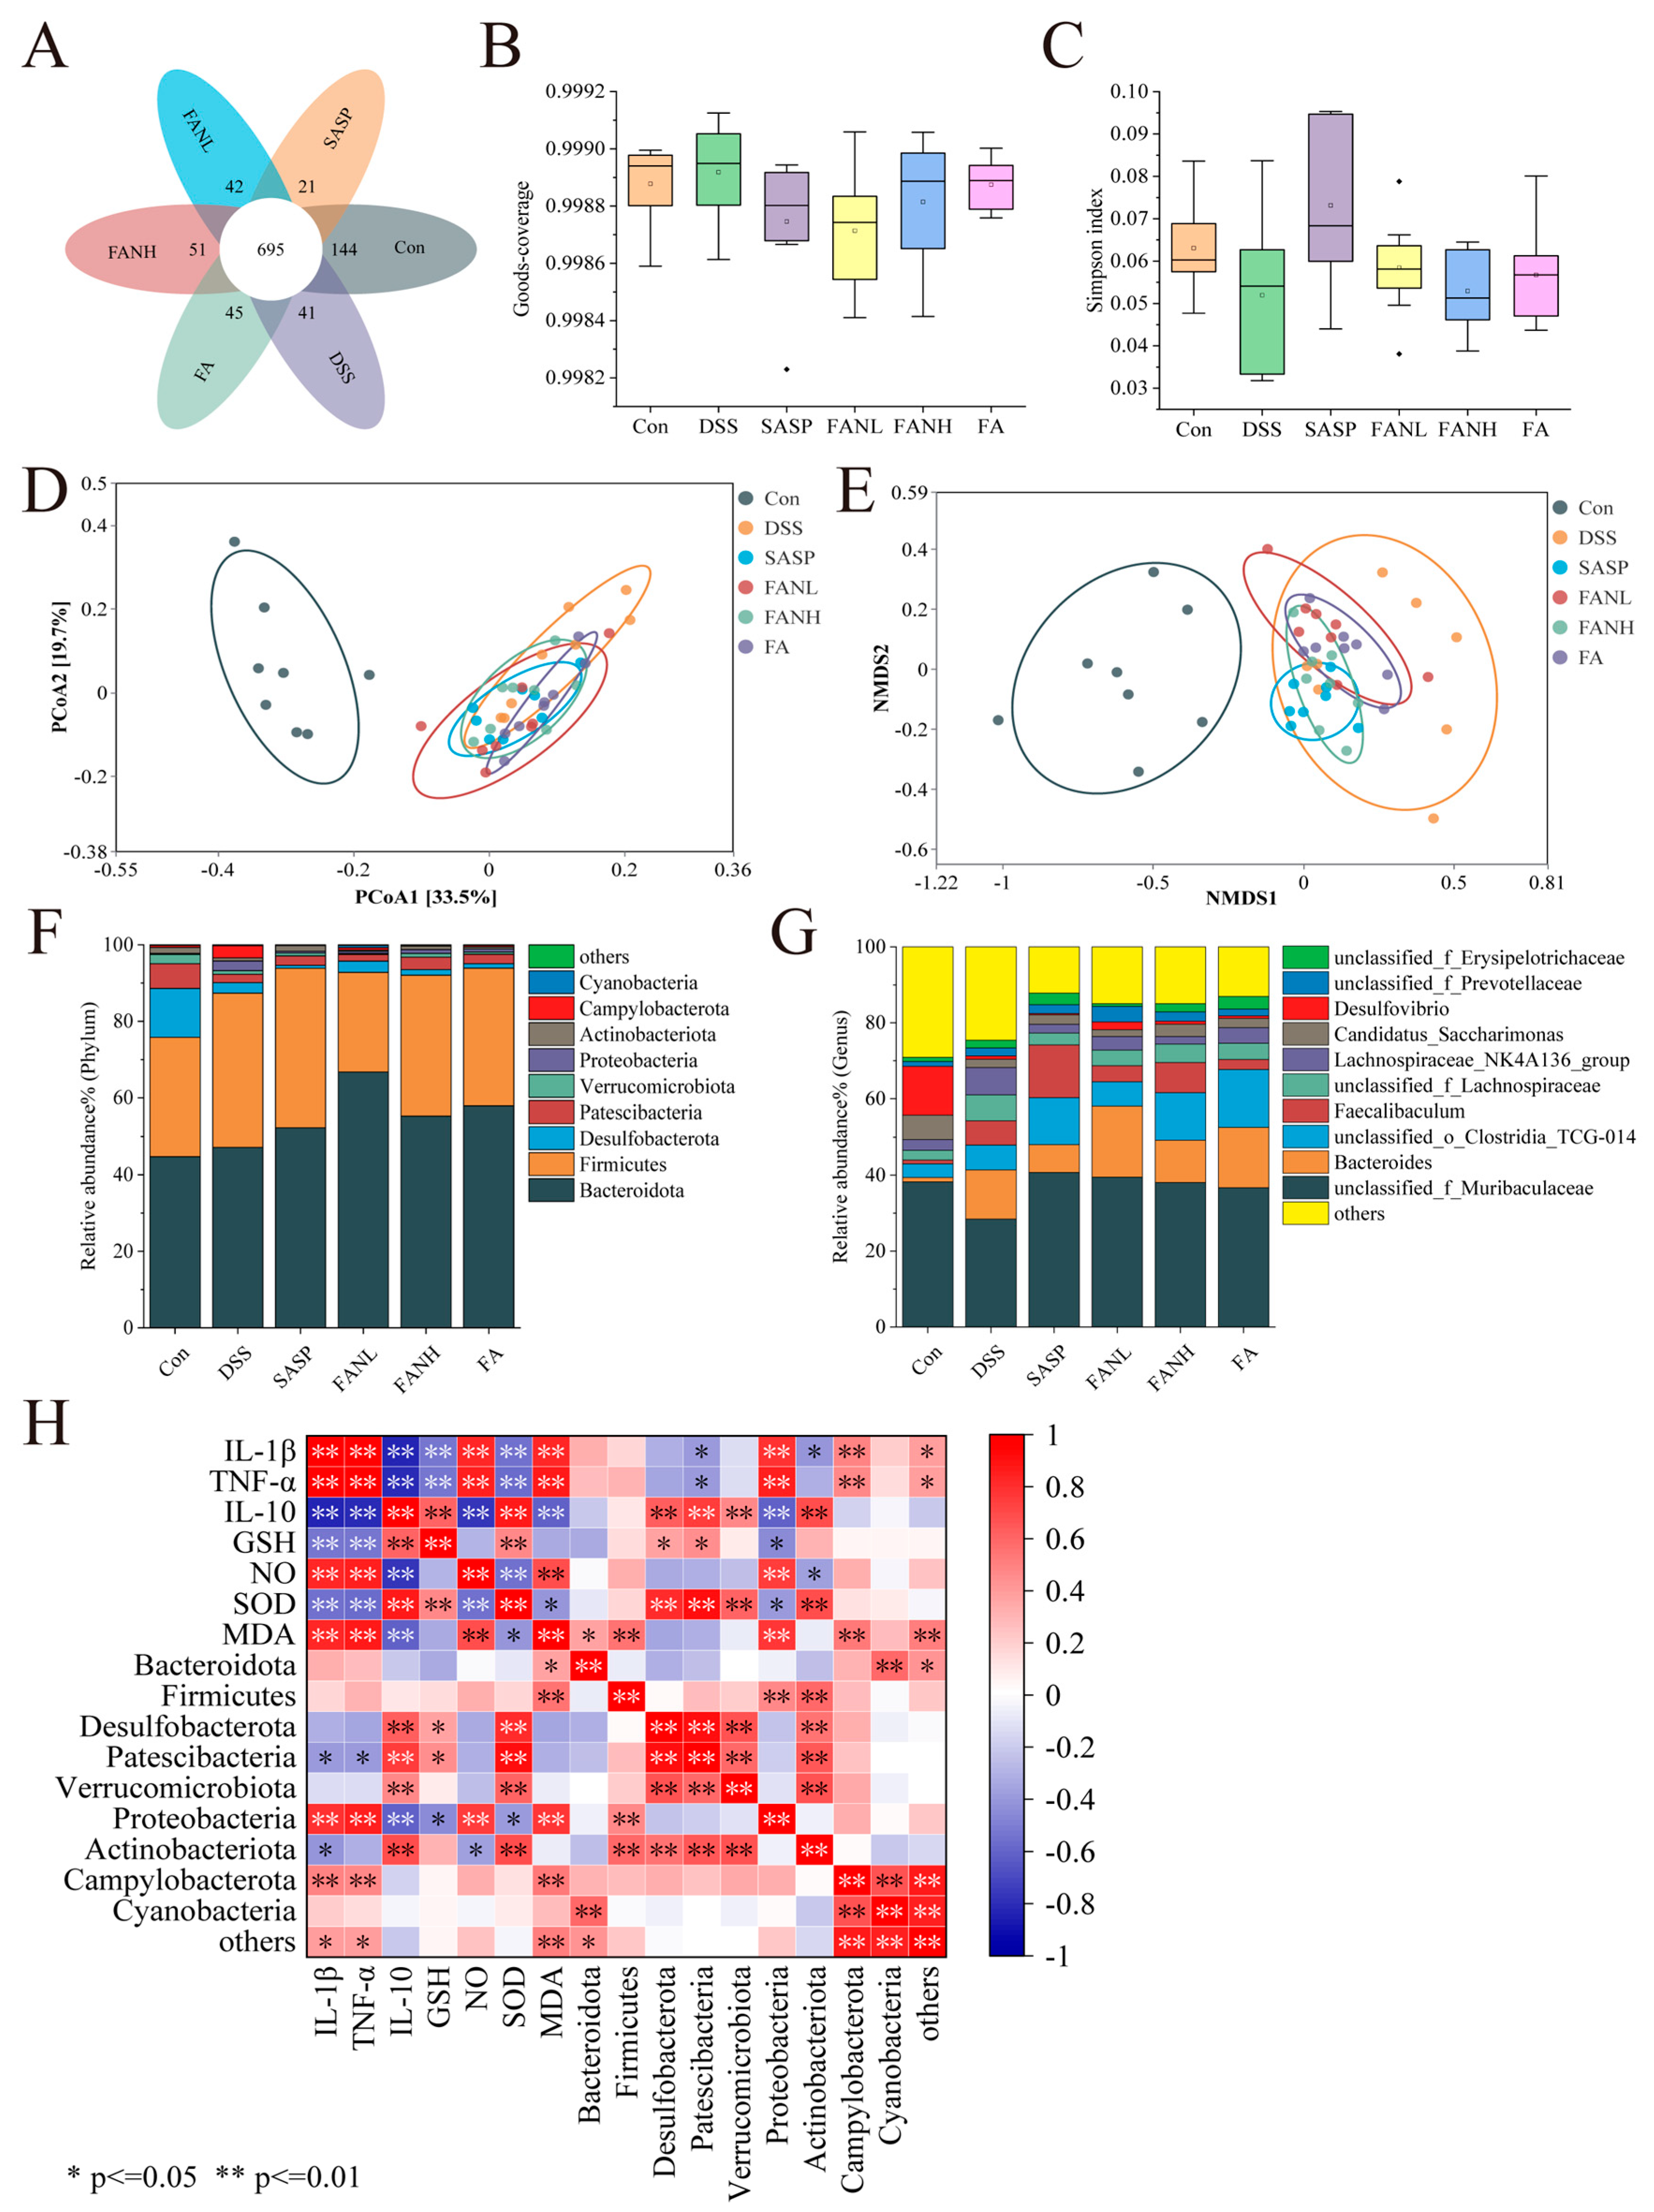
3.12. Modulation of the Intestinal Bacteria by Zein/FA–PEC/CS
4. Conclusions
Author Contributions
Funding
Institutional Review Board Statement
Informed Consent Statement
Data Availability Statement
Conflicts of Interest
References
- Lu, Y.; Han, X. Therapeutic Implications of Phenolic Acids for Ameliorating Inflammatory Bowel Disease. Nutrients 2024, 16, 1347. [Google Scholar] [CrossRef] [PubMed]
- Akobeng, A.K.; Zhang, D.; Gordon, M.; MacDonald, J.K. Oral 5-Aminosalicylic Acid for Maintenance of Medically-Induced Remission in Crohn’s Disease. Cochrane Database Syst. Rev. 2016. [Google Scholar] [CrossRef]
- Zhang, Q.; Lin, Y.; Zhao, R.; Huang, T.; Tian, Y.; Zhu, L.; Qin, J.; Liu, H. Structural Characterization of Extracellular Polysaccharides from Phellinus Igniarius SH-1 and Their Therapeutic Effects on Dss Induced Colitis in Mice. Int. J. Biol. Macromol. 2024, 275, 133654. [Google Scholar] [CrossRef] [PubMed]
- Patra, A.K.; Amasheh, S.; Aschenbach, J.R. Modulation of Gastrointestinal Barrier and Nutrient Transport Function in Farm Animals by Natural Plant Bioactive Compounds—A Comprehensive Review. Crit. Rev. Food Sci. Nutr. 2018, 59, 3237–3266. [Google Scholar] [CrossRef]
- Xia, X.; Lin, H.; Luo, F.; Wu, X.; Zhu, L.; Chen, S.; Luo, H.; Ye, F.; Peng, X.; Zhang, Y. Oryzanol Ameliorates Dss-Stimulated Gut Barrier Damage Via Targeting the Gut Microbiota Accompanied by the Tlr4/Nf-Κb/Nlrp3 Cascade Response in Vivo. J. Agric. Food Chem. 2022, 70, 15747–15762. [Google Scholar] [CrossRef] [PubMed]
- Li, X.; Chen, Y.; Peng, X.; Zhu, Y.; Duan, W.; Ji, R.; Xiao, H.; Li, X.; Liu, G.; Yu, Y. Anti-Inflammation Mechanisms of a Homogeneous Polysaccharide from Phyllanthus Emblica L. on Dss Induced Colitis Mice Via the Gut Microbiota and Metabolites Alteration. Food Chem. 2024, 459, 14. [Google Scholar] [CrossRef]
- Wen, X.; Peng, H.; Zhang, H.; He, Y.; Guo, F.; Bi, X.; Liu, J.; Sun, Y. Wheat Bran Polyphenols Ameliorate Dss-Induced Ulcerative Colitis in Mice by Suppressing Mapk/Nf-Κb Inflammasome Pathways and Regulating Intestinal Microbiota. Foods 2024, 13, 225. [Google Scholar] [CrossRef]
- Wang, Q.; Tang, Y.; Yang, Y.; Lei, L.; Lei, X.; Zhao, J.; Zhang, Y.; Li, L.; Wang, Q.; Ming, J. The Interaction Mechanisms, and Structural Changes of the Interaction between Zein and Ferulic Acid under Different Ph Conditions. Food Hydrocoll. 2022, 124, 107251. [Google Scholar] [CrossRef]
- Ou, S.; Kwok, K.C. Ferulic Acid: Pharmaceutical Functions, Preparation and Applications in Foods. J. Sci. Food Agric. 2004, 84, 1261–1269. [Google Scholar] [CrossRef]
- Tian, B.; Geng, Y.; Wang, P.; Cai, M.; Neng, J.; Hu, J.; Xia, D.; Cao, W.; Yang, K.; Sun, P. Ferulic Acid Improves Intestinal Barrier Function through Altering Gut Microbiota Composition in High-Fat Diet-Induced Mice. Eur. J. Nutr. 2022, 61, 3767–3783. [Google Scholar] [CrossRef]
- Wang, S.; Hong, Y.; Li, Y.; Zhang, Z.; Han, J.; Yang, Z.; Yang, Y.; Ma, Z.; Wang, Q. Ferulic Acid Inhibits Arsenic-Induced Colon Injury by Improving Intestinal Barrier Function. Environ. Toxicol. 2024, 39, 4821–4831. [Google Scholar] [CrossRef] [PubMed]
- He, S.; Liu, F.; Xu, L.; Yin, P.; Li, D.; Mei, C.; Jiang, L.; Ma, Y.; Xu, J. Protective Effects of Ferulic Acid against Heat Stress-Induced Intestinal Epithelial Barrier Dysfunction in Vitro and in Vivo. PLoS ONE 2016, 11, e0145236. [Google Scholar] [CrossRef]
- Capaldo, C.T.; Powell, D.N.; Kalman, D. Layered Defense: How Mucus and Tight Junctions Seal the Intestinal Barrier. J. Mol. Med. 2017, 95, 927–934. [Google Scholar] [CrossRef] [PubMed]
- Kim, Y.; Hur, G.; Jang, H.; Jeong, S.; Lee, S.; Lee, S.; Rho, M.; Kim, S.; Lee, S. Ferulic Acid Derivatives Ameliorate Intestine Barrier Destruction by Alleviating Inflammatory Responses in Dextran Sulfate Sodium-Induced Inflammatory Bowel Disease. Toxics 2024, 12, 268. [Google Scholar] [CrossRef] [PubMed]
- Katayama, S.; Ohno, F.; Mitani, T.; Akiyama, H.; Nakamura, S. Rutinosylated Ferulic Acid Attenuates Food Allergic Response and Colitis by Upregulating Regulatory T Cells in Mouse Models. J. Agric. Food Chem. 2017, 65, 10730–10737. [Google Scholar] [CrossRef]
- Gao, J.; Liu, C.; Shi, J.; Ni, F.; Ren, G. The Regulation of Sodium Alginate on the Stability of Ovalbumin-Pectin Complexes for Vd3 Encapsulation and in Vitro Simulated Gastrointestinal Digestion Study. Food Res. Int. 2020, 140, 110011. [Google Scholar] [CrossRef]
- Zhang, L.; McClements, D.J.; Wei, Z.; Wang, G.; Liu, X.; Liu, F. Delivery of Synergistic Polyphenol Combinations Using Biopolymer-Based Systems: Advances in Physicochemical Properties, Stability and Bioavailability. Crit. Rev. Food Sci. Nutr. 2020, 60, 2083–2097. [Google Scholar] [CrossRef]
- Davidov-Pardo, G.; Joye, I.J.; Mcclements, D.J. Encapsulation of Resveratrol in Biopolymer Particles Produced Using Liquid Antisolvent Precipitation. Part 1: Preparation and Characterization. Food Hydrocoll. 2015, 45, 309–316. [Google Scholar] [CrossRef]
- Kureck, I.; Policarpi, P.D.B.; Toaldo, I.M.; Maciel, M.V.d.O.B.; Bordignon-Luiz, M.T.; Barreto, P.L.M.; Block, J.M. Chemical Characterization and Release of Polyphenols from Pecan Nut Shell [Carya Illinoinensis (Wangenh) C. Koch] in Zein Microparticles for Bioactive Applications. Plant Foods Hum. Nutr. 2018, 73, 137–145. [Google Scholar] [CrossRef]
- Ganie, S.A.; Rather, L.J.; Li, Q. Review on Anti-Cancer and Anti-Microbial Applications of Curdlan Biomaterials. J. Polym. Environ. 2022, 30, 1284–1299. [Google Scholar] [CrossRef]
- Yadav, H.; Agrawal, R.; Panday, A.; Patel, J.; Maiti, S. Polysaccharide-Silicate Composite Hydrogels: Review on Synthesis and Drug Delivery Credentials. J. Drug Deliv. Sci. Technol. 2022, 74, 103573. [Google Scholar] [CrossRef]
- Gwanpua, S.G.; Verlinden, B.E.; Hertog, M.L.A.T.M.; Nicolai, B.M.; Geeraerd, A. A Transcriptomics-Based Kinetic Model for Enzyme-Induced Pectin Degradation in Apple (Malus × Domestica) Fruit. Postharvest Biol. Technol. 2017, 130, 64–74. [Google Scholar] [CrossRef]
- Alazi, E.; Ram, A.F.J. Modulating Transcriptional Regulation of Plant Biomass Degrading Enzyme Networks for Rational Design of Industrial Fungal Strains. Front. Bioeng. Biotechnol. 2018, 6, 133. [Google Scholar] [CrossRef] [PubMed]
- Zhu, J.; Zhong, L.; Chen, W.; Song, Y.; Qian, Z.; Cao, X.; Huang, Q.; Zhang, B.; Chen, H.; Chen, W. Preparation and Characterization of Pectin/Chitosan Beads Containing Porous Starch Embedded with Doxorubicin Hydrochloride: A Novel and Simple Colon Targeted Drug Delivery System. Food Hydrocoll. 2019, 95, 562–570. [Google Scholar] [CrossRef]
- Yuan, Y.; Li, H.; Liu, C.; Zhu, J.; Xu, Y.; Zhang, S.; Fan, M.; Zhang, D.; Zhang, Y.; Zhang, Z. Fabrication of Stable Zein Nanoparticles by Chondroitin Sulfate Deposition Based on Antisolvent Precipitation Method. Int. J. Biol. Macromol. 2019, 139, 30–39. [Google Scholar] [CrossRef] [PubMed]
- Feng, J.; Xu, H.; Zhang, L.; Wang, H.; Liu, S.; Liu, Y.; Hou, W.; Li, C. Development of Nanocomplexes for Curcumin Vehiculization Using Ovalbumin and Sodium Alginate as Building Blocks: Improved Stability, Bioaccessibility, and Antioxidant activity. J. Agric. Food Chem. 2018, 67, 379–390. [Google Scholar] [CrossRef]
- Clogston, J.D.; Patri, A.K. Zeta Potential Measurement. In Characterization of Nanoparticles Intended for Drug Delivery; Springer: Berlin/Heidelberg, Germany, 2010; pp. 63–70. [Google Scholar]
- Kasaai, M.R. Zein and Zein-Based Nano-Materials for Food and Nutrition Applications: A Review. Trends Food Sci. Technol. 2018, 79, 184–197. [Google Scholar] [CrossRef]
- Sun, N.; Chen, C.; Zhu, F. Encapsulation of Ferulic Acid in Quinoa Protein and Zein Nanoparticles Prepared through Antisolvent Precipitation: Structure, Stability and Gastrointestinal Digestion. Food Biosci. 2025, 68, 106760. [Google Scholar] [CrossRef]
- Zhong, Q.; Jin, M. Zein Nanoparticles Produced by Liquid–Liquid Dispersion. Food Hydrocoll. 2009, 23, 2380–2387. [Google Scholar] [CrossRef]
- Ting, L.I.; Lei, L.; Min, H.; Gerui, R.; Hujun, X.; Lijuan, D. Preparation, Characterization, in Vitro Digestion, and Antioxidant Activity of Curcumin-Loaded Zein-Carboxymethyl Chitosan Nanocomplexes. Mod. Food Sci. Technol. 2022, 38, 110. [Google Scholar]
- Hu, K.; Huang, X.; Gao, Y.; Huang, X.; Xiao, H.; McClements, D.J. Core–Shell Biopolymer Nanoparticle Delivery Systems: Synthesis and Characterization of Curcumin Fortified Zein–Pectin Nanoparticles. Food Chem. 2015, 182, 275–281. [Google Scholar] [CrossRef] [PubMed]
- Woranuch, S.; Yoksan, R. Preparation, Characterization and Antioxidant Property of Water-Soluble Ferulic Acid Grafted Chitosan. Carbohydr. Polym. 2013, 96, 495–502. [Google Scholar] [CrossRef] [PubMed]
- Wei, Y.; Zhan, X.; Dai, L.; Zhang, L.; Mao, L.; Yuan, F.; Liu, J.; Gao, Y. Formation Mechanism and Environmental Stability of Whey Protein Isolate-Zein Core-Shell Complex Nanoparticles Using the Ph-Shifting Method. LWT 2021, 139, 110605. [Google Scholar] [CrossRef]
- French, D.L.; Arakawa, T.; Li, T. Fourier Transform Infared Spectroscopy Investigation of Protein Conformation in Spray-Dried Protein/Trehalose Powders. Biopolym. Orig. Res. Biomol. 2004, 73, 524–531. [Google Scholar] [CrossRef]
- Albano, K.M.; Nicoletti, V.R. Ultrasound Impact on Whey Protein Concentrate-Pectin Complexes and in the O/W Emulsions with Low Oil Soybean Content Stabilization. Ultrason. Sonochem. 2018, 41, 562–571. [Google Scholar] [CrossRef]
- Qu, W.; Zhang, X.; Han, X.; Wang, Z.; He, R.; Ma, H. Structure and Functional Characteristics of Rapeseed Protein Isolate-Dextran Conjugates. Food Hydrocoll. 2018, 82, 329–337. [Google Scholar] [CrossRef]
- Mathew, S.; Abraham, T.E. Characterisation of Ferulic Acid Incorporated Starch-Chitosan Blend Films. Food Hydrocoll. 2008, 22, 826–835. [Google Scholar] [CrossRef]
- Li, Y.; Lim, L.; Kakuda, Y. Electrospun Zein Fibers as Carriers to Stabilize (-)-Epigallocatechin Gallate. J. Food Ence 2010, 74, C233–C240. [Google Scholar] [CrossRef]
- Wang, Q.; Tang, Y.; Yang, Y.; Lei, L.; Lei, X.; Zhao, J.; Zhang, Y.; Li, L.; Wang, Q.; Ming, J. Interactions and Structural Properties of Zein/Ferulic Acid: The Effect of Calcium Chloride. Food Chem. 2022, 373, 131489. [Google Scholar] [CrossRef]
- He, L.; Chen, K.; Chen, Z.; Chen, C.; Zhou, J.; Shao, Y.; Ma, J.; Qiu, Z.; Chen, Y.; Zhang, W. Abelmoschi Corolla Polysaccharides and Related Metabolite Ameliorates Colitis Via Modulating Gut Microbiota and Regulating the Fxr/Stat3 Signaling Pathway. Int. J. Biol. Macromol. 2024, 277, 134370. [Google Scholar] [CrossRef]
- Wei, N.; Wang, X.; Wu, Y.; Liu, L.; Zhao, Y.; Zhao, R. Comparative Study on Anti-Inflammatory Effect of Polysaccharides from Vinegar-Baked Radix Bupleuri Using Different Methods. ACS Omega 2023, 8, 9. [Google Scholar] [CrossRef]
- Tian, W.; Wang, H.; Zhu, Y.; Wang, Q.; Song, M.; Cao, Y.; Xiao, J. Intervention Effects of Delivery Vehicles on the Therapeutic Efficacy of 6-Gingerol on Colitis. J. Control. Release Off. J. Control. Release Soc. 2022, 349, 51–66. [Google Scholar] [CrossRef]
- Zhao ZhaoHui, Z.Z.; Egashira, Y.; Sanada, H. Digestion and Absorption of Ferulic Acid Sugar Esters in Rat Gastrointestinal Tract. J. Agric. Food Chem. 2003, 51, 5534–5539. [Google Scholar] [CrossRef] [PubMed]
- Menzel, A.; Samouda, H.; Dohet, F.; Loap, S.; Ellulu, M.S.; Bohn, T. Common and Novel Markers for Measuring Inflammation and Oxidative Stress Ex Vivo in Research and Clinical Practice—Which to Use Regarding Disease Outcomes? Antioxidants 2021, 10, 414. [Google Scholar] [CrossRef]
- Carmo de Carvalho e Martins, M.d.; Martins; da Silva Santos Oliveira, A.S.; da Silva, L.A.A.; Primo, M.G.S.; de Carvalho Lira, V.B. Biological Indicators of Oxidative Stress [Malondialdehyde, Catalase, Glutathione Peroxidase, and Superoxide Dismutase] and Their Application in Nutrition. In Biomarkers in Nutrition; Springer: Berlin/Heidelberg, Germany, 2022; pp. 1–25. [Google Scholar]
- Qiu, Z.; Xiang, L.; Han, Y.; Zhang, B.; Qiao, X.; Zheng, Z.; Xiao, H. Structure-Anti-Inflammatory Activity Relationship of Garlic Fructans in Mice with Dextran Sulfate Sodium-Induced Colitis: Impact of Chain Length. Carbohydr. Polym. 2024, 346, 122582. [Google Scholar] [CrossRef] [PubMed]
- Yang, X.; Li, S.; Wang, C.; Lou, Y.; Xu, H. Whole and Polysaccharide Powdered Sporisorium Reilianum Improves Dss-Induced Colitis in Balb/C Mice by Modulating Gut Microbiota. J. Funct. Foods 2021, 79, 104409. [Google Scholar] [CrossRef]
- Ning, K.; Duan, Y.; Tong, W.; Chen, Y.; Zhang, Q.; Xie, Q.; Xiang, H. Protective Effects of Different Molecular Weights of Purslane (Portulaca Oleracea L.) Aqueous Extract on Dss-Induced Ulcerative Colitis in Mice. Antioxidants 2023, 12, 1400. [Google Scholar] [CrossRef] [PubMed]
- Li, J.; Ji, W.; Chen, G.; Yu, K.; Zeng, J.; Zhang, Q.; Xiong, G.; Du, C.; Peng, Y.; Zeng, X. Peonidin-3-O-(3,6-O-Dimalonyl-Β-D-Glucoside), a Polyacylated Anthocyanin Isolated from the Black Corncobs, Alleviates Colitis by Modulating Gut Microbiota in Dss-Induced Mice. Food Res. Int. 2025, 202, 115688. [Google Scholar] [CrossRef]
- Castaño-Rodríguez, N.; Kaakoush, N.O.; Lee, W.S.; Mitchell, H.M. Dual Role of Helicobacter and Campylobacter Species in Ibd: A Systematic Review and Meta-Analysis. Gut 2017, 66, 235–249. [Google Scholar] [CrossRef]
- Zhang, M.; Cui, Y.; Liu, P.; Mo, R.; Wang, H.; Li, Y.; Wu, Y. Oat Β-(1→3, 1→4)-D-Glucan Alleviates Food Allergy-Induced Colonic Injury in Mice by Increasing Lachnospiraceae Abundance and Butyrate Production. Carbohydr. Polym. 2024, 344, 17. [Google Scholar] [CrossRef]


| Weight Loss (%) | Fecal Character | Degree of Blood in Feces | Score |
|---|---|---|---|
| 0 | Normal | Negative | 0 |
| 1–5 | Formed, easily adhered | Weakly positive, light yellowish green | 1 |
| 5–10 | Semi-formed, thin and soft | Positive, blue-green | 2 |
| 10–20 | Thin slurry, not adherent to anus | Strongly positive, dark blue-green | 3 |
| >20 | Diarrhea, adherent to anus | Visible positive, sticky pus, and blood feces | 4 |
| Kinetic Model | Release Mechanism | Equation | k | R2 | n | |||
|---|---|---|---|---|---|---|---|---|
| SGF | SIF | SGF | SIF | SGF | SIF | |||
| First order | First-order release | Mt/M∞= 1 − e−k·t | 0.0623 | 0.0097 | 0.999 | 0.983 | / | / |
| Higuchi model | Fickian diffusion | Mt/M∞ = kt1/2 | 0.46 | 0.10 | 0.505 | 0.900 | / | / |
| Korsmeyer–Peppas | Fickian diffusion (n ≤ 0.45); Anomalous transport (0.45 < n < 0.89); Case-II transport (n = 0.89); Super Case-II transport (n > 0.89) | Mt/M∞ = ktn | 3.58 | 8.17 | 0.951 | 0.985 | 0.48 | 0.29 |
Disclaimer/Publisher’s Note: The statements, opinions and data contained in all publications are solely those of the individual author(s) and contributor(s) and not of MDPI and/or the editor(s). MDPI and/or the editor(s) disclaim responsibility for any injury to people or property resulting from any ideas, methods, instructions or products referred to in the content. |
© 2025 by the authors. Licensee MDPI, Basel, Switzerland. This article is an open access article distributed under the terms and conditions of the Creative Commons Attribution (CC BY) license (https://creativecommons.org/licenses/by/4.0/).
Share and Cite
Guo, Y.; Yu, X.; He, R.; Pei, J.; Chen, H.; Chen, W. Protective Effects of Zein/Ferulic Acid (FA)–Pectin (PEC)/Chitosan (CS) Nanocomplexes on DSS-Induced Ulcerative Colitis in Mice. Foods 2025, 14, 2345. https://doi.org/10.3390/foods14132345
Guo Y, Yu X, He R, Pei J, Chen H, Chen W. Protective Effects of Zein/Ferulic Acid (FA)–Pectin (PEC)/Chitosan (CS) Nanocomplexes on DSS-Induced Ulcerative Colitis in Mice. Foods. 2025; 14(13):2345. https://doi.org/10.3390/foods14132345
Chicago/Turabian StyleGuo, Yifei, Xinyu Yu, Rongrong He, Jianfei Pei, Haiming Chen, and Weijun Chen. 2025. "Protective Effects of Zein/Ferulic Acid (FA)–Pectin (PEC)/Chitosan (CS) Nanocomplexes on DSS-Induced Ulcerative Colitis in Mice" Foods 14, no. 13: 2345. https://doi.org/10.3390/foods14132345
APA StyleGuo, Y., Yu, X., He, R., Pei, J., Chen, H., & Chen, W. (2025). Protective Effects of Zein/Ferulic Acid (FA)–Pectin (PEC)/Chitosan (CS) Nanocomplexes on DSS-Induced Ulcerative Colitis in Mice. Foods, 14(13), 2345. https://doi.org/10.3390/foods14132345