Gene Expression and Enzyme Kinetics of Polyphenol Oxidases in Strawberry and Their Possible Involvement in Enzymatic Browning Reactions in Strawberry Nectar

 , ,
, ,  , , and
Abstract
1. Introduction
2. Materials and Methods
2.1. Chemicals
2.2. PPO Genes and Plasmid Construct
2.3. Protein Expression and Purification
2.4. SDS-PAGE and Western Blotting
2.5. Enzyme Assays
2.6. Kinetic Studies
2.7. Plant Material
2.8. Nectar Preparation
2.9. Color Measurement and Acceptance Factor Calculation
2.10. RT-qPCR Analysis
3. Results and Discussion
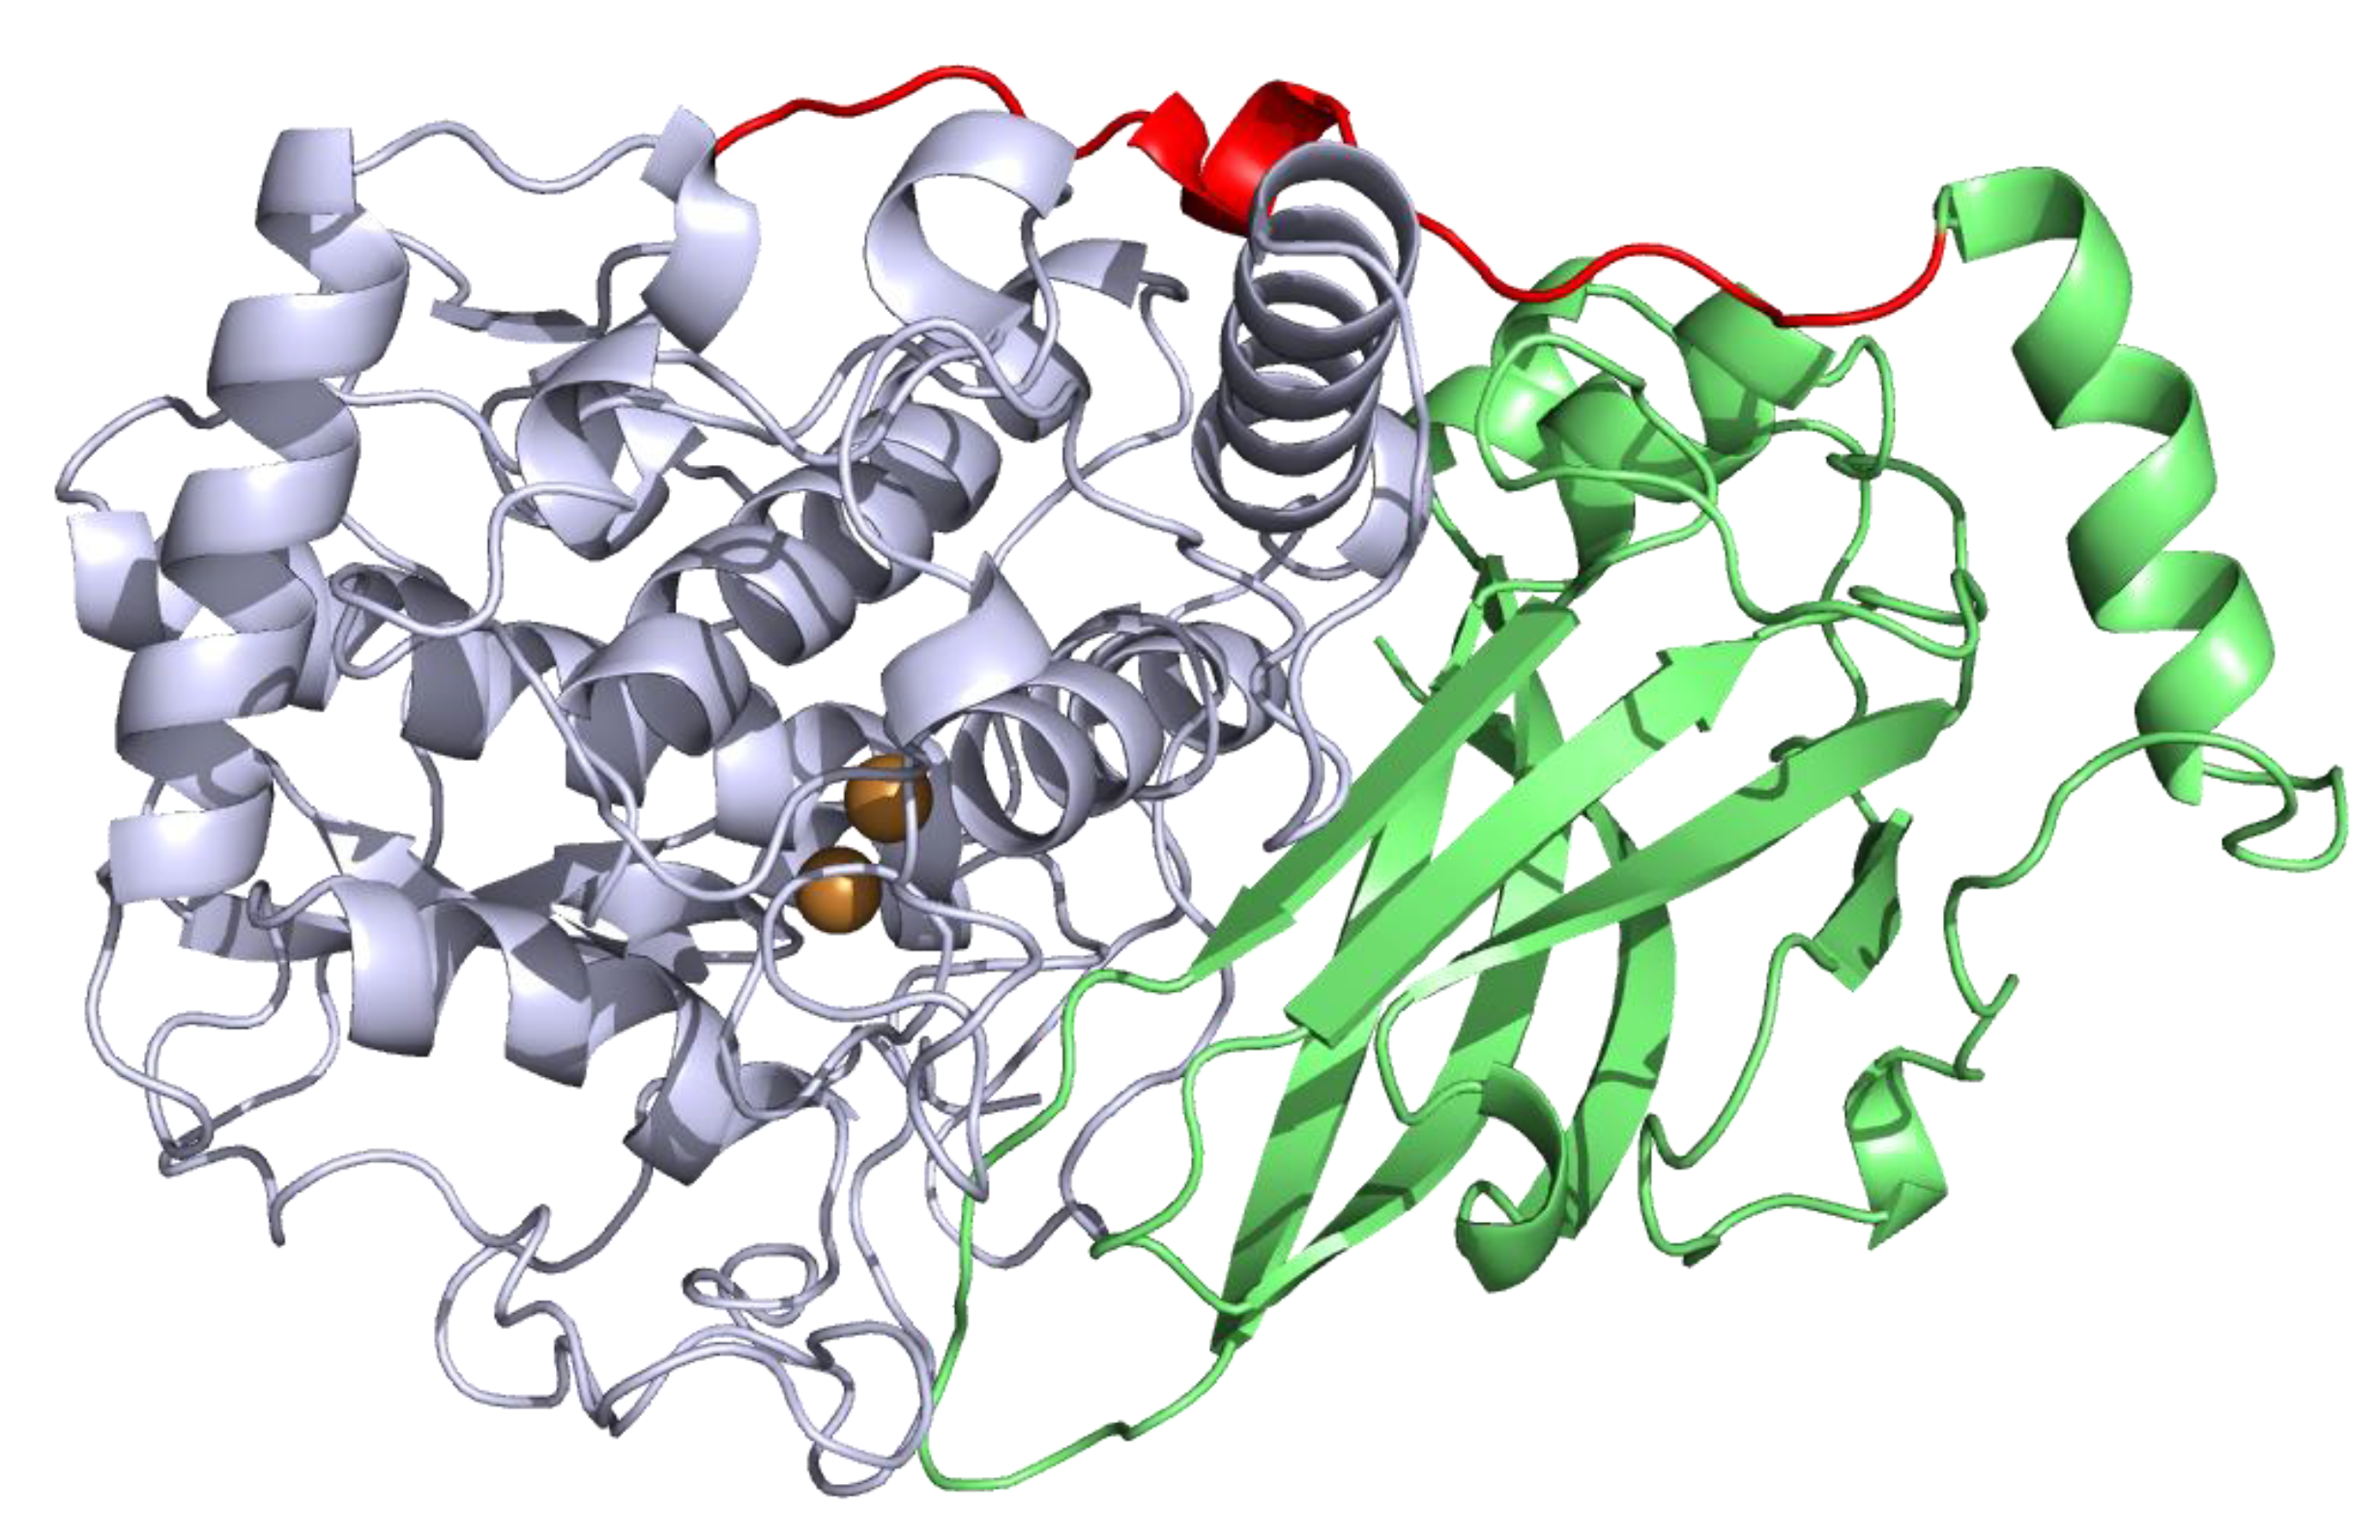
3.1. Selection of PPO Gene Candidates
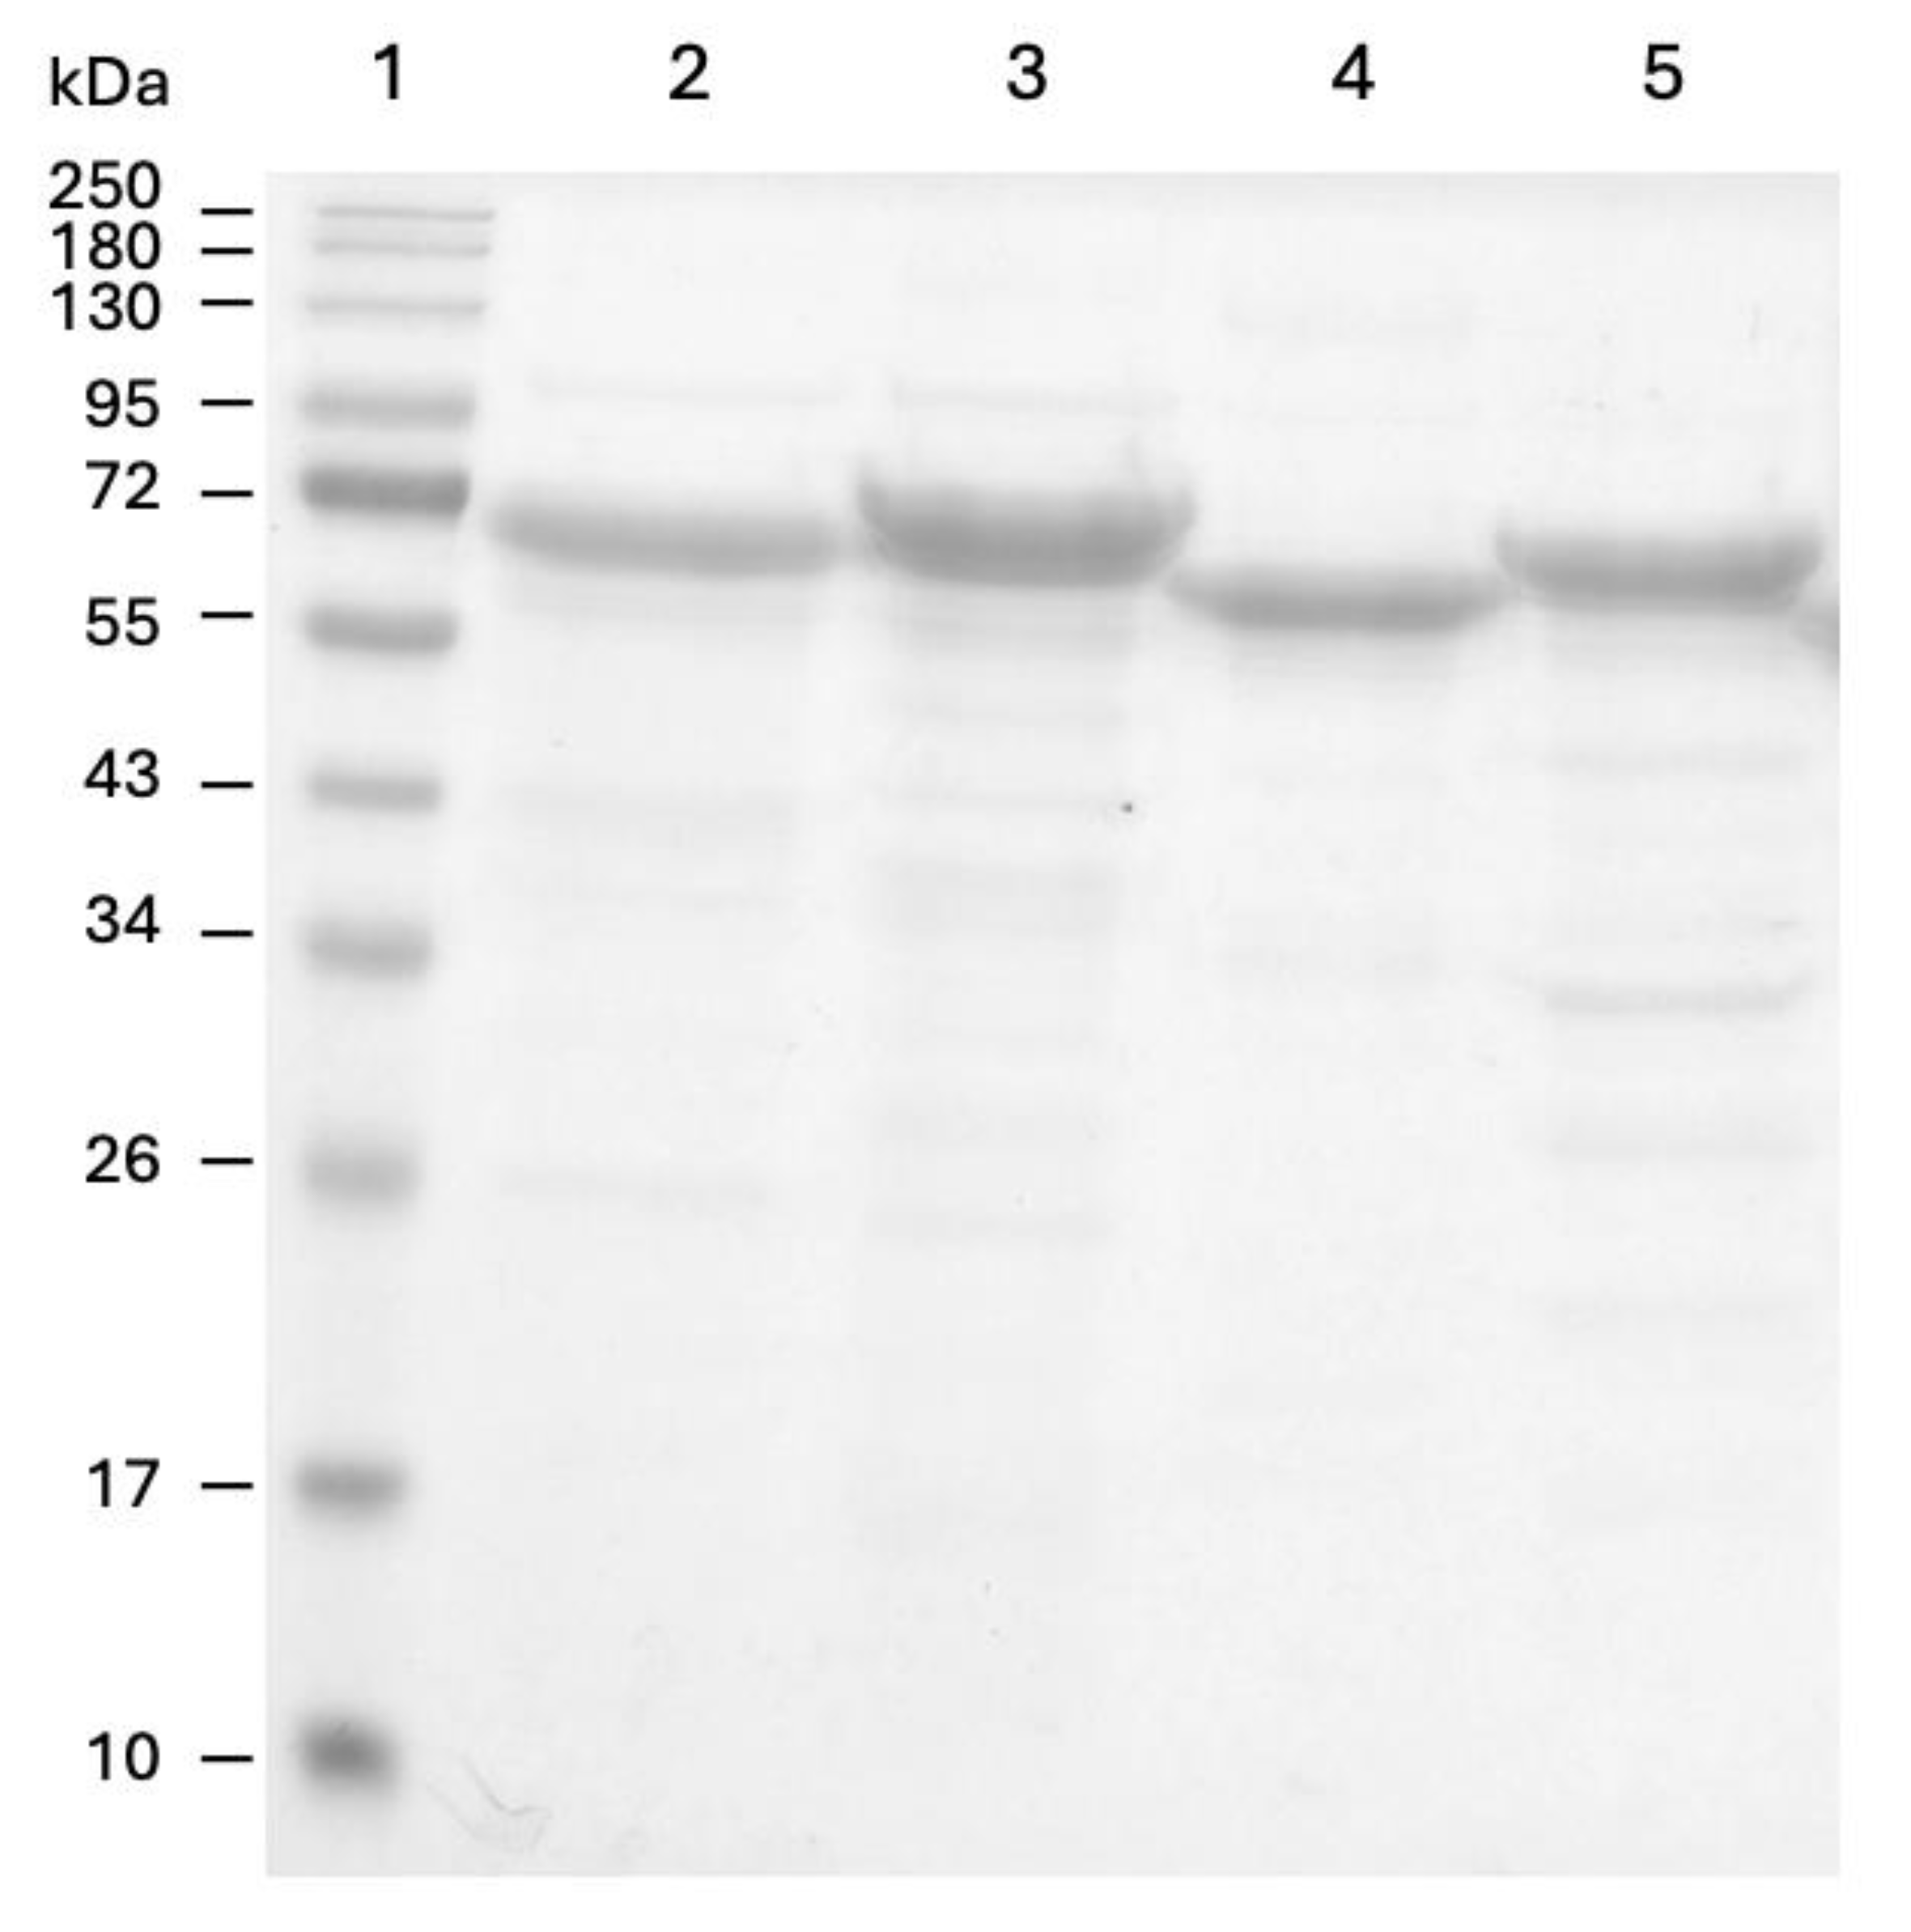
3.2. Protein Expression and Purification
3.3. Enzyme Characterization
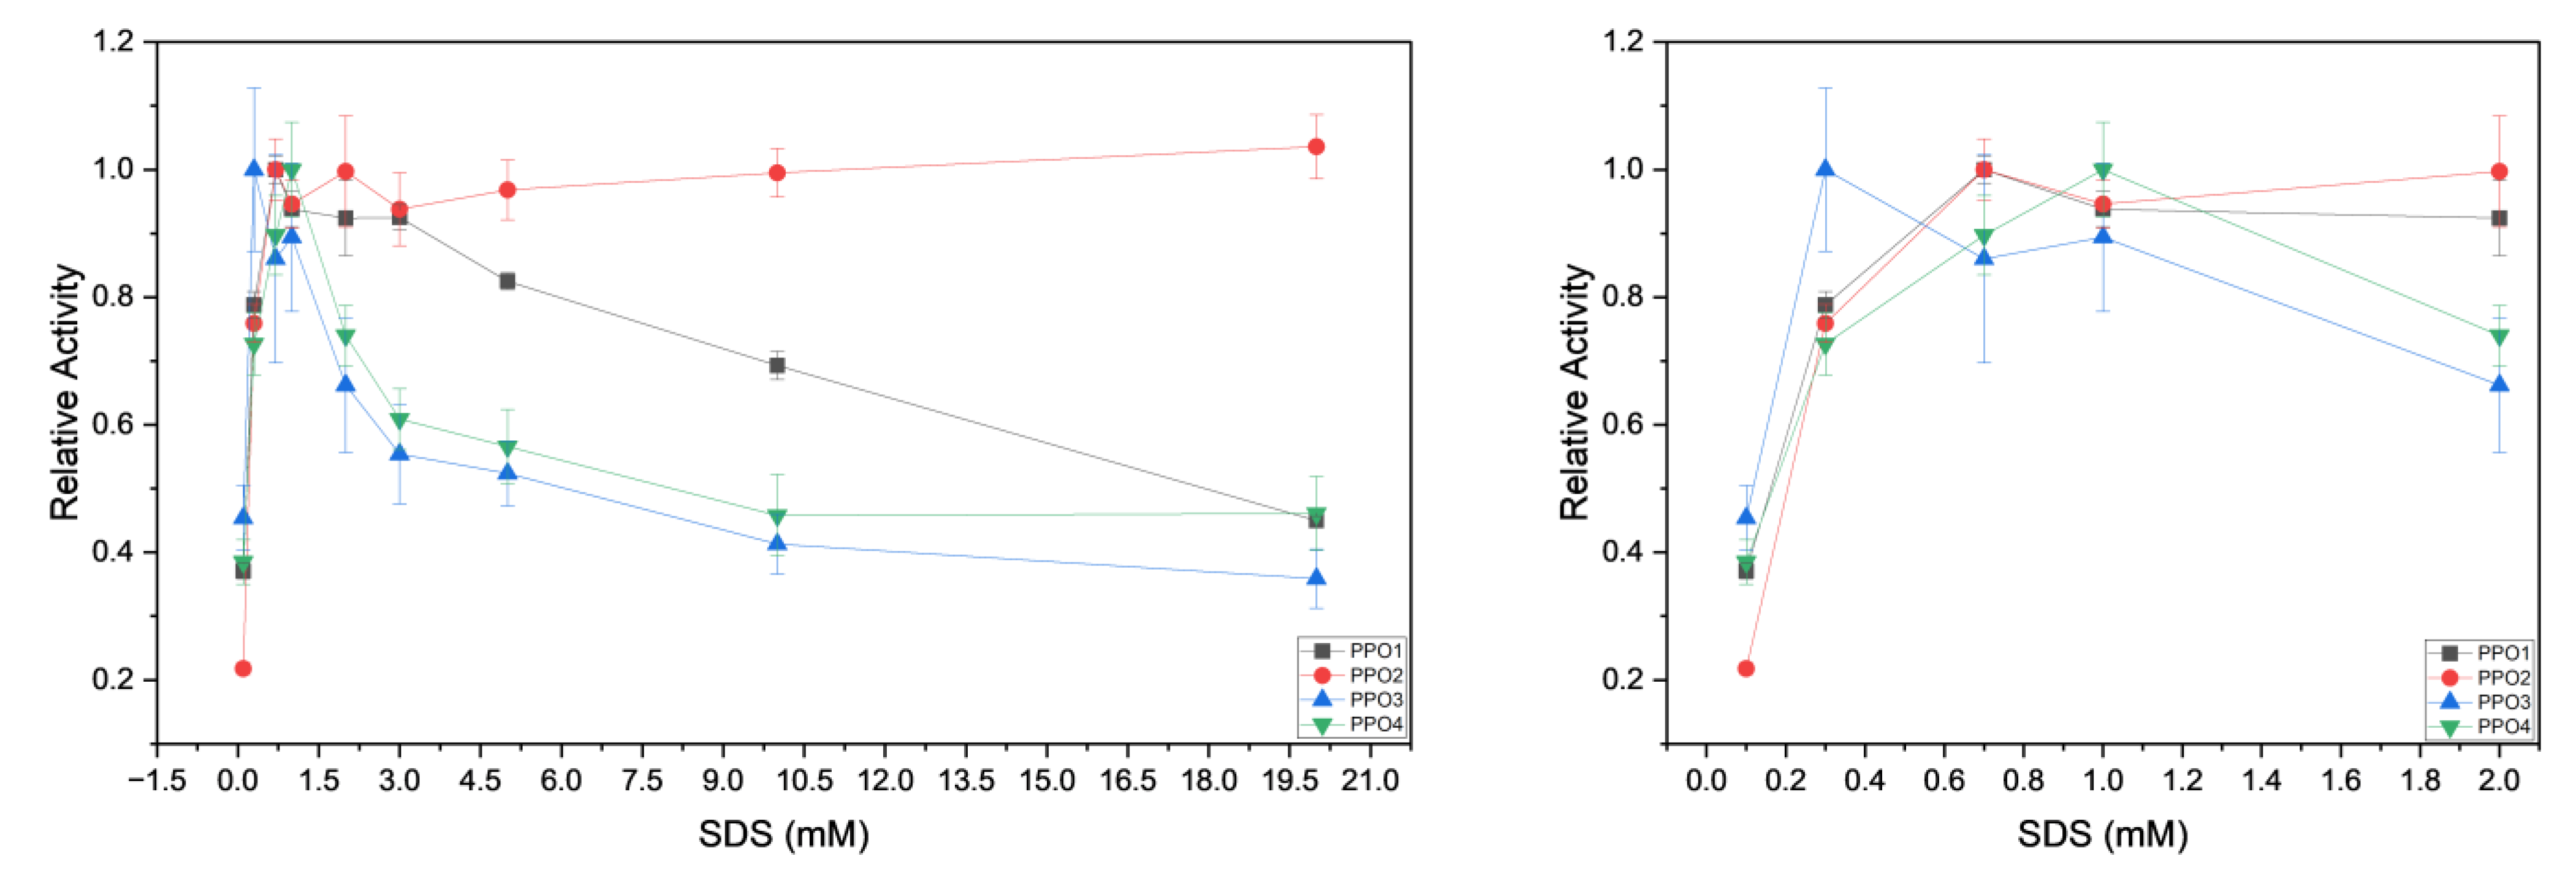
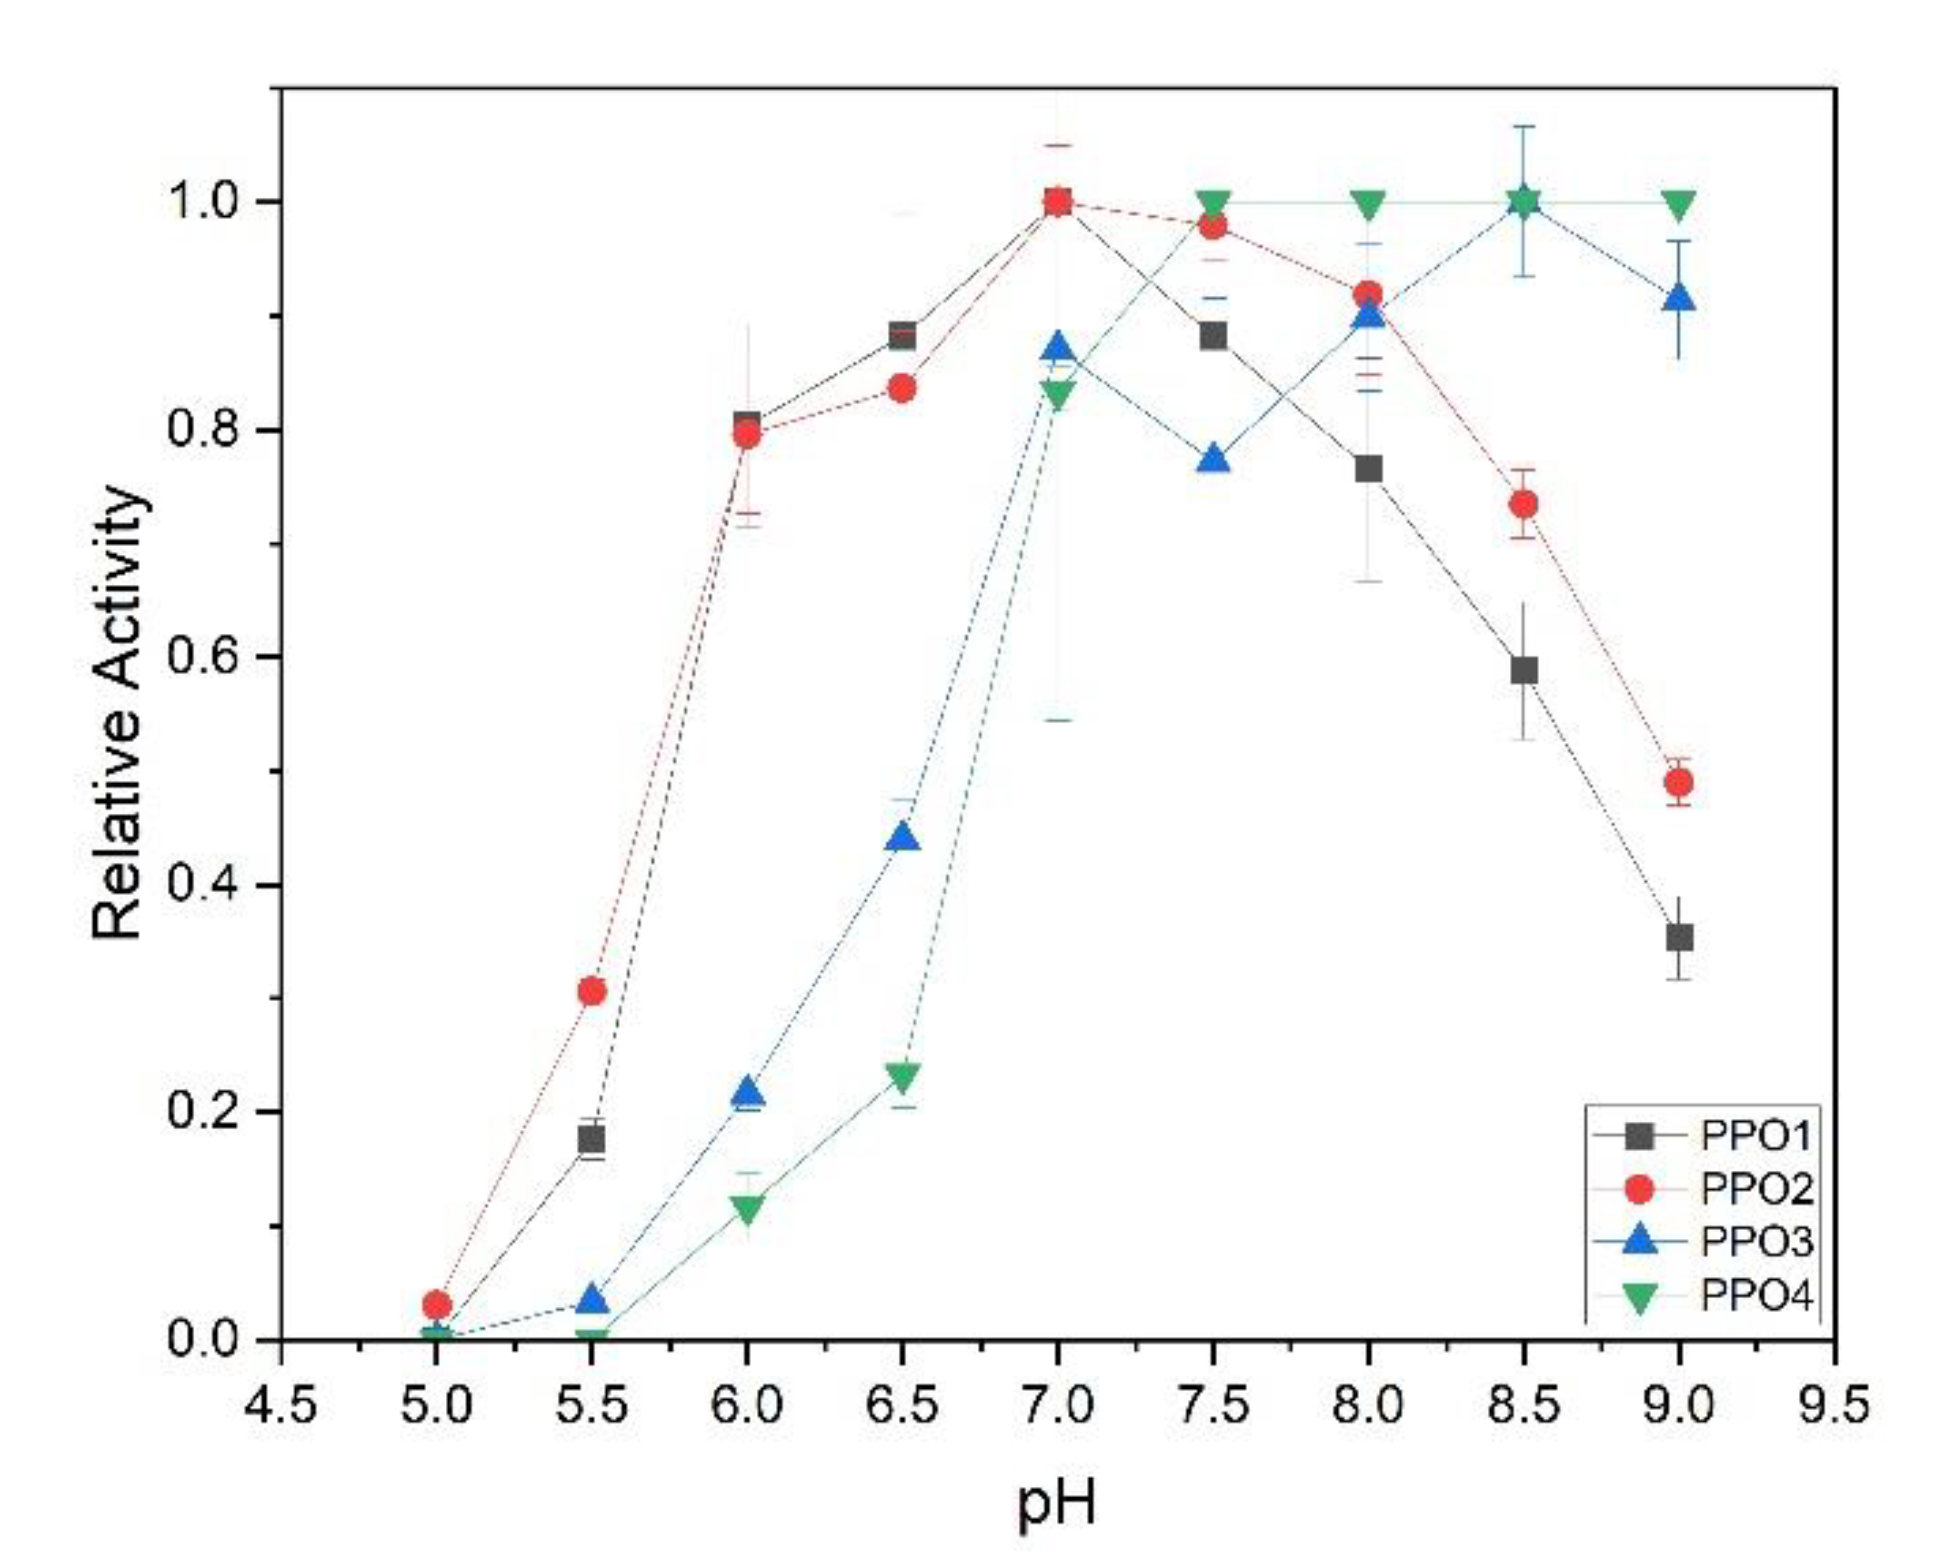
3.3.1. Activation of the Latent Enzyme and pH Optimum
3.3.2. Substrate Specificity of the Recombinant PPOs
3.4. RT-qPCR Analysis
4. Conclusions
Supplementary Materials
Author Contributions
Funding
Institutional Review Board Statement
Informed Consent Statement
Data Availability Statement
Acknowledgments
Conflicts of Interest
References
- Food, T.; Agriculture, O. Crops and Livestock Products. 2023. Available online: https://www.fao.org/faostat/en/#data/Qcl (accessed on 10 December 2024).
- Azam, M.; Ejaz, S.; Rehman, R.N.U.; Khan, M.; Qadri, R. Postharvest Quality Management of Strawberries; IntechOpen: London, UK, 2019. [Google Scholar]
- Giampieri, F.; Tulipani, S.; Alvarez-Suarez, J.M.; Quiles, J.L.; Mezzetti, B.; Battino, M. The strawberry: Composition, nutritional quality, and impact on human health. Nutrition 2012, 28, 9–19. [Google Scholar] [CrossRef] [PubMed]
- Diamanti, J.; Bompadre, S.; Romandini, S.; Ferreiro, M.S.; Quiles, J.L.; Giampieri, F.; Capocasa, F.; Mezzetti, B.; Mazzoni, L.; Battino, M.; et al. The potential impact of strawberry on human health. Nat. Prod. Res. 2013, 27, 448–455. [Google Scholar]
- Amin, W.A.; Attia, R.S.; Aamer, R.A. Enhancement of color stability in strawberry nectar during storage. Ann. Agric. Sci. 2021, 66, 121–130. [Google Scholar]
- Rincon, S.; Gössinger, M.; Ginies, C.; Goupy, P.; Dufour, C.; Dangles, O.; Murray, H.; Le Bourvellec, C. Characterisation of phenolic compounds and polysaccharides in strawberry: Cultivar and harvest effects and their correlation with nectar colour stability. Food Chem. 2025, 473, 143112. [Google Scholar] [CrossRef]
- Carrillo, C.; Grauwet, T.; Hendrickx, M.; Van Loey, A.; Buvé, C.; Kebede, B.T.; De Batselier, C.; Pham, H.T. Kinetics of colour changes in pasteurised strawberry juice during storage. J. Food Eng. 2018, 216, 42–51. [Google Scholar]
- Halbwirth, H.; Gössinger, M.; Korntheuer, K.; Lindner, M.; Dietl-Schuller, C.; Murray, H. Prediction of the potential colour stability of strawberry nectar by use of a Stability Prediction Value (SPV). LWT 2023, 173, 114233. [Google Scholar]
- Groll, E.; Boner, A.; Höfler, M.; Radocha, N.; Nosko, E.; Bauer, R.; Berghofer, E.; Mayer, F.; Gössinger, M. Consumer’s color acceptance of strawberry nectars from puree. J. Sens. Stud. 2009, 24, 78–92. [Google Scholar]
- Council of the European Union. Council Directive 2001/112/EC of 20 December 2001 Relating to Fruit Juices and Certain Similar Products Intended for Human Consumption; Directorate-General for Agriculture Development and Rural, Ed.; Council of the European Union: Brussel, Belgium, 2014. [Google Scholar]
- Wesche-Ebeling, P.; Montgomery, M.W. Strawberry Polyphenoloxidase: Its Role in Anthocyanin Degradation. J. Food Sci. 2006, 55, 731–734. [Google Scholar] [CrossRef]
- Stich, K.; Halbwirth, H.; Berghofer, E.; Moritz, S.; Wendelin, S.; Hermes, M.; Scherbichler, H.; Gössinger, M. Effects of processing parameters on colour stability of strawberry nectar from puree. J. Food Eng. 2009, 90, 171–178. [Google Scholar]
- Broeck, I.V.D.; Ludikhuyze, L.; Weemaes, C.; Hendrickx, M. Kinetic Study of Antibrowning Agents and Pressure Inactivation of Avocado Polyphenoloxidase. J. Food Sci. 1999, 64, 823–827. [Google Scholar]
- Stich, K.; Halbwirth, H.; Berghofer, E.; Wendelin, S.; Hermes, M.; Gössinger, M.; Ullram, T.; Berghold, S. Effects of pre-freezing, puree content and pasteurisation regime on colour stability of strawberry nectar made from puree. J. Sci. Food Agric. 2009, 89, 144–149. [Google Scholar]
- Arias, E.; Oria, R.; González, J.; Lopez-Buesa, P. Ascorbic Acid and 4-Hexylresorcinol Effects on Pear PPO and PPO Catalyzed Browning Reaction. J. Food Sci. 2007, 72, C422–C429. [Google Scholar] [CrossRef]
- Marco, C.; Riccardo, A.; Barbagallo, N.; Spagna, G. Characterization of Polyphenol Oxidase and Peroxidase and Influence on Browning of Cold Stored Strawberry Fruit. J. Agric. Food Chem. 2007, 55, 3469–3476. [Google Scholar]
- Hendrickx, M.; Buvé, C.; Teribia, N.; Bonerz, D.; Aschoff, J.; Van Loey, A. Impact of processing and storage conditions on color stability of strawberry puree: The role of PPO reactions revisited. J. Food Eng. 2021, 294, 110402. [Google Scholar]
- Pretzler, M.; Rompel, A. Tyrosinases: A family of copper-containing metalloenzymes. ChemTexts 2024, 10, 12. [Google Scholar] [CrossRef] [PubMed]
- Zhang, S.; Zhang, S. Recent Advances of Polyphenol Oxidases in Plants. Molecules 2023, 28, 2158. [Google Scholar] [CrossRef]
- Constabel, C.P.; Barbehenn, R. Defensive Roles of Polyphenol Oxidase in Plants. In Induced Plant Resistance to Herbivory; Schaller, A., Ed.; Springer: Dordrecht, The Netherlands, 2008; pp. 253–270. [Google Scholar]
- Mauracher, S.G.; Rompel, A.; Molitor, C. Aurone synthase is a catechol oxidase with hydroxylase activity and provides insights into the mechanism of plant polyphenol oxidases. Proc. Natl. Acad. Sci. USA 2016, 113, E1806–E1815. [Google Scholar]
- Sullivan, M.L. Beyond brown: Polyphenol oxidases as enzymes of plant specialized metabolism. Front. Plant Sci. 2015, 5, 783. [Google Scholar] [CrossRef]
- Okubara, P.A.; Fuerst, E.P.; Anderson, J.V.; Morris, C.F. Frontiers|Polyphenol oxidase as a biochemical seed defense mechanism. Front. Plant Sci. 2014, 5, 689. [Google Scholar]
- Inlow, J.K.; Flurkey, W.H.; Marusek, C.M.; Trobaugh, N.M. Comparative analysis of polyphenol oxidase from plant and fungal species. J. Inorg. Biochem. 2006, 100, 108–123. [Google Scholar]
- Whitaker, J.R. Polyphenol Oxidase; Food Enzymes: Madison, WI, USA, 1995. [Google Scholar]
- Jumper, J.; Evans, R.; Pritzel, A.; Green, T.; Figurnov, M.; Ronneberger, O.; Tunyasuvunakool, K.; Bates, R.; Žídek, A.; Potapenko, A.; et al. Highly accurate protein structure prediction with AlphaFold. Nature 2021, 596, 7873. [Google Scholar] [CrossRef] [PubMed]
- Kaintz, C.; Mauracher, S.G.; Rompel, A. Type-3 Copper Proteins: Recent Advances on Polyphenol Oxidases. Met. Contain. Enzym. 2014, 97, 1–35. [Google Scholar]
- Vaughn, K.C.; Lax, A.R.; Duke, S.O. Polyphenol oxidase: The chloroplast oxidase with no established function. Physiol. Plant. 1988, 72, 659–665. [Google Scholar] [CrossRef]
- Han, Y.; Qin, H.; Zhao, S.; Shao, Y.; Cai, Y.; Dong, Z.; Chen, Y.; Wang, D.; Liu, X.; Lu, M. Genome-Wide Analysis of Polyphenol Oxidase Genes and Their Transcriptional Patterns during Grain Development in Sorghum. Int. J. Plant Sci. 2013, 174, 710–721. [Google Scholar]
- Boeckx, T.; Winters, A.L.; Webb, K.J.; Kingston-Smith, A.H. Polyphenol oxidase in leaves: Is there any significance to the chloroplastic localization? J. Exp. Bot. 2015, 66, 3571–3579. [Google Scholar] [CrossRef] [PubMed]
- Walker, J.R.L.; Ferrar, P.H. Diphenol Oxidases, Enzyme-catalysed Browning and Plant Disease Resistance. Biotechnol. Genet. Eng. Rev. 1998, 15, 457–498. [Google Scholar] [CrossRef]
- Bittner, S. When quinones meet amino acids: Chemical, physical and biological consequences. Amino Acids 2006, 30, 205–224. [Google Scholar] [CrossRef]
- Fialho, E.; Queiroz, C.; Lopes, M.L.M.; Valente-Mesquita, V.L. Polyphenol Oxidase: Characteristics and Mechanisms of Browning Control. Food Rev. Int. 2008, 24, 361–375. [Google Scholar]
- Stowe, E.; Dhingra, A. Development of the Arctic® Apple. Plant Breed. Rev. 2021, 44, 273–296. [Google Scholar]
- Jia, H.; Wang, B.; Wang, Q.; Yang, T.; Zhao, P.; Zhao, M.; Tariq, P.; Zhao, F.; Fang, J. Overexpression of Polyphenol Oxidase Gene in Strawberry Fruit Delays the Fungus Infection Process. Plant Mol. Biol. Report. 2016, 34, 3. [Google Scholar] [CrossRef]
- Gössinger, M.; Grünewald, J.; Kampl, C.; Wendelin, S.; Stich, K.; Berghofer, E. Impact of Provenance, Cultivar, Time of Harvest, and Degree of Ripeness of Strawberries on Their Ingredients and the Colour Stability of Strawberry Nectars Made from Purée; International Society for Horticultural Science (ISHS): Leuven, Belgium, 2014. [Google Scholar]
- Pretzler, M.; Rompel, A. Mushroom Tyrosinase: Six Isoenzymes Catalyzing Distinct Reactions. ChemBioChem 2024, 25, e202400050. [Google Scholar] [CrossRef] [PubMed]
- Rinaldi, M.; Cattani, L.; Rainieri, S.; Lacey, K.L.; Dhenge, R.; Moreno-Barreto, A.; Pavón-Vargas, D. A Quality Assessment of Strawberry Nectar Stabilized by Thermal and High-Pressure Processing Conditions. J. Food Process. Preserv. 2023, 2023, 5481142. [Google Scholar]
- Dawson, C.R.; Magee, R.J. [145] Plant tyrosinase (polyphenol oxidase). Methods Enzymol. 1955, 2, 817–827. [Google Scholar]
- Okonechnikov, K.; Golosova, O.; Fursov, M. Unipro UGENE: A unified bioinformatics toolkit. Bioinformatics 2012, 28, 1166–1167. [Google Scholar] [CrossRef]
- Mayer, A.M.; Harel, E. Polyphenol oxidases in plants. Phytochemistry 1979, 18, 193–215. [Google Scholar] [CrossRef]
- Bijelic, A.; Rompel, A.; Pretzler, M.; Kampatsikas, I. Three recombinantly expressed apple tyrosinases suggest the amino acids responsible for mono- versus diphenolase activity in plant polyphenol oxidases. Sci. Rep. 2017, 7, 1–13. [Google Scholar]
- Pretzler, M.; Bijelic, A.; Rompel, A. Heterologous expression and characterization of functional mushroom tyrosinase (AbPPO4). Sci. Rep. 2017, 7, 1. [Google Scholar] [CrossRef] [PubMed]
- Valero, E.; García-Carmona, F. pH-induced kinetic co-operativity of a thylakoid-bound polyphenol oxidase. Biochem. J. 1992, 286, 623–626. [Google Scholar] [CrossRef]
- Sugumaran, M.; Nellaiappan, K. Lysolecithin—A potent activator of prophenoloxidase from the hemolymph of the lobster, Homarus americanas. Biochem. Biophys. Res. Commun. 1991, 176, 1371–1376. [Google Scholar] [CrossRef]
- Moore, B.M.; Flurkey, W.H. Sodium dodecyl sulfate activation of a plant polyphenoloxidase. Effect of sodium dodecyl sulfate on enzymatic and physical characteristics of purified broad bean polyphenoloxidase. J. Biol. Chem. 1990, 265, 4982–4988. [Google Scholar] [CrossRef]
- Kahn, V. Some Biochemical Properties of Polyphenoloxidase from Two Avocado Varieties Differing in Their Browning Rates. J. Food Sci. 1977, 42, 38–43. [Google Scholar] [CrossRef]
- Doğan, M.; Arslan, O.; Doğan, S. Substrate specificity, heat inactivation and inhibition of polyphenol oxidase from different aubergine cultivars. Int. J. Food Sci. Technol. 2002, 37, 415–423. [Google Scholar] [CrossRef]
- Halbwirth, H.; Puhl, I.; Haas, U.; Jezik, K.; Treutter, D.; Stich, K. Two-Phase Flavonoid Formation in Developing Strawberry (Fragaria × ananassa) Fruit. J. Agric. Food Chem. 2006, 54, 1479–1485. [Google Scholar] [CrossRef]
- Jiménez, M.; García-Carmona, F. The effect of sodium dodecyl sulphate on polyphenol oxidase. Phytochemistry 1996, 42, 1503–1509. [Google Scholar] [CrossRef]
- Li, W.-J.; Zhang, X.-L.; He, Q.; Oren-Shamir, M.; Jiang, L.; Gong, Y.-H.; Shi, Z.-W.; Cai, Z.-G.; Li, L.; Zhang, Z.-Q.; et al. An Intracellular Laccase Is Responsible for Epicatechin-Mediated Anthocyanin Degradation in Litchi Fruit Pericarp. Plant Physiol. 2015, 169, 2391–2408. [Google Scholar]
- Nicolas, J.-P.; Kader, F.; Haluk, J.-P.; Metche, M. Degradation of Cyanidin 3-Glucoside by Blueberry Polyphenol Oxidase: Kinetic Studies and Mechanisms. J. Agric. Food Chem. 1998, 46, 3060–3065. [Google Scholar]
- Chazarra, S.; Garcı́a-Carmona, F.; Cabanes, J. Hysteresis and Positive Cooperativity of Iceberg Lettuce Polyphenol Oxidase. Biochem. Biophys. Res. Commun. 2001, 289, 769–775. [Google Scholar] [CrossRef]
- Peng, C.Y.; Markakis, P. Effect of Phenolase on Anthocyanins. Nature 1963, 199, 4893. [Google Scholar] [CrossRef]
- Li, Q.; Jin, N.; Ye, Y.; Huang, Z.; Ruan, Z.; Chen, J. Phloretin as both a substrate and inhibitor of tyrosinase: Inhibitory activity and mechanism. Spectrochim. Acta Part A Mol. Biomol. Spectrosc. 2020, 226, 117642. [Google Scholar]
- Sankaran, V.; David, E.; Rajamanickam, V.; Venkatesan, S.; Mariadoss, A.V.A.; Vinyagam, R. Pharmacological Aspects and Potential Use of Phloretin: A Systemic Review. Mini-Rev. Med. Chem. 2019, 19, 1060–1067. [Google Scholar]
- Choi, B.Y. Biochemical Basis of Anti-Cancer-Effects of Phloretin—A Natural Dihydrochalcone. Molecules 2019, 24, 278. [Google Scholar] [CrossRef] [PubMed]
- Gautam, S.; Sharma, A.; Mishra, B.B. Purification and characterisation of polyphenol oxidase (PPO) from eggplant (Solanum melongena). Food Chem. 2012, 134, 1855–1861. [Google Scholar]
- Gautam, S.; Sharma, A.; Mishra, B.B. Free phenolics and polyphenol oxidase (PPO): The factors affecting post-cut browning in eggplant (Solanum melongena). Food Chem. 2013, 139, 105–114. [Google Scholar]

 ) and 600 µM (
 ), in comparison to a control (
 ). Color stability was measured weekly over a period of 10 weeks. All measurements were performed in technical duplicates and biological triplicates.
) and 600 µM (), in comparison to a control (). Color stability was measured weekly over a period of 10 weeks. All measurements were performed in technical duplicates and biological triplicates.
). Color stability was measured weekly over a period of 10 weeks. All measurements were performed in technical duplicates and biological triplicates.
) and 600 µM (), in comparison to a control (). Color stability was measured weekly over a period of 10 weeks. All measurements were performed in technical duplicates and biological triplicates.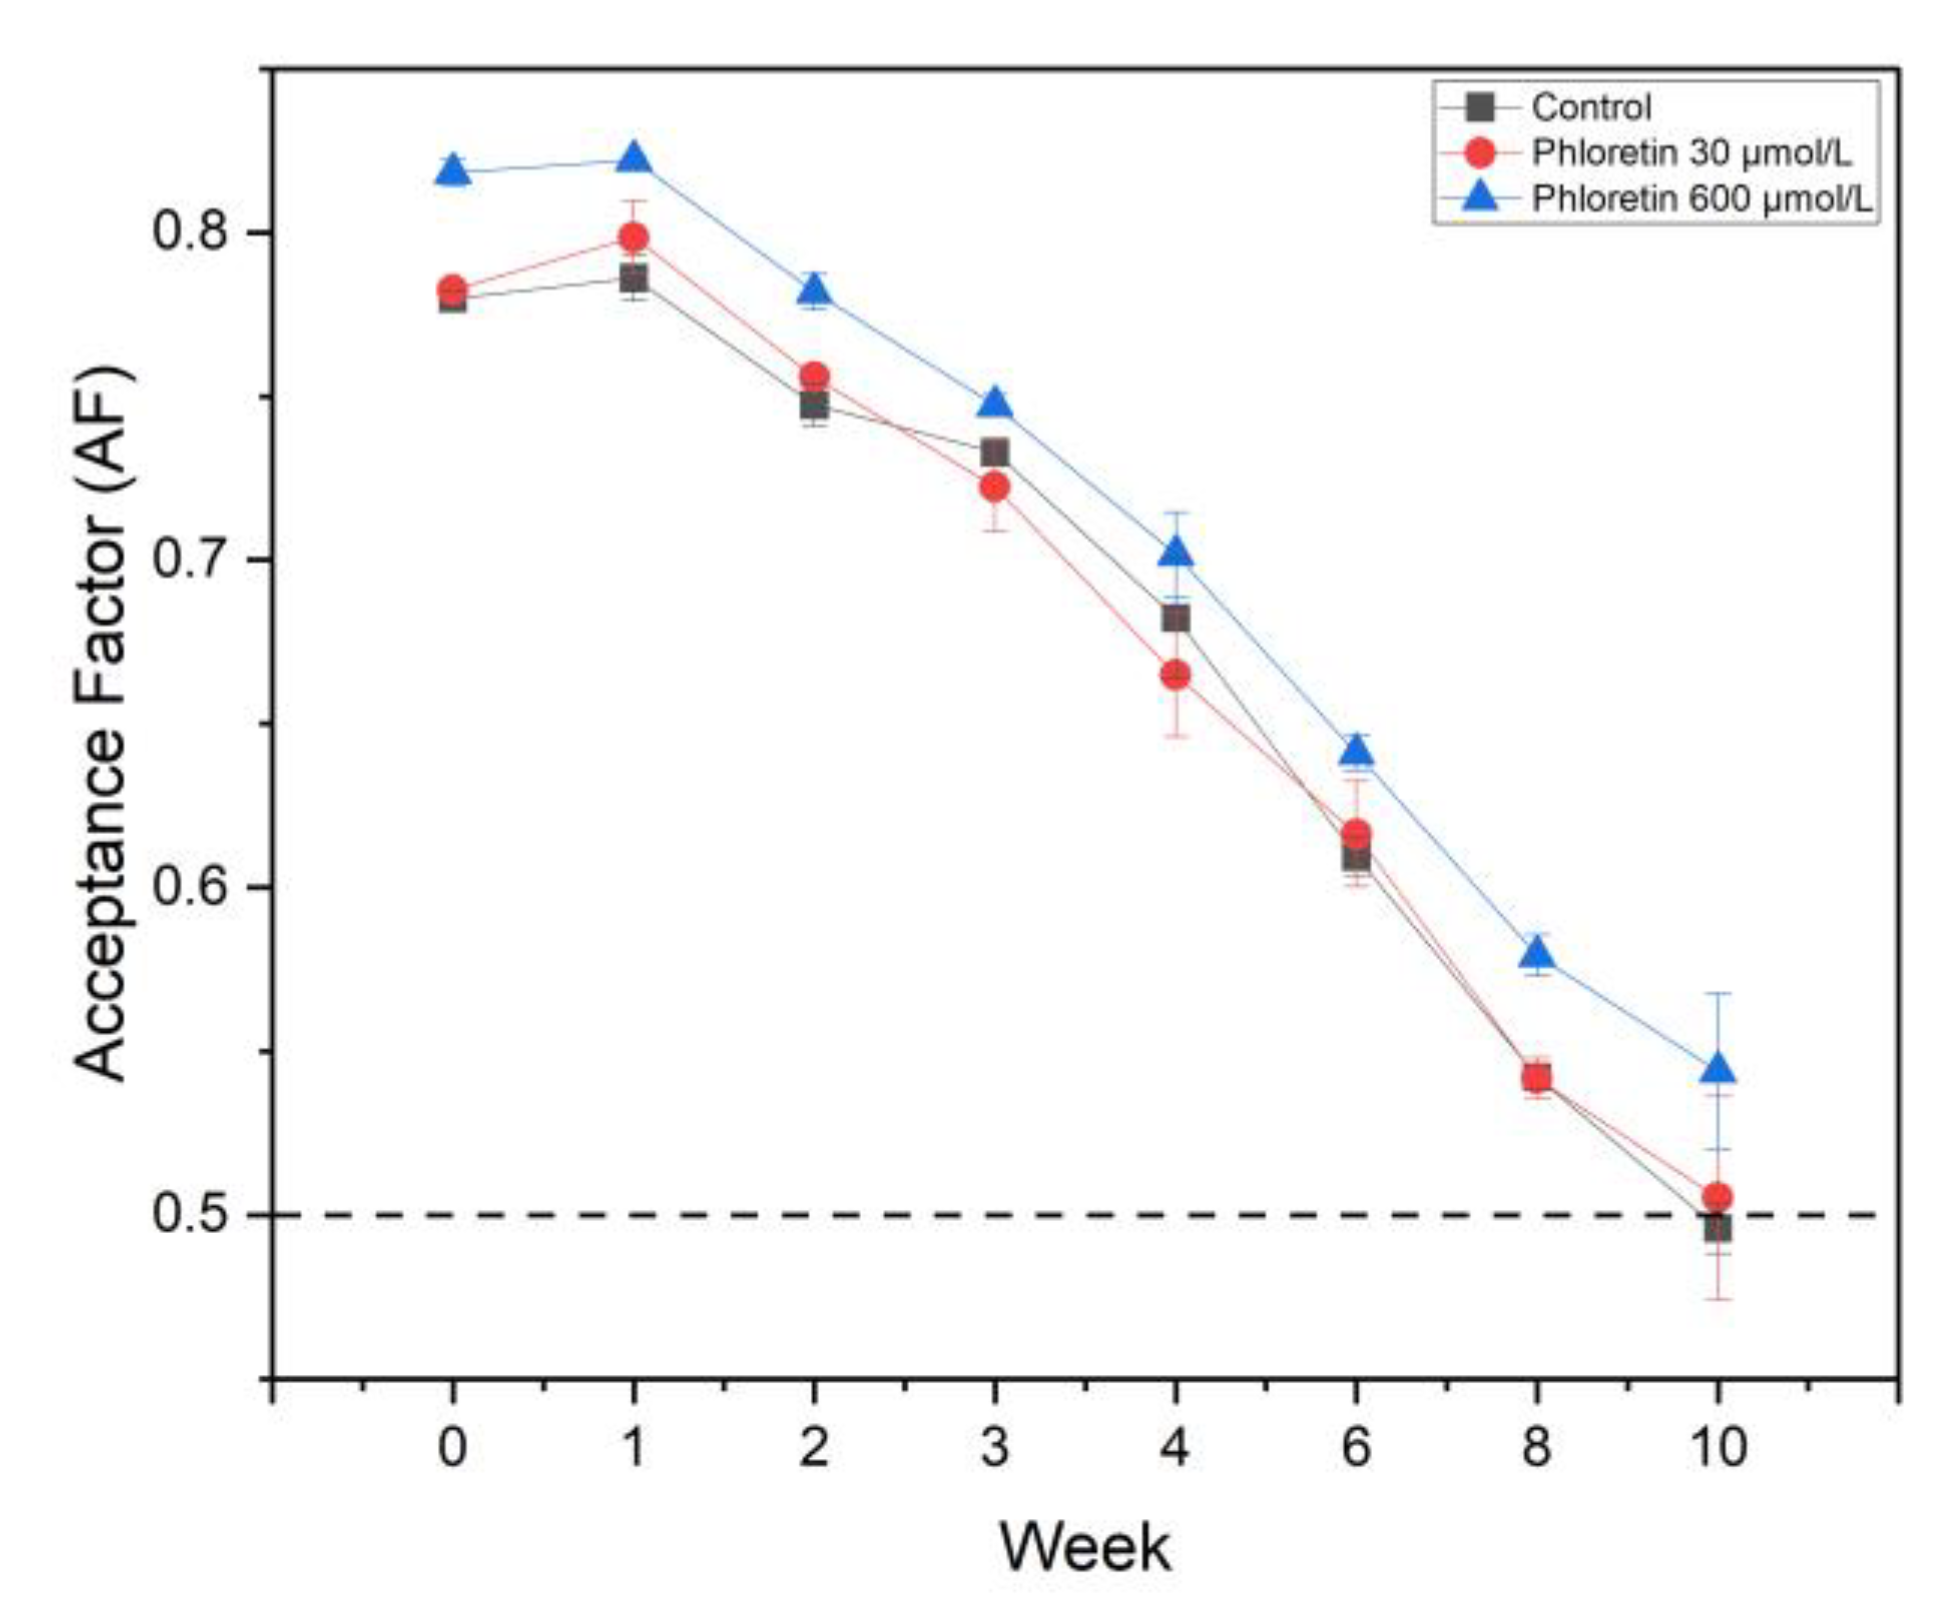
 ) highest stability of lines 190828, 190826, 90886, and 210395, to (
 ) medium stability of cv. Macheraus Marieva, cv Zuckererdbeere Sotschi, cv. Dreistetten, and cv. Diamante, and (
 ) lowest stability of line 90677 and cv. Elsanta.
) highest stability of lines 190828, 190826, 90886, and 210395, to () medium stability of cv. Macheraus Marieva, cv Zuckererdbeere Sotschi, cv. Dreistetten, and cv. Diamante, and () lowest stability of line 90677 and cv. Elsanta.
) lowest stability of line 90677 and cv. Elsanta.
) highest stability of lines 190828, 190826, 90886, and 210395, to () medium stability of cv. Macheraus Marieva, cv Zuckererdbeere Sotschi, cv. Dreistetten, and cv. Diamante, and () lowest stability of line 90677 and cv. Elsanta.

| FaPPO | Tyramine (470 nm) | Dopamine (465 nm) | L-DOPA (475 nm) | Cathechol (400 nm) | Catechin (440 nm) | Chlorogenic Acid (400 nm) | Phloretin (455 nm) |
|---|---|---|---|---|---|---|---|
| 1 | 1 | 0.2 | 0.1 | 0.2 | 0.2 | 0.5 | 1 |
| 2 | 1 | 0.2 | 0.1 | 0.2 | 0.2 | 0.5 | 1 |
| 4 | 3 | 1 | 1 | 1 | 1 | 2.5 | 3 |
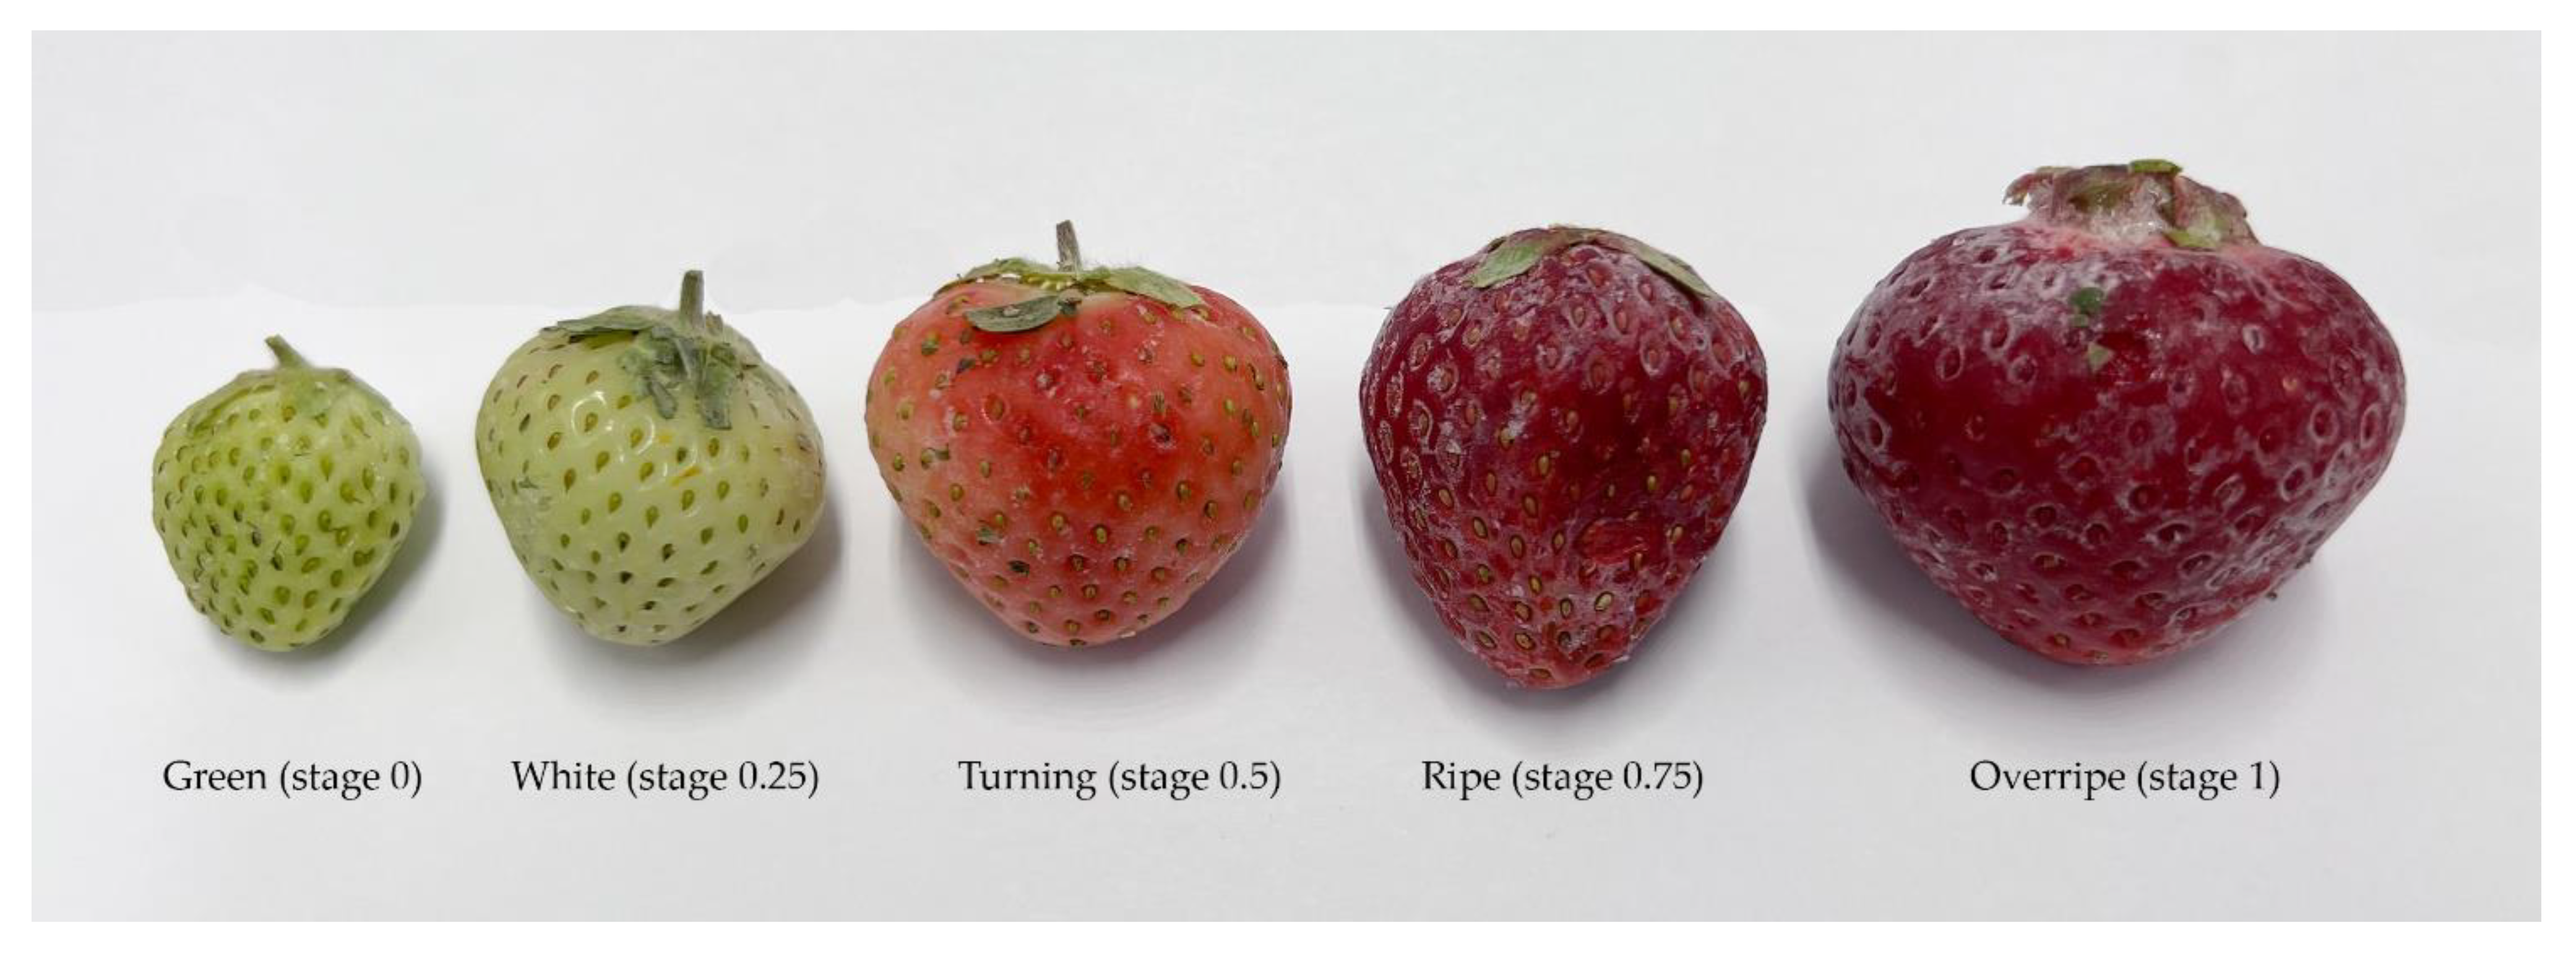
| Stage | Code | Height (mm) | Width (mm) | Weight (g) |
|---|---|---|---|---|
| Green | 0 | 20.3 | 10.8 | 2.9 |
| White | 0.25 | 20.6 | 20.3 | 7.7 |
| Turning | 0.50 | 20.9 | 20.9 | 12.2 |
| Ripe | 0.75 | 30.9 | 20.9 | 13.6 |
| Overripe | 1.00 | 30.0 | 40.0 | 22.2 |
| Substrate | Structure | PPO | kcat (s−1) | KM (mM) | kcat/KM (s−1 mM−1) |
|---|---|---|---|---|---|
| Tyramine |  | 1 2 4 | 42 ± 1 32.0 ± 0.4 142 ± 20 | 0.5 ± 0.1 0.6 ± 0.1 1.3 ± 0.1 | 85 ± 7 54 ± 4 244 ± 45 |
| Dopamine |  | 1 2 4 | 502 ± 18 384 ± 14 125 ± 0.4 | 0.6 ± 0.1 0.95 ± 0.12 0.99 ± 0.11 | 827 ± 94 406 ± 39 125 ± 31 |
| L-DOPA | 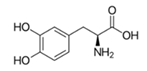 | 1 2 4 | 468 ± 8 460 ± 7 30 ± 0.2 | 2 ± 0.4 5.7 ± 1.9 3.2 ± 1.6 | 187 ± 47 97 ± 42 17.4 ± 1.5 |
| Catechol |  | 1 2 4 | 1086 ± 7 827 ± 27 681 ± 10 | 27 ± 2 7.5 ± 0.6 39 ± 12 | 292 ± 10 111 ± 7 25 ± 10 |
| Catechin | 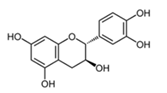 | 1 2 4 | 176 ± 11 146 ± 4 142 ± 20 | 0.12 ± 0.03 0.19 ± 0.04 0.87 ± 0.08 | 1510 ± 367 772 ± 59 165 ± 11 |
| Chloro-genic acid |  | 1 2 4 | 352 ± 20 198 ± 10 82 ± 1 | 2.7 ± 0.4 1.3 ± 0.2 1.3 ± 0.2 | 130 ± 67 153 ± 59 64 ± 5 |
| Phloretin | 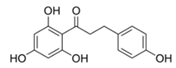 | 1 2 4 | 13.5 ± 0.4 1 35 ± 8 2 - 3 | 0.082 ± 0.004 1 0.6 ± 0.4 2 - 3 | 165 ± 5 1 55 ± 18 2 - 3 |
Disclaimer/Publisher’s Note: The statements, opinions and data contained in all publications are solely those of the individual author(s) and contributor(s) and not of MDPI and/or the editor(s). MDPI and/or the editor(s) disclaim responsibility for any injury to people or property resulting from any ideas, methods, instructions or products referred to in the content. |
© 2025 by the authors. Licensee MDPI, Basel, Switzerland. This article is an open access article distributed under the terms and conditions of the Creative Commons Attribution (CC BY) license (https://creativecommons.org/licenses/by/4.0/).
Share and Cite
Zavarise, A.; Rabeeah, I.; Molitor, C.; Davoudi Pahnekolayi, M.; Gruber-Schmidt, V.; Winter, A.; Olbricht, K.; Haselmair-Gosch, C.; Stich, K.; Goessinger, M.; et al. Gene Expression and Enzyme Kinetics of Polyphenol Oxidases in Strawberry and Their Possible Involvement in Enzymatic Browning Reactions in Strawberry Nectar. Foods 2025, 14, 2064. https://doi.org/10.3390/foods14122064
Zavarise A, Rabeeah I, Molitor C, Davoudi Pahnekolayi M, Gruber-Schmidt V, Winter A, Olbricht K, Haselmair-Gosch C, Stich K, Goessinger M, et al. Gene Expression and Enzyme Kinetics of Polyphenol Oxidases in Strawberry and Their Possible Involvement in Enzymatic Browning Reactions in Strawberry Nectar. Foods. 2025; 14(12):2064. https://doi.org/10.3390/foods14122064
Chicago/Turabian StyleZavarise, Alberto, Ibrahim Rabeeah, Christian Molitor, Mahboubeh Davoudi Pahnekolayi, Viktoria Gruber-Schmidt, Andrea Winter, Klaus Olbricht, Christian Haselmair-Gosch, Karl Stich, Manfred Goessinger, and et al. 2025. "Gene Expression and Enzyme Kinetics of Polyphenol Oxidases in Strawberry and Their Possible Involvement in Enzymatic Browning Reactions in Strawberry Nectar" Foods 14, no. 12: 2064. https://doi.org/10.3390/foods14122064
APA StyleZavarise, A., Rabeeah, I., Molitor, C., Davoudi Pahnekolayi, M., Gruber-Schmidt, V., Winter, A., Olbricht, K., Haselmair-Gosch, C., Stich, K., Goessinger, M., & Halbwirth, H. (2025). Gene Expression and Enzyme Kinetics of Polyphenol Oxidases in Strawberry and Their Possible Involvement in Enzymatic Browning Reactions in Strawberry Nectar. Foods, 14(12), 2064. https://doi.org/10.3390/foods14122064