
Effects of Konjac Glucomannan and Curdlan on the 3D Printability and Physicochemical Properties of Germinated Brown Rice Gel


Abstract
1. Introduction
2. Materials and Methods
2.1. Preparation of GBR Powder
2.2. Preparation of GBR Gel
2.3. Three-Dimensional Printing Process of GBR Gel
2.4. Evaluation of 3D Printability
2.5. Texture Profile Analysis (TPA)
2.6. Rheological Characterization
2.7. Low-Field Nuclear Magnetic Resonance (LF-NMR)
2.8. Differential Scanning Calorimetry (DSC)
2.9. Fourier-Transform Infrared Spectroscopy (FT-IR)
2.10. Scanning Electron Microscopy (SEM)
2.11. Data Analysis
3. Results and Discussion
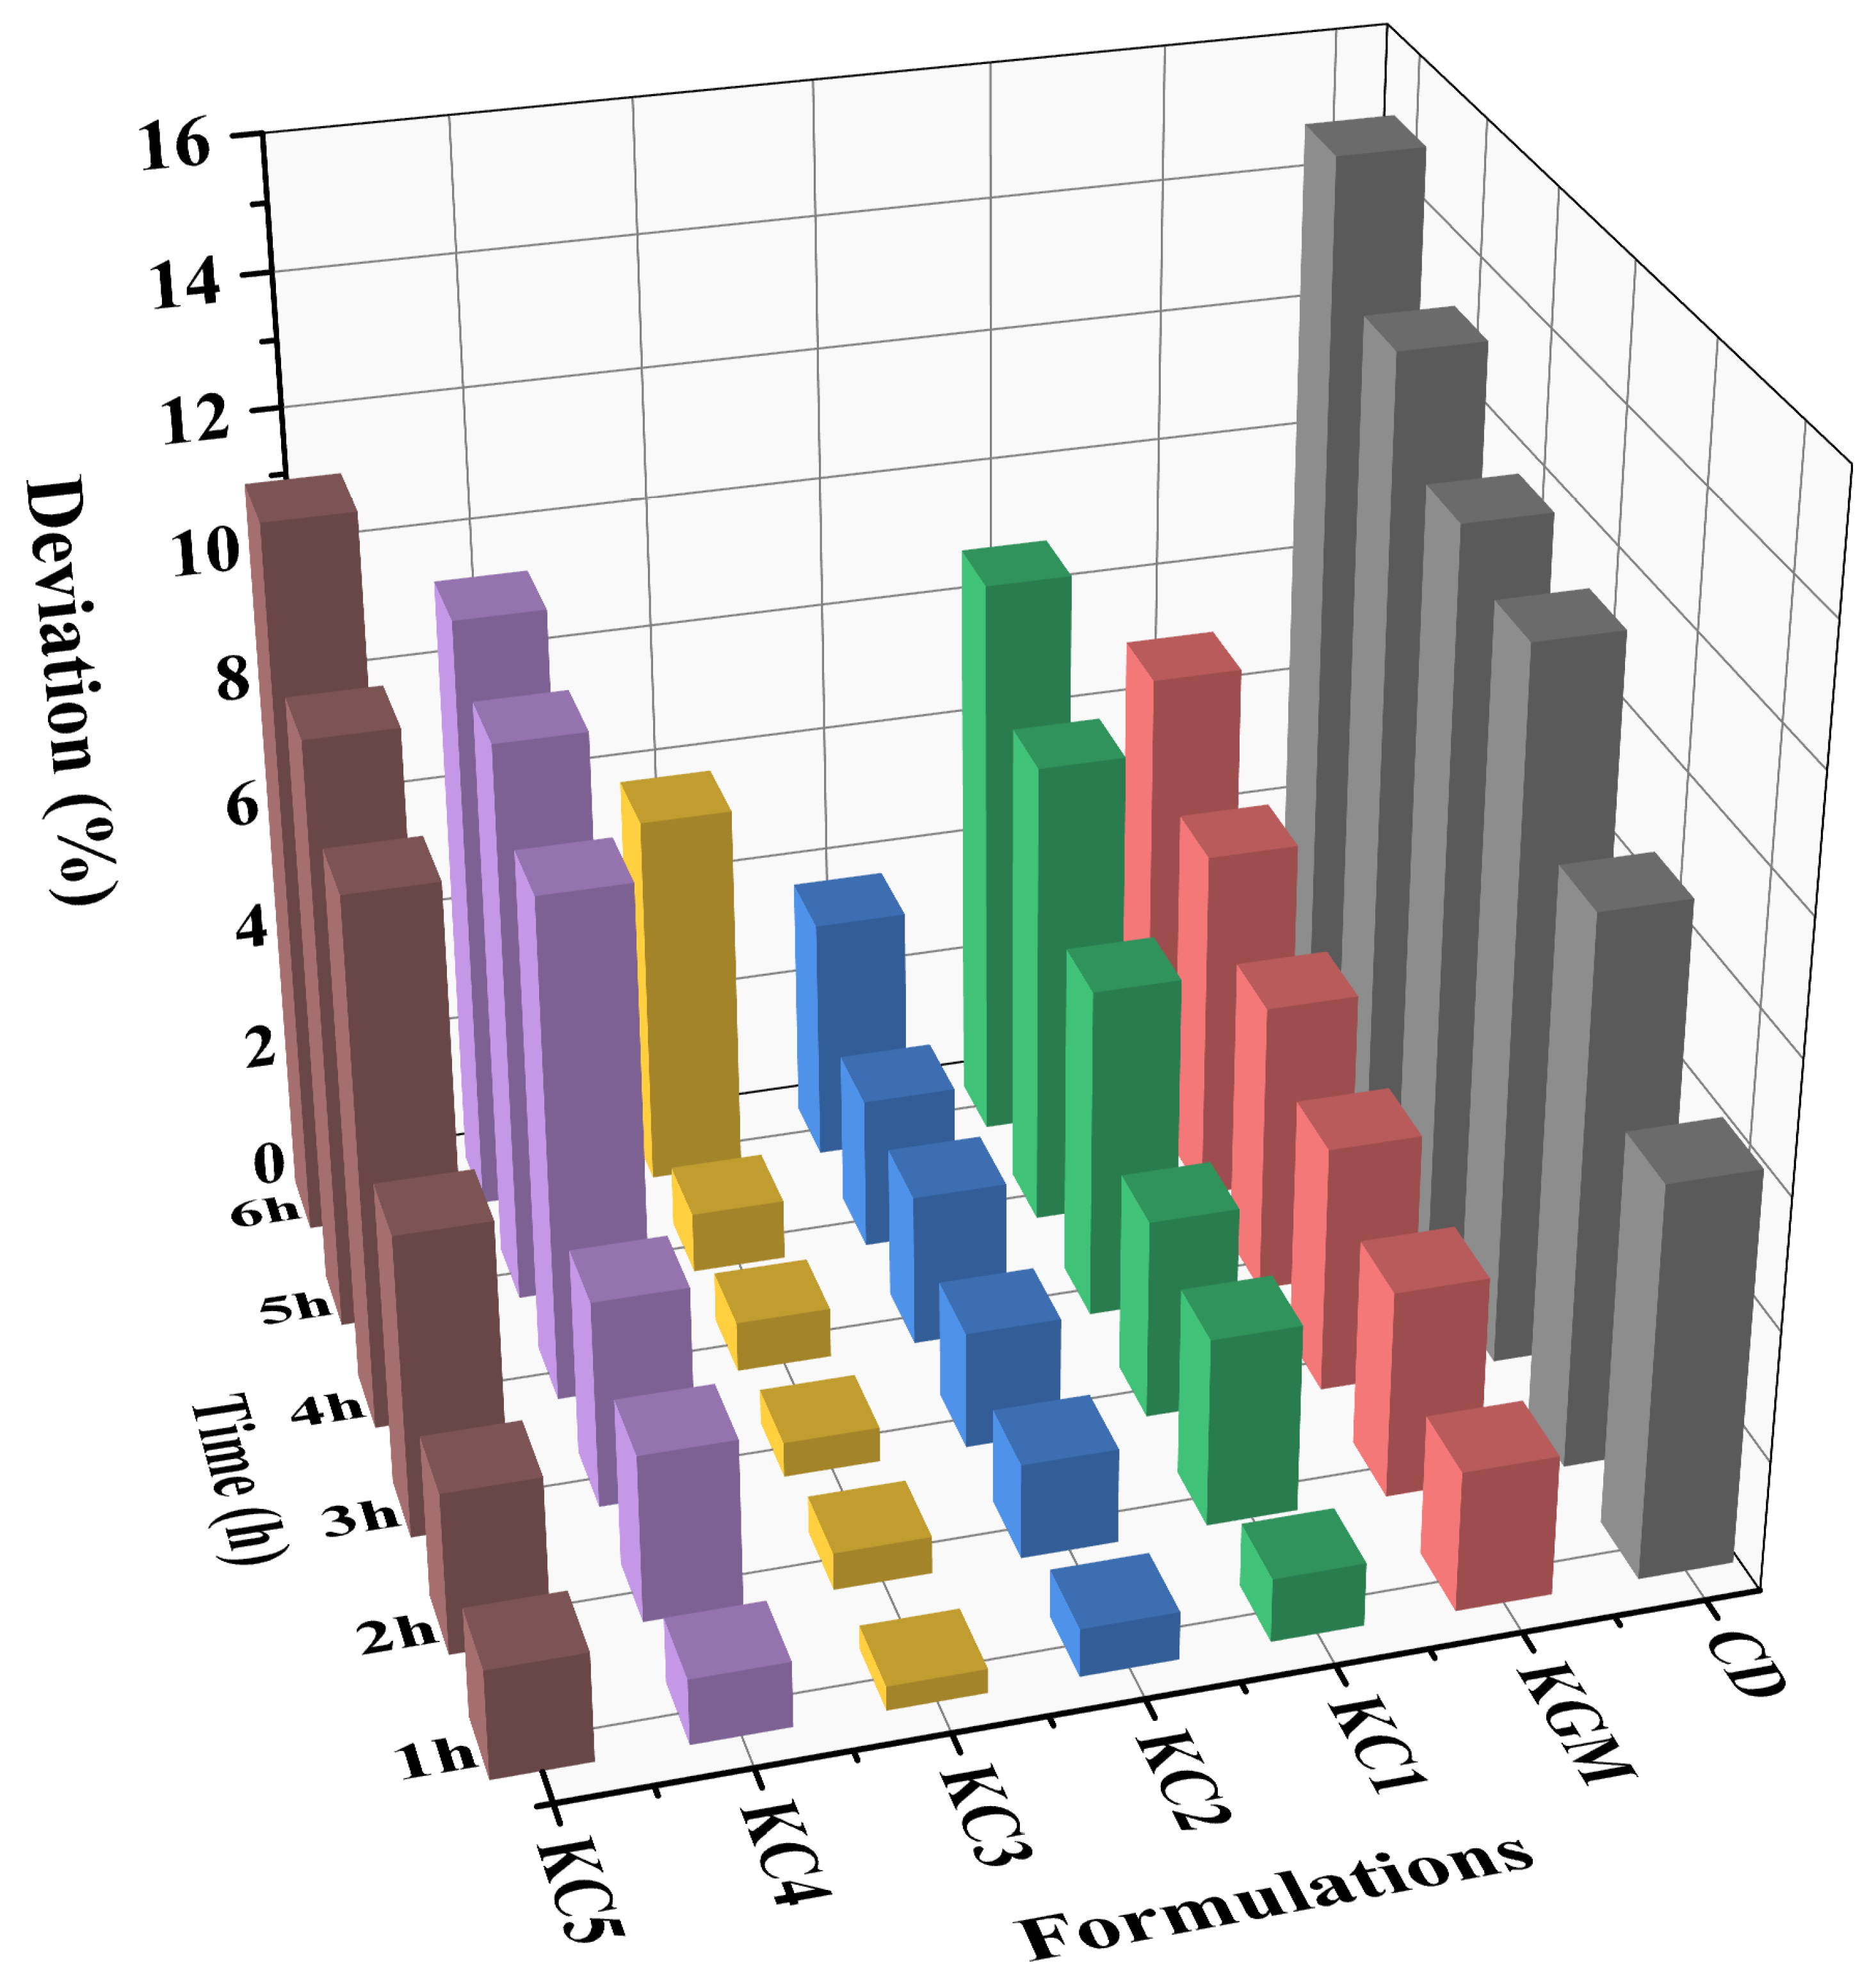
3.1. Evaluation of 3D Printability Performance of GBR Gel
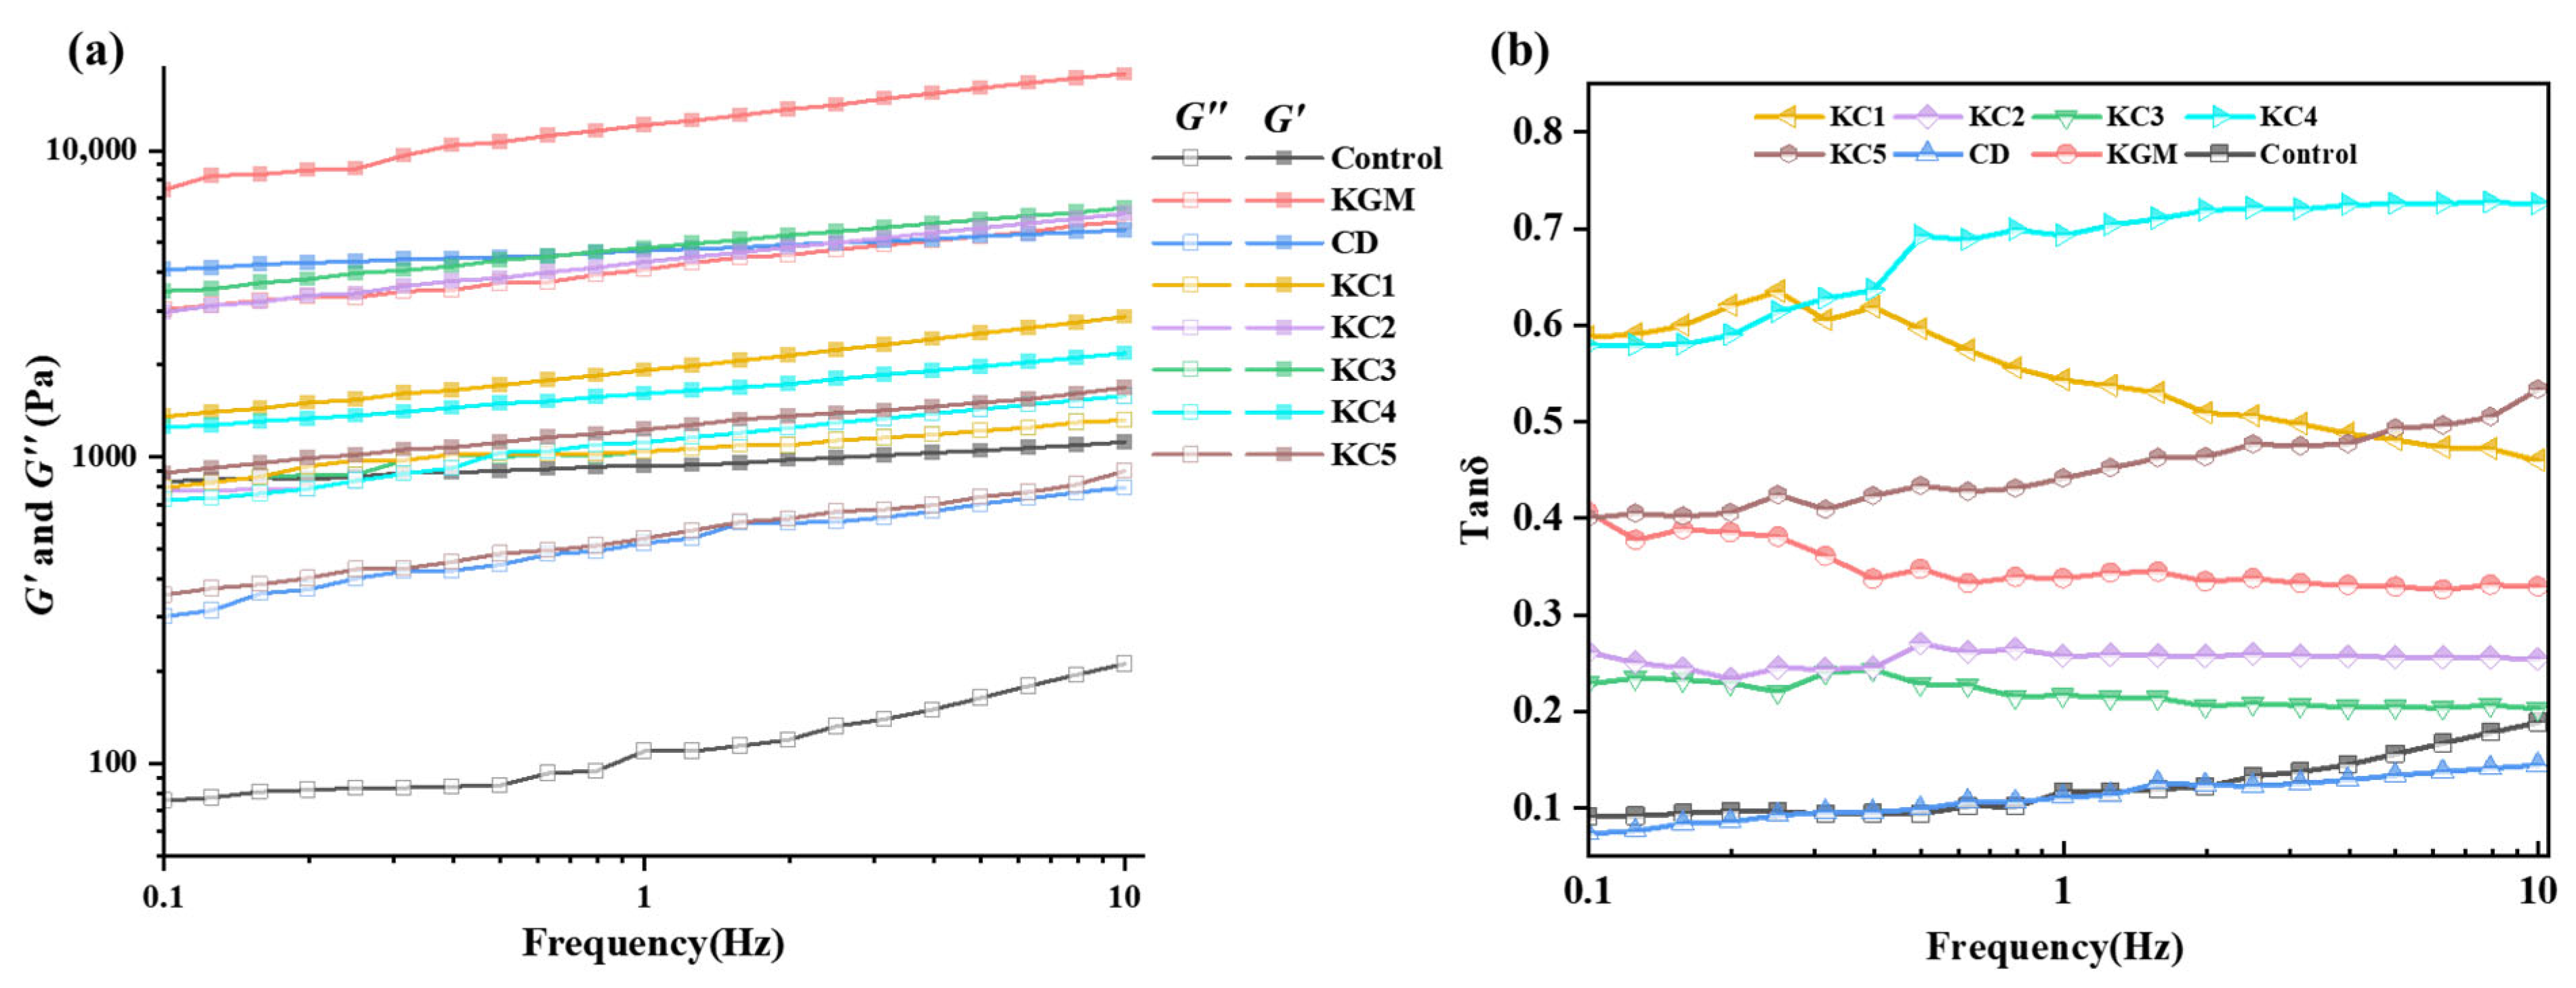
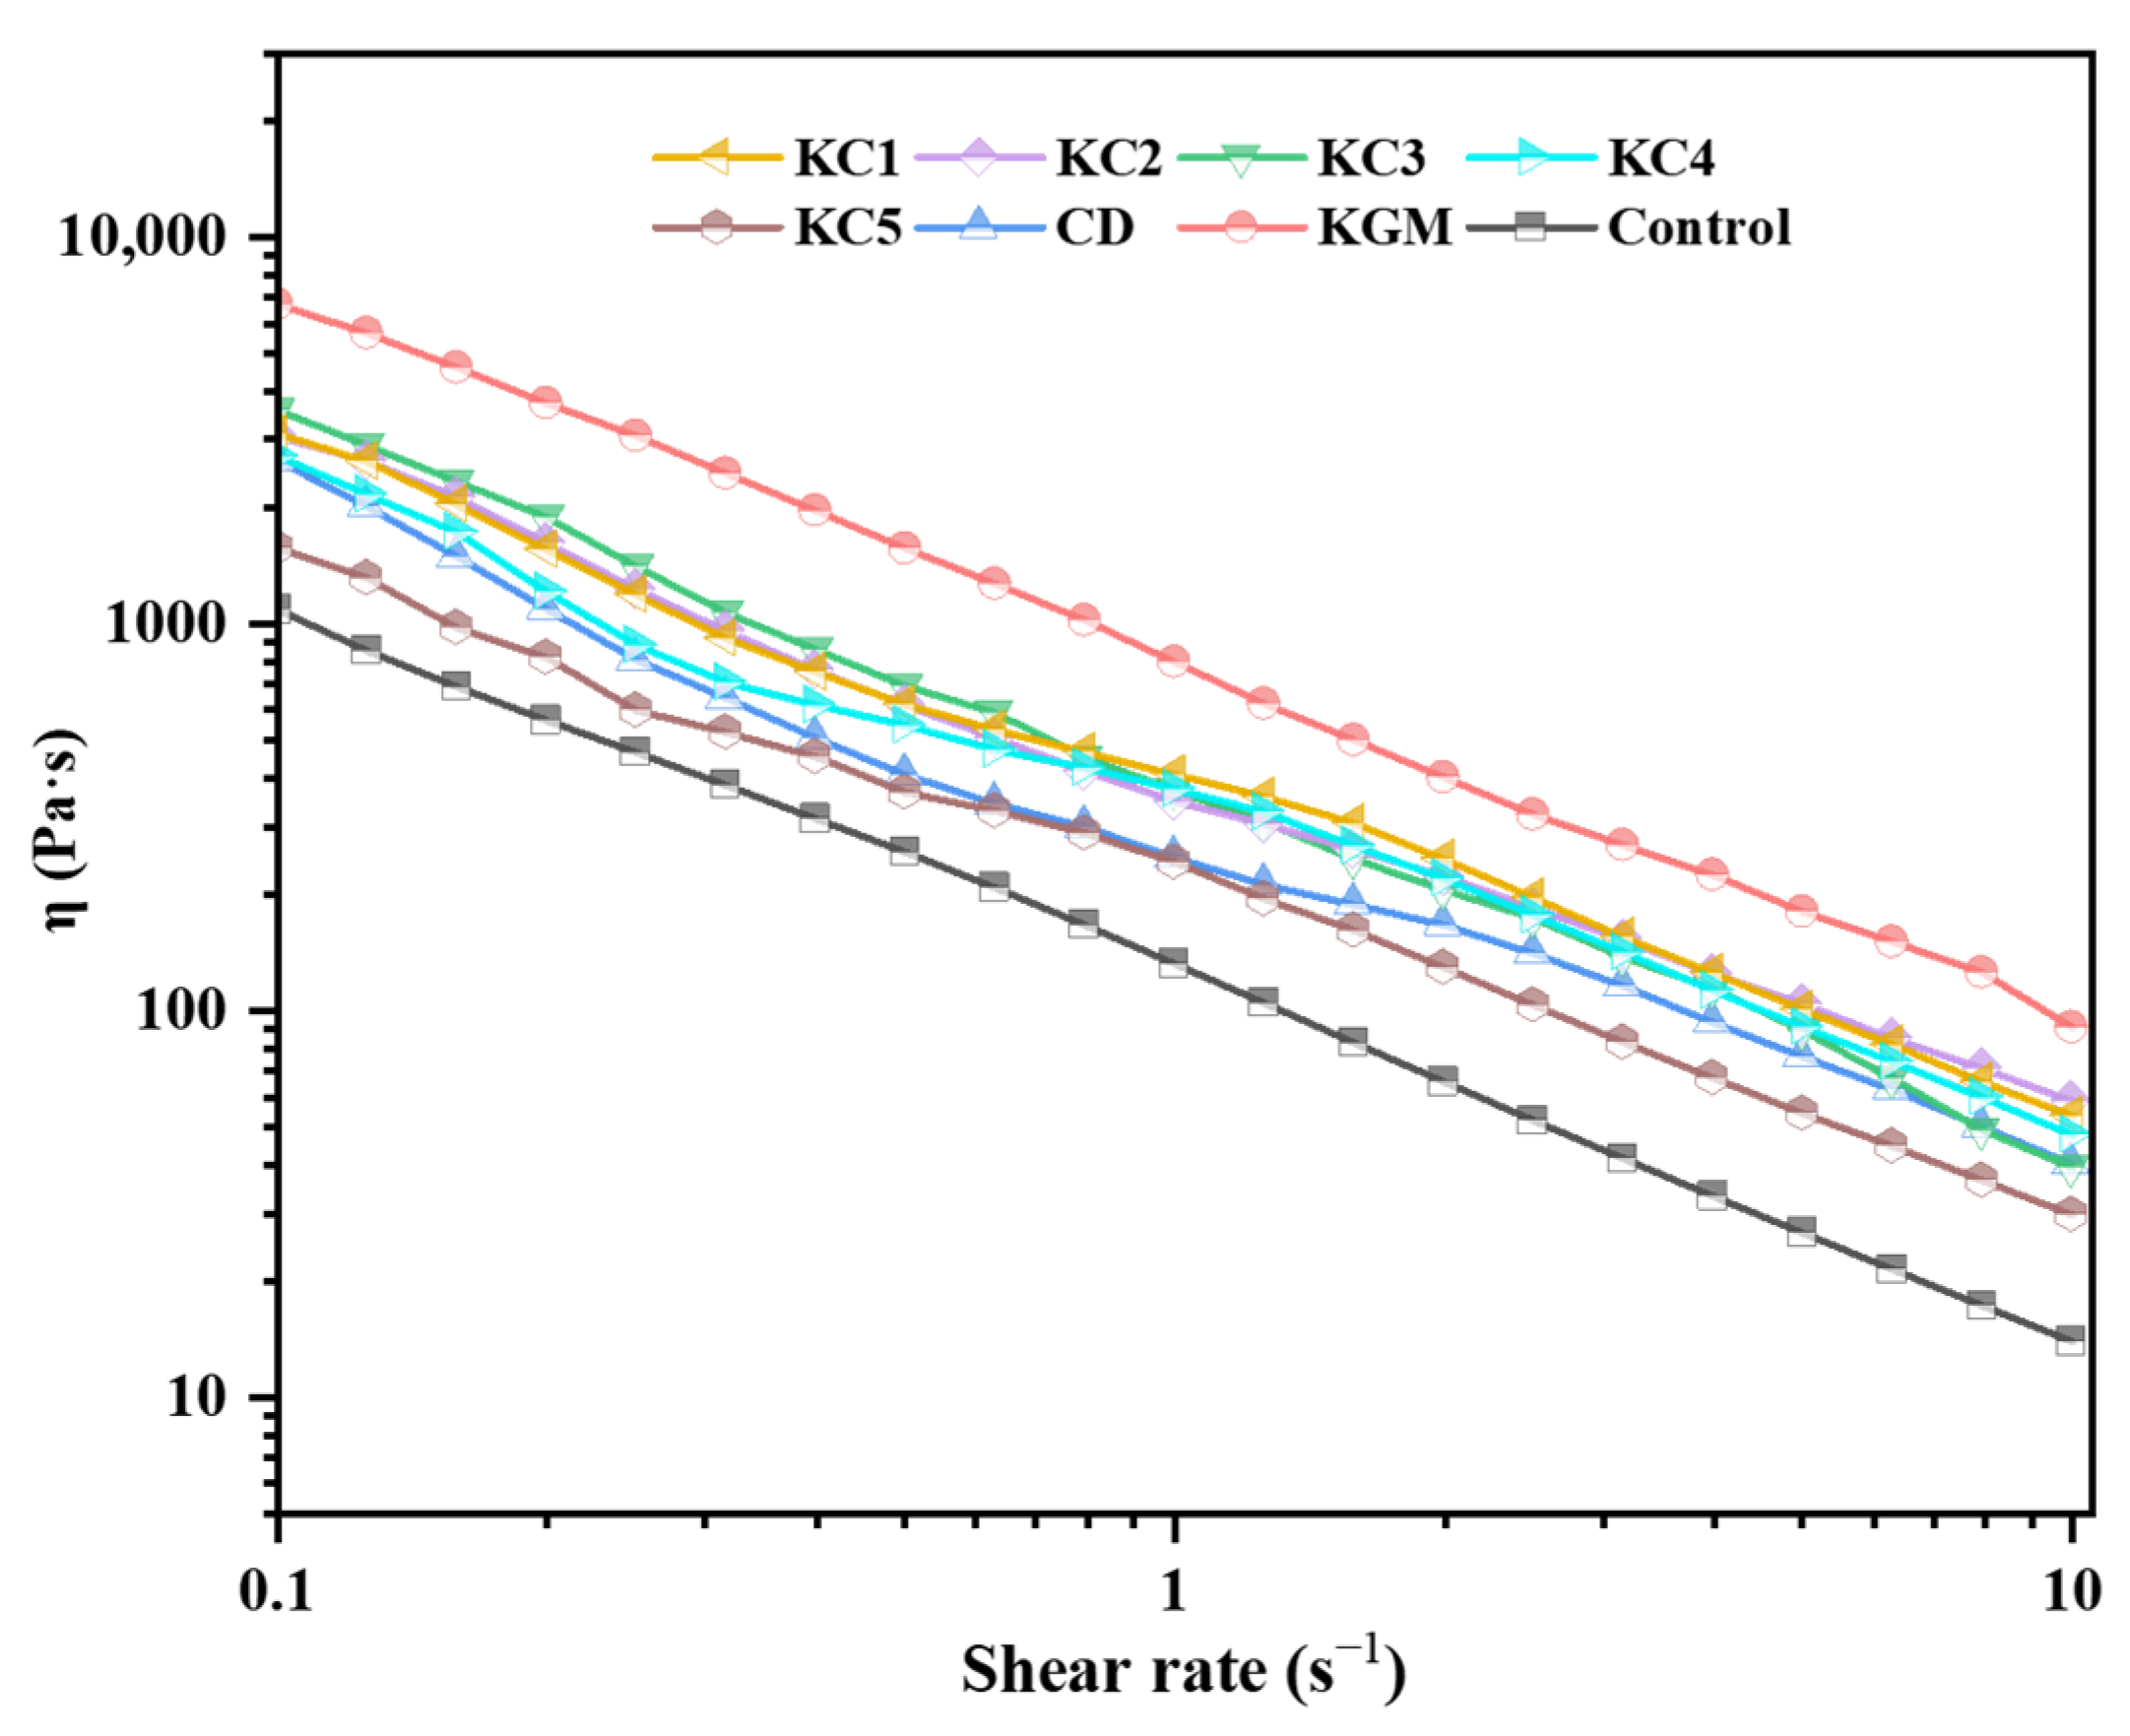
3.2. Analysis of Rheological Properties of GBR Gel
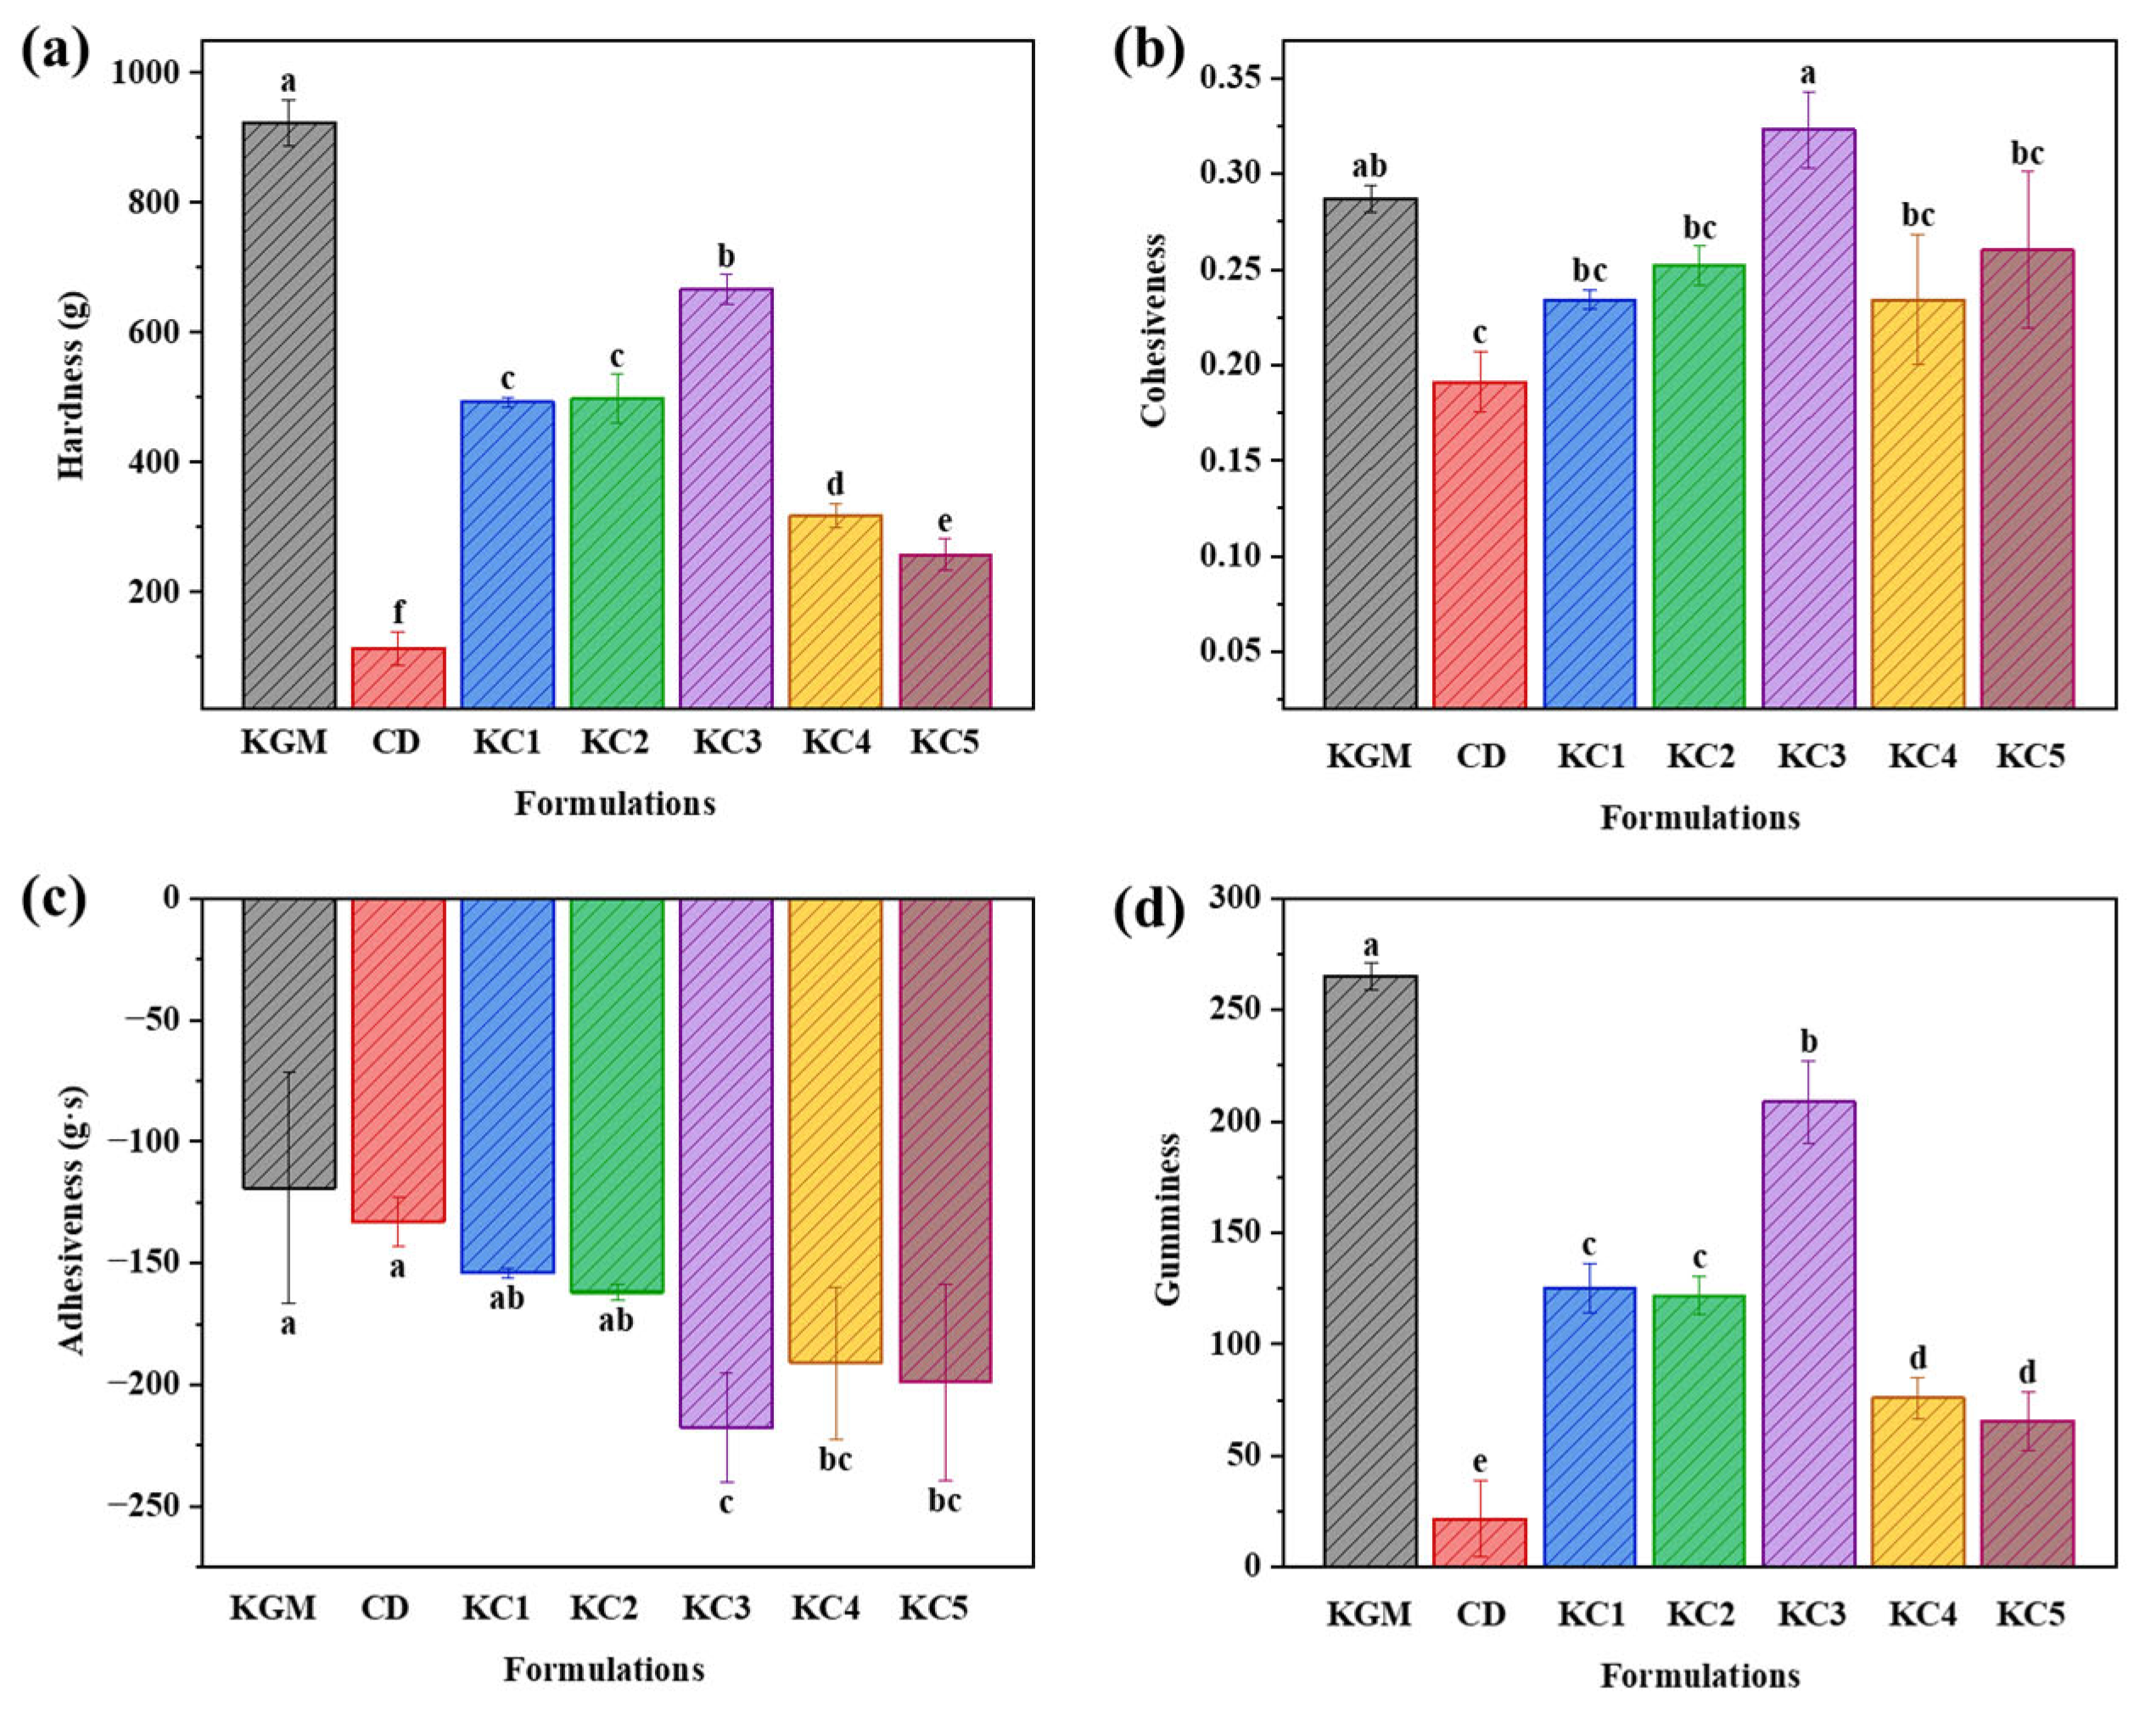
3.3. Texture Properties Analysis of the 3D-Printed Product
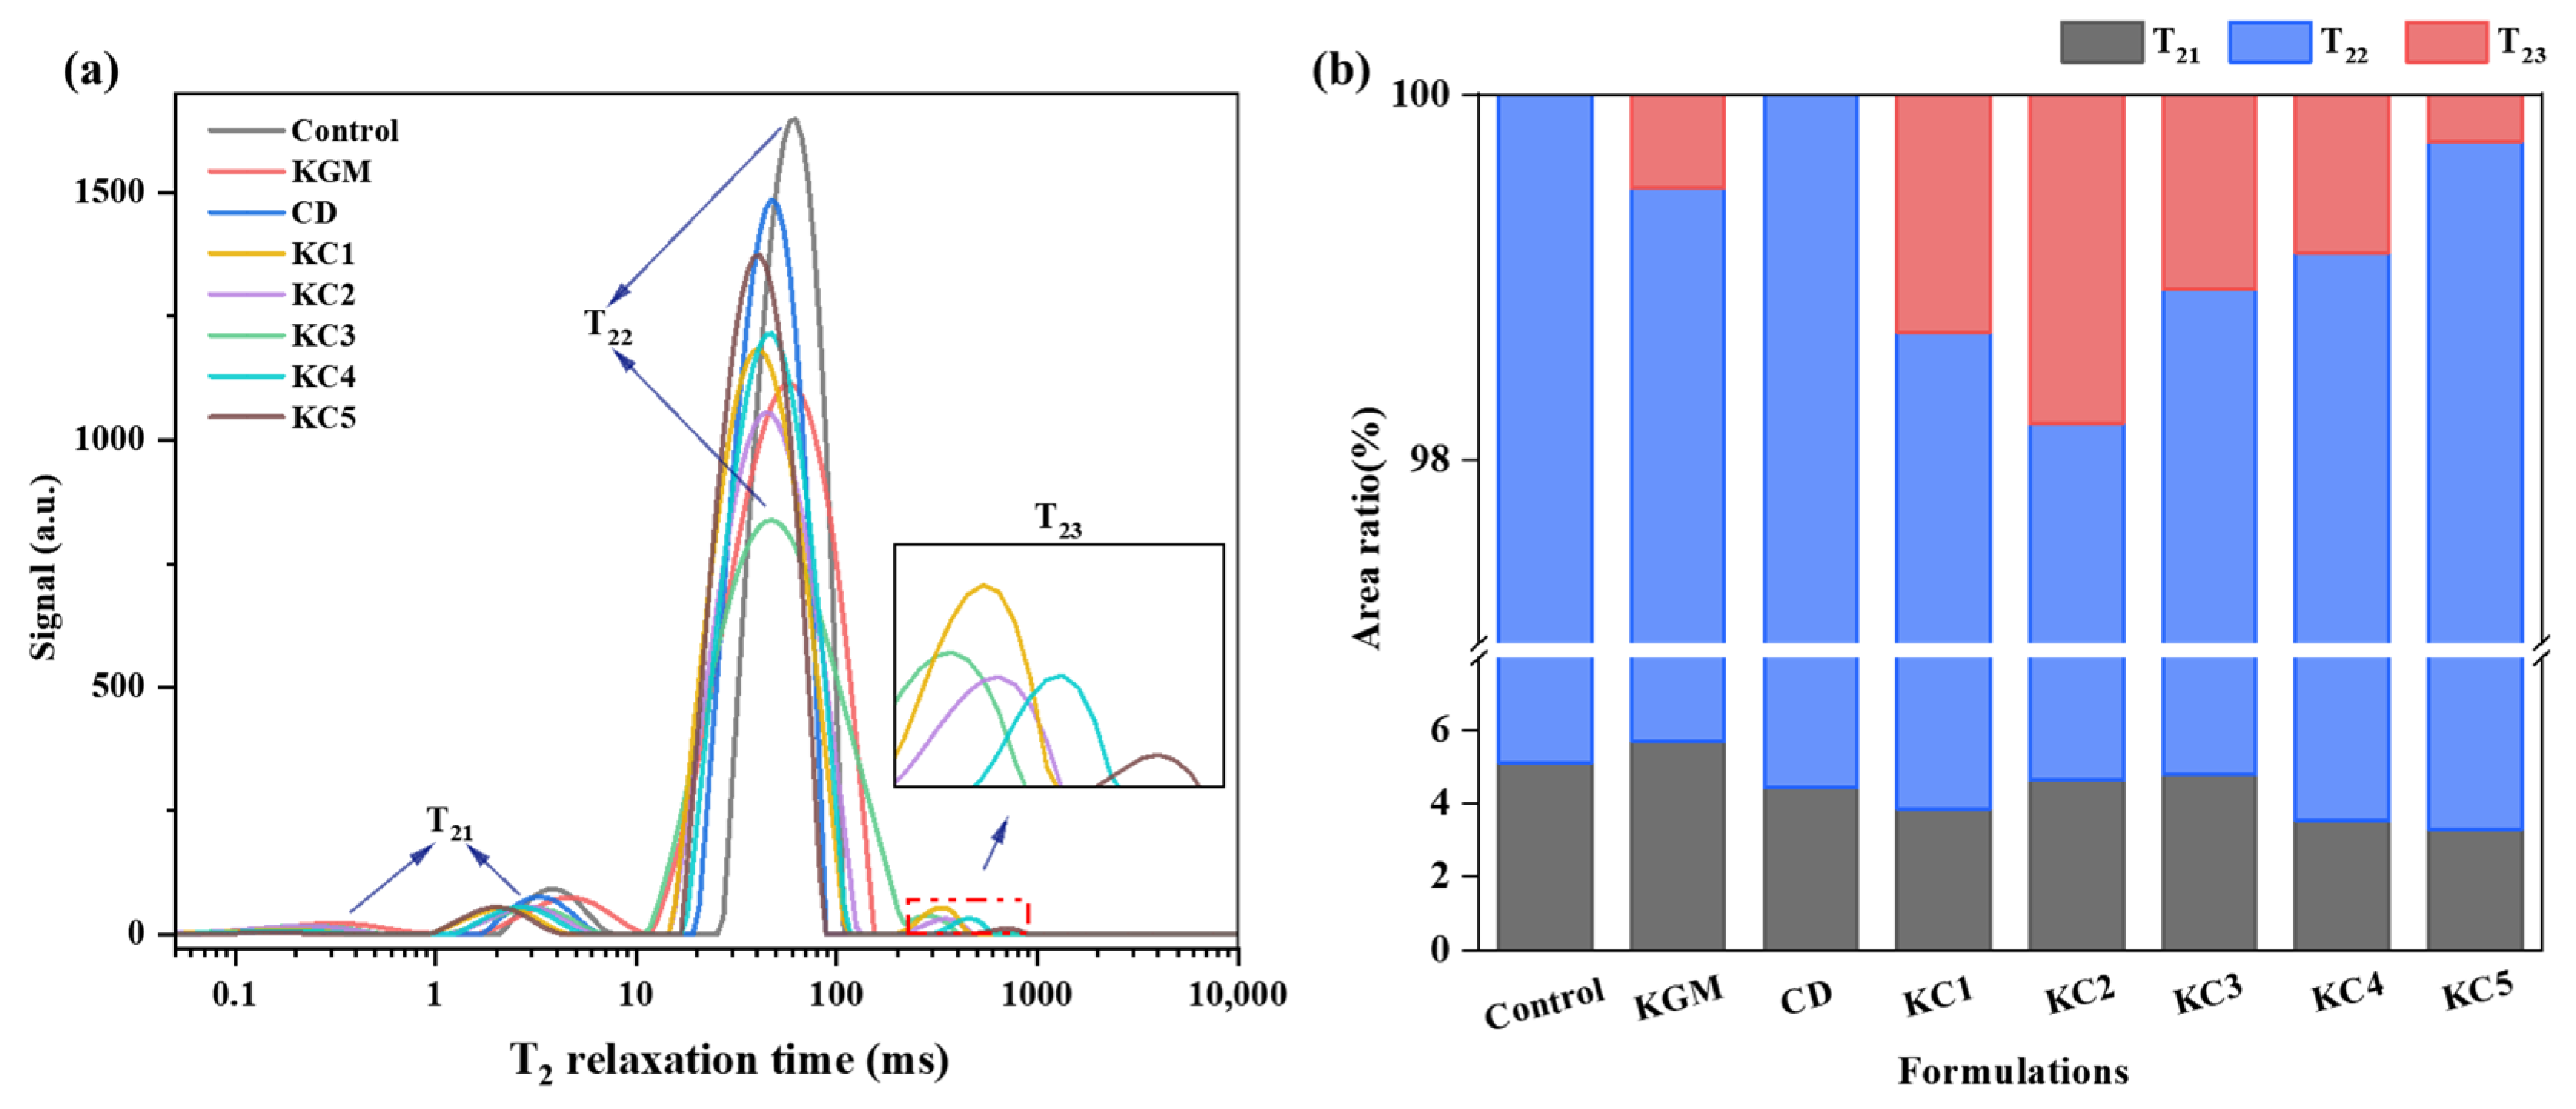
3.4. LF-NMR Analysis of Water Migration and Distribution
3.5. DSC Analysis
3.6. FT-IR Analysis of GBR Gel
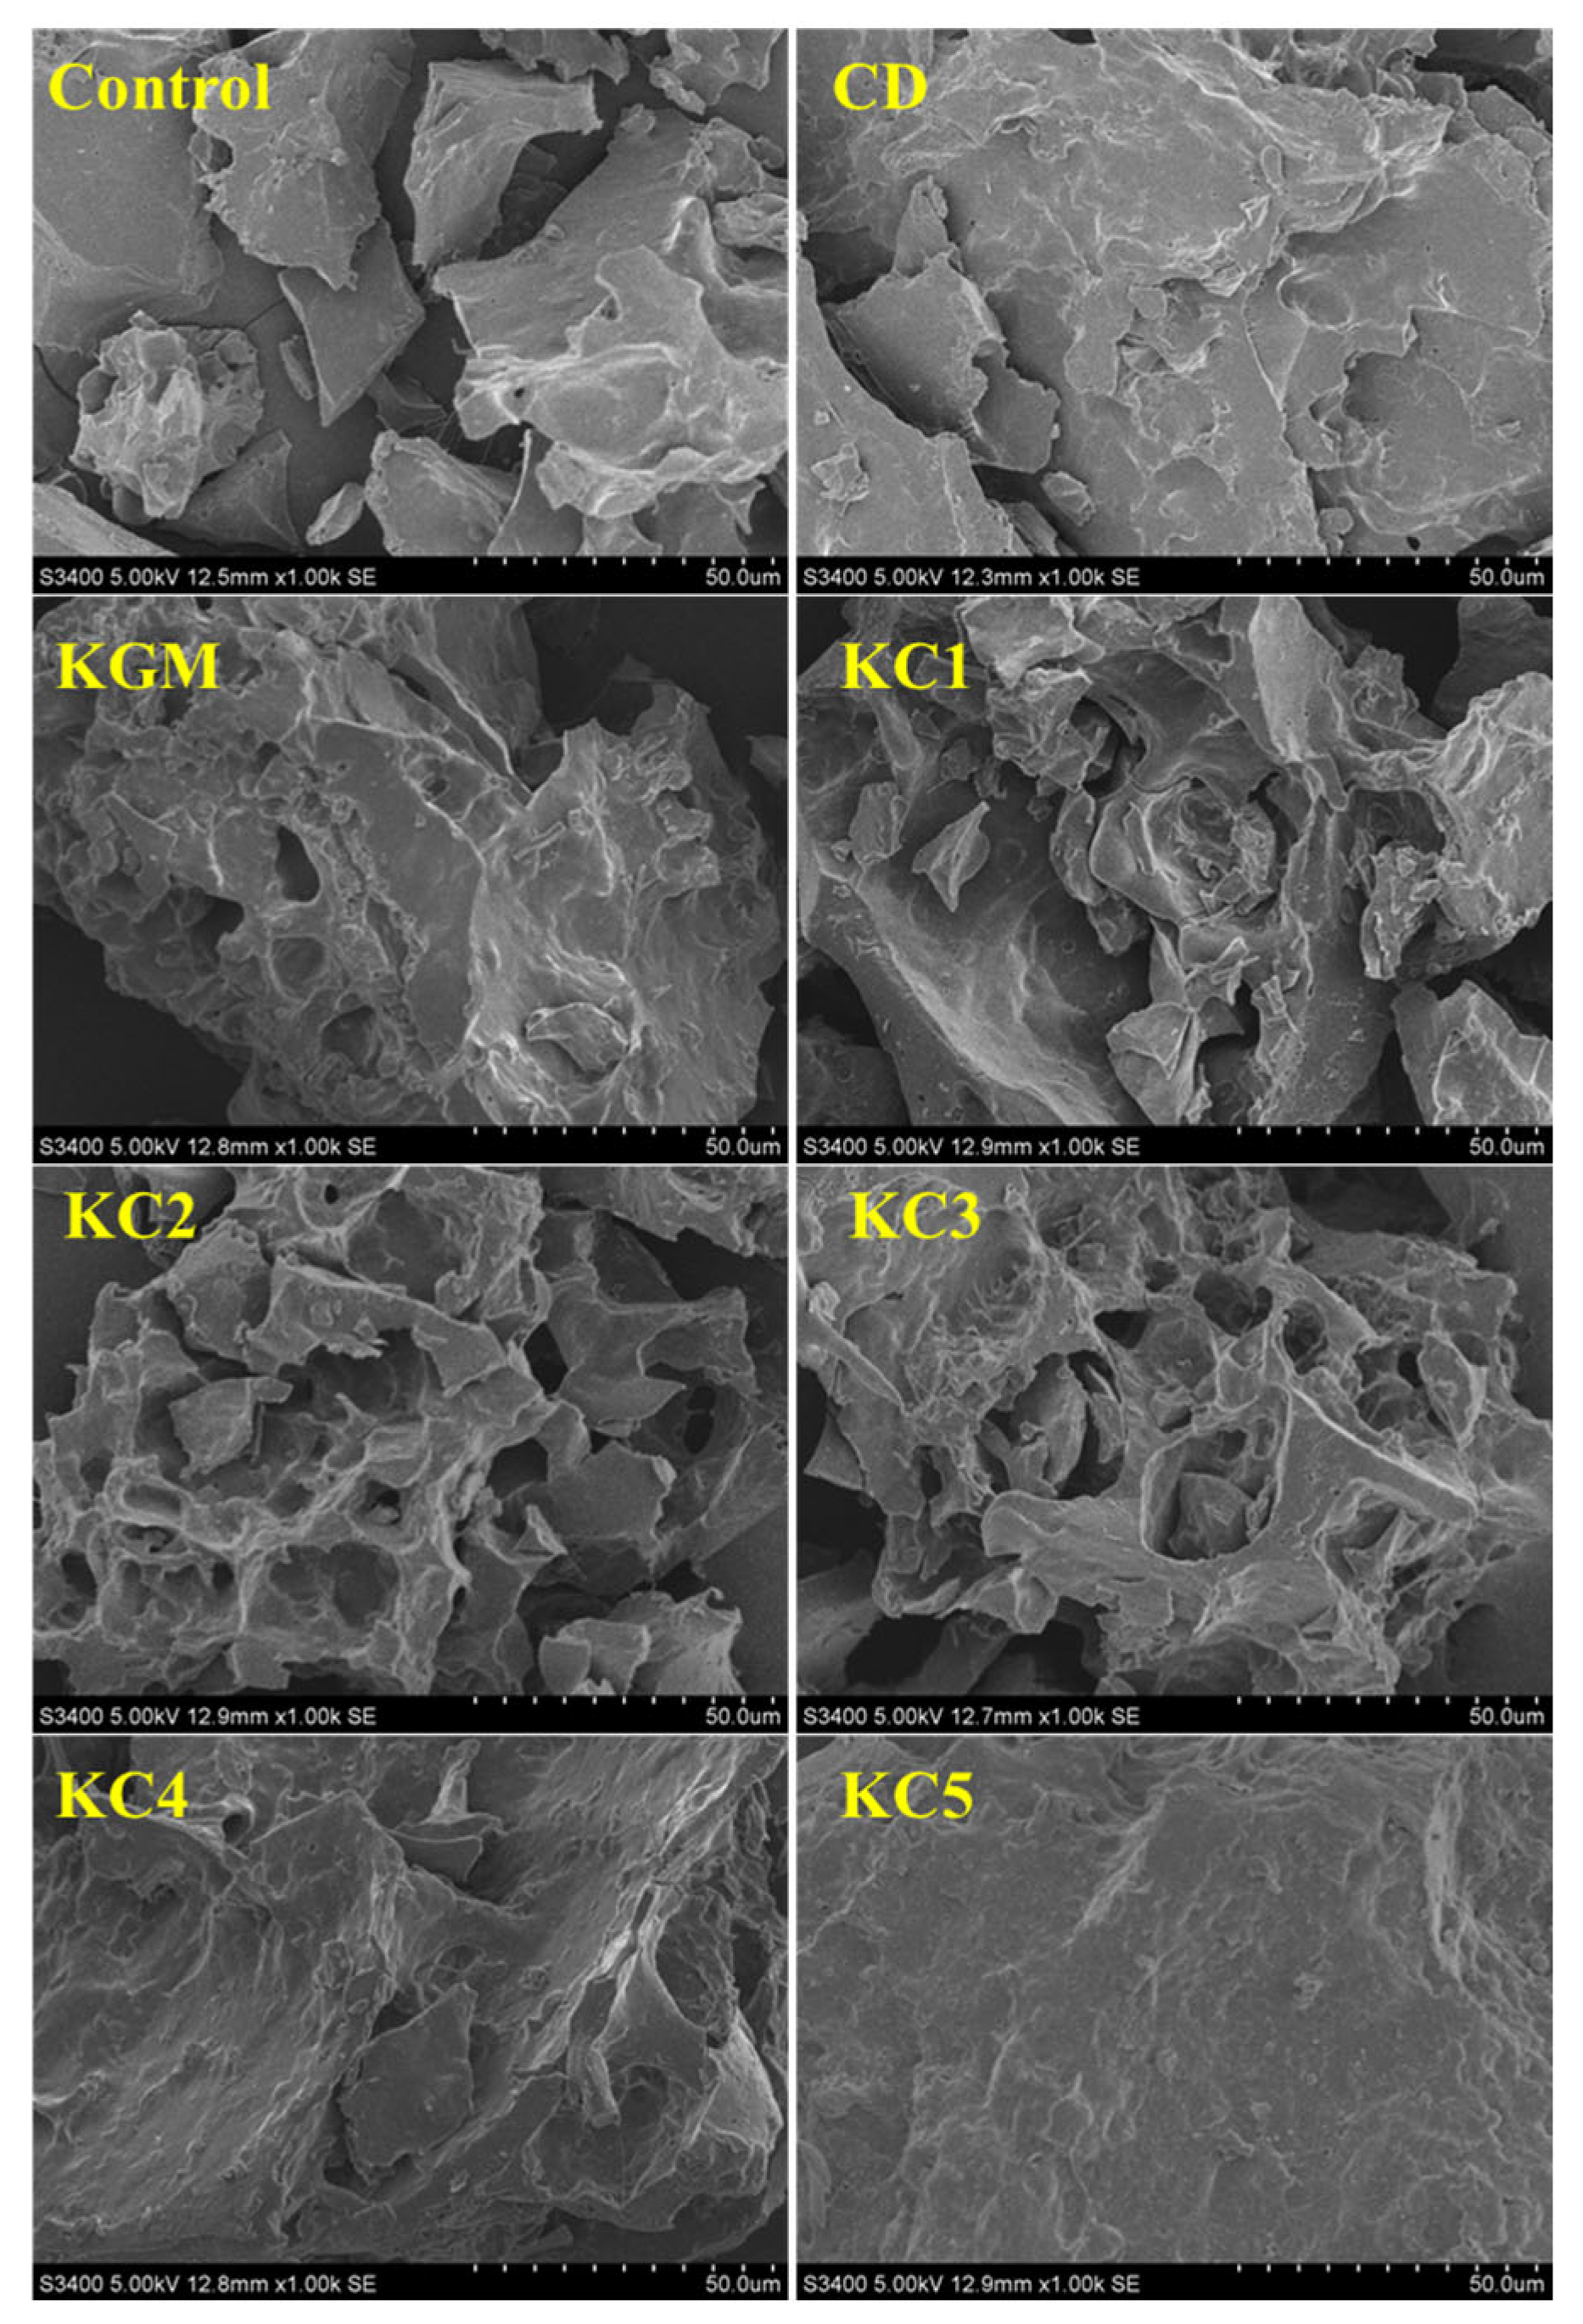
3.7. SEM Analysis
4. Conclusions
Author Contributions
Funding
Institutional Review Board Statement
Informed Consent Statement
Data Availability Statement
Conflicts of Interest
References
- Kuo, C.-C.; Liu, L.-C.; Teng, W.-F.; Chang, H.-Y.; Chien, F.-M.; Liao, S.-J.; Kuo, W.-F.; Chen, C.-M. Preparation of Starch/Acrylonitrile-Butadiene-Styrene Copolymers (ABS) Biomass Alloys and Their Feasible Evaluation for 3D Printing Applications. Compos. Part B Eng. 2016, 86, 36–39. [Google Scholar] [CrossRef]
- Feng, C.; Zhang, M.; Bhandari, B.; Wang, Y.; Wang, B. Improvement of 3D Printing Properties of Rose-Sodium Alginate Heterogeneous Gel by Adjusting Rose Material. J. Food Process Eng. 2021, 44, e13583. [Google Scholar] [CrossRef]
- Cheng, Y.; Yuqing, H.; Xiao, L.; Gao, W.; Kang, X.; Sui, J.; Cui, B. Impact of Starch Amylose and Amylopectin on the Rheological and 3D Printing Properties of Cornstarch. Int. J. Biol. Macromol. 2024, 278, 134403. [Google Scholar] [CrossRef]
- Shen, L.; Zhu, Y.; Liu, C.; Wang, L.; Liu, H.; Kamruzzaman, M.; Liu, C.; Zhang, Y.; Zheng, X. Modelling of Moving Drying Process and Analysis of Drying Characteristics for Germinated Brown Rice under Continuous Microwave Drying. Biosyst. Eng. 2020, 195, 64–88. [Google Scholar] [CrossRef]
- Kim, H.W.; Bae, H.; Park, H.J. Reprint of: Classification of the Printability of Selected Food for 3D Printing: Development of an Assessment Method Using Hydrocolloids as Reference Material. J. Food Eng. 2018, 220, 28–37. [Google Scholar] [CrossRef]
- Patil, S.B.; Khan, M.K. Germinated Brown Rice as a Value Added Rice Product: A Review. J. Food Sci. Technol. 2011, 48, 661–667. [Google Scholar] [CrossRef]
- Hou, D.; Tang, J.; Feng, Q.; Niu, Z.; Shen, Q.; Wang, L.; Zhou, S. Gamma-Aminobutyric Acid (GABA): A Comprehensive Review of Dietary Sources, Enrichment Technologies, Processing Effects, Health Benefits, and Its Applications. Crit. Rev. Food Sci. Nutr. 2024, 64, 8852–8874. [Google Scholar] [CrossRef]
- Zhu, H.; Liu, C.; Bai, C.; Chen, Q.; Zhao, X.; Liu, C.; Zheng, X.; Shen, L. Effects of Microwave Vacuum Drying on Drying Characteristics, Quality Attributes and Starch Structure of Germinated Brown Rice. Int. J. Biol. Macromol. 2024, 282, 137153. [Google Scholar] [CrossRef]
- Ji, S.; Xu, T.; Li, Y.; Li, H.; Zhong, Y.; Lu, B. Effect of Starch Molecular Structure on Precision and Texture Properties of 3D Printed Products. Food Hydrocoll. 2022, 125, 107387. [Google Scholar] [CrossRef]
- Cheng, Y.; Chen, Y.; Gao, W.; Kang, X.; Sui, J.; Yu, B.; Guo, L.; Zhao, M.; Yuan, C.; Cui, B. Investigation of the Mechanism of Gelatin to Enhance 3D Printing Accuracy of Corn Starch Gel: From Perspective of Phase Morphological Changes. Int. J. Biol. Macromol. 2024, 254, 127323. [Google Scholar] [CrossRef]
- Ma, S.; Liu, J.; Zhang, Q.; Lin, Q.; Liu, R.; Xing, Y.; Jiang, H. 3D Printing Performance Using Radio Frequency Electromagnetic Wave Modified Potato Starch. Innov. Food Sci. Emerg. Technol. 2022, 80, 103064. [Google Scholar] [CrossRef]
- Shi, S.; Wen, J.; Geng, H.; Zhan, X.; Liu, Y. Physicochemical Properties, Structural Properties and Gels 3D Printing Properties of Wheat Starch. Int. J. Biol. Macromol. 2024, 261, 129885. [Google Scholar] [CrossRef]
- Ji, S.; Xu, M.; Li, Y.; Zou, Y.; Zhou, Z.; Zhao, X.; Shen, J.; Lu, B. Exploring the Mechanism of Fatty Acids to Improve 3D Printing Precision of Cassava Starch Gel. Food Res. Int. 2025, 207, 116074. [Google Scholar] [CrossRef]
- Tian, H.; Wang, K.; Lan, H.; Wang, Y.; Hu, Z.; Zhao, L. Effect of Hybrid Gelator Systems of Beeswax-Carrageenan-Xanthan on Rheological Properties and Printability of Litchi Inks for 3D Food Printing. Food Hydrocoll. 2021, 113, 106482. [Google Scholar] [CrossRef]
- Yu, J.; Li, D.; Wang, L.; Wang, Y. Improving Freeze-Thaw Stability and 3D Printing Performance of Soy Protein Isolate Emulsion Gel Inks by Guar & Xanthan Gums. Food Hydrocoll. 2023, 136, 108293. [Google Scholar] [CrossRef]
- Yu, X.; Wang, Y.; Zhao, W.; Li, S.; Pan, J.; Prakash, S.; Dong, X. Hydrophilic Colloids (Konjac Gum/Xanthan Gum) in 3D Printing of Transitional Food from Fish Paste. Food Hydrocoll. 2023, 137, 108333. [Google Scholar] [CrossRef]
- Jiang, Y.; Reddy, C.K.; Huang, K.; Chen, L.; Xu, B. Hydrocolloidal Properties of Flaxseed Gum/Konjac Glucomannan Compound Gel. Int. J. Biol. Macromol. 2019, 133, 1156–1163. [Google Scholar] [CrossRef]
- Zhang, R.; Edgar, K.J. Properties, Chemistry, and Applications of the Bioactive Polysaccharide Curdlan. Biomacromolecules 2014, 15, 1079–1096. [Google Scholar] [CrossRef]
- Kim, J.; Kim, J.S.; Moon, K.-D. 3D-Printed Rice Cake for Dysphagia Diet: Effect of Rice Flour/κ-Carrageenan/Curdlan Complex Gel on Structure, Swallowability, and Storage. Future Foods 2025, 11, 100537. [Google Scholar] [CrossRef]
- Feng, M.; Zhang, M.; Mujumdar, A.S.; Guo, Z. Influence of Components Interaction in Recombined Food Gels on 3D Printing: A Comprehensive Review. Food Hydrocoll. 2024, 151, 109782. [Google Scholar] [CrossRef]
- Wu, C.; Peng, S.; Wen, C.; Wang, X.; Fan, L.; Deng, R.; Pang, J. Structural Characterization and Properties of Konjac Glucomannan/Curdlan Blend Films. Carbohydr. Polym. 2012, 89, 497–503. [Google Scholar] [CrossRef] [PubMed]
- Huang, M.; Zhang, M.; Guo, C. 3D Printability of Brown Rice Gel Modified by Some Food Hydrocolloids. J. Food Process. Preserv. 2020, 44, e14502. [Google Scholar] [CrossRef]
- He, A.; Xu, J.; Hu, Q.; Zhao, L.; Ma, G.; Zhong, L.; Liu, R. Effects of Gums on 3D Printing Performance of Pleurotus Eryngii Powder. J. Food Eng. 2023, 351, 111514. [Google Scholar] [CrossRef]
- Cao, Y.; Zhang, F.; Guo, P.; Dong, S.; Li, H. Effect of Wheat Flour Substitution with Potato Pulp on Dough Rheology, the Quality of Steamed Bread and in Vitro Starch Digestibility. LWT 2019, 111, 527–533. [Google Scholar] [CrossRef]
- Park, B.-R.; No, J.; Oh, H.; Park, C.S.; You, K.-M.; Chewaka, L.S. Exploring Puffed Rice as Anovel Ink for 3D Food Printing: Rheological Characterization and Printability Analysis. J. Food Eng. 2025, 387, 112313. [Google Scholar] [CrossRef]
- Karppinen, A.; Saarinen, T.; Salmela, J.; Laukkanen, A.; Nuopponen, M.; Seppälä, J. Flocculation of Microfibrillated Cellulose in Shear Flow. Cellulose 2012, 19, 1807–1819. [Google Scholar] [CrossRef]
- Wang, M.; Chen, C.; Sun, G.; Wang, W.; Fang, H. Effects of Curdlan on the Color, Syneresis, Cooking Qualities, and Textural Properties of Potato Starch Noodles. Starch-Stärke 2010, 62, 429–434. [Google Scholar] [CrossRef]
- Nakao, Y. Curdlan: Properties and Application to Foods. Nippon Shokuhin Kogyo Gakkaishi 1991, 38, 736–742. [Google Scholar] [CrossRef]
- Wang, S.; Wu, Z.; Jia, L.; Wang, X.; He, T.; Wang, L.; Yao, G.; Xie, F. Soybean Protein Isolate-Sodium Alginate Double Network Emulsion Gels: Mechanism of Formation and Improved Freeze-Thaw Stability. Int. J. Biol. Macromol. 2024, 274, 133296. [Google Scholar] [CrossRef]
- Koo, C.K.W.; Chung, C.; Fu, J.-T.R.; Sher, A.; Rousset, P.; McClements, D.J. Impact of Sodium Caseinate, Soy Lecithin and Carrageenan on Functionality of Oil-in-Water Emulsions. Food Res. Int. 2019, 123, 779–789. [Google Scholar] [CrossRef]
- 3Singh, A.; Geveke, D.J.; Yadav, M.P. Improvement of Rheological, Thermal and Functional Properties of Tapioca Starch by Using Gum Arabic. LWT 2017, 80, 155–162. [Google Scholar] [CrossRef]
- Ma, S.; Zhu, P.; Wang, M. Effects of Konjac Glucomannan on Pasting and Rheological Properties of Corn Starch. Food Hydrocoll. 2019, 89, 234–240. [Google Scholar] [CrossRef]
- Wedamulla, N.E.; Fan, M.; Choi, Y.-J.; Kim, E.-K. Combined Effect of Heating Temperature and Content of Pectin on the Textural Properties, Rheology, and 3D Printability of Potato Starch Gel. Int. J. Biol. Macromol. 2023, 253, 127129. [Google Scholar] [CrossRef]
- Diañez, I.; Gallegos, C.; Brito-de la Fuente, E.; Martínez, I.; Valencia, C.; Sánchez, M.C.; Franco, J.M. Implementation of a Novel Continuous Solid/Liquid Mixing Accessory for 3D Printing of Dysphagia-Oriented Thickened Fluids. Food Hydrocoll. 2021, 120, 106900. [Google Scholar] [CrossRef]
- Liu, Z.; Bhandari, B.; Prakash, S.; Mantihal, S.; Zhang, M. Linking Rheology and Printability of a Multicomponent Gel System of Carrageenan-Xanthan-Starch in Extrusion Based Additive Manufacturing. Food Hydrocoll. 2019, 87, 413–424. [Google Scholar] [CrossRef]
- Wang, M.; Li, D.; Zang, Z.; Sun, X.; Tan, H.; Si, X.; Tian, J.; Teng, W.; Wang, J.; Liang, Q. 3D Food Printing: Applications of Plant-Based Materials in Extrusion-Based Food Printing. Crit. Rev. Food Sci. Nutr. 2022, 62, 7184–7198. [Google Scholar] [CrossRef]
- Pan, Y.; Sun, Q.; Liu, Y.; Wei, S.; Xia, Q.; Zheng, O.; Liu, S.; Ji, H.; Deng, C.; Hao, J. The Relationship between Rheological and Textural Properties of Shrimp Surimi Adding Starch and 3D Printability Based on Principal Component Analysis. Food Sci. Nutr. 2021, 9, 2985–2999. [Google Scholar] [CrossRef] [PubMed]
- Oishi, Y.; Udagawa, H.; Shinozaki, Y.; Moriyama, M.; Taniguchi, H.; Kobayashi-Hattori, K.; Arai, S.; Takita, T. Preparation of Hypoallergenic Wheat Flour Noodles and Evaluation of Their Physical Properties. Food Sci. Technol. Res. 2009, 15, 39–44. [Google Scholar] [CrossRef]
- Wu, C.; Yuan, C.; Chen, S.; Liu, D.; Ye, X.; Hu, Y. The Effect of Curdlan on the Rheological Properties of Restructured Ribbonfish (Trichiurus spp.) Meat Ge. Food Chem. 2015, 179, 222–231. [Google Scholar] [CrossRef]
- Zhao, N.; Guo, C.; Liu, Z.; Chen, L.; Hu, Y.; Han, M.; Huang, F.; Kang, Z.; Feng, X. Effects of Different Hydrocolloids on the 3D Printing and Thermal Stability of Chicken Paste. Int. J. Biol. Macromol. 2024, 277, 134006. [Google Scholar] [CrossRef]
- Han, N.-R.; Bae, J.-E.; An, H.W.; Yun, H.-J.; Retnoaji, B.; Lee, S.; Lee, S.G. Influence of Potato Starch on the 3D Printing of Senior-Friendly Foods Enriched with Oyster Powder. LWT 2025, 224, 117886. [Google Scholar] [CrossRef]
- Liu, Z.; Zhang, M.; Bhandari, B.; Yang, C. Impact of Rheological Properties of Mashed Potatoes on 3D Printing. J. Food Eng. 2018, 220, 76–82. [Google Scholar] [CrossRef]
- Zheng, Z.; Zhang, M.; Liu, Z. Investigation on Evaluating the Printable Height and Dimensional Stability of Food Extrusion-Based 3D Printed Foods. J. Food Eng. 2021, 306, 110636. [Google Scholar] [CrossRef]
- Phuhongsung, P.; Zhang, M.; Devahastin, S. Investigation on 3D Printing Ability of Soybean Protein Isolate Gels and Correlations with Their Rheological and Textural Properties via LF-NMR Spectroscopic Characteristics. LWT 2020, 122, 109019. [Google Scholar] [CrossRef]
- Zhang, H.; Xiong, Y.; Bakry, A.M.; Xiong, S.; Yin, T.; Zhang, B.; Huang, J.; Liu, Z.; Huang, Q. Effect of Yeast β-Glucan on Gel Properties, Spatial Structure and Sensory Characteristics of Silver Carp Surimi. Food Hydrocoll. 2019, 88, 256–264. [Google Scholar] [CrossRef]
- Liu, Y.; Sun, Q.; Wei, S.; Xia, Q.; Pan, Y.; Liu, S.; Ji, H.; Deng, C.; Hao, J. LF-NMR as a Tool for Predicting the 3D Printability of Surimi-Starch Systems. Food Chem. 2022, 374, 131727. [Google Scholar] [CrossRef]
- Yamul, D.K.; Navarro, A.S. Effect of Hydrocolloids on Structural and Functional Properties of Wheat/Potato (50/50) Flour Dough. Food Struct. 2020, 24, 100138. [Google Scholar] [CrossRef]
- Joshi, R.; Baek, I.; Joshi, R.; Kim, M.S.; Cho, B.-K. Detection of Fabricated Eggs Using Fourier Transform Infrared (FT-IR) Spectroscopy Coupled with Multivariate Classification Techniques. Infrared Phys. Technol. 2022, 123, 104163. [Google Scholar] [CrossRef]
- Meng, F.; Zheng, L.; Wang, Y.; Liang, Y.; Zhong, G. Preparation and Properties of Konjac Glucomannan Octenyl Succinate Modified by Microwave Method. Food Hydrocoll. 2014, 38, 205–210. [Google Scholar] [CrossRef]
- Zhou, T.-Q.; Wang, X.-C.; Gao, L.-Y.; Yan, J.-N.; Wu, H.-T. Construction and Properties of Curdlan Gum/Gellan Gum Binary Composite Gel System. Food Hydrocoll. 2024, 148, 109391. [Google Scholar] [CrossRef]
- Wu, K.; Wan, Y.; Li, X.; Qian, H.; Xiao, M.; Ni, X.; Jiang, F.; Chen, S. Impact of Heating and Drying Temperatures on the Properties of Konjac Glucomannan/Curdlan Blend Films. Int. J. Biol. Macromol. 2021, 167, 1544–1551. [Google Scholar] [CrossRef] [PubMed]
- Xing, X.; Chitrakar, B.; Hati, S.; Xie, S.; Li, H.; Li, C.; Liu, Z.; Mo, H. Development of Black Fungus-Based 3D Printed Foods as Dysphagia Diet: Effect of Gums Incorporation. Food Hydrocoll. 2022, 123, 107173. [Google Scholar] [CrossRef]
- Huang, J.; Zhang, M.; Mujumdar, A.S.; Li, C. Modulation of Starch Structure, Swallowability and Digestibility of 3D-Printed Diabetic-Friendly Food for the Elderly by Dry Heating. Int. J. Biol. Macromol. 2024, 264, 130629. [Google Scholar] [CrossRef]
- Liu, L.; Xie, T.; Cheng, W.; Ding, Y.; Xu, B. Characterization and Mechanism of Thermally Induced Tea Polyphenols. LWT 2024, 205, 116488. [Google Scholar] [CrossRef]
- Hu, W.; Gu, J.; Yang, K.; Bu, T.; Natallia, K.; Zhang, Z.; Wu, W. Mechanism Ofhydrocolloids Effect Onbuckwheat Starch Gelsfrom Interaction Andstructural Perspectives: Acomparative Study. Int. J. Biol. Macromol. 2025, 284, 137886. [Google Scholar] [CrossRef] [PubMed]
- Song, J.; Rong, L.; Li, J.; Shen, M.; Yu, Q.; Chen, Y.; Kong, J.; Xie, J. Effects of Three Different Polysaccharides on the Sol Gel-Behavior, Rheological, and Structural Properties of Tapioca Starch. Int. J. Biol. Macromol. 2024, 254, 128053. [Google Scholar] [CrossRef]
- Lu, C.; Guo, J.; Li, P.; Bai, Z.; Cui, G.; Li, P. Physicochemical Properties and Invitro Digestion Ofquinoa Starch Induced by Combination of Ultrasound and Konjac Glucomannan. Food Chem. 2025, 463, 141380. [Google Scholar] [CrossRef]


| Formulations | Hydrocolloids | |
|---|---|---|
| KGM (wt/wt, %) | CD (wt/wt, %) | |
| GBR powder (Control) | 0 | 0 |
| Konjac glucomannan (KGM) | 3 | 0 |
| Curdlan (CD) | 0 | 3 |
| KGM to CD ratio of 1:1 (KC1) | 1.5 | 1.5 |
| KGM to CD ratio of 2:1 (KC2) | 2 | 1 |
| KGM to CD ratio of 3:1 (KC3) | 2.25 | 0.75 |
| KGM to CD ratio of 1:2 (KC4) | 1 | 2 |
| KGM to CD ratio of 1:3 (KC5) | 0.75 | 2.25 |
| Formulations | DL (%) | DW (%) | DH (%) | DC (%) | Top | Side |
|---|---|---|---|---|---|---|
| Control | 17.08 ± 1.30 a | 20.60 ± 0.57 a | 16.43 ± 2.88 a | 18.04 ± 0.72 a |  |  |
| KGM | 9.09 ± 0.38 b | 10.59 ± 0.032 b | 16.23 ± 2.17 a | 11.97 ± 0.89 b | 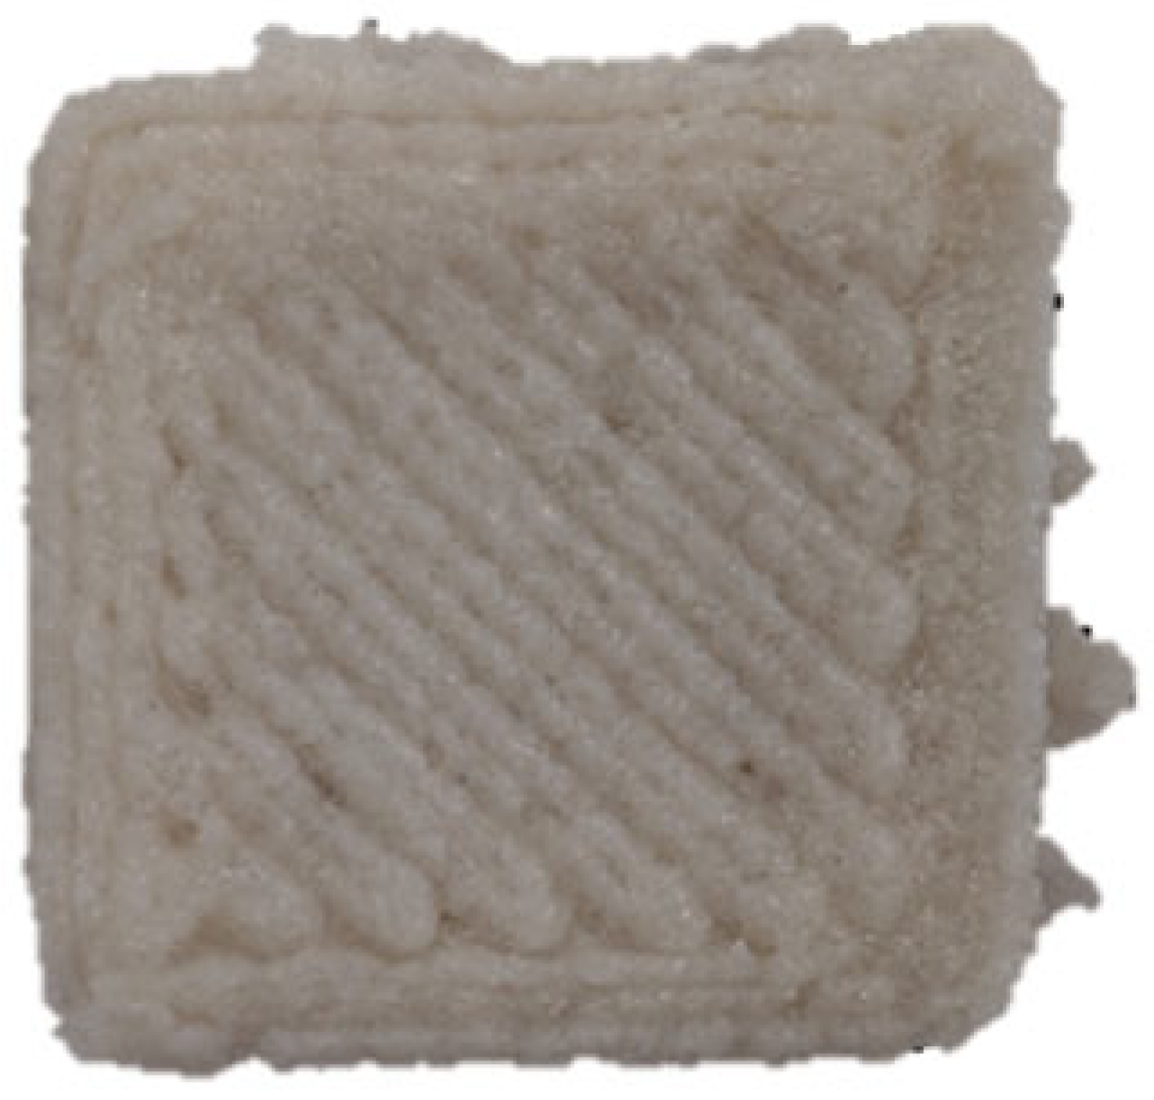 |  |
| CD | 7.77 ± 0.94 cd | 4.87 ± 0.25 e | 13.23 ± 2.05 b | 8.61 ± 0.68 d | 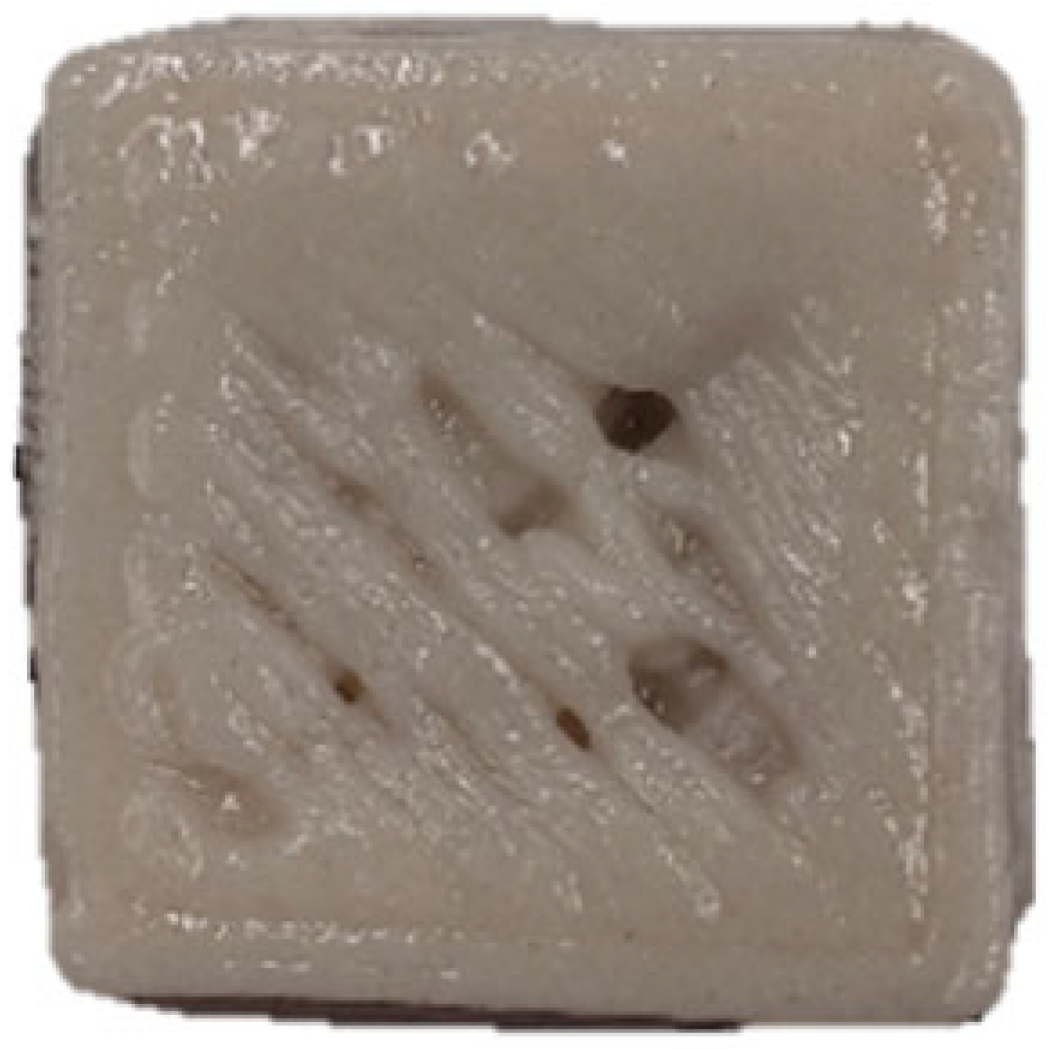 | 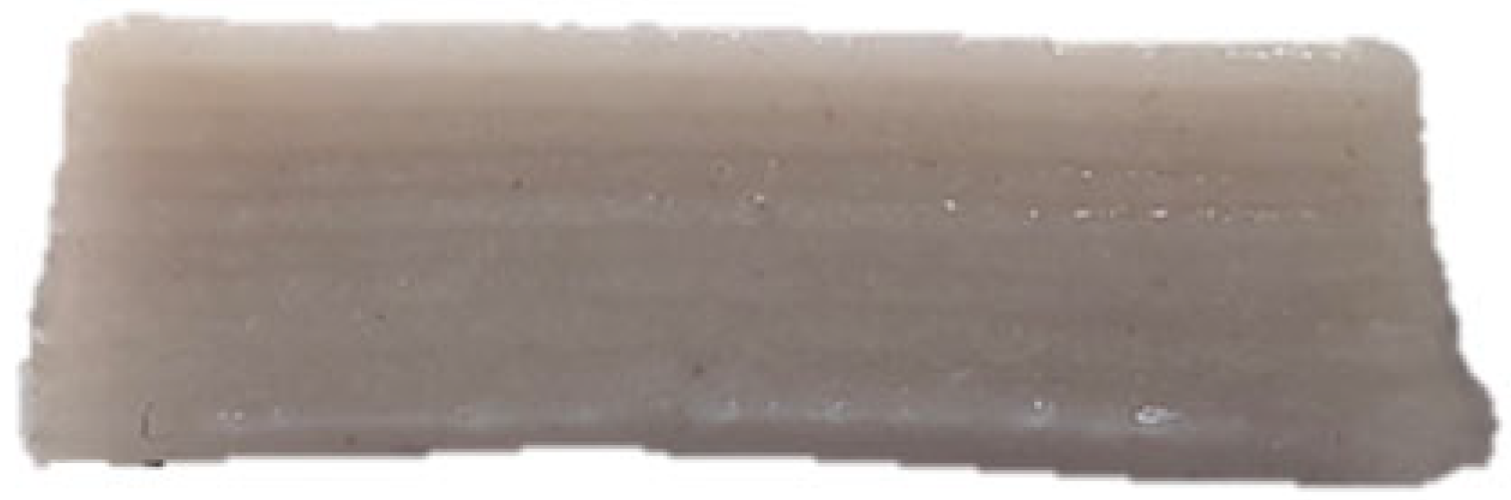 |
| KC1 | 8.78 ± 0.69 bc | 10.12 ± 0.25 b | 8.50 ± 0.92 de | 9.13 ± 0.33 d |  | 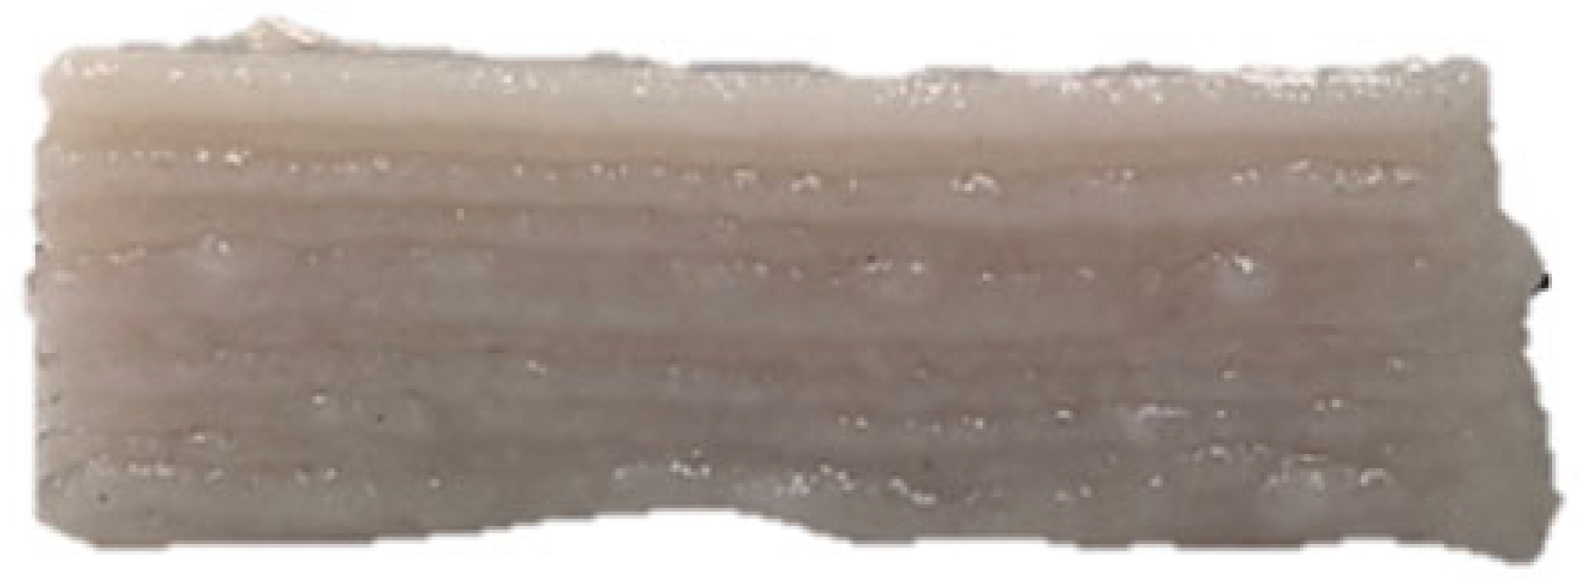 |
| KC2 | 6.41 ± 0.93 e | 6.32 ± 0.10 d | 7.17 ± 0.06 ef | 6.63 ± 0.65 e | 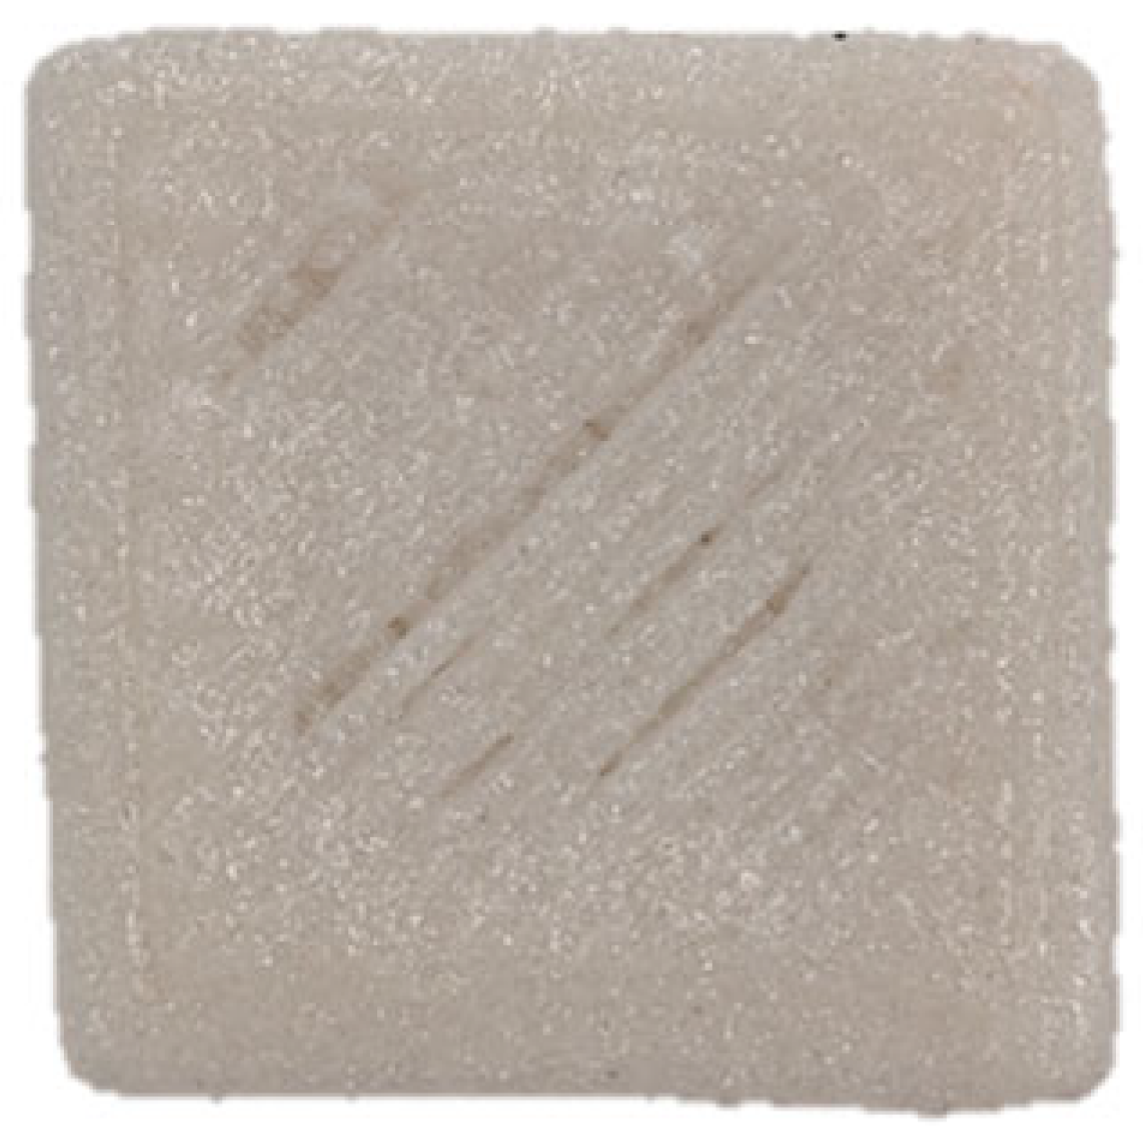 | 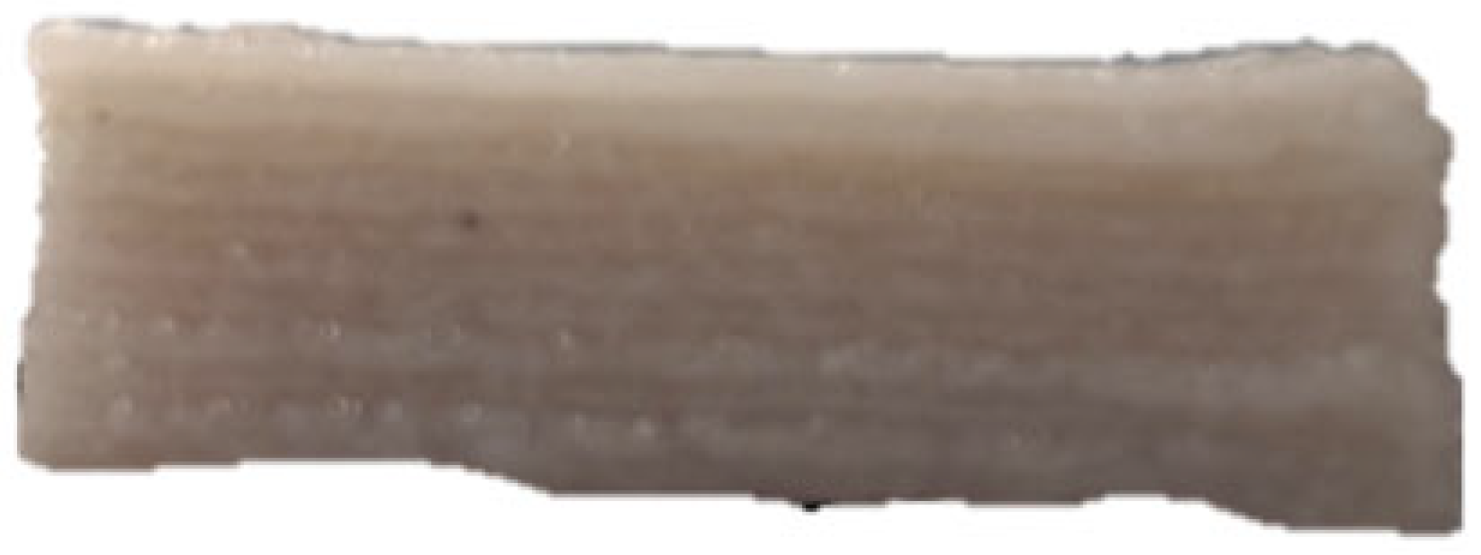 |
| KC3 | 4.94 ± 0.11 e | 4.64 ± 0.29 e | 5.30 ± 0.98 f | 4.97 ± 0.45 f | 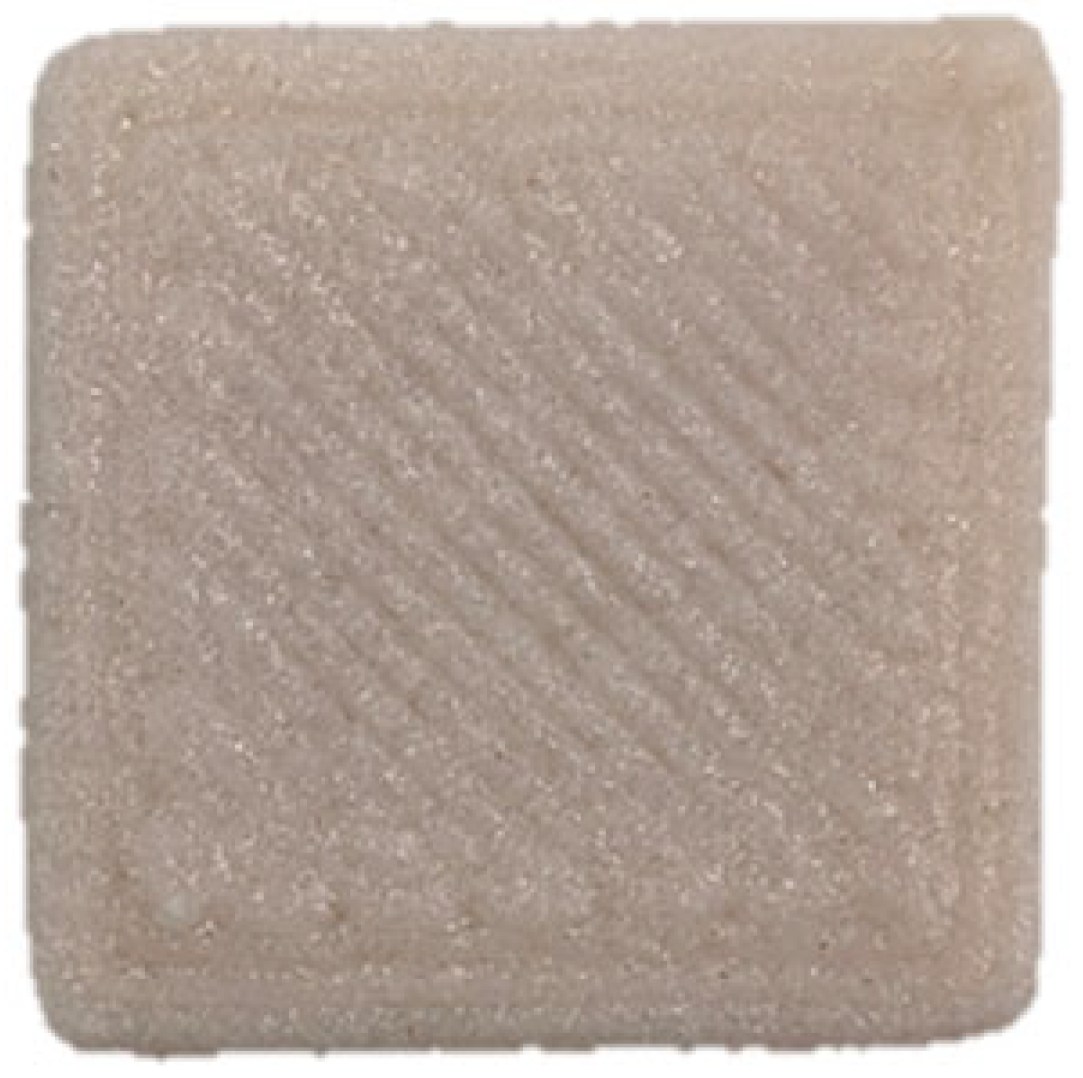 | 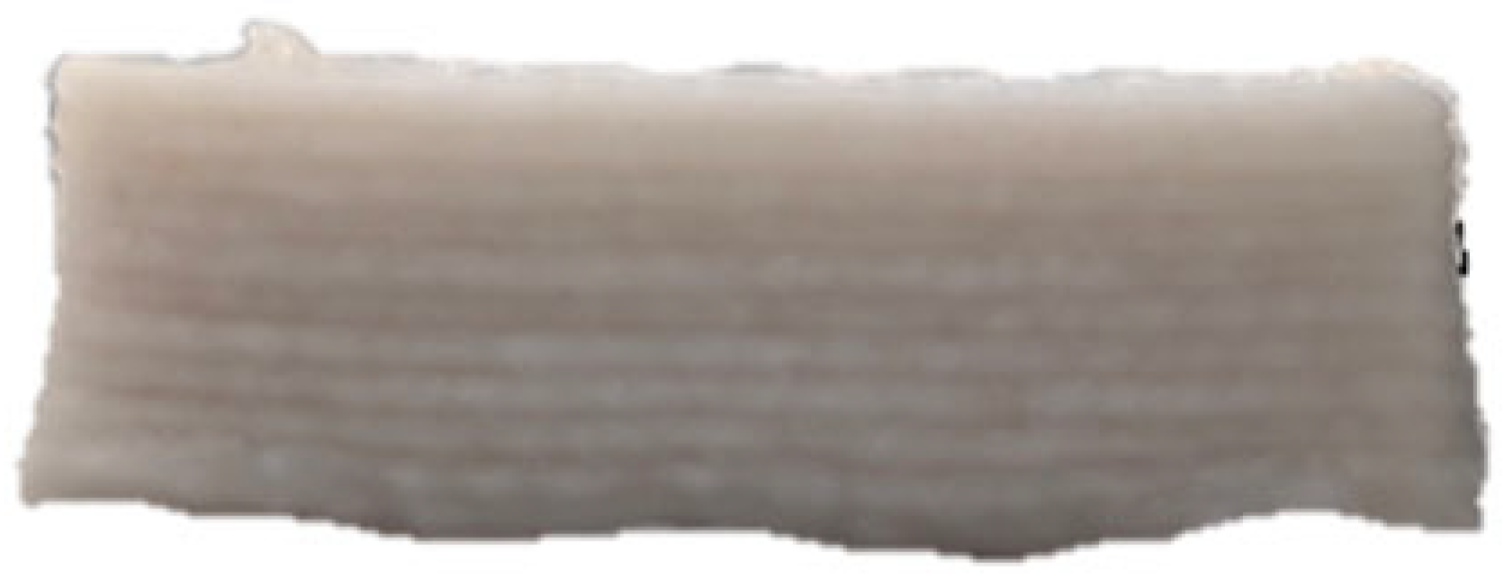 |
| KC4 | 9.36 ± 0.08 b | 10.04 ± 0.32 b | 11.23 ± 1.70 bc | 10.21 ± 0.56 c |  |  |
| KC5 | 7.39 ± 0.14 de | 7.60 ± 0.55 c | 10.37 ± 0.60 cd | 8.45 ± 0.13 d |  |  |
| Formulation | Fitted Parameters of Power-Law Model | ||
|---|---|---|---|
| K (Pa·s) | n | R2 | |
| Control | 126.27 ± 5.56 e | 0.051 ± 0.001 c | 0.997 |
| KGM | 804.12 ± 35.36 a | 0.061 ± 0.001 c | 0.998 |
| CD | 242.16 ± 9.88 d | 0.163 ± 0.023 ab | 0.956 |
| KC1 | 397.61 ± 5.34 b | 0.049 ± 0.014 c | 0.992 |
| KC2 | 389.61 ± 20.83 b | 0.152 ± 0.015 b | 0.991 |
| KC3 | 384.04 ± 53.72 bc | 0.151 ± 0.001 b | 0.986 |
| KC4 | 344.54 ± 23.39 c | 0.179 ± 0.014 a | 0.983 |
| KC5 | 216.34 ± 36.02 d | 0.157 ± 0.025 ab | 0.974 |
Disclaimer/Publisher’s Note: The statements, opinions and data contained in all publications are solely those of the individual author(s) and contributor(s) and not of MDPI and/or the editor(s). MDPI and/or the editor(s) disclaim responsibility for any injury to people or property resulting from any ideas, methods, instructions or products referred to in the content. |
© 2025 by the authors. Licensee MDPI, Basel, Switzerland. This article is an open access article distributed under the terms and conditions of the Creative Commons Attribution (CC BY) license (https://creativecommons.org/licenses/by/4.0/).
Share and Cite
Bai, C.; Liu, R.; Shen, L.; Zhuang, Y.; Hu, J. Effects of Konjac Glucomannan and Curdlan on the 3D Printability and Physicochemical Properties of Germinated Brown Rice Gel. Foods 2025, 14, 1764. https://doi.org/10.3390/foods14101764
Bai C, Liu R, Shen L, Zhuang Y, Hu J. Effects of Konjac Glucomannan and Curdlan on the 3D Printability and Physicochemical Properties of Germinated Brown Rice Gel. Foods. 2025; 14(10):1764. https://doi.org/10.3390/foods14101764
Chicago/Turabian StyleBai, Chun, Ran Liu, Liuyang Shen, Yu Zhuang, and Jiaying Hu. 2025. "Effects of Konjac Glucomannan and Curdlan on the 3D Printability and Physicochemical Properties of Germinated Brown Rice Gel" Foods 14, no. 10: 1764. https://doi.org/10.3390/foods14101764
APA StyleBai, C., Liu, R., Shen, L., Zhuang, Y., & Hu, J. (2025). Effects of Konjac Glucomannan and Curdlan on the 3D Printability and Physicochemical Properties of Germinated Brown Rice Gel. Foods, 14(10), 1764. https://doi.org/10.3390/foods14101764