

The Preparation and Characterization of Quinoa Protein Gels and Application in Eggless Bread


Abstract
1. Introduction
2. Materials and Methods
2.1. Materials and Chemicals
2.2. Extraction of QP
2.3. Ultrasonic Treatment of Quinoa Protein
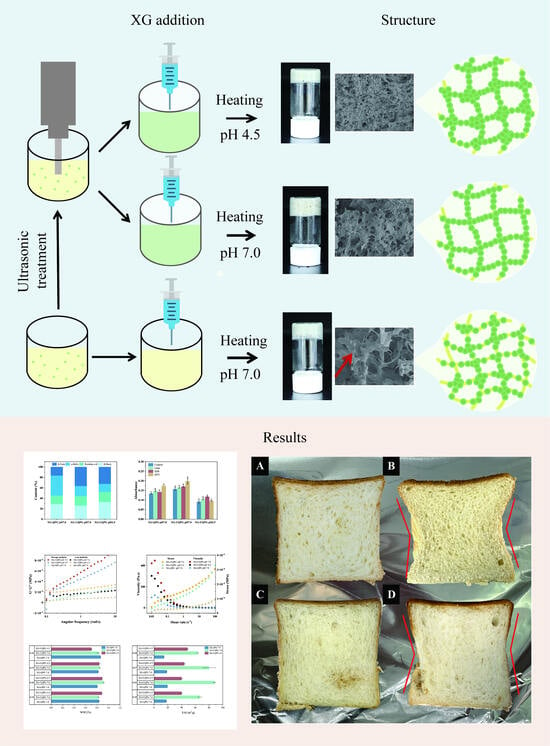
2.4. Preparation of Gels
2.5. Measurement of Zeta Potential
2.6. Sodium Dodecyl Sulphate–Polyacrylamide Gel Electrophoresis (SDS-PAGE) Analysis
2.7. SEM
2.8. Intermolecular Forces and Disulfide Bond
2.9. FTIR
2.10. Rheology and Texture
2.11. WHC and OHC
2.12. Emulsification (EAI) and Emulsification Stability (ESI)
2.13. Bread Properties
2.13.1. Bread Preparation
2.13.2. Determination of Texture of Bread
2.14. Statistical Analysis
3. Results and Discussion
3.1. Effect of Ultrasound Treatment and pH on Quinoa Protein Gels
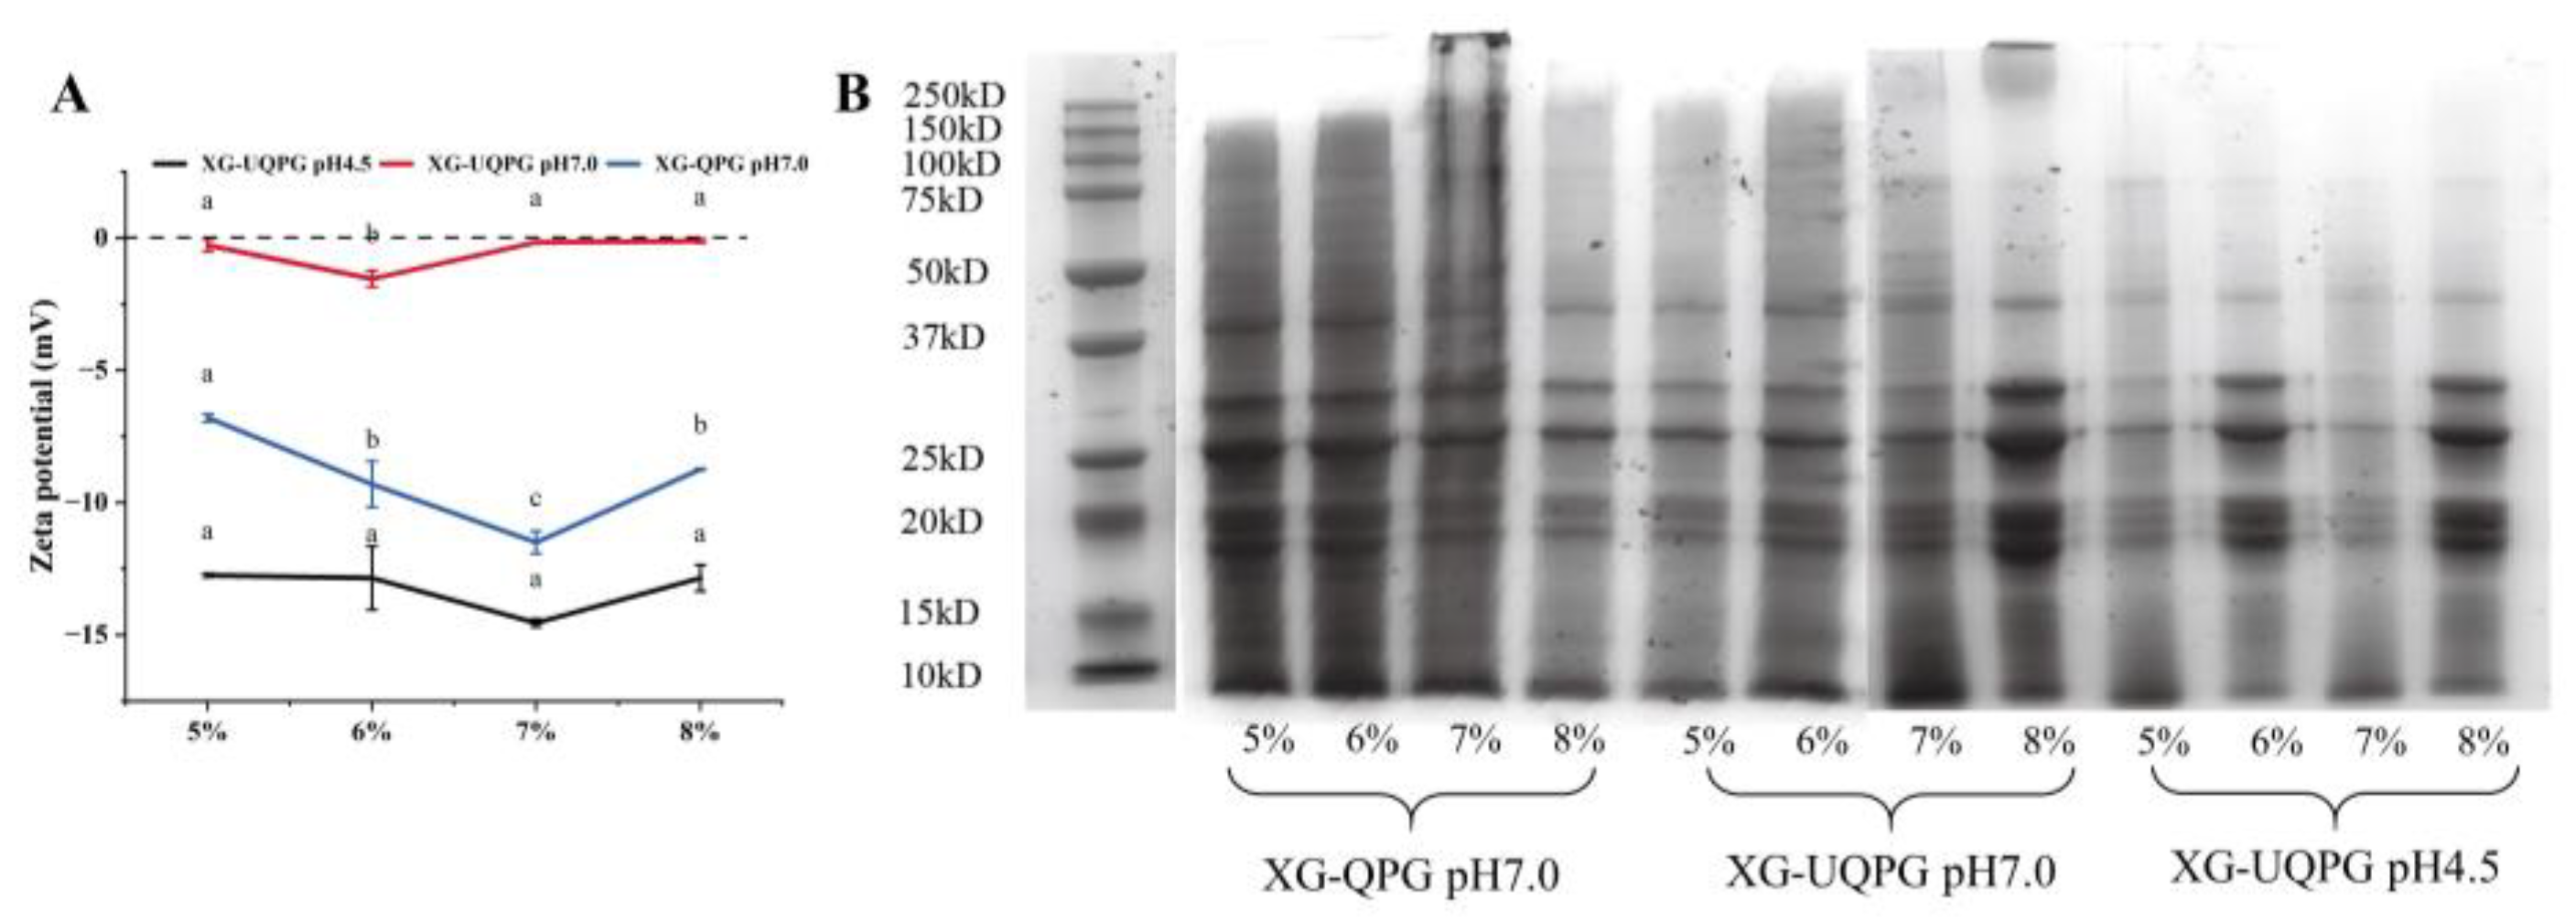
3.1.1. Molecular Weight Determination
3.1.2. Zeta Potential
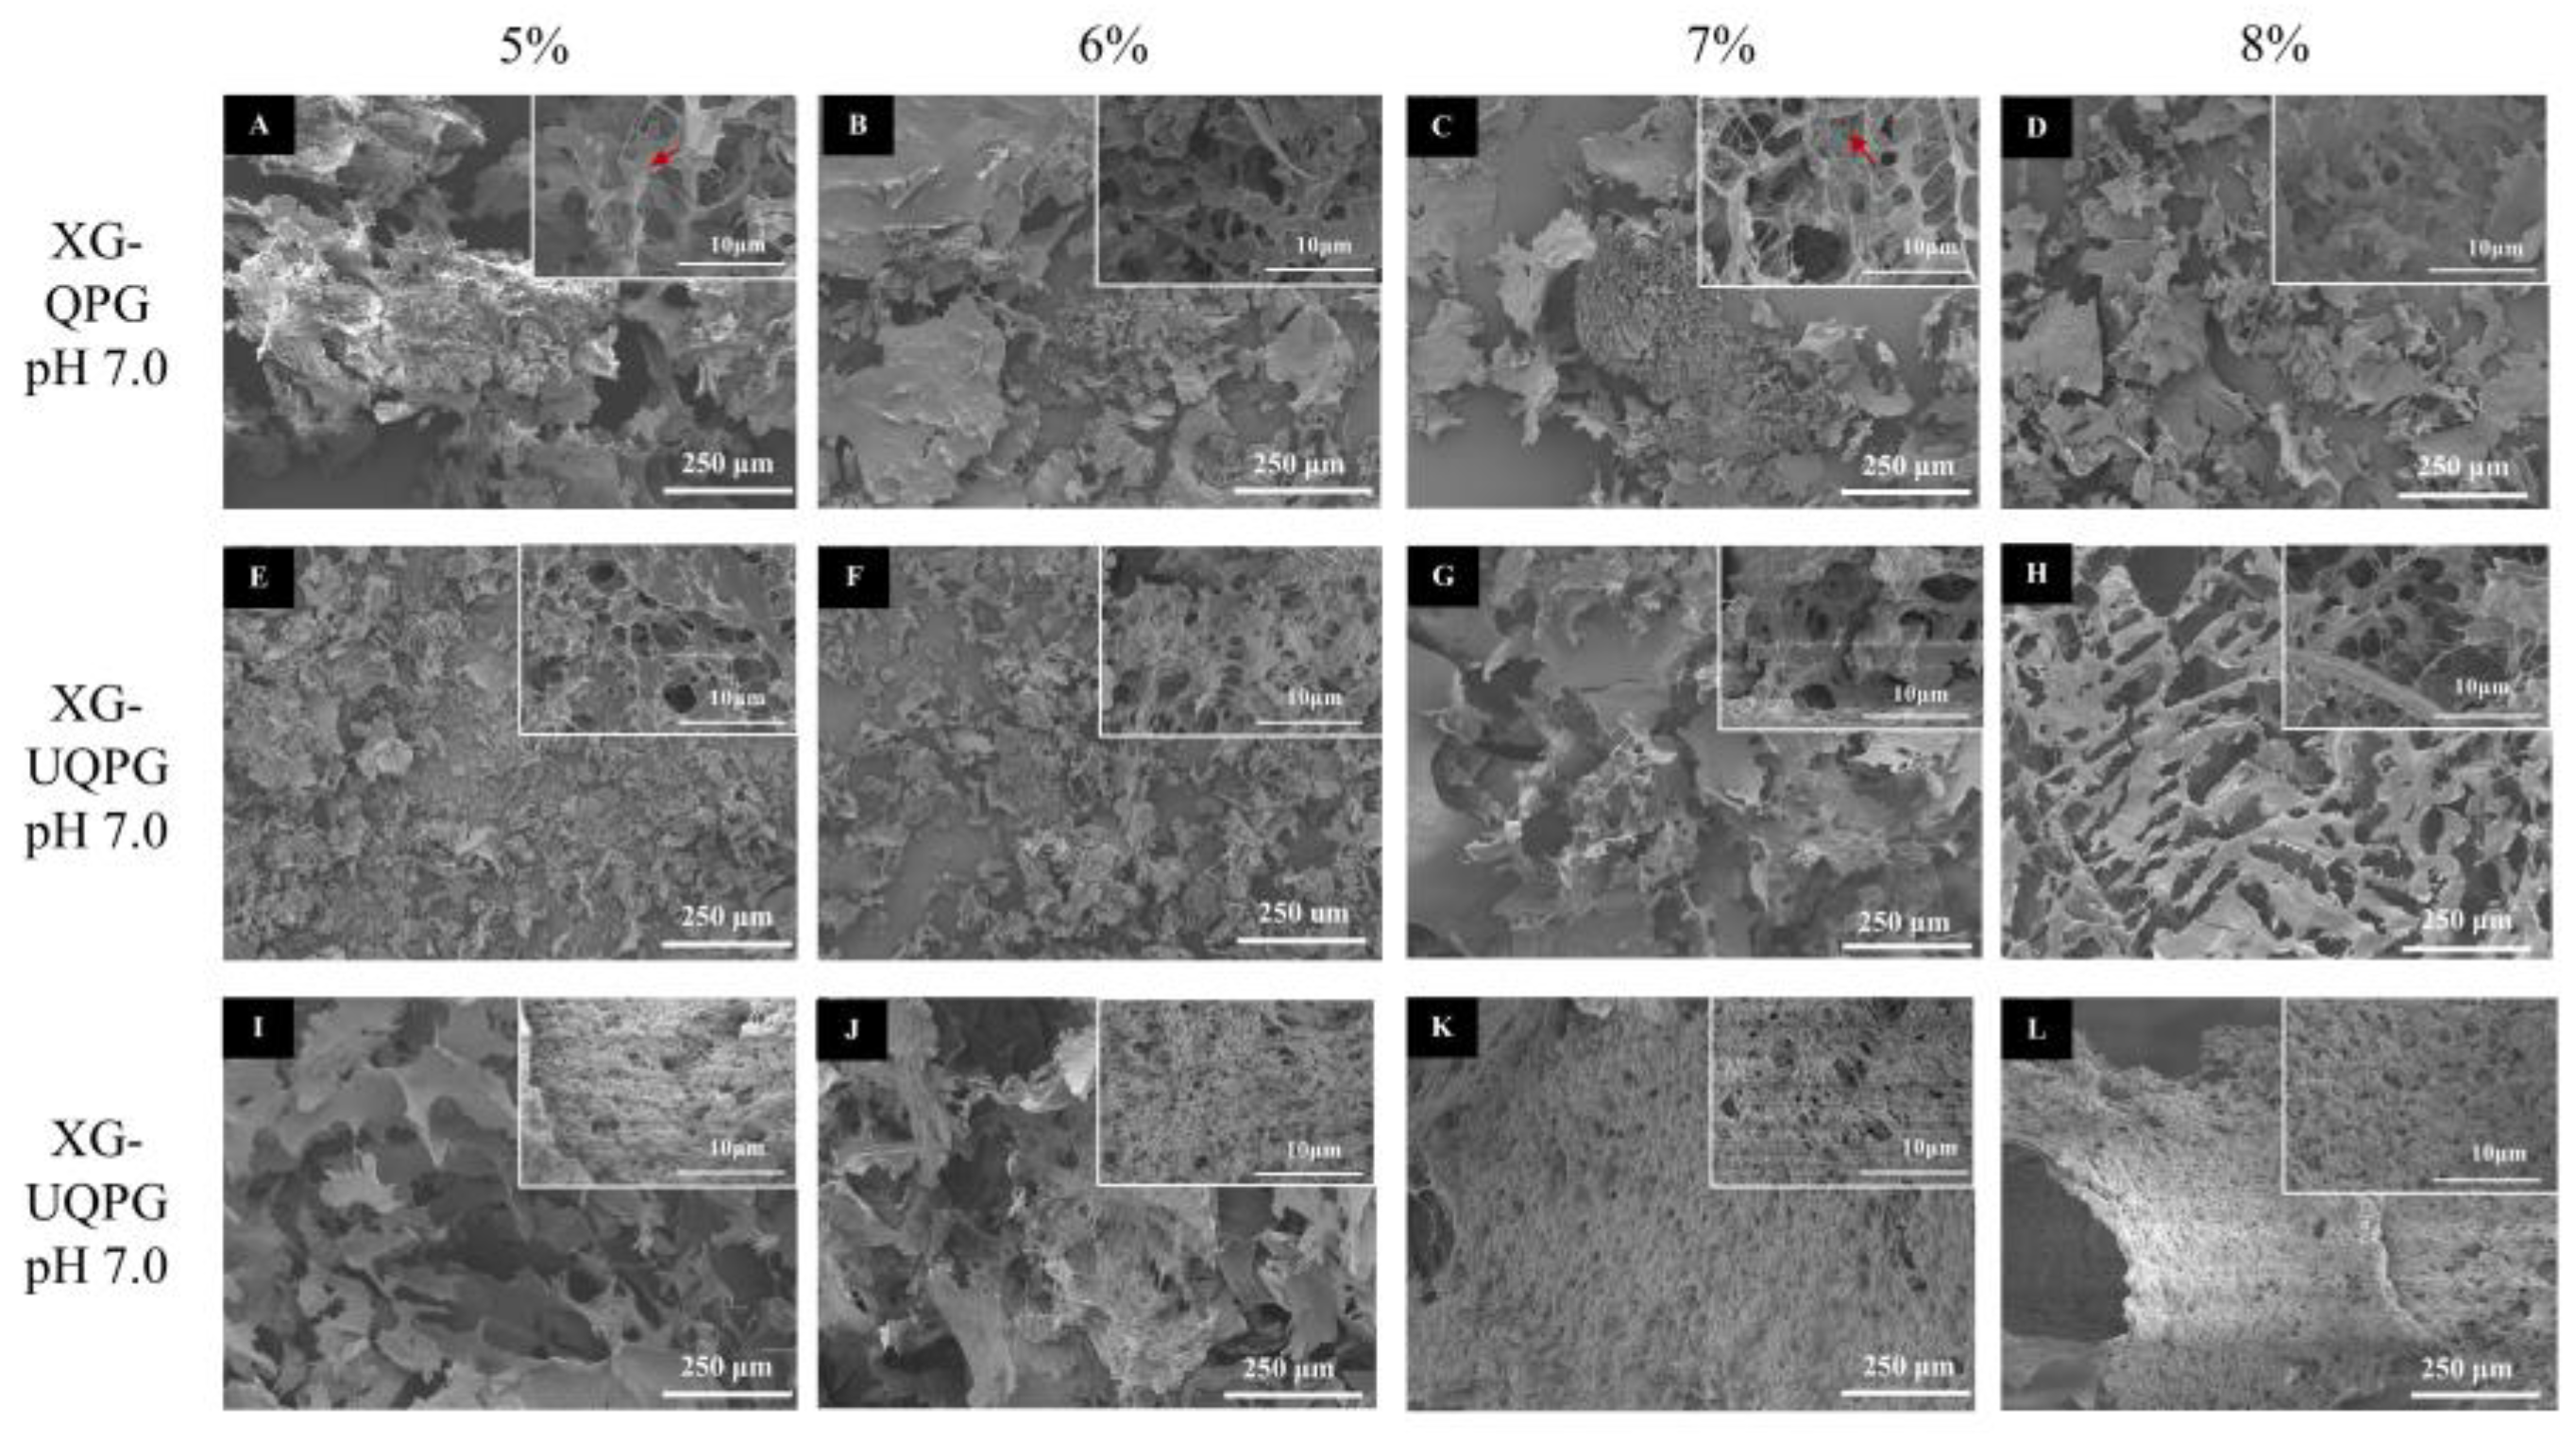
3.1.3. Microstructure
3.1.4. Intermolecular Forces
3.1.5. Disulfide Bond
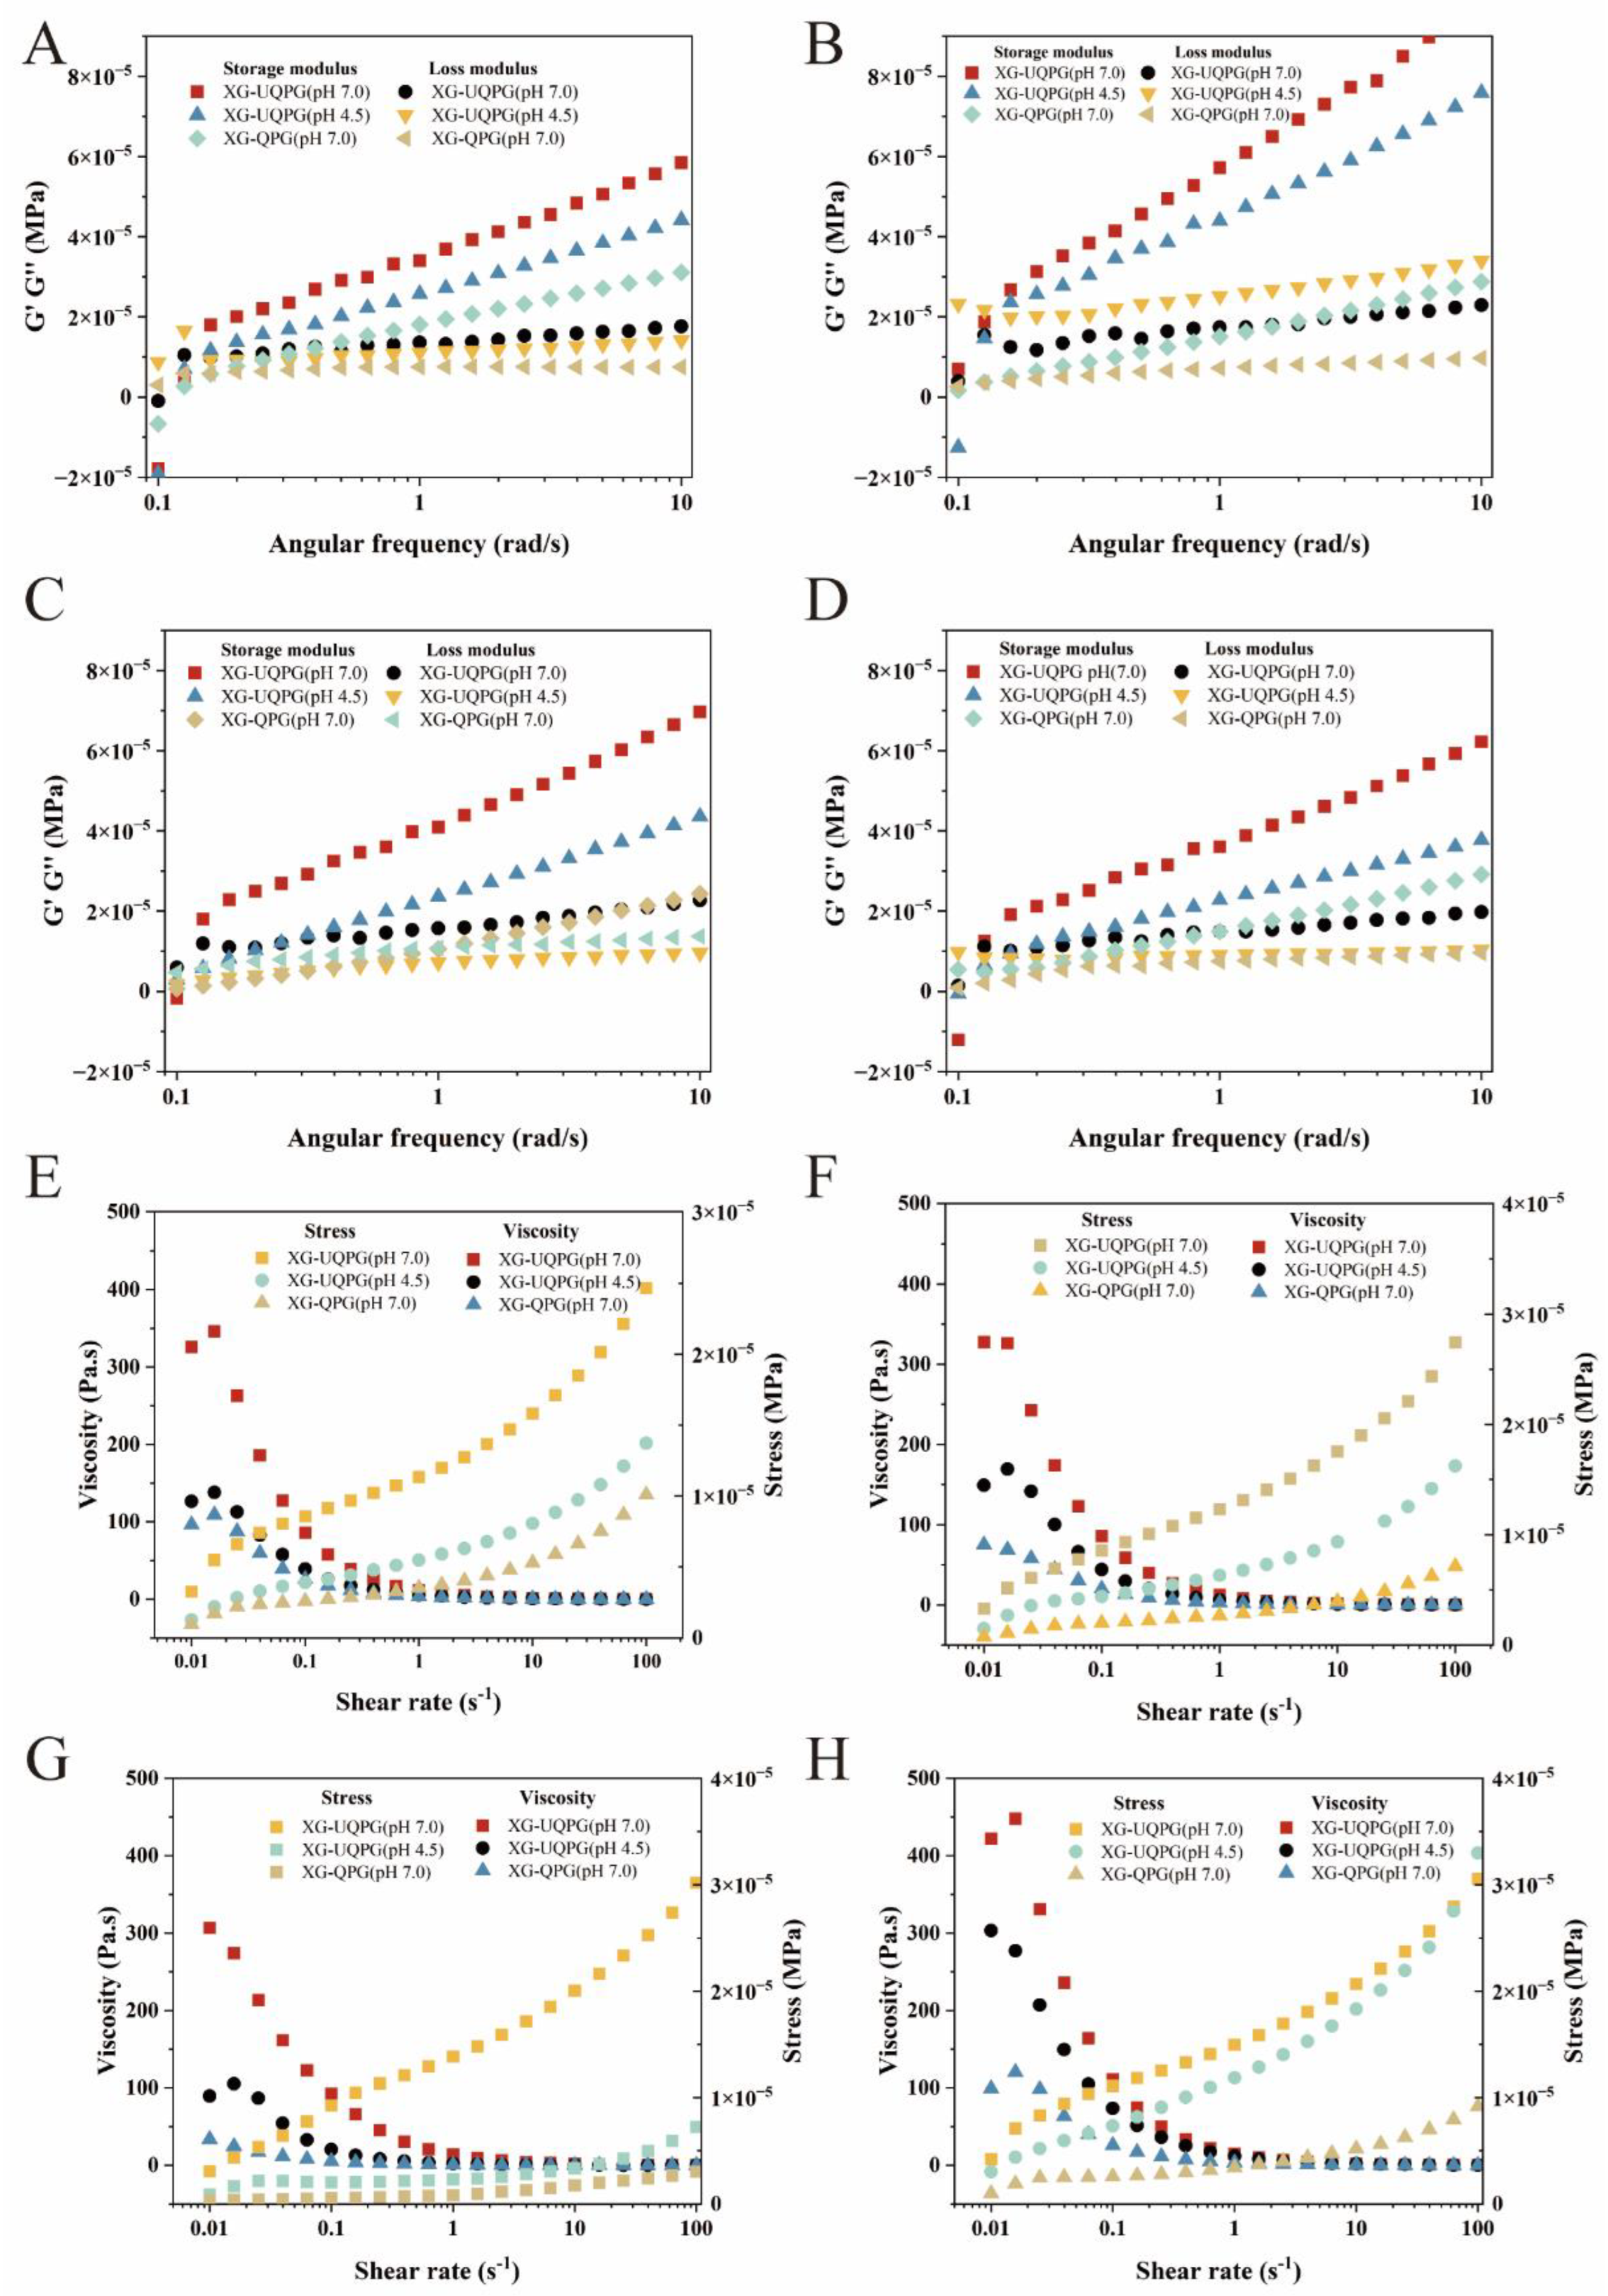
3.1.6. Rheology
3.1.7. Texture
3.1.8. FTIR
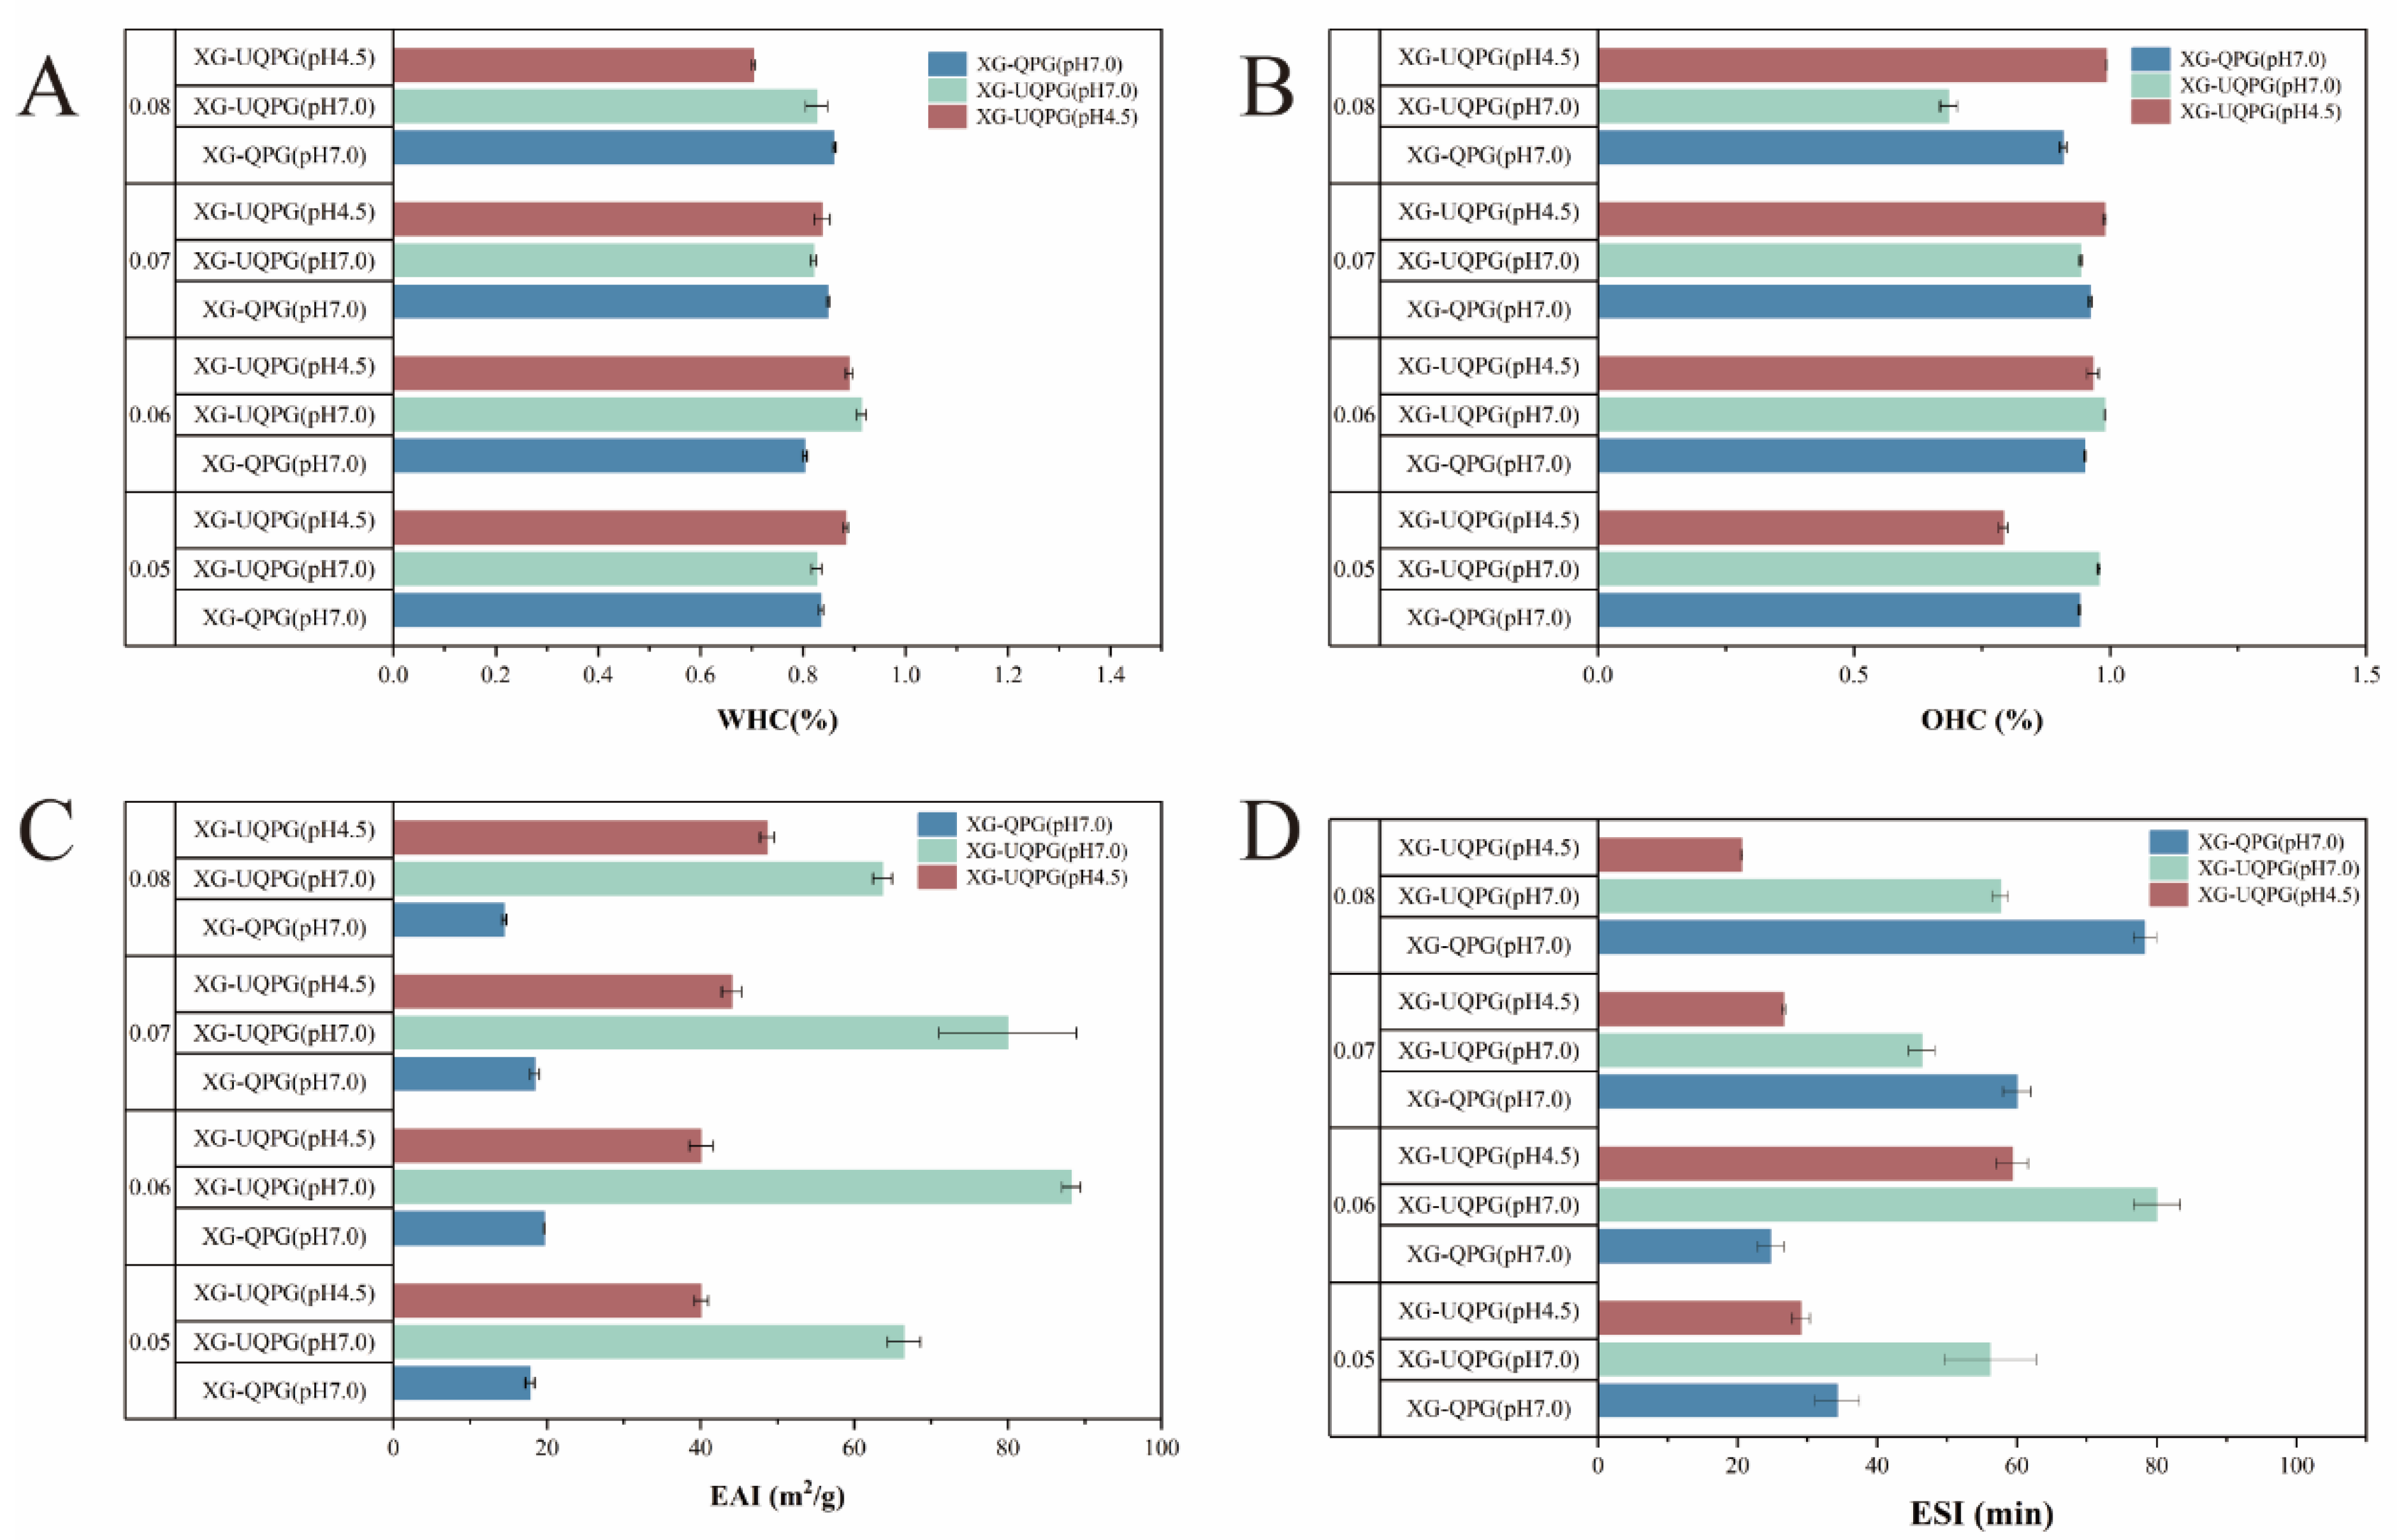
3.1.9. WHC and OHC
3.1.10. Emulsification and Emulsification Stability
3.2. Effect of Complex Gels on Physical Properties of Bread
3.2.1. Texture
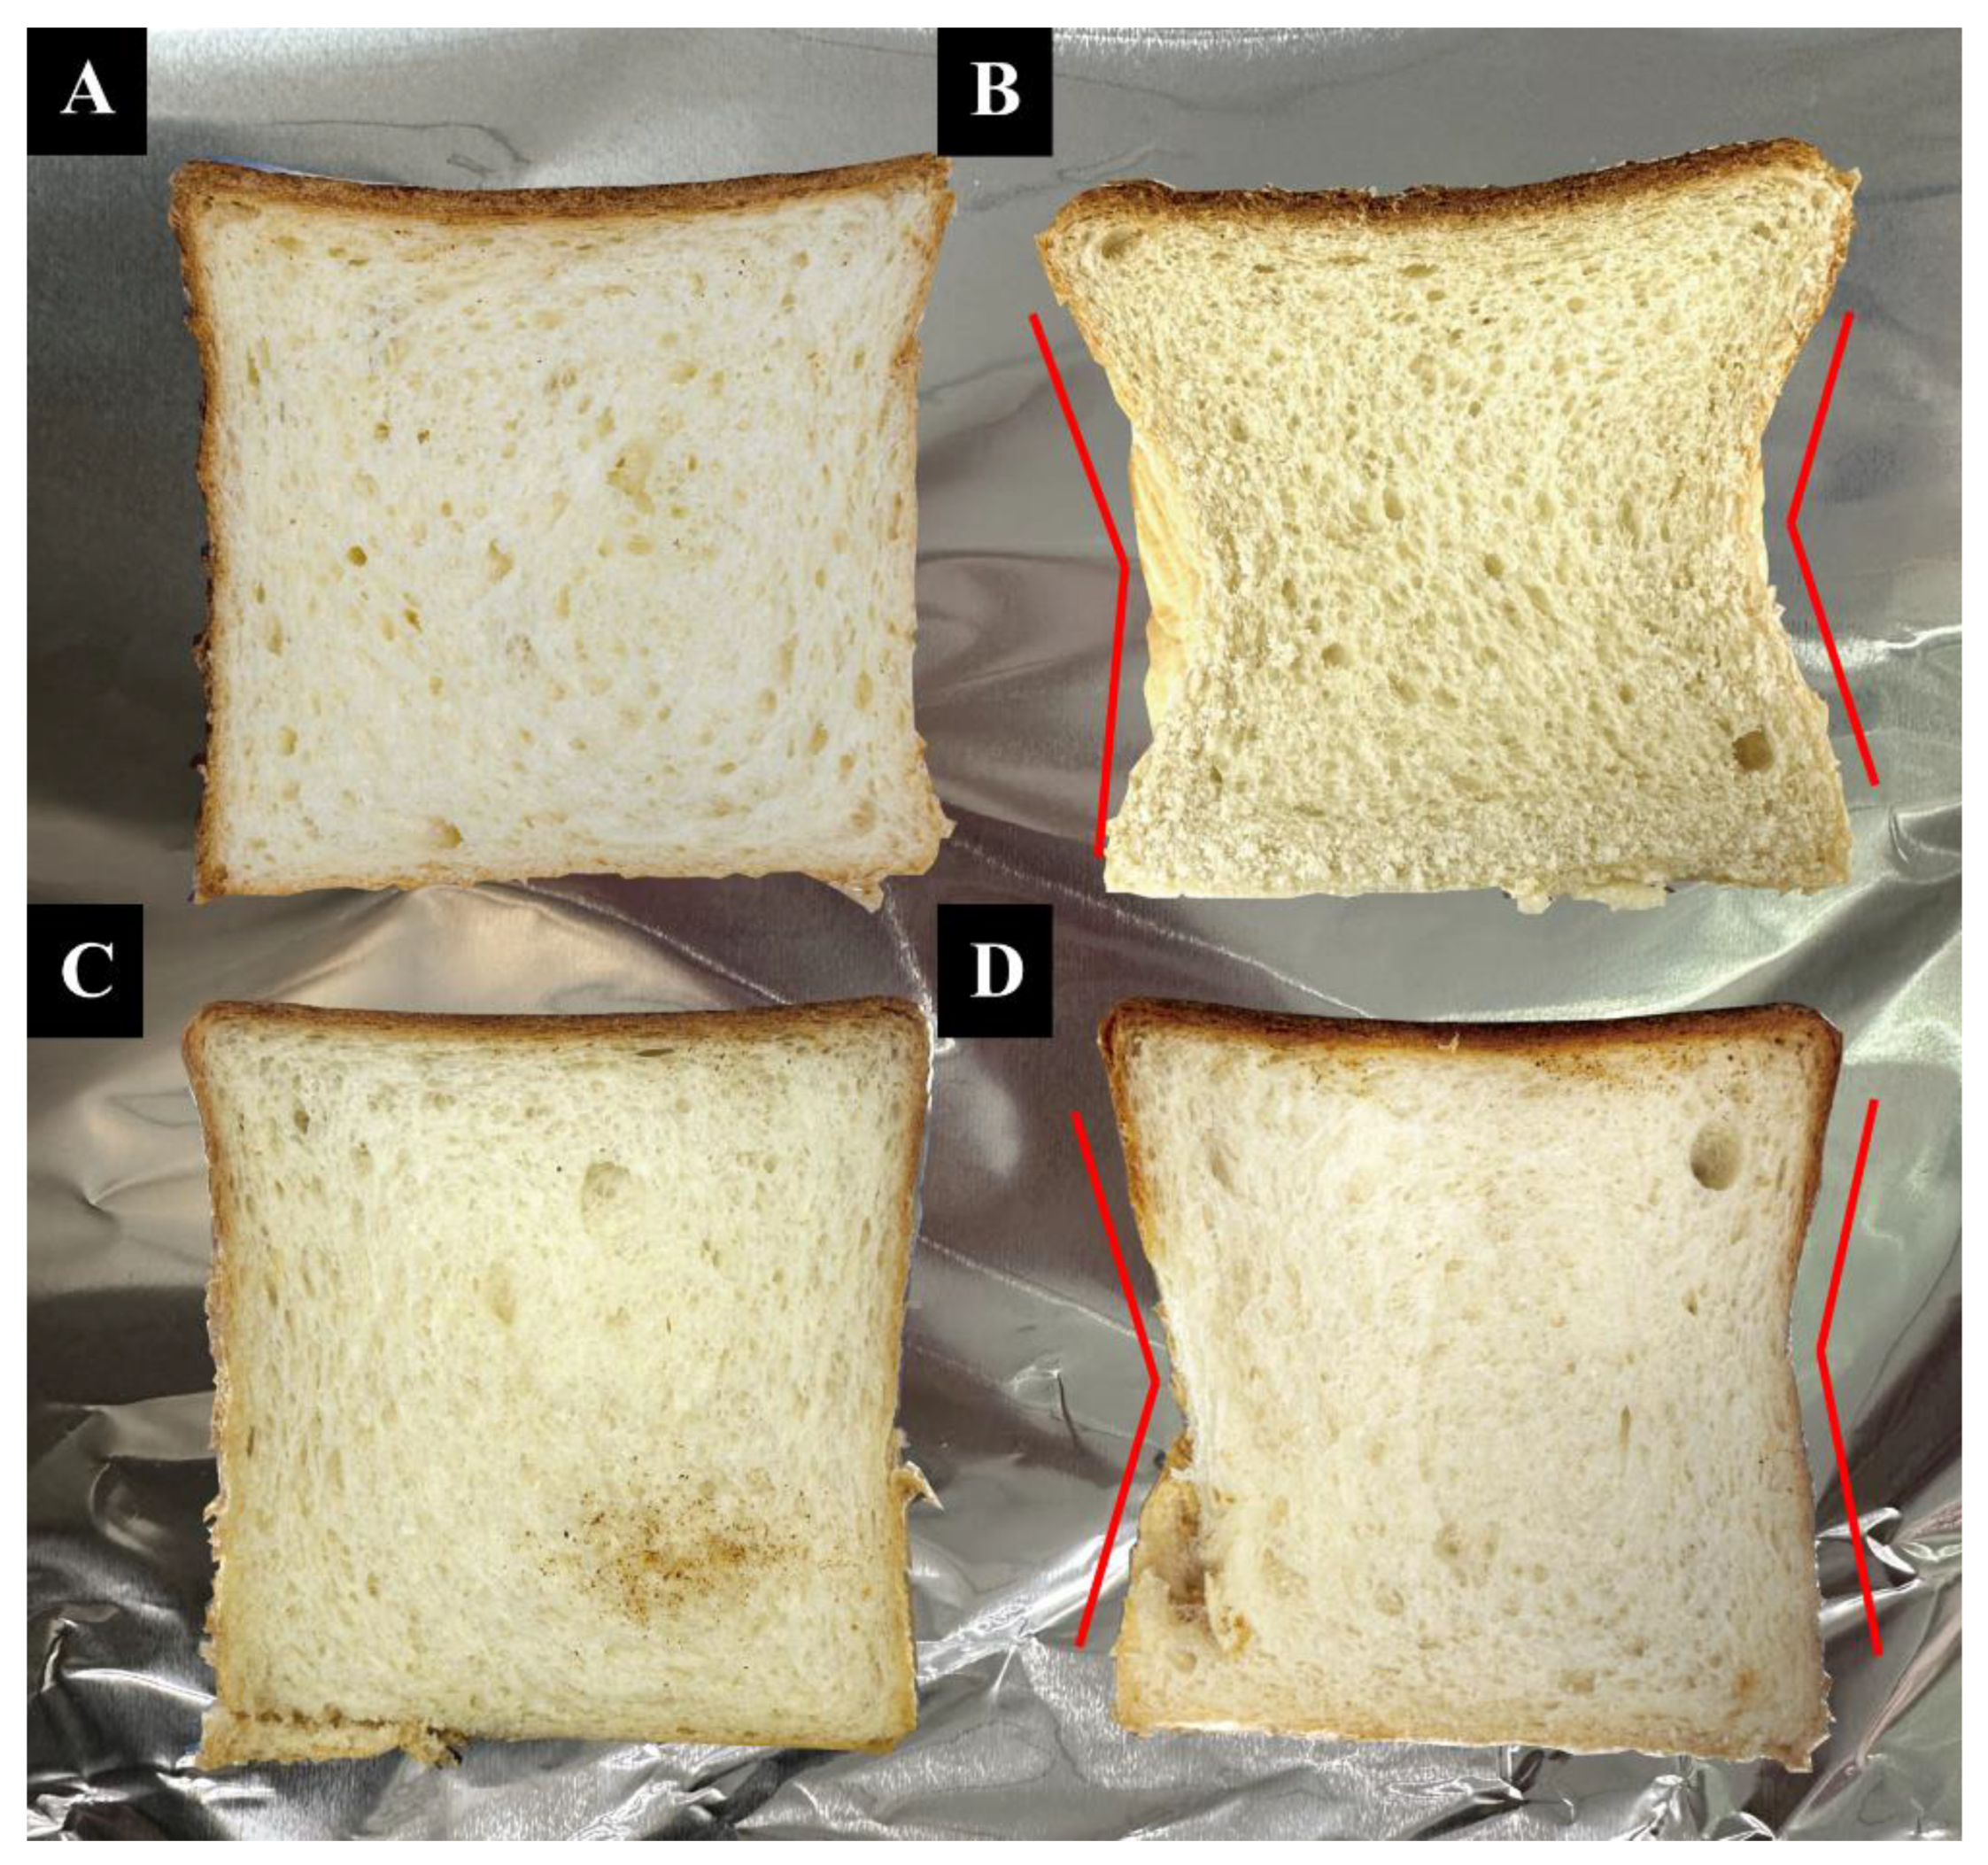
3.2.2. Appearance
4. Conclusions
Author Contributions
Funding
Institutional Review Board Statement
Informed Consent Statement
Data Availability Statement
Conflicts of Interest
References
- Rinaldi, M.; Paciulli, M.; Caligiani, A.; Sgarbi, E.; Cirlini, M.; Dall’Asta, C.; Chiavaro, E. Durum and soft wheat flours in sourdough and straight-dough bread-making. J. Food Sci. Technol. 2015, 52, 6254–6265. [Google Scholar] [CrossRef] [PubMed]
- Ferreyra, L.S.; Verdini, R.A.; Soazo, M.; Piccirilli, G.N. Impact of whey protein addition on wheat bread fermented with a spontaneous sourdough. Int. J. Food Sci. Technol. 2021, 56, 4238–4745. [Google Scholar] [CrossRef]
- Kato, A.; Ibrahim, H.R.; Watanabe, H.; Honma, K.; Kobayashi, K. Enthalpy of Denaturation and Surface Functional Properties of Heated Egg White Proteins in the Dry State. J. Food Sci. 1990, 55, 1280–1283. [Google Scholar] [CrossRef]
- Moore, M.M.; Schober, T.J.; Dockery, P.; Arendt, E.K. Textural Comparisons of Gluten-Free and Wheat-Based Doughs, Batters, and Breads. Cereal Chem. 2004, 81, 567–575. [Google Scholar] [CrossRef]
- Storck, C.R.; da Rosa Zavareze, E.; Gularte, M.A.; Elias, M.C.; Rosell, C.M.; Guerra Dias, A.R. Protein enrichment and its effects on gluten-free bread characteristics. LWT—Food Sci. Technol. 2013, 53, 346–354. [Google Scholar] [CrossRef]
- Eggesbo, M.; Botten, G.; Halvorsen, R.; Magnus, P. The prevalence of allergy to egg: A population-based study in young children. Allergy 2001, 56, 403–411. [Google Scholar] [CrossRef] [PubMed]
- Farbo, M.G.; Fadda, C.; Marceddu, S.; Conte, P.; Del Caro, A.; Piga, A. Improving the quality of dough obtained with old durum wheat using hydrocolloids. Food Hydrocoll. 2020, 101, 105467. [Google Scholar] [CrossRef]
- Li, J.; Zhu, Y.; Yadav, M.P.; Li, J. Effect of various hydrocolloids on the physical and fermentation properties of dough. Food Chem. 2018, 271, 165–173. [Google Scholar] [CrossRef] [PubMed]
- Li, J.; Yadav, M.P.; Li, J. Effect of different hydrocolloids on gluten proteins, starch and dough microstructure. J. Cereal Sci. 2019, 87, 85–90. [Google Scholar] [CrossRef]
- Lin, M.; Tay, S.H.; Yang, H.; Yang, B.; Li, H. Replacement of eggs with soybean protein isolates and polysaccharides to prepare yellow cakes suitable for vegetarians. Food Chem. 2017, 229, 663–673. [Google Scholar] [CrossRef]
- Xiao, X.; Zou, P.-R.; Hu, F.; Zhu, W.; Wei, Z.-J. Updates on Plant-Based Protein Products as an Alternative to Animal Protein: Technology, Properties, and Their Health Benefits. Molecules 2023, 28, 4016. [Google Scholar] [CrossRef] [PubMed]
- Sezgin, A.C.; Sanlier, N. A new generation plant for the conventional cuisine: Quinoa (Chenopodium quinoa Wild.). Trends Food Sci. Technol. 2019, 86, 51–58. [Google Scholar] [CrossRef]
- Abugoch, L.E.; Romero, N.; Tapia, C.A.; Silva, J.; Rivera, M. Study of some physicochemical and functional properties of quinoa (chenopodium quinoa willd) protein isolates. J. Agric. Food Chem. 2008, 56, 4745–4750. [Google Scholar] [CrossRef] [PubMed]
- Miranda, M.; Vega-Gálvez, A.; López, J.; Parada, G.; Sanders, M.; Aranda, M.; Uribe, E.; Di Scala, K. Impact of air-drying temperature on nutritional properties, total phenolic content and antioxidant capacity of quinoa seeds (Chenopodium quinoa Willd.). Ind. Crops Prod. 2010, 32, 258–263. [Google Scholar] [CrossRef]
- Dakhili, S.; Abdolalizadeh, L.; Hosseini, S.M.; Shojaee-Aliabadi, S.; Mirmoghtadaie, L. Quinoa protein: Composition, structure and functional properties. Food Chem. 2019, 299, 125161. [Google Scholar] [CrossRef] [PubMed]
- Doi, E.; Kitabatake, N. Structure and Functionality of Egg Proteins; CRC Press: Boca Raton, FL, USA, 2017; pp. 325–340. [Google Scholar] [CrossRef]
- Galante, M.; De Flaviis, R.; Boeris, V.; Spelzini, D. Effects of the enzymatic hydrolysis treatment on functional and antioxidant properties of quinoa protein acid-induced gels. LWT—Food Sci. Technol. 2020, 118, 108845. [Google Scholar] [CrossRef]
- Yang, Z.; de Campo, L.; Gilbert, E.P.; Knott, R.; Cheng, L.R.; Storer, B.; Lin, X.L.; Luo, L.; Patole, S.; Hemar, Y. Effect of NaCl and CaCl2 concentration on the rheological and structural characteristics of thermally-induced quinoa protein gels. Food Hydrocoll. 2022, 124, 107350. [Google Scholar] [CrossRef]
- Cao, H.; Wang, X.; Wang, C.; Huang, K.; Zhang, Y.; Song, H.; Zhang, Y.; Guan, X. Synergistic improvement of quinoa protein heat-induced gel properties treated by high-intensity ultrasonic combined with transglutaminase. J. Sci. Food Agric. 2023, 103, 7021–7029. [Google Scholar] [CrossRef]
- Lin, D.; Lu, W.; Kelly, A.L.; Zhang, L.; Zheng, B.; Miao, S. Interactions of vegetable proteins with other polymers: Structure-function relationships and applications in the food industry. Trends Food Sci. Technol. 2017, 68, 130–144. [Google Scholar] [CrossRef]
- Zuo, Z.; Geng, Z.; Zhang, X.; Ma, T.; Liu, H.; Wang, L. Ultrasonic treatment influences the compactness of quinoa protein microstructure and improves the structural integrity of quinoa protein at the interfaces of high internal phase emulsion. Food Res. Int. 2023, 168, 112713. [Google Scholar] [CrossRef]
- Bot, F.; Calligaris, S.; Cortella, G.; Plazzotta, S.; Nocera, F.; Anese, M. Study on high pressure homogenization and high power ultrasound effectiveness in inhibiting polyphenoloxidase activity in apple juice. J. Food Eng. 2018, 221, 70–76. [Google Scholar] [CrossRef]
- Liu, S.; Xie, Y.; Li, B.; Li, S.; Yu, W.; Ye, A.; Guo, Q. Structural Properties of Quinoa Protein Isolate: Impact of Neutral to High Alkaline Extraction pH. Foods 2023, 12, 2589. [Google Scholar] [CrossRef] [PubMed]
- Opazo-Navarrete, M.; Altenburg, M.D.; Boom, R.M.; Janssen, A.E.M. The Effect of Gel Microstructure on Simulated Gastric Digestion of Protein Gels. Food Biophys. 2018, 13, 124–138. [Google Scholar] [CrossRef]
- Zhang, J.; Liang, L.; Tian, Z.; Chen, L.; Subirade, M. Preparation and in vitro evaluation of calcium-induced soy protein isolate nanoparticles and their formation mechanism study. Food Chem. 2012, 133, 390–399. [Google Scholar] [CrossRef] [PubMed]
- Beveridge, T.; Toma, S.J.; Nakai, S. Determination of SH- and SS-Groups in Some Food Proteins Using Ellman’s Reagent. J. Food Sci. 1974, 39, 49–51. [Google Scholar] [CrossRef]
- Cao, H.; Huang, Q.; Wang, C.; Guan, X.; Huang, K.; Zhang, Y. Effect of compositional interaction on in vitro digestion of starch during the milling process of quinoa. Food Chem. 2022, 403, 134372. [Google Scholar] [CrossRef] [PubMed]
- Zhang, P.; Bao, Z.-Y.; Wang, H.; Tu, Z.-C.; Sha, X.-M.; Hu, Y.-M. Ultrasonic pretreatment improved the physicochemical properties and riboflavin delivery ability of transglutaminase-catalyzed soy protein isolate gel. Food Hydrocoll. 2022, 131, 107782. [Google Scholar] [CrossRef]
- Liu, Q.; Liu, Y.; Huang, H.; Xiong, M.; Yang, Y.; Lin, C.; Yang, F.; Xie, Y.; Yuan, Y. Improvement of the emulsifying properties of Zanthoxylum seed protein by ultrasonic modification. Ultrason. Sonochem. 2023, 100, 106638. [Google Scholar] [CrossRef]
- Ruiz, G.A.; Xiao, W.; van Boekel, M.; Minor, M.; Stieger, M. Effect of extraction pH on heat-induced aggregation, gelation and microstructure of protein isolate from quinoa (Chenopodium quinoa Willd). Food Chem. 2016, 209, 203–210. [Google Scholar] [CrossRef]
- Wang, R.-X.; Li, Y.-Q.; Sun, G.-J.; Wang, C.-Y.; Liang, Y.; Hua, D.-L.; Chen, L.; Mo, H.-Z. The improvement and mechanism of gelation properties of mung bean protein treated by ultrasound. LWT 2023, 182, 114811. [Google Scholar] [CrossRef]
- Renkema, J.M.S.; Knabben, J.H.M.; van Vliet, T. Gel formation by β-conglycinin and glycinin and their mixtures. Food Hydrocoll. 2001, 15, 407–414. [Google Scholar] [CrossRef]
- Xue, H.; Liu, H.; Wu, N.; Zhang, G.; Tu, Y.; Zhao, Y. Improving the gel properties of duck egg white by synergetic phosphorylation/ultrasound: Gel properties, crystalline structures, and protein structure. Ultrason. Sonochem. 2022, 89, 106149. [Google Scholar] [CrossRef]
- Cao, H.; Sun, R.; Shi, J.; Li, M.; Guan, X.; Liu, J.; Huang, K.; Zhang, Y. Effect of ultrasonic on the structure and quality characteristics of quinoa protein oxidation aggregates. Ultrason. Sonochem. 2021, 77, 105685. [Google Scholar] [CrossRef] [PubMed]
- Cortez-Trejo, M.C.; Loarca-Piña, G.; Figueroa-Cárdenas, J.D.; Manríquez, J.; Mendoza, S. Gel properties of acid-induced gels obtained at room temperature and based on common bean proteins and xanthan gum. Food Hydrocoll. 2022, 132, 107873. [Google Scholar] [CrossRef]
- Geremias-Andrade, I.M.; Souki, N.P.D.B.G.; Moraes, I.C.F.; Pinho, S.C. Rheological and mechanical characterization of curcumin-loaded emulsion-filled gels produced with whey protein isolate and xanthan gum. LWT—Food Sci. Technol. 2017, 86, 166–173. [Google Scholar] [CrossRef]
- Xie, J.; Ren, Y.; Xiao, Y.; Luo, Y.; Shen, M. Interactions between tapioca starch and Mesona chinensis polysaccharide: Effects of urea and NaCl. Food Hydrocoll. 2021, 111, 106268. [Google Scholar] [CrossRef]
- Ma, C.-M.; Zhao, X.-H. Depicting the Non-Covalent Interaction of Whey Proteins with Galangin or Genistein Using the Multi-Spectroscopic Techniques and Molecular Docking. Foods 2019, 8, 360. [Google Scholar] [CrossRef]
- Buchko, G.W.; Robinson, H.; Pakrasi, H.B.; Kennedy, M.A. Insights into the structural variation between pentapeptide repeat proteins--crystal structure of Rfr23 from Cyanothece 51142. J. Struct. Biol. 2007, 162, 184–192. [Google Scholar] [CrossRef]
- Shewry, P.R.; Popineau, Y.; Lafiandra, D.; Belton, P. Wheat glutenin subunits and dough elasticity: Findings of the EUROWHEAT project. Trends Food Sci. Technol. 2000, 11, 433–441. [Google Scholar] [CrossRef]
- Yang, J.; Dou, J.; Zhu, B.; Ning, Y.; Wang, H.; Huang, Y.; Li, Y.; Qi, B.; Jiang, L. Multi-dimensional analysis of heat-induced soybean protein hydrolysate gels subjected to ultrasound-assisted pH pretreatment. Ultrason. Sonochem. 2023, 95, 106403. [Google Scholar] [CrossRef]
- Alting, A.C.; Hamer, R.J.; de Kruif, C.G.; Visschers, R.W. Cold-set globular protein gels: Interactions, structure and rheology as a function of protein concentration. J. Agric. Food Chem. 2003, 51, 3150–3156. [Google Scholar] [CrossRef] [PubMed]
- Brückner-Gühmann, M.; Banovic, M.; Drusch, S. Towards an increased plant protein intake: Rheological properties, sensory perception and consumer acceptability of lactic acid fermented, oat-based gels. Food Hydrocoll. 2019, 96, 201–208. [Google Scholar] [CrossRef]
- Liu, J.; Li, Z.; Lin, Q.; Jiang, X.; Yao, J.; Yang, Y.; Shao, Z.; Chen, X. A Robust, Resilient, and Multi-Functional Soy Protein-Based Hydrogel. ACS Sustain. Chem. Eng. 2018, 6, 13730–13738. [Google Scholar] [CrossRef]
- Wee, M.S.M.; Goh, A.T.; Stieger, M.; Forde, C.G. Correlation of instrumental texture properties from textural profile analysis (TPA) with eating behaviours and macronutrient composition for a wide range of solid foods. Food Funct. 2018, 9, 5301–5312. [Google Scholar] [CrossRef] [PubMed]
- Le, X.T.; Turgeon, S.L. Textural and waterbinding behaviors of β-lactoglobulin-xanthan gum electrostatic hydrogels in relation to their microstructure. Food Hydrocoll. 2015, 49, 216–223. [Google Scholar] [CrossRef]
- Acar, H.; Kurt, A. Purified salep glucomannan synergistically interacted with xanthan gum: Rheological and textural studies on a novel pH-/thermo-sensitive hydrogel. Food Hydrocoll. 2020, 101, 105461. [Google Scholar] [CrossRef]
- Le, X.T.; Rioux, L.-E.; Turgeon, S.L. Formation and functional properties of protein-polysaccharide electrostatic hydrogels in comparison to protein or polysaccharide hydrogels. Adv. Colloid Interface Sci. 2016, 239, 127–135. [Google Scholar] [CrossRef]
- Eduardo, M.; Svanberg, U.; Ahrné, L. Effect of hydrocolloids and emulsifiers on the shelf-life of composite cassava-maize-wheat bread after storage. Food Sci. Nutr. 2016, 4, 636–644. [Google Scholar] [CrossRef]
- Chen, J.; Zeng, X.; Chai, J.; Zhou, G.; Xu, X. Improvement of the emulsifying properties of mixed emulsifiers by optimizing ultrasonic-assisted processing. Ultrason. Sonochem. 2023, 95, 106397. [Google Scholar] [CrossRef]
- Garzón, R.; Hernando, I.; Llorca, E.; Rosell, C.M. Understanding emulsifiers effect on bread aeration during breadmaking. J. Sci. Food Agric. 2018, 98, 5494–5502. [Google Scholar] [CrossRef]
- Guiné, R.P.F. Textural Properties of Bakery Products: A Review of Instrumental and Sensory Evaluation Studies. Appl. Sci. 2022, 12, 8628. [Google Scholar] [CrossRef]
- Cao, Y.; Mezzenga, R. Design principles of food gels. Nat. Food 2020, 1, 106–118. [Google Scholar] [CrossRef] [PubMed]


| Protein Concentration | Total Sulfhydryl Group | Free Sulfhydryl | Disulfide Bond | |
|---|---|---|---|---|
| (umol/g) | (umol/g) | (umol/g) | ||
| 5% | XG-QPG (pH 7.0) | 110.91 ± 4.79 c | 47.90 ± 1.13 b | 31.51 ± 1.83 def |
| XG-UQPG (pH 7.0) | 115.21 ± 0.92 bc | 19.34 ± 0.69 e | 47.93 ± 0.23 ab | |
| XG-UQPG (pH 4.5) | 106.27 ± 2.82 c | 74.21 ±1.41 a | 16.03 ± 0.70 g | |
| 6% | XG-QPG (pH 7.0) | 124.63 ± 2.81 b | 48.30 ± 0.60 b | 38.17 ± 1.70 cd |
| XG-UQPG (pH 7.0) | 155.12 ± 1.58 a | 31.95 ± 0.30 d | 61.58 ± 0.64 a | |
| XG-UQPG (pH 4.5) | 112.05 ± 0.36 bc | 43.66 ± 6.47 bc | 34.20 ± 3.42 de | |
| 7% | XG-QPG (pH 7.0) | 82.74 ± 5.49 d | 33.95 ± 0.01 cd | 24.40 ± 2.75 f |
| XG-UQPG (pH 7.0) | 107.24 ± 2.01 c | 35.64 ± 0.47 cd | 35.80 ± 1.24 de | |
| XG-UQPG (pH 4.5) | 105.37 ± 2.40 c | 80.27 ± 8.65 a | 12.55 ± 3.13 g | |
| 8% | XG-QPG (pH 7.0) | 103.55 ± 1.91 c | 43.17 ± 0.13 bc | 30.19 ± 1.02 ef |
| XG-UQPG (pH 7.0) | 109.61 ± 8.17 c | 19.65 ± 1.27 e | 44.98 ± 3.45 bc | |
| XG-UQPG (pH 4.5) | 83.08 ± 3.97 d | 52.20 ± 0.46 b | 15.44 ± 0.70 g |
| Samples | Hardness | Springiness | Chewiness | Resilience | |
|---|---|---|---|---|---|
| gf | gf | ||||
| 5% | XG-QPG (pH 7.0) | 15.61 ± 0.11 d | 0.46 ± 0.01 bcde | 4.37 ± 0.15 d | 0.032 ± 0.006 c |
| XG-UQPG (pH 7.0) | 17.83 ± 2.30 d | 0.51 ± 0.04 abc | 6.63 ± 0.00 d | 0.036 ± 0.003 c | |
| XG-UQPG (pH 4.5) | 79.32 ± 13.56 c | 0.52 ± 0.01 abc | 27.07 ± 4.50 c | 0.133 ± 0.000 a | |
| 6% | XG-QPG (pH 7.0) | 17.61 ± 0.76 d | 0.48 ± 0.01 bcd | 5.33 ± 0.53 d | 0.035 ± 0.000 c |
| XG-UQPG (pH 7.0) | 20.88 ± 1.94 d | 0.54 ± 0.02 abc | 7.44 ± 0.34 d | 0.037 ± 0.002 c | |
| XG-UQPG (pH 4.5) | 142.68 ± 11.71 a | 0.62 ± 0.02 a | 58.68 ± 8.63 a | 0.111 ± 0.003 ab | |
| 7% | XG-QPG (pH 7.0) | 21.10 ± 2.18 d | 0.37 ± 0.10 de | 4.07 ± 1.11 d | 0.033 ± 0.011 c |
| XG-UQPG (pH 7.0) | 22.69 ± 1.03 d | 0.44 ± 0.01 cde | 5.84 ± 0.19 d | 0.037 ± 0.001 c | |
| XG-UQPG (pH 4.5) | 105.47 ± 13.30 b | 0.59 ± 0.01 a | 41.40 ± 5.35 b | 0.094 ± 0.011 b | |
| 8% | XG-QPG (pH 7.0) | 23.91 ± 0.59 d | 0.35 ± 0.01 e | 3.35 ± 0.44 b | 0.032 ± 0.003 c |
| XG-UQPG (pH 7.0) | 32.02 ± 1.73 d | 0.57 ± 0.02 ab | 10.59 ± 0.60 d | 0.035 ± 0.003 c | |
| XG-UQPG (pH 4.5) | 109.87 ± 5.41 b | 0.60 ± 0.01 a | 47.11 ± 1.25 b | 0.131 ± 0.018 a |
| Samples | Hardness | Springiness | Chewiness | Resilience |
|---|---|---|---|---|
| (g) | (g) | (g) | ||
| Egg bread | 234.91 ± 1.46 a | 0.88 ± 0.0037 ab | 165.44 ± 0.50 a | 0.18 ± 0.0064 b |
| XG-UQPG (pH 4.5) | 119.48 ± 2.16 c | 0.83 ± 0.0305 b | 76.99 ± 1.70 c | 0.17 ± 0.0032 b |
| XG-UQPG (pH 7.0) | 137.67 ± 3.11 b | 0.91 ± 0.0096 a | 97.77 ± 1.80 b | 0.20 ± 0.0032 a |
| XG-QPG (pH 7.0) | 108.08 ± 2.11 d | 0.83 ± 0.0043 b | 64.91 ± 2.17 d | 0.17 ± 0.0019 b |
Disclaimer/Publisher’s Note: The statements, opinions and data contained in all publications are solely those of the individual author(s) and contributor(s) and not of MDPI and/or the editor(s). MDPI and/or the editor(s) disclaim responsibility for any injury to people or property resulting from any ideas, methods, instructions or products referred to in the content. |
© 2024 by the authors. Licensee MDPI, Basel, Switzerland. This article is an open access article distributed under the terms and conditions of the Creative Commons Attribution (CC BY) license (https://creativecommons.org/licenses/by/4.0/).
Share and Cite
Xu, Q.; Zhang, X.; Zuo, Z.; Zhang, M.; Li, T.; Wang, L. The Preparation and Characterization of Quinoa Protein Gels and Application in Eggless Bread. Foods 2024, 13, 1271. https://doi.org/10.3390/foods13081271
Xu Q, Zhang X, Zuo Z, Zhang M, Li T, Wang L. The Preparation and Characterization of Quinoa Protein Gels and Application in Eggless Bread. Foods. 2024; 13(8):1271. https://doi.org/10.3390/foods13081271
Chicago/Turabian StyleXu, Qianqian, Xinxia Zhang, Zhongyu Zuo, Ming Zhang, Ting Li, and Li Wang. 2024. "The Preparation and Characterization of Quinoa Protein Gels and Application in Eggless Bread" Foods 13, no. 8: 1271. https://doi.org/10.3390/foods13081271
APA StyleXu, Q., Zhang, X., Zuo, Z., Zhang, M., Li, T., & Wang, L. (2024). The Preparation and Characterization of Quinoa Protein Gels and Application in Eggless Bread. Foods, 13(8), 1271. https://doi.org/10.3390/foods13081271