
Optimization of Desalting Conditions for the Green Seaweed Codium fragile for Use as a Functional Food with Hypnotic Effects


Abstract

1. Introduction
2. Materials and Methods
2.1. Materials
2.2. Desalination
2.2.1. Immersion
2.2.2. Post-Desalination Processes
2.3. Design and Statistical Analysis of Experiments
2.4. Powder
2.5. Extract
2.6. Determination of Salt Content
2.7. Determination of TPC
2.8. Energy-Dispersive X-Ray Spectrometer (EDS) Mapping of Sodium Ions on the Surface and Cross-Section
2.9. Animals
2.10. Pentobarbital-Induced Sleep Test
2.11. Analysis of Sleep Architecture
2.12. Statistical Analysis
3. Results
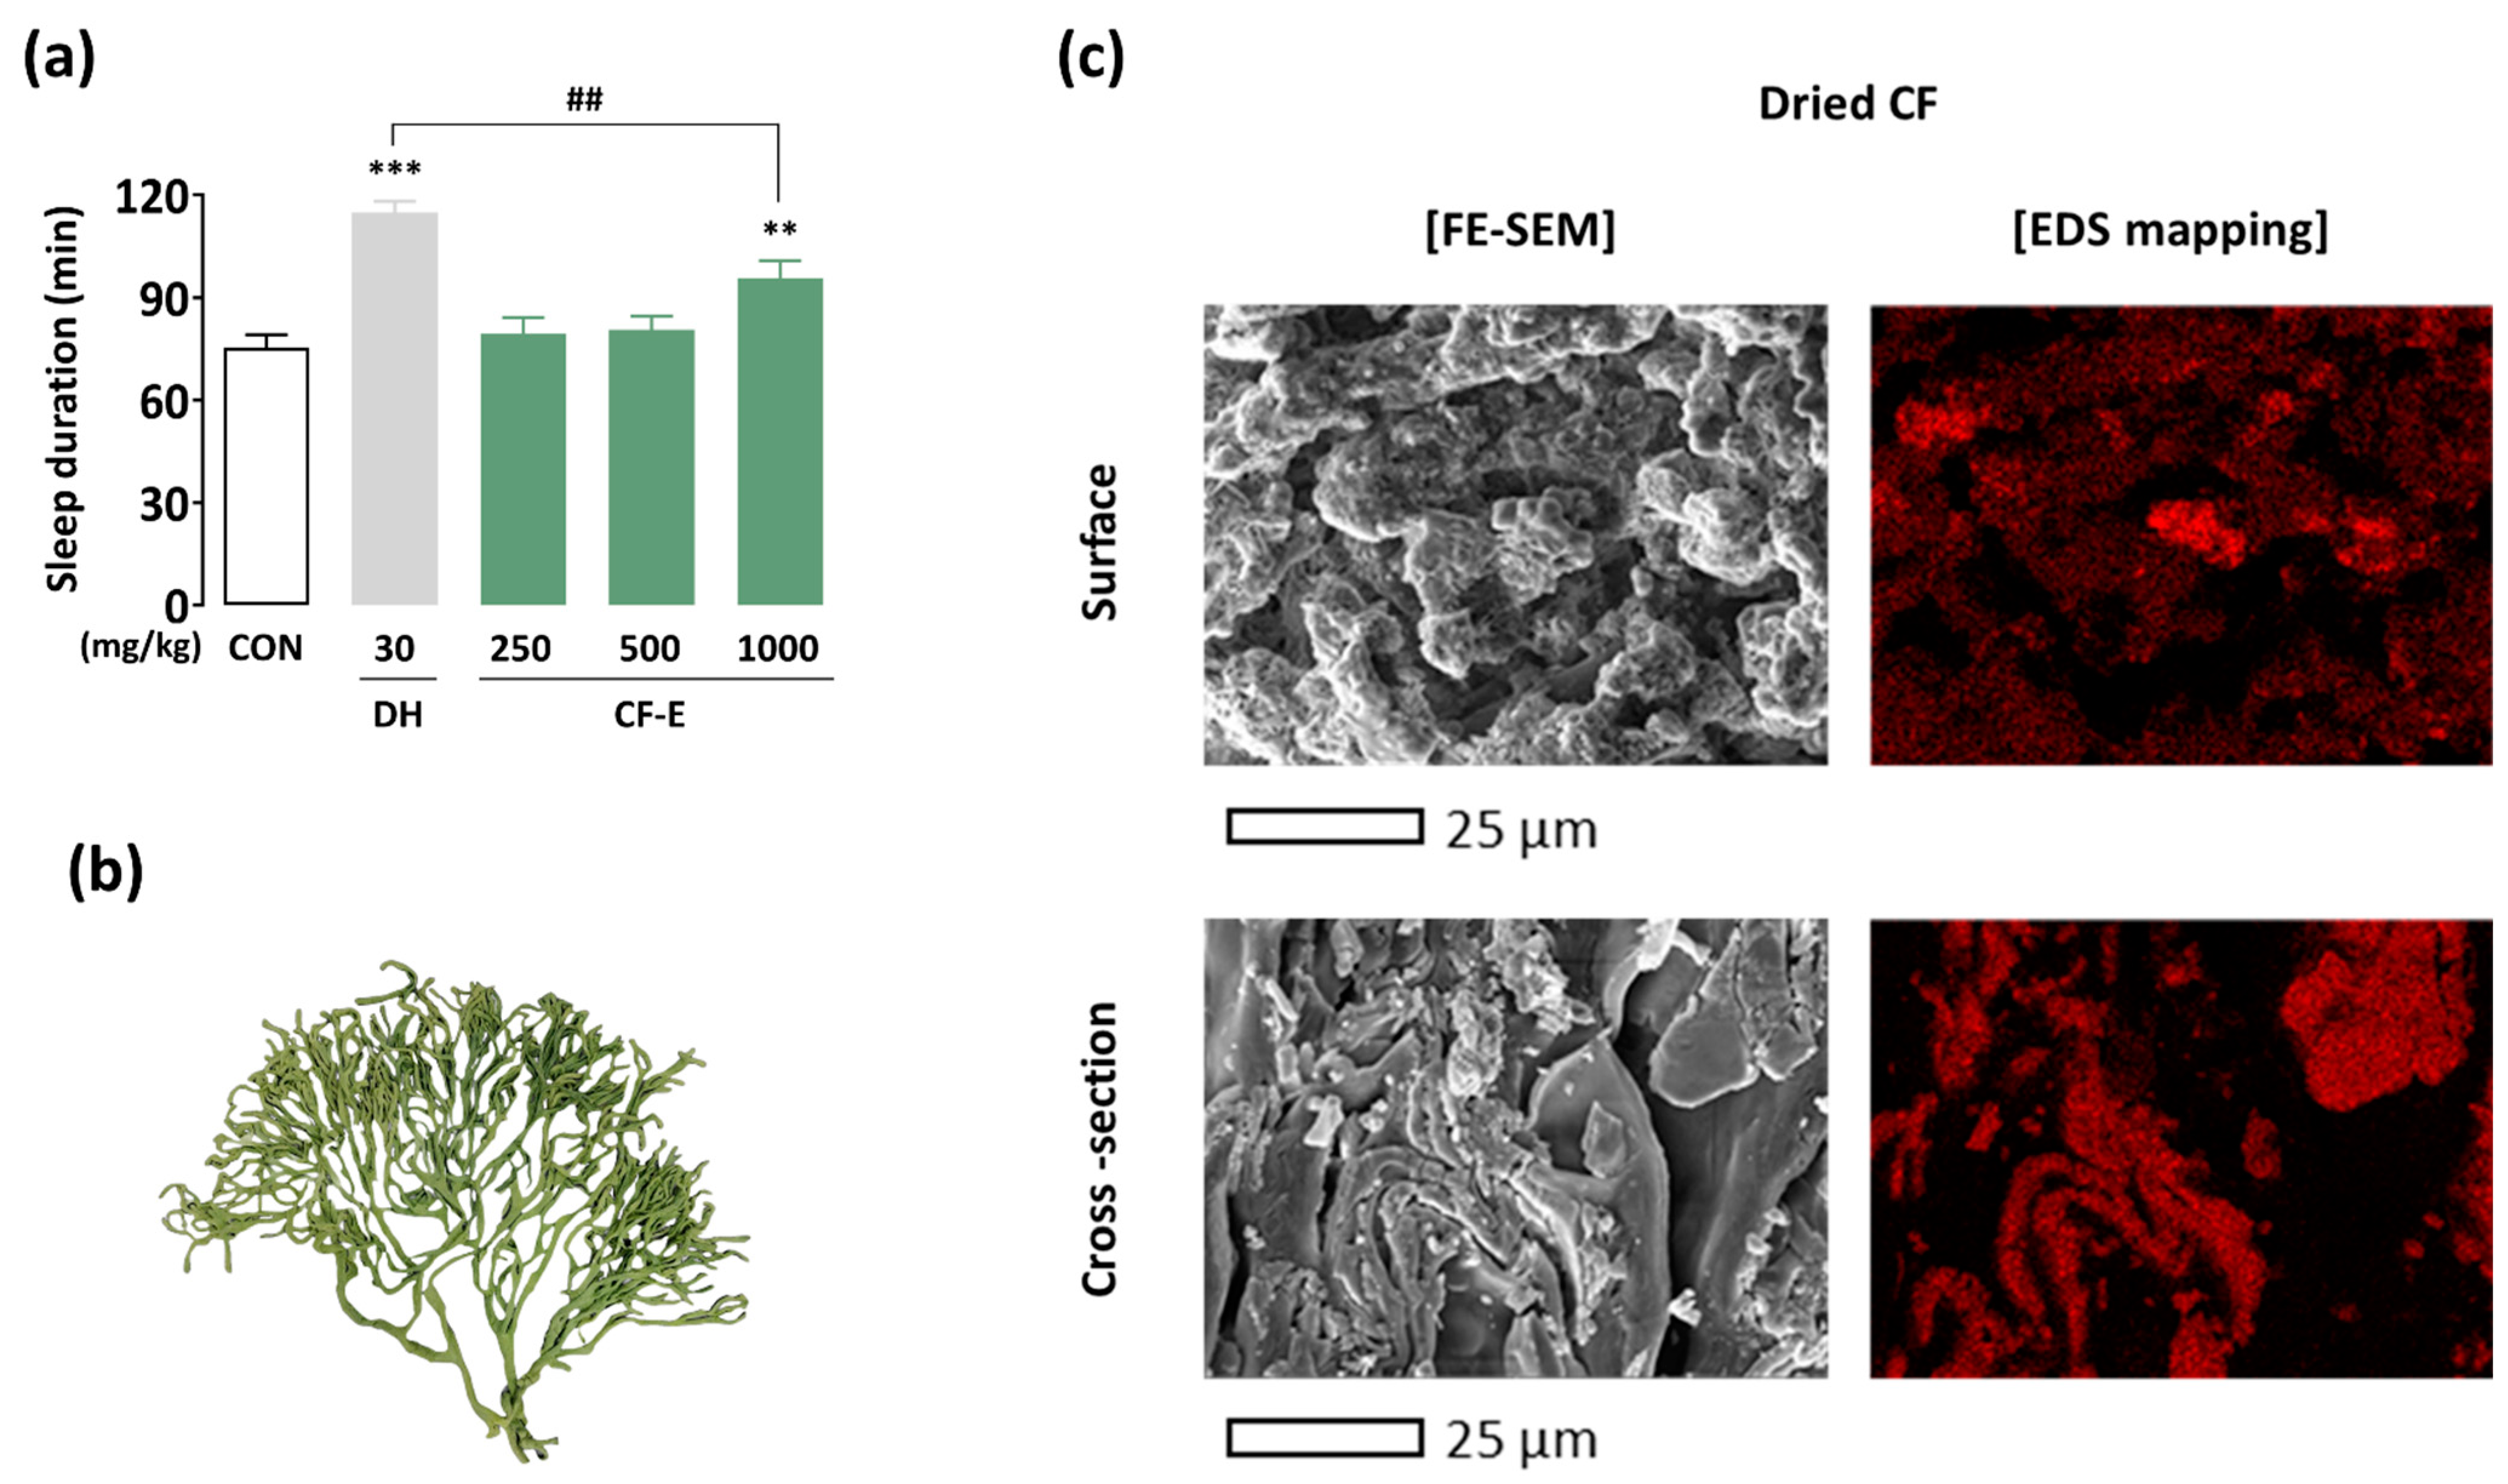
3.1. Hypnotic Effect of CF Ethanol Extract
3.2. Texture and Sodium Ion Distribution of the Dried CF
3.3. Optimization of Immersion Conditions of CF
3.3.1. Evaluation of the Fitted Models Through Diagnostic Checking
3.3.2. Analysis of Variance
3.3.3. Response Surface Plots and the Effect of Factors
3.3.4. Optimal Immersion Conditions and Verification
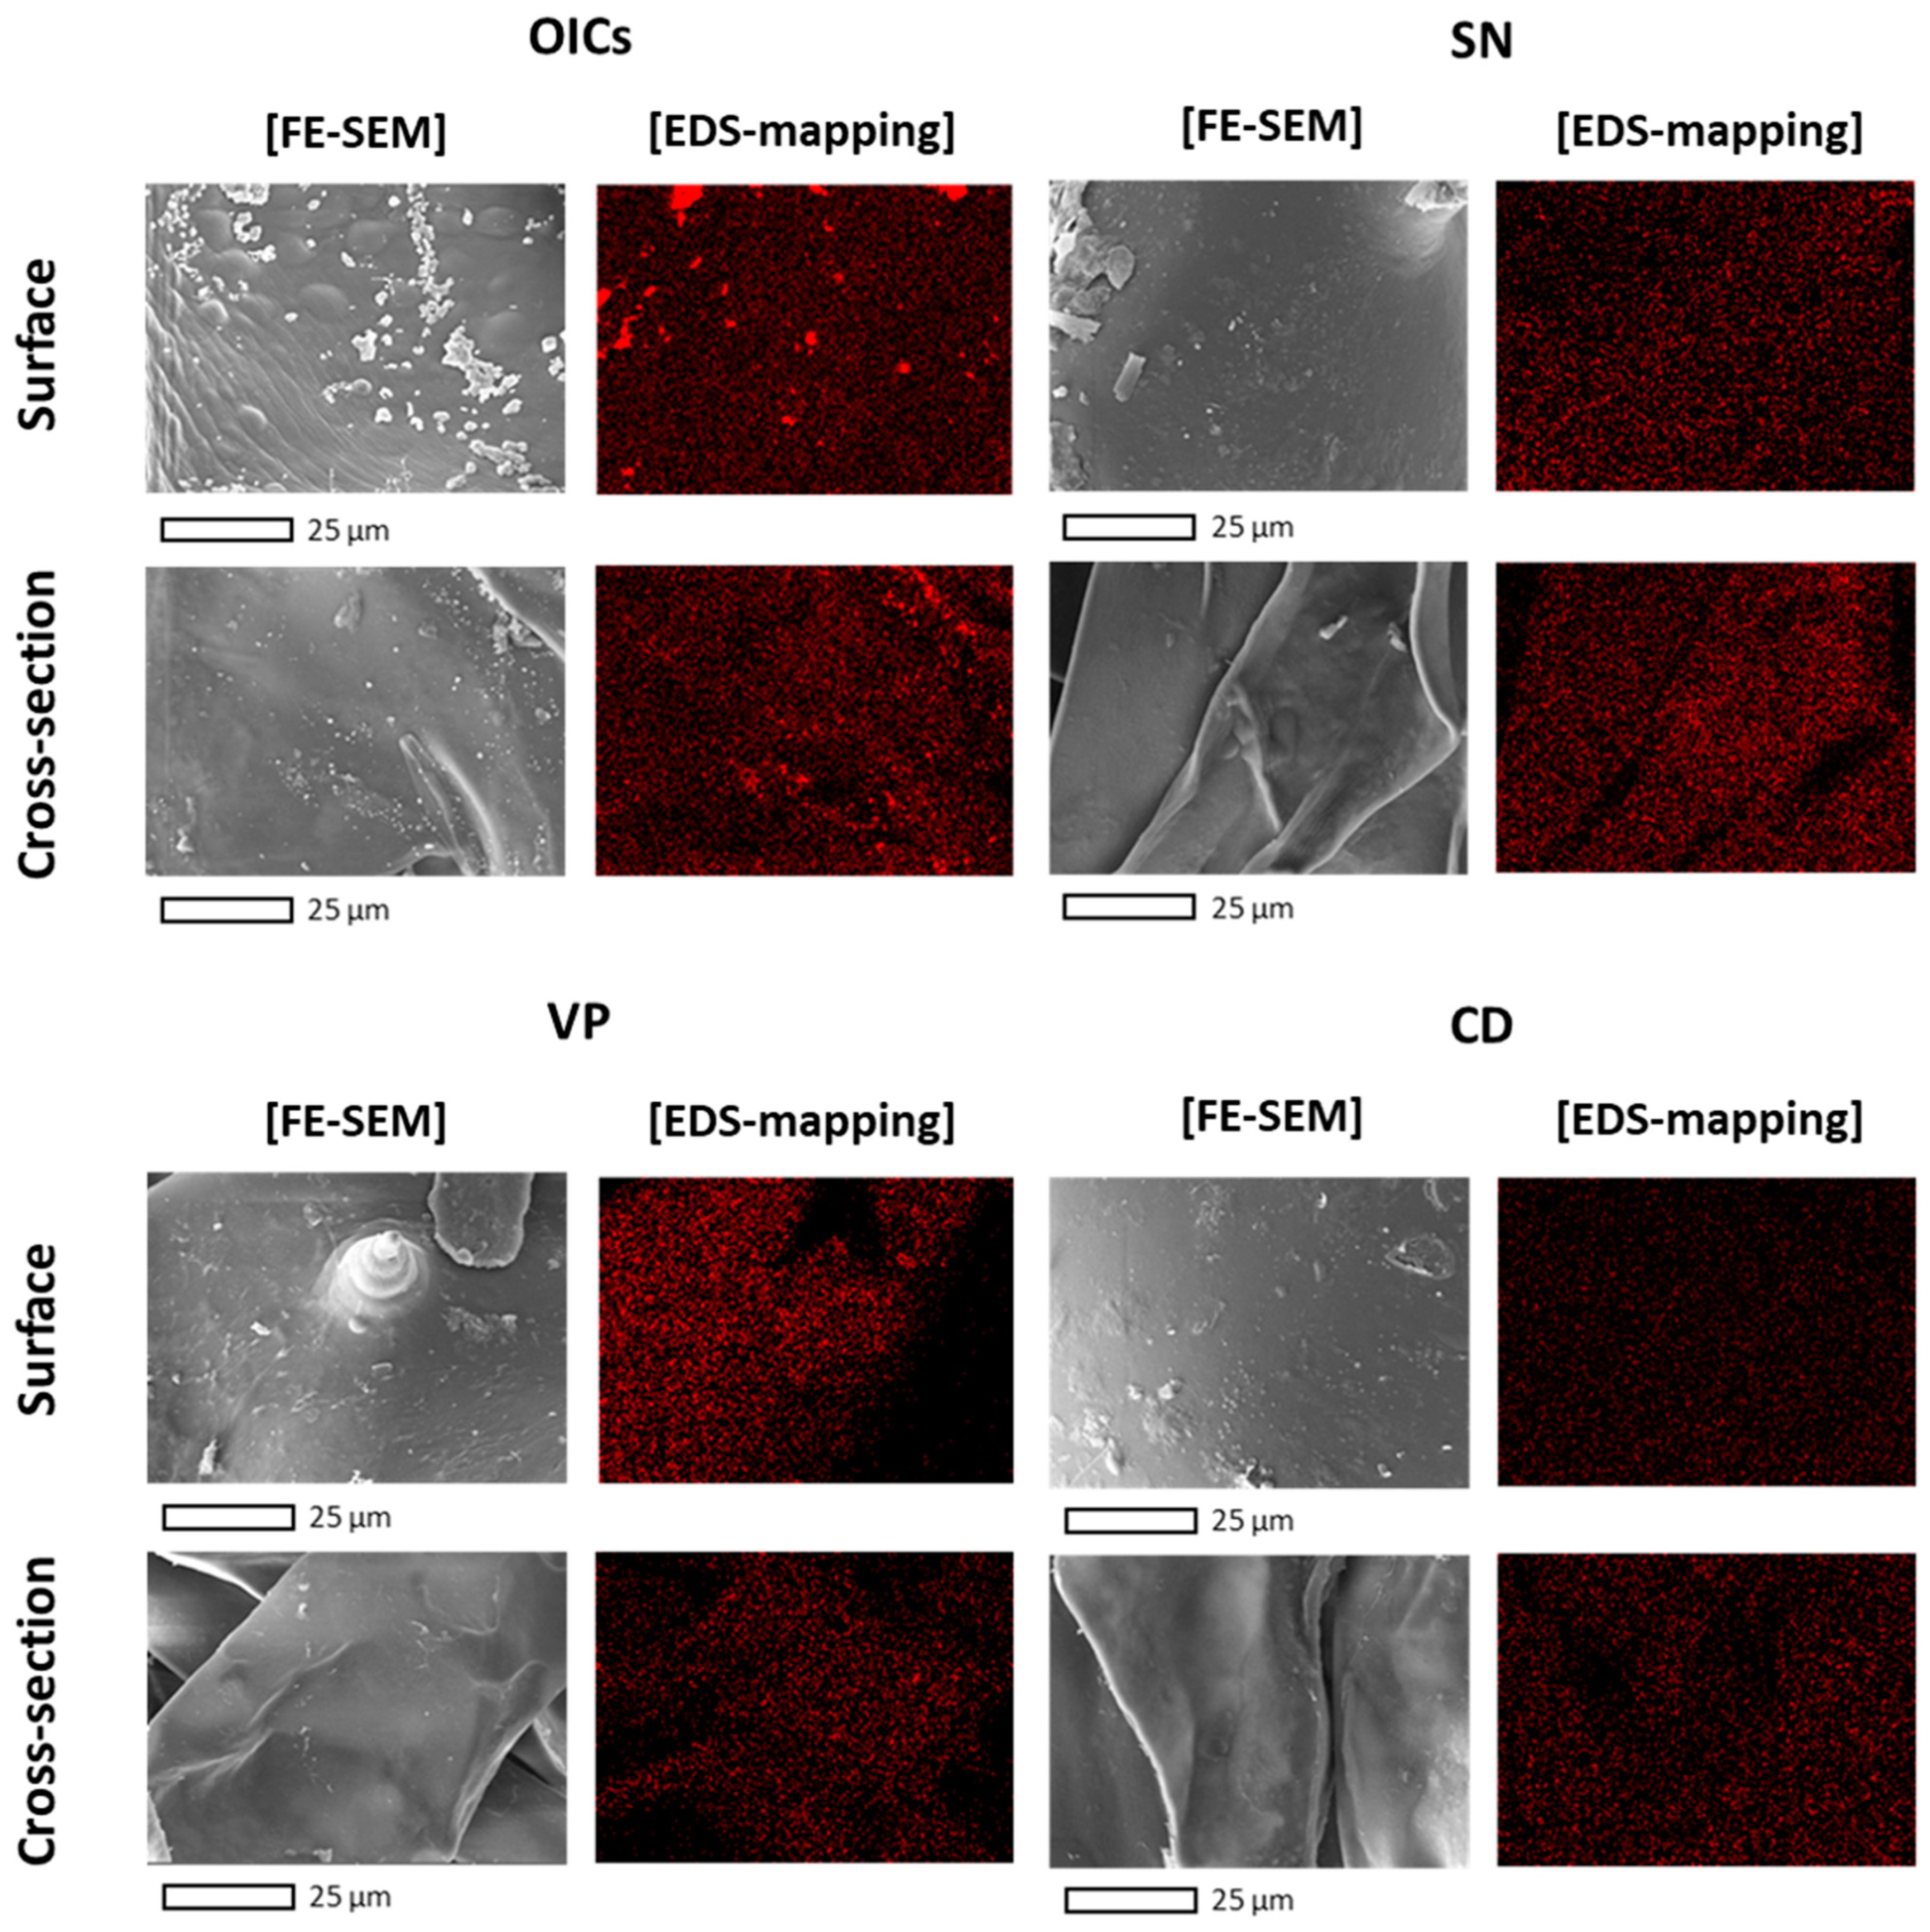
3.4. Post-Desalination Processes
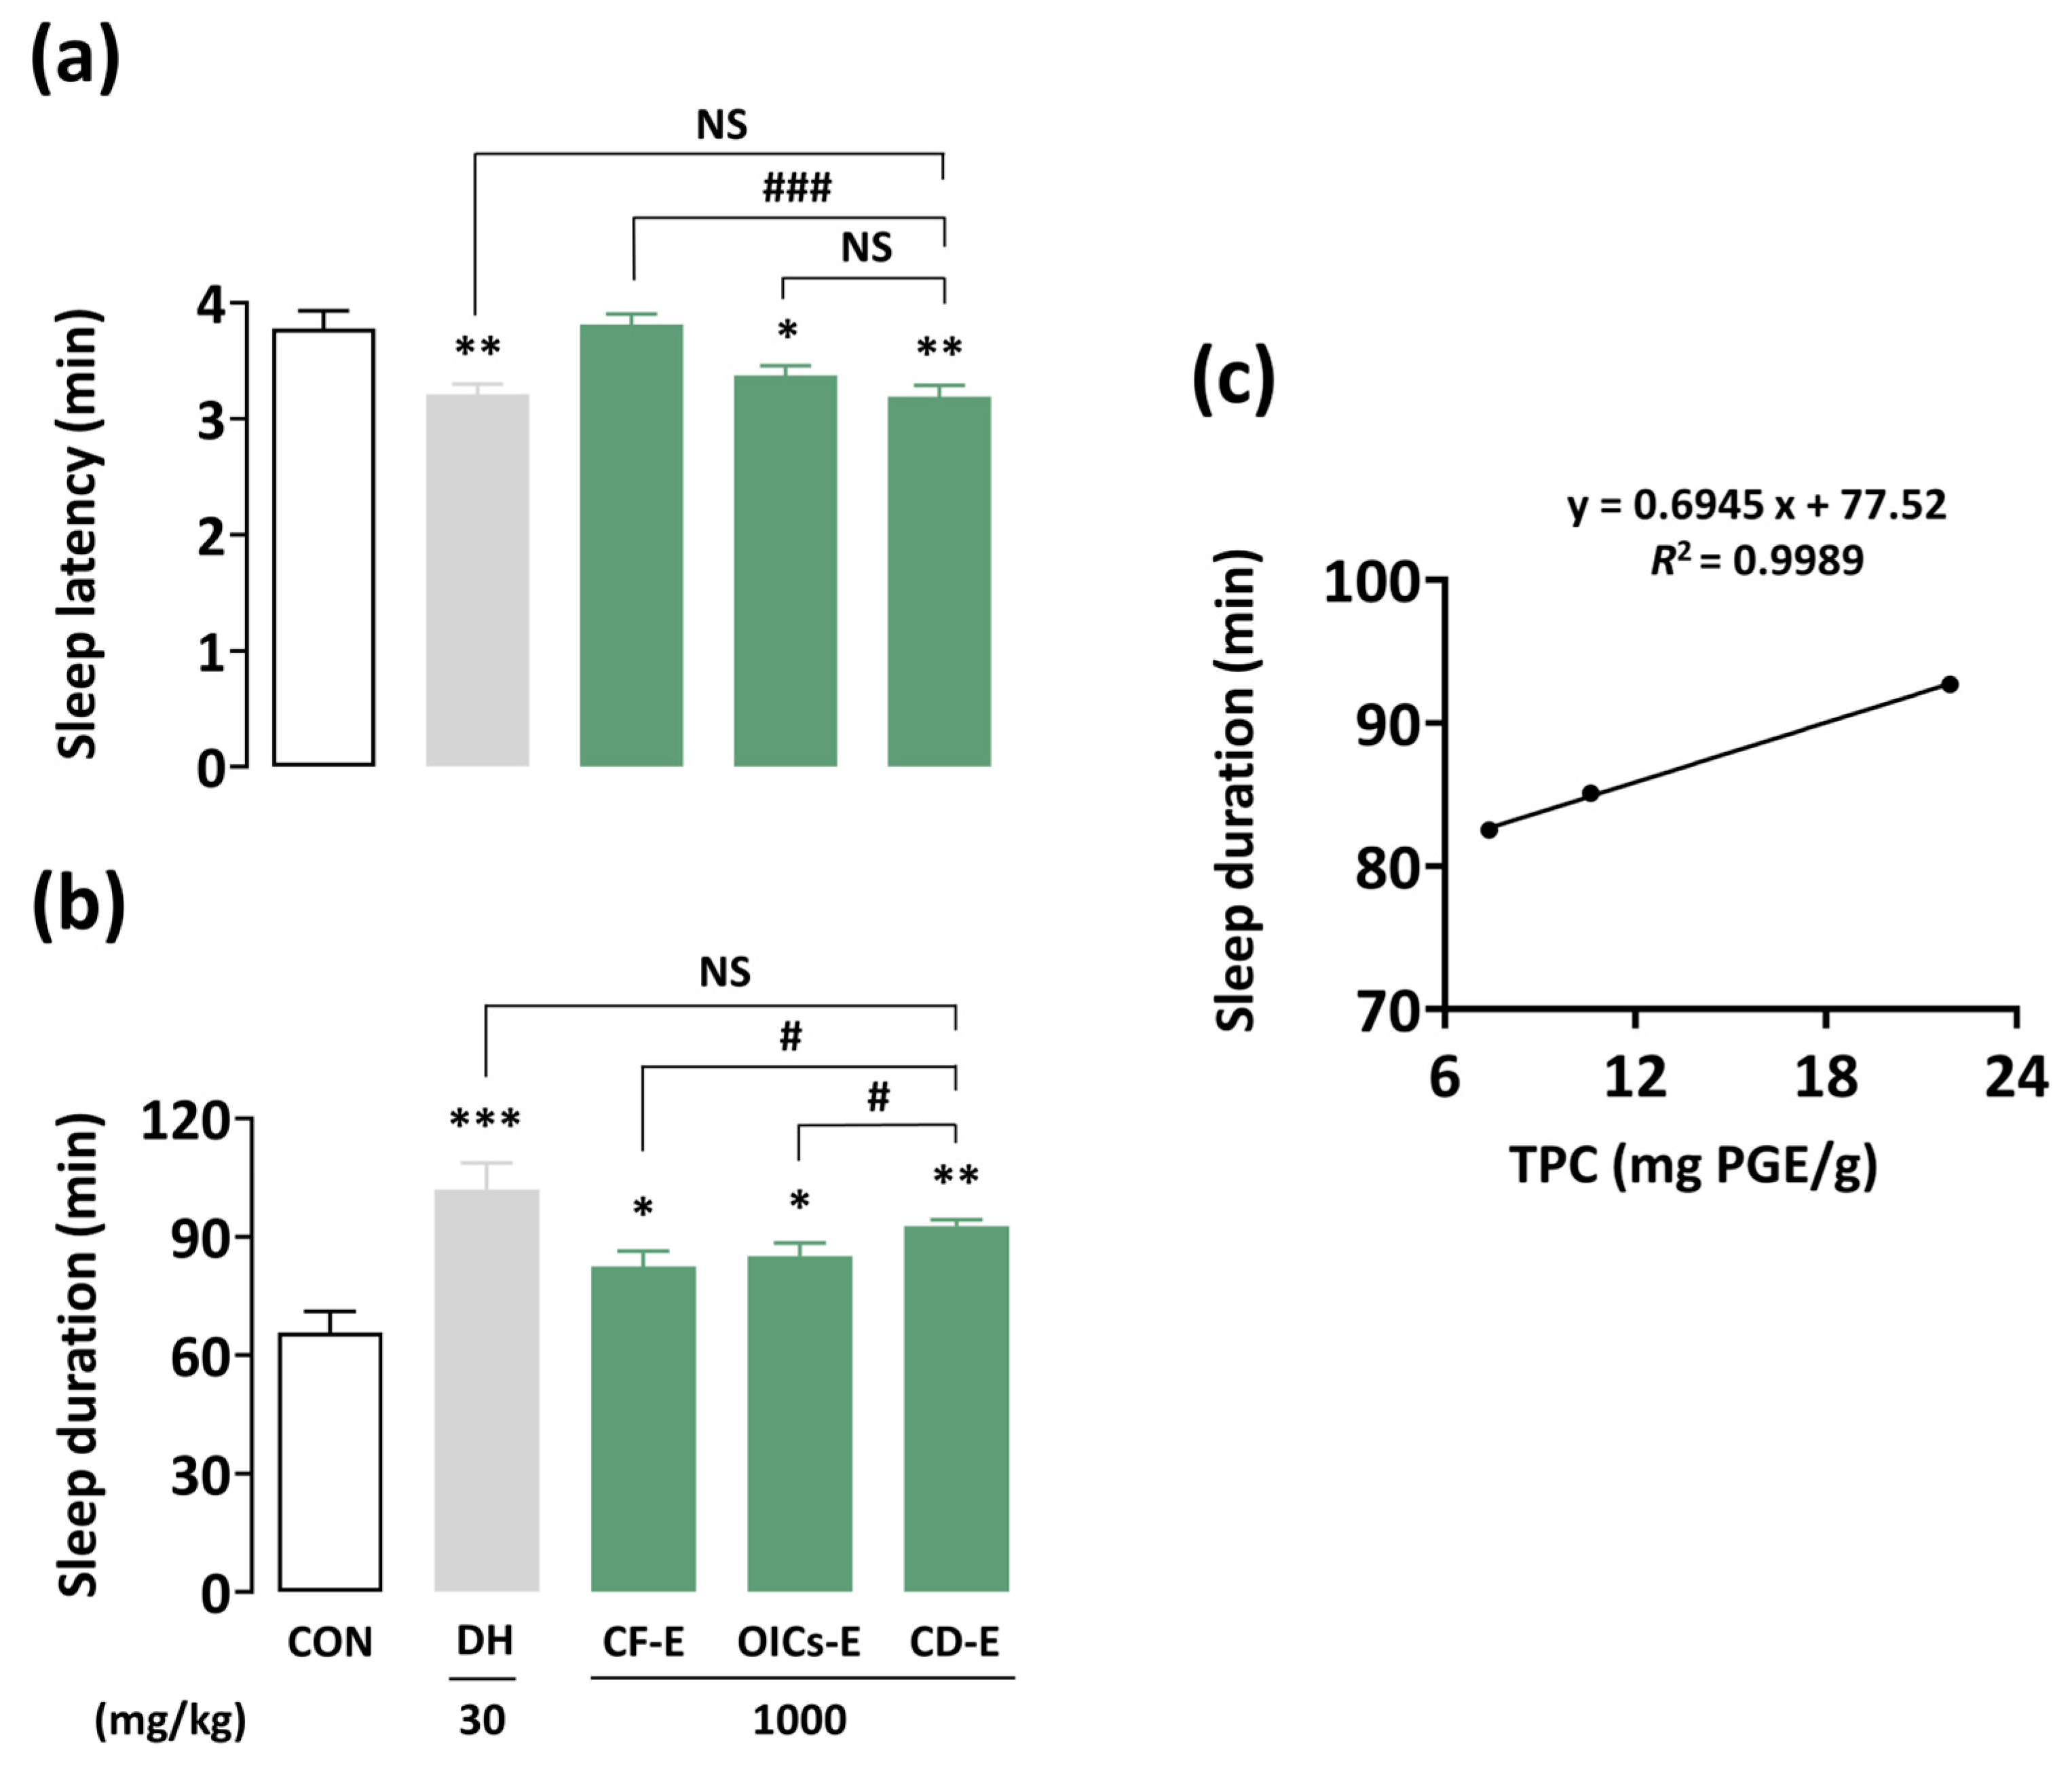
3.5. Pentobarbital-Induced Sleep Test
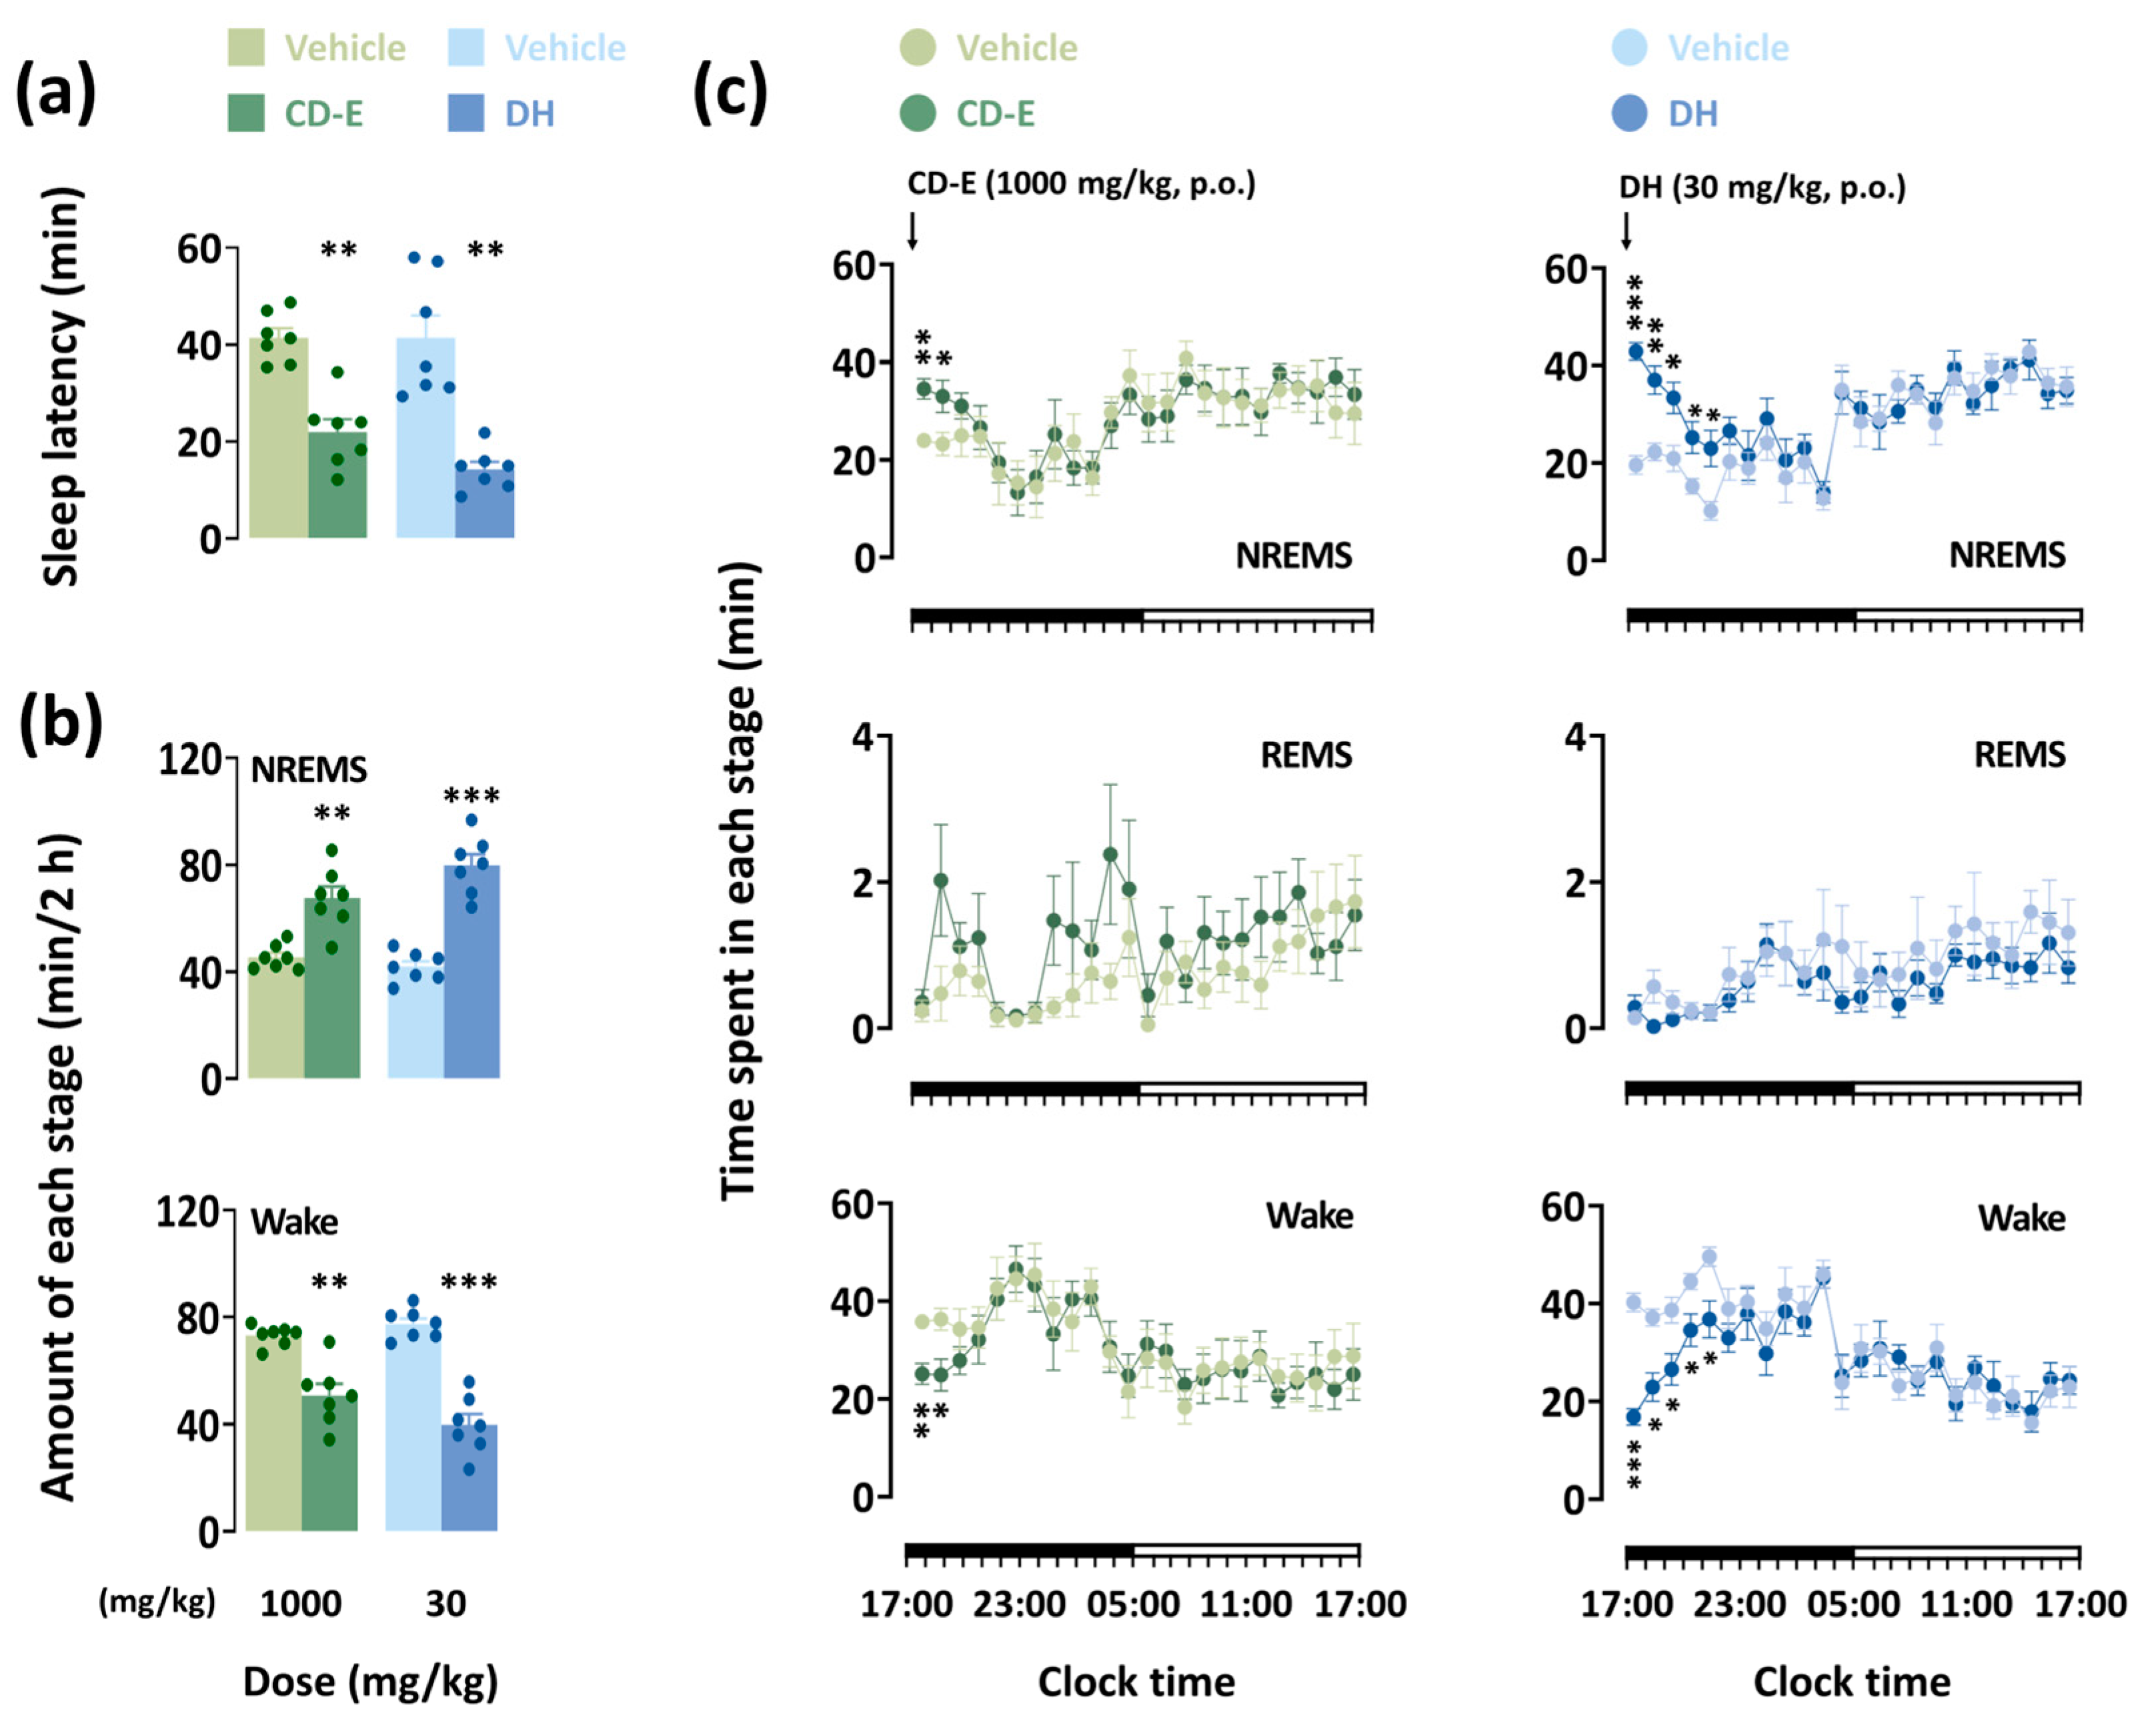
3.6. Analysis of Sleep Architecture
3.6.1. Impact of CD-E on Sleep Patterns and Temporal Course Changes
3.6.2. Impact of CD-E on Sleep–Wake Episodes and Delta Activity
4. Discussion
5. Conclusions
Author Contributions
Funding
Institutional Review Board Statement
Informed Consent Statement
Data Availability Statement
Conflicts of Interest
References
- Lee, S.A.; Moon, S.M.; Choi, Y.H.; Han, S.H.; Park, B.R.; Choi, M.S.; Kim, J.S.; Kim, Y.H.; Kim, D.K.; Kim, C.S. Aqueous extract of Codium fragile suppressed inflammatory responses in lipopolysaccharide-stimulated RAW264.7 cells and carrageenan-induced rats. Biomed. Pharmacother. 2017, 93, 1055–1064. [Google Scholar] [CrossRef]
- Lee, J.B.; Ohta, Y.; Hayashi, K.; Hayashi, T. Immunostimulating effects of a sulfated galactan from Codium fragile. Carbohydr. Res. 2010, 345, 1452–1454. [Google Scholar] [CrossRef]
- Park, H.B.; Lim, S.M.; Hwang, J.; Zhang, W.; You, S.G.; Jin, J.O. Cancer immunotherapy using a polysaccharide from Codium fragile in a murine model. Oncoimmunology 2020, 9, 1772663. [Google Scholar] [CrossRef]
- Kolsi, R.B.A.; Jardak, N.; Hajkacem, F.; Chaaben, R.; Jribi, I.; El Feki, A.E.; Rebai, T.; Jamoussi, K.; Fki, L.; Belghith, H.; et al. Anti-obesity effect and protection of liver-kidney functions by Codium fragile sulphated polysaccharide on high fat diet induced obese rats. Int. J. Biol. Macromol. 2017, 102, 119–129. [Google Scholar] [CrossRef]
- Moon, S.M.; Lee, S.A.; Hong, J.H.; Kim, J.S.; Kim, D.K.; Kim, C.S. Oleamide suppresses inflammatory responses in LPS-induced RAW264.7 murine macrophages and alleviates paw edema in a carrageenan-induced inflammatory rat model. Int. Immunopharmacol. 2018, 56, 179–185. [Google Scholar] [CrossRef]
- Surget, G.; Roberto, V.P.; Le Lann, K.; Mira, S.; Guérard, F.; Laizé, V.; Poupart, N.; Cancela, M.L.; Stiger-Pouvreau, V. Marine green macroalgae: A source of natural compounds with mineralogenic and antioxidant activities. J. Appl. Phycol. 2017, 29, 575–584. [Google Scholar] [CrossRef]
- Rengasamy, K.R.; Mahomoodally, M.F.; Aumeeruddy, M.Z.; Zengin, G.; Xiao, J.; Kim, D.H. Bioactive compounds in seaweeds: An overview of their biological properties and safety. Food Chem. Toxicol. 2020, 135, 111013. [Google Scholar] [CrossRef]
- Kim, S.; Kim, D.; Um, M.Y.; Yoon, M.; Choi, J.S.; Choi, Y.H.; Cho, S. Marine Polyphenol Phlorotannins as a Natural Sleep Aid for Treatment of Insomnia: A Review of Sedative–Hypnotic Effects and Mechanism of Action. Mar. Drugs 2022, 20, 774. [Google Scholar] [CrossRef]
- Cho, S.; Yang, H.; Jeon, Y.J.; Lee, C.J.; Jin, Y.H.; Baek, N.I.; Kim, D.; Kang, S.M.; Yoon, M.; Yong, H.; et al. Phlorotannins of the edible brown seaweed Ecklonia cava Kjellman induce sleep via positive allosteric modulation of gamma-aminobutyric acid type A-benzodiazepine receptor: A novel neurological activity of seaweed polyphenols. Food Chem. 2012, 132, 1133–1142. [Google Scholar] [CrossRef]
- Yoon, S.-H.; Kim, S.-Y.; Park, E.-S.; Choi, M.-K. Nutritional Assessment Focusing on Proximate Composition and Mineral Content of Korean Seaweeds. J. East Asian Soc. Diet. Life 2022, 32, 321–329. [Google Scholar] [CrossRef]
- Jung, K.J.; Jung, C.H.; Pyeun, J.H.; Choi, Y.J. Changes of Food Components in Mesangi (Capsosiphon fulvecense), Gashiparae (Enteromorpha prolifera), and Cheonggak (Codium fragile) Depending on Harvest Times. J. Korean Soc. Food Sci. Nutr. 2005, 34, 687–693. [Google Scholar]
- Reddy, V.; Sridhar, A.; Machado, R.F.; Chen, J. High sodium causes hypertension: Evidence from clinical trials and animal experiments. J. Integr. Med. 2015, 13, 1–8. [Google Scholar] [CrossRef]
- de la Luz Villela-Torres, M.; Prado-Uribe, M.d.C.; Díaz, M.Á.; Pablo, H.Q.; Soria-Castro, E.; Escofet, N.E.; Maldonado, C.E.F.; Paniagua, R. Effect of High Sodium Intake on Gut Tight Junctions’ Structure and Permeability to Bacterial Toxins in a Rat Model of Chronic Kidney Disease. Arch. Med. Res. 2024, 55, 102969. [Google Scholar] [CrossRef]
- Swanepoel, B.; Malan, L.; Myburgh, P.H.; Schutte, A.E.; Steyn, K.; Wentzel-Viljoen, E. Sodium content of foodstuffs included in the sodium reduction regulation of South Africa. J. Food Compos. Anal. 2017, 63, 73–78. [Google Scholar] [CrossRef]
- Bin Sunaid, F.F.; Al-Jawaldeh, A.; Almutairi, M.W.; Alobaid, R.A.; Alfuraih, T.M.; Bin Saidan, F.N.; Alraqea, A.S.; Almutairi, L.A.; Bin Duhaim, A.N.; Alsaloom, T.A.; et al. Saudi Arabia’s healthy food strategy: Progress & hurdles in the 2030 road. Nutrients 2021, 13, 2130. [Google Scholar] [CrossRef]
- Rios-Mera, J.D.; Saldaña, E.; Patinho, I.; Selani, M.M.; Contreras-Castillo, C.J. Advances and gaps in studies on healthy meat products and their relationship with regulations: The Brazilian scenario. Trends Food Sci. Technol. 2021, 110, 833–840. [Google Scholar] [CrossRef]
- Ozuna, C.; Puig, A.; Garcia-Perez, J.V.; Cárcel, J.A. Ultrasonically enhanced desalting of cod (Gadus morhua). Mass transport kinetics and structural changes. LWT 2014, 59, 130–137. [Google Scholar] [CrossRef]
- Ghafoor, M.; Misra, N.N.; Mahadevan, K.; Tiwari, B.K. Ultrasound assisted hydration of navy beans (Phaseolus vulgaris). Ultrason. Sonochem. 2014, 21, 409–414. [Google Scholar] [CrossRef]
- Marchetti, M.D.; Tomac, A.; Yeannes, M.I.; Garcia Loredo, A.B. Comprehensive analysis of vacuum application in desalting lean white fish to develop a highly acceptable ready-to-use product. LWT 2022, 163, 113527. [Google Scholar] [CrossRef]
- Chen, M.J.; Hsieh, Y.T.; Weng, Y.M.; Chiou, R.Y.Y. Flame photometric determination of salinity in processed foods. Food Chem. 2005, 91, 765–770. [Google Scholar] [CrossRef]
- Aktaç, Ş.; Cebeci, A.; Öztekin, Y.; Yaman, M.; Ağırbaşlı, M.; Güneş, F.E. Differences in the salt amount of the bread sold in different regions of Turkey: A descriptive study. Hum. Nutr. Metab. 2023, 33, 200211. [Google Scholar] [CrossRef]
- Yoon, M.; Kim, J.S.; Um, M.Y.; Yang, H.; Kim, J.; Kim, Y.T.; Lee, C.; Kim, S.B.; Kwon, S.; Cho, S. Extraction Optimization for Phlorotannin Recovery from the Edible Brown Seaweed Ecklonia cava. J. Aquat. Food Prod. Technol. 2017, 26, 801–810. [Google Scholar] [CrossRef]
- Yang, H.; Yoon, M.; Um, M.Y.; Lee, J.; Jung, J.; Lee, C.; Kim, Y.T.; Kwon, S.; Kim, B.; Cho, S. Sleep-promoting effects and possible mechanisms of action associated with a standardized rice bran supplement. Nutrients 2017, 9, 512. [Google Scholar] [CrossRef]
- Yolmeh, M.; Jafari, S.M. Applications of response surface methodology in the food industry processes. Food Bioprocess Technol. 2017, 10, 413–433. [Google Scholar] [CrossRef]
- Yoon, M.; Cho, S. Triphlorethol A, a dietary polyphenol from seaweed, decreases sleep latency and increases non-rapid eye movement sleep in mice. Mar. Drugs 2018, 16, 139. [Google Scholar] [CrossRef]
- Karazhiyan, H.; Razavi, S.M.A.; Phillips, G.O. Extraction optimization of a hydrocolloid extract from cress seed (Lepidium sativum) using response surface methodology. Food Hydrocoll. 2011, 25, 915–920. [Google Scholar] [CrossRef]
- Estevez, J.M.; Fernández, P.V.; Kasulin, L.; Dupree, P.; Ciancia, M. Chemical and in situ characterization of macromolecular components of the cell walls from the green seaweed Codium fragile. Glycobiology 1996, 19, 212–228. [Google Scholar] [CrossRef]
- de Oliveira-Carvalho, M.D.F.; Oliveira, M.C.; Pereira, S.M.B.; Verbruggen, H. Phylogenetic analysis of Codium species from Brazil, with the description of the new species C. pernambucensis (Bryopsidales, Chlorophyta). Eur. J. Phycol. 2012, 47, 355–365. [Google Scholar] [CrossRef]
- Barat, J.M.; Rodríguez-Barona, S.; Castelló, M.; Andrés, A.; Fito, P. Cod desalting process as affected by water management. J. Food Eng. 2004, 61, 353–357. [Google Scholar] [CrossRef]
- Lorentzen, G.; Lindberg, S.K.; Ageeva, T.N. Dried salt-cured saithe (Pollachius virens): Exploring the effects of a two-step desalting procedure–Immersion in cold water and cooking. J. Aquat. Food Prod. Technol. 2022, 31, 625–635. [Google Scholar] [CrossRef]
- Oliveira, H.; Gonçalves, A.; Nunes, M.L.; Vaz-Pires, P.; Costa, R. Influence of temperature and fish thickness on the mass transfer kinetics during the cod (Gadus morhua) Desalting Process. J. Sci. Food Agric. 2016, 96, 4457–4464. [Google Scholar] [CrossRef]
- Derossi, A.; De Pilli, T.; Severini, C.; McCarthy, M.J. Mass transfer during osmotic dehydration of apples. J. Food Eng. 2008, 86, 519–528. [Google Scholar] [CrossRef]
- Cox, S.; Gupta, S.; Abu-Ghannam, N. Effect of different rehydration temperatures on the moisture, content of phenolic compounds, antioxidant capacity and textural properties of edible Irish brown seaweed. LWT 2012, 47, 300–307. [Google Scholar] [CrossRef]
- Mulet, A.; Cárcel, J.A.; Sanjuán, N.; Bon, J. New food drying technologies-Use of ultrasound. Food Sci. Technol. Int. 2003, 9, 215–221. [Google Scholar] [CrossRef]
- Radziejewska-Kubzdela, E.; Biegańska-Marecik, R.; Kidoń, M. Applicability of vacuum impregnation to modify physico-chemical, sensory and nutritive characteristics of plant origin products—A Review. Int. J. Mol. Sci. 2014, 15, 16577–16610. [Google Scholar] [CrossRef]
- Azuara, E.; Garcia, H.S.; Beristain, C.I. Effect of the centrifugal force on osmotic dehydration of potatoes and apples. Food Res. Int. 1996, 29, 195–199. [Google Scholar] [CrossRef]
- Petzold, G.; Moreno, J.; Lastra, P.; Rojas, K.; Orellana, P. Block freeze concentration assisted by centrifugation applied to blueberry and pineapple juices. Innov. Food Sci. Emerg. Technol. 2015, 30, 192–197. [Google Scholar] [CrossRef]
- Barman, N.; Badwaik, L.S. Effect of ultrasound and centrifugal force on carambola (Averrhoa carambola L.) slices during osmotic dehydration. Ultrason. Sonochem. 2017, 34, 37–44. [Google Scholar] [CrossRef]
- Phisalaphong, M.; Thu Ha, N.T.; Siripong, P. Desalting of aqueous extract of Acanthus ebracteatus Vahl. by nanofiltration. Sep. Sci. Technol. 2006, 41, 455–470. [Google Scholar] [CrossRef]
- Kim, D.; Yoon, M.; Kim, S.; Um, M.Y.; Cho, S. Effects of green kiwifruit peel extract on sleep-wake profiles in mice: A polysomnographic study based on electroencephalogram and electromyogram recordings. Nutrients 2022, 14, 4732. [Google Scholar] [CrossRef]
- Winsky-Sommerer, R. Role of GABAA receptors in the physiology and pharmacology of sleep. Eur. J. Neurosci. 2009, 29, 1779–1794. [Google Scholar] [CrossRef]
- Kim, D.; Kim, J.; Kim, S.; Yoon, M.; Um, M.; Kim, D.; Kwon, S.; Cho, S. Arousal-inducing effect of Garcinia cambogia Peel extract in pentobarbital-induced sleep test and electroencephalographic analysis. Nutrients 2021, 13, 2845. [Google Scholar] [CrossRef]
- Cho, S.; Yoon, M.; Pae, A.N.; Jin, Y.H.; Cho, N.C.; Takata, Y.; Urade, Y.; Kim, S.; Kim, J.S.; Yang, H.; et al. Marine polyphenol phlorotannins promote non-rapid eye movement sleep in mice via the benzodiazepine site of the GABAA receptor. Psychopharmacology 2014, 231, 2825–2837. [Google Scholar] [CrossRef]
- World Health Organization. WHO Global Report on Sodium Intake Reduction. Available online: https://iris.who.int/handle/10665/366393 (accessed on 12 July 2024).
- Leandro, A.; Pacheco, D.; Cotas, J.; Marques, J.C.; Pereira, L.; Gonçalves, A.M.M. Seaweed’s bioactive candidate compounds to food industry and global food security. Life 2020, 10, 140. [Google Scholar] [CrossRef]


| Independent Variables | Symbol | Range and Levels | ||||
|---|---|---|---|---|---|---|
| −1.414 | −1 | 0 | +1 | +1.414 | ||
| Immersion temperature (°C) | X1 | 20 | 26 | 40 | 54 | 60 |
| Immersion time (h) | X2 | 1 | 2.6 | 6.5 | 10.4 | 12 |
| Run No. | Independent Variables | ||||||
|---|---|---|---|---|---|---|---|
| Coded Values | Uncoded Values | ||||||
| X1 | X2 | X1 | X2 | Y1 | Y2 | ||
| Factorial portions | 1 | −1 | −1 | 26 | 2.6 | 11.8 | 11.2 |
| 2 | 1 | −1 | 54 | 2.6 | 11.6 | 10.1 | |
| 3 | −1 | 1 | 26 | 10.4 | 11.3 | 10.3 | |
| 4 | 1 | 1 | 54 | 10.4 | 13.5 | 8.3 | |
| Axial portions | 5 | −1.414 | 0 | 20 | 6.5 | 12.0 | 10.1 |
| 6 | 1.414 | 0 | 60 | 6.5 | 13.7 | 8.0 | |
| 7 | 0 | −1.414 | 40 | 1.0 | 11.2 | 11.0 | |
| 8 | 0 | 1.414 | 40 | 12.0 | 11.9 | 10.0 | |
| Center points | 9 | 0 | 0 | 40 | 6.5 | 11.0 | 10.3 |
| 10 | 0 | 0 | 40 | 6.5 | 11.6 | 9.5 | |
| 11 | 0 | 0 | 40 | 6.5 | 11.1 | 10.0 | |
| Parameters | Y1 | Y2 | ||
|---|---|---|---|---|
| Coefficient | p-Value | Coefficient | p-Value | |
| Constant | 11.233 | 0.001 | 9.933 | 0.001 |
| X1 | 0.551 | 0.001 | −0.759 | 0.002 |
| X2 | 0.299 | 0.017 | −0.514 | 0.009 |
| X1X1 | 0.771 | 0.001 | −0.392 | 0.045 |
| X2X2 | 0.121 | 0.289 | 0.333 | 0.074 |
| X1X2 | 0.600 | 0.004 | −0.225 | 0.256 |
| Quadratic Polynomial Model Equations | R2 | p-Value |
|---|---|---|
| Y1 = 11.233 + 0.551X1 + 0.299X2 + 0.771X12 + 0.121X22 + 0.600X1X2 | 0.965 | 0.001 |
| Y2 = 9.933 − 0.759X1 − 0.514X2 − 0.392X12 + 0.333X22 − 0.225X1X2 | 0.936 | 0.005 |
| Dependent Variables | Sources | DF | SS | MS | F-Value | p-Value |
|---|---|---|---|---|---|---|
| Y1 | Regression | |||||
| Linear | 2 | 3.1386 | 1.5693 | 26.77 | 0.002 | |
| Square | 2 | 3.4247 | 1.7124 | 29.21 | 0.002 | |
| Interaction | 1 | 1.4400 | 1.4400 | 24.56 | 0.004 | |
| Residual | ||||||
| Lack of fit | 3 | 0.0864 | 0.0288 | 0.28 | 0.840 | |
| Pure error | 2 | 0.2067 | 0.1033 | |||
| Total | 10 | 8.2964 | ||||
| Y2 | Regression | |||||
| Linear | 2 | 6.7212 | 3.3606 | 27.30 | 0.002 | |
| Square | 2 | 2.1099 | 1.0550 | 8.57 | 0.024 | |
| Interaction | 1 | 0.2025 | 0.2025 | 1.65 | 0.256 | |
| Residual | ||||||
| Lack of fit | 3 | 0.2888 | 0.0963 | 0.59 | 0.679 | |
| Pure error | 2 | 0.3267 | 0.1633 | |||
| Total | 10 | 9.6491 |
| Optimal Immersion Conditions | X1 (Immersion Temperature) | X2 (Immersion Time) | |||
|---|---|---|---|---|---|
| Coded Value | Actual Value | Coded Value | Actual Value | ||
| +0.199 | 42.8 | −1.414 | 1.0 | ||
| Y1 | Target value Min. | 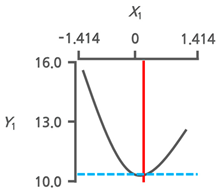 | 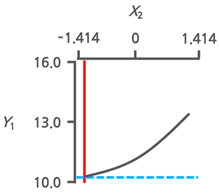 | ||
| Y2 | Target value Max. | 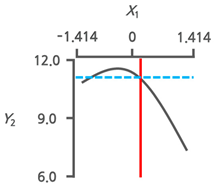 | 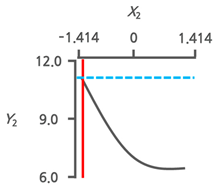 | ||
| Y1 | Y2 | |
|---|---|---|
| Predicted values | 11.0 | 11.2 |
| Experimental values | 10.9 ± 0.1 | 11.2 ± 0.5 |
| Samples | Salt Content (%) | TPC (mg PGE/g) |
|---|---|---|
| SN | 1.5 ± 0.1 *** | 22.3 ± 0.2 *** |
| VP | 1.4 ± 0.2 *** | 22.6 ± 0.8 *** |
| CD | 0.7 ± 0.2 *** | 28.5 ± 0.7 *** |
| Samples | Yield (%) | Salt Content (%) | TPC (mg PGE/g) |
|---|---|---|---|
| CF-E | 32.0 ± 1.2 | 70.7 ± 0.7 | 7.4 ± 0.9 |
| OICs-E | 6.9 ± 0.7 | 60.0 ± 0.6 | 10.6 ± 0.1 |
| CD-E | 2.1 ± 0.1 | 17.2 ± 0.8 | 21.9 ± 0.4 |
Disclaimer/Publisher’s Note: The statements, opinions and data contained in all publications are solely those of the individual author(s) and contributor(s) and not of MDPI and/or the editor(s). MDPI and/or the editor(s) disclaim responsibility for any injury to people or property resulting from any ideas, methods, instructions or products referred to in the content. |
© 2024 by the authors. Licensee MDPI, Basel, Switzerland. This article is an open access article distributed under the terms and conditions of the Creative Commons Attribution (CC BY) license (https://creativecommons.org/licenses/by/4.0/).
Share and Cite
Park, S.; Kim, D.; Kim, S.; Choi, G.; Yoo, H.; Park, S.; Cho, S. Optimization of Desalting Conditions for the Green Seaweed Codium fragile for Use as a Functional Food with Hypnotic Effects. Foods 2024, 13, 3287. https://doi.org/10.3390/foods13203287
Park S, Kim D, Kim S, Choi G, Yoo H, Park S, Cho S. Optimization of Desalting Conditions for the Green Seaweed Codium fragile for Use as a Functional Food with Hypnotic Effects. Foods. 2024; 13(20):3287. https://doi.org/10.3390/foods13203287
Chicago/Turabian StylePark, Sohong, Duhyeon Kim, Seonghui Kim, Gibeom Choi, Hodeung Yoo, Serim Park, and Suengmok Cho. 2024. "Optimization of Desalting Conditions for the Green Seaweed Codium fragile for Use as a Functional Food with Hypnotic Effects" Foods 13, no. 20: 3287. https://doi.org/10.3390/foods13203287
APA StylePark, S., Kim, D., Kim, S., Choi, G., Yoo, H., Park, S., & Cho, S. (2024). Optimization of Desalting Conditions for the Green Seaweed Codium fragile for Use as a Functional Food with Hypnotic Effects. Foods, 13(20), 3287. https://doi.org/10.3390/foods13203287