Article

The Influence of Whey Protein Isolate on the Quality Indicators of Acidophilic Ice Cream Based on Liquid Concentrates of Demineralized Whey

by
Artur Mykhalevych
1,*,
Magdalena Buniowska-Olejnik
2,
Galyna Polishchuk
1,
Czesław Puchalski
3,
Anna Kamińska-Dwórznicka
4 and
Anna Berthold-Pluta
5,*
1
Department of Milk and Dairy Products Technology, Educational and Scientific Institute of Food Technologies, National University of Food Technologies, Volodymyrska 68 St., 01033 Kyiv, Ukraine
2
Department of Dairy Technology, Institute of Food Technology and Nutrition, University of Rzeszow, Ćwiklinskiej 2D St., 35-601 Rzeszow, Poland
3
Department of Bioenergetics, Food Analysis and Microbiology, University of Rzeszow, Ćwiklińskiej 2D, 35-601 Rzeszow, Poland
4
Department of Food Engineering and Process Management, Institute of Food Sciences, Warsaw University of Life Sciences (WULS-SGGW), Nowoursynowska 159C, 02-776 Warsaw, Poland
5
Division of Milk Technology, Department of Food Technology and Assessment, Institute of Food Sciences, Warsaw University of Life Sciences—SGGW, Nowoursynowska 159c Street, 02-776 Warsaw, Poland
*
Authors to whom correspondence should be addressed.
Foods 2024, 13(1), 170; https://doi.org/10.3390/foods13010170
Submission received: 6 December 2023 / Revised: 19 December 2023 / Accepted: 27 December 2023 / Published: 3 January 2024
(This article belongs to the Special Issue Dairy Products: Processing Technology and Sensory Properties)

Abstract

:
The use of liquid whey concentrates in the composition of ice cream, especially in combination with other powdered whey proteins, is limited due to their understudied properties. This article shows the main rheological and thermophysical characteristics of ice cream mixes, as well as color parameters, microstructure, analysis of ice crystals and quality indicators of ice cream during storage. The most significant freezing of free water (p ≤ 0.05) was observed in the temperature range from the cryoscopic temperature to −10 °C. The microscopy of experimental ice cream samples based on hydrolyzed whey concentrates indicates the formation of a homogeneous crystalline structure of ice crystals with an average diameter of 13.75–14.75 μm. Microstructural analysis confirms the expediency of using whey protein isolate in ice cream, which ensures uniform distribution of air bubbles in the product and sufficient overrun (71.98–76.55%). The combination of non-hydrolyzed whey concentrate and 3% whey protein isolate provides the highest stability to preserve the purity and color intensity of the ice cream during storage. The produced ice cream can be classified as probiotic (number of Lactobacillus acidophilus not lower than 6.2 log CFU/g) and protein-enriched (protein supply from 15.02–18.59%).

1. Introduction

The use of whey protein concentrates and isolates in dairy products, in particular ice cream, is becoming increasingly popular due to their functional and technological properties [1,2,3]. On the contrary, the use of liquid whey concentrates in the composition of food products is limited due to their understudied properties. The possibility of using liquid concentrates from whey of various origins in yogurts, cream, sour-milk desserts, sour cream and cheeses has been reported [3,4,5,6,7,8]. Whey ice cream based on liquid concentrates of demineralized whey with an increased solids content (39.61–41.61%, including 3.3% protein), in comparison with traditional ice cream recipes of this type [9], differs in improved quality indicators (original taste, absence of defects in consistency and structure), reduced sugar and lactose content in the case of using hydrolyzed concentrates [10,11,12]. An important aspect of whey ice cream production is the additional possibility of milk whey usage as a by-product of cheese manufacturing. The volume of whey processing in the world is still quite low [13], although in general, there is a trend of increasing interest in whey products [14].
At the previous stage of the research, it was shown that the introduction of protein ingredients into the composition of ice cream based on hydrolyzed whey concentrates significantly increases the thixotropy of ice cream mixes. Whey protein isolate (90%) had the most significant effect on the structural and mechanical properties of whey ice cream mixes among the studied protein additives (soy protein isolate, micellar casein, whey protein concentrate and isolate) [15]. The introduction of whey protein ingredients into the composition of ice cream is appropriate not only for the purpose of expanding the range of protein-enriched products [16,17] but also to prevent excessive freezing of free water in mixes and ice cream during low-temperature processing [18]; to ensure the formation of finely dispersed air bubbles in the thickness of the product during freezing [19,20]; and to provide the product with attractive consumer characteristics by improving resistance to melting, overrun and taste [21,22].
Studies on the effect of whey protein isolate on the quality parameters of ice cream have already reported its ability to increase the viscosity of ice cream mixes and resistance to melting and mask the absence or low content of milk fat in the product [23,24,25]. However, whey proteins could lead to the deterioration of the color of ice cream, especially during storage, and also form a bitter aftertaste, which is related to the specific sensory properties of whey [26,27,28]. Roy et al. [25] reported a reduction in ice cream overrun from 94.9% to 33.9% for increasing ice cream protein content from 4% to 10% due to the use of whey protein isolate. The use of hydrolyzed demineralized whey concentrates could be attractive both from the point of view of reducing the lactose content of the product and preventing the formation of sandy and snowy ice cream consistency [29]. However, monosaccharides in the composition of hydrolyzed whey can indirectly affect the formation of the ice cream structure by lowering the cryoscopic temperature [30]. A decrease in the sugar content in ice cream and the presence of lactose hydrolysis products, monosugars (glucose and galactose), which have a lower molecular weight and, accordingly, a higher concentration [31], are able to decrease the cryoscopic temperature and the amount of frozen free water during freezing and hardening [32]. Such changes can reduce the resistance to melting and overrun of ice cream [33,34]. The use of whey protein isolate in ice cream based on hydrolyzed whey concentrates could slow down the freezing process of free water due to its additional binding by whey proteins [35]. It was reported that due to the specificity of the amino acid composition, whey protein isolate belongs to the group of protein additives capable of inhibiting ice recrystallization [36,37,38]. Whey protein isolate could also be used as a functional and technological ingredient (emulsifier, thickener, gelling agent, foaming agent and water-binding agent) in the production of products with characteristics similar to those of classical formulations [39]. In addition, scientists have reported that whey protein isolate is able to support the activity of probiotic bacteria srtains Lactobacillus or Bifidobacterium in dairy products [40,41], which is an important aspect of this study.
Available scientific information on the influence of whey protein isolate on ice cream quality is characterized by certain contradictions, which are explained by the different degrees of its purification, the quality of the input raw materials and the chemical composition and technology of the selected type of ice cream [19,20,21,23,24,25,27,39].
To our knowledge, there are no publications on the use of whey protein isolate in the formulation of whey ice cream based on liquid concentrates of demineralized whey. The use of liquid hydrolyzed concentrates of demineralized whey in ice cream allows reducing the amount of sugar to 9% and lactose to 1% [9], which could be attractive to individual groups of consumers.
Thus, the purpose of this research was to study the influence of whey protein isolate on the physicochemical and sensory parameters of whey ice cream.
The following tasks of the research work were formulated:
-
To study the influence of whey protein isolate on the physicochemical and rheological properties of mixes and ice cream;
-
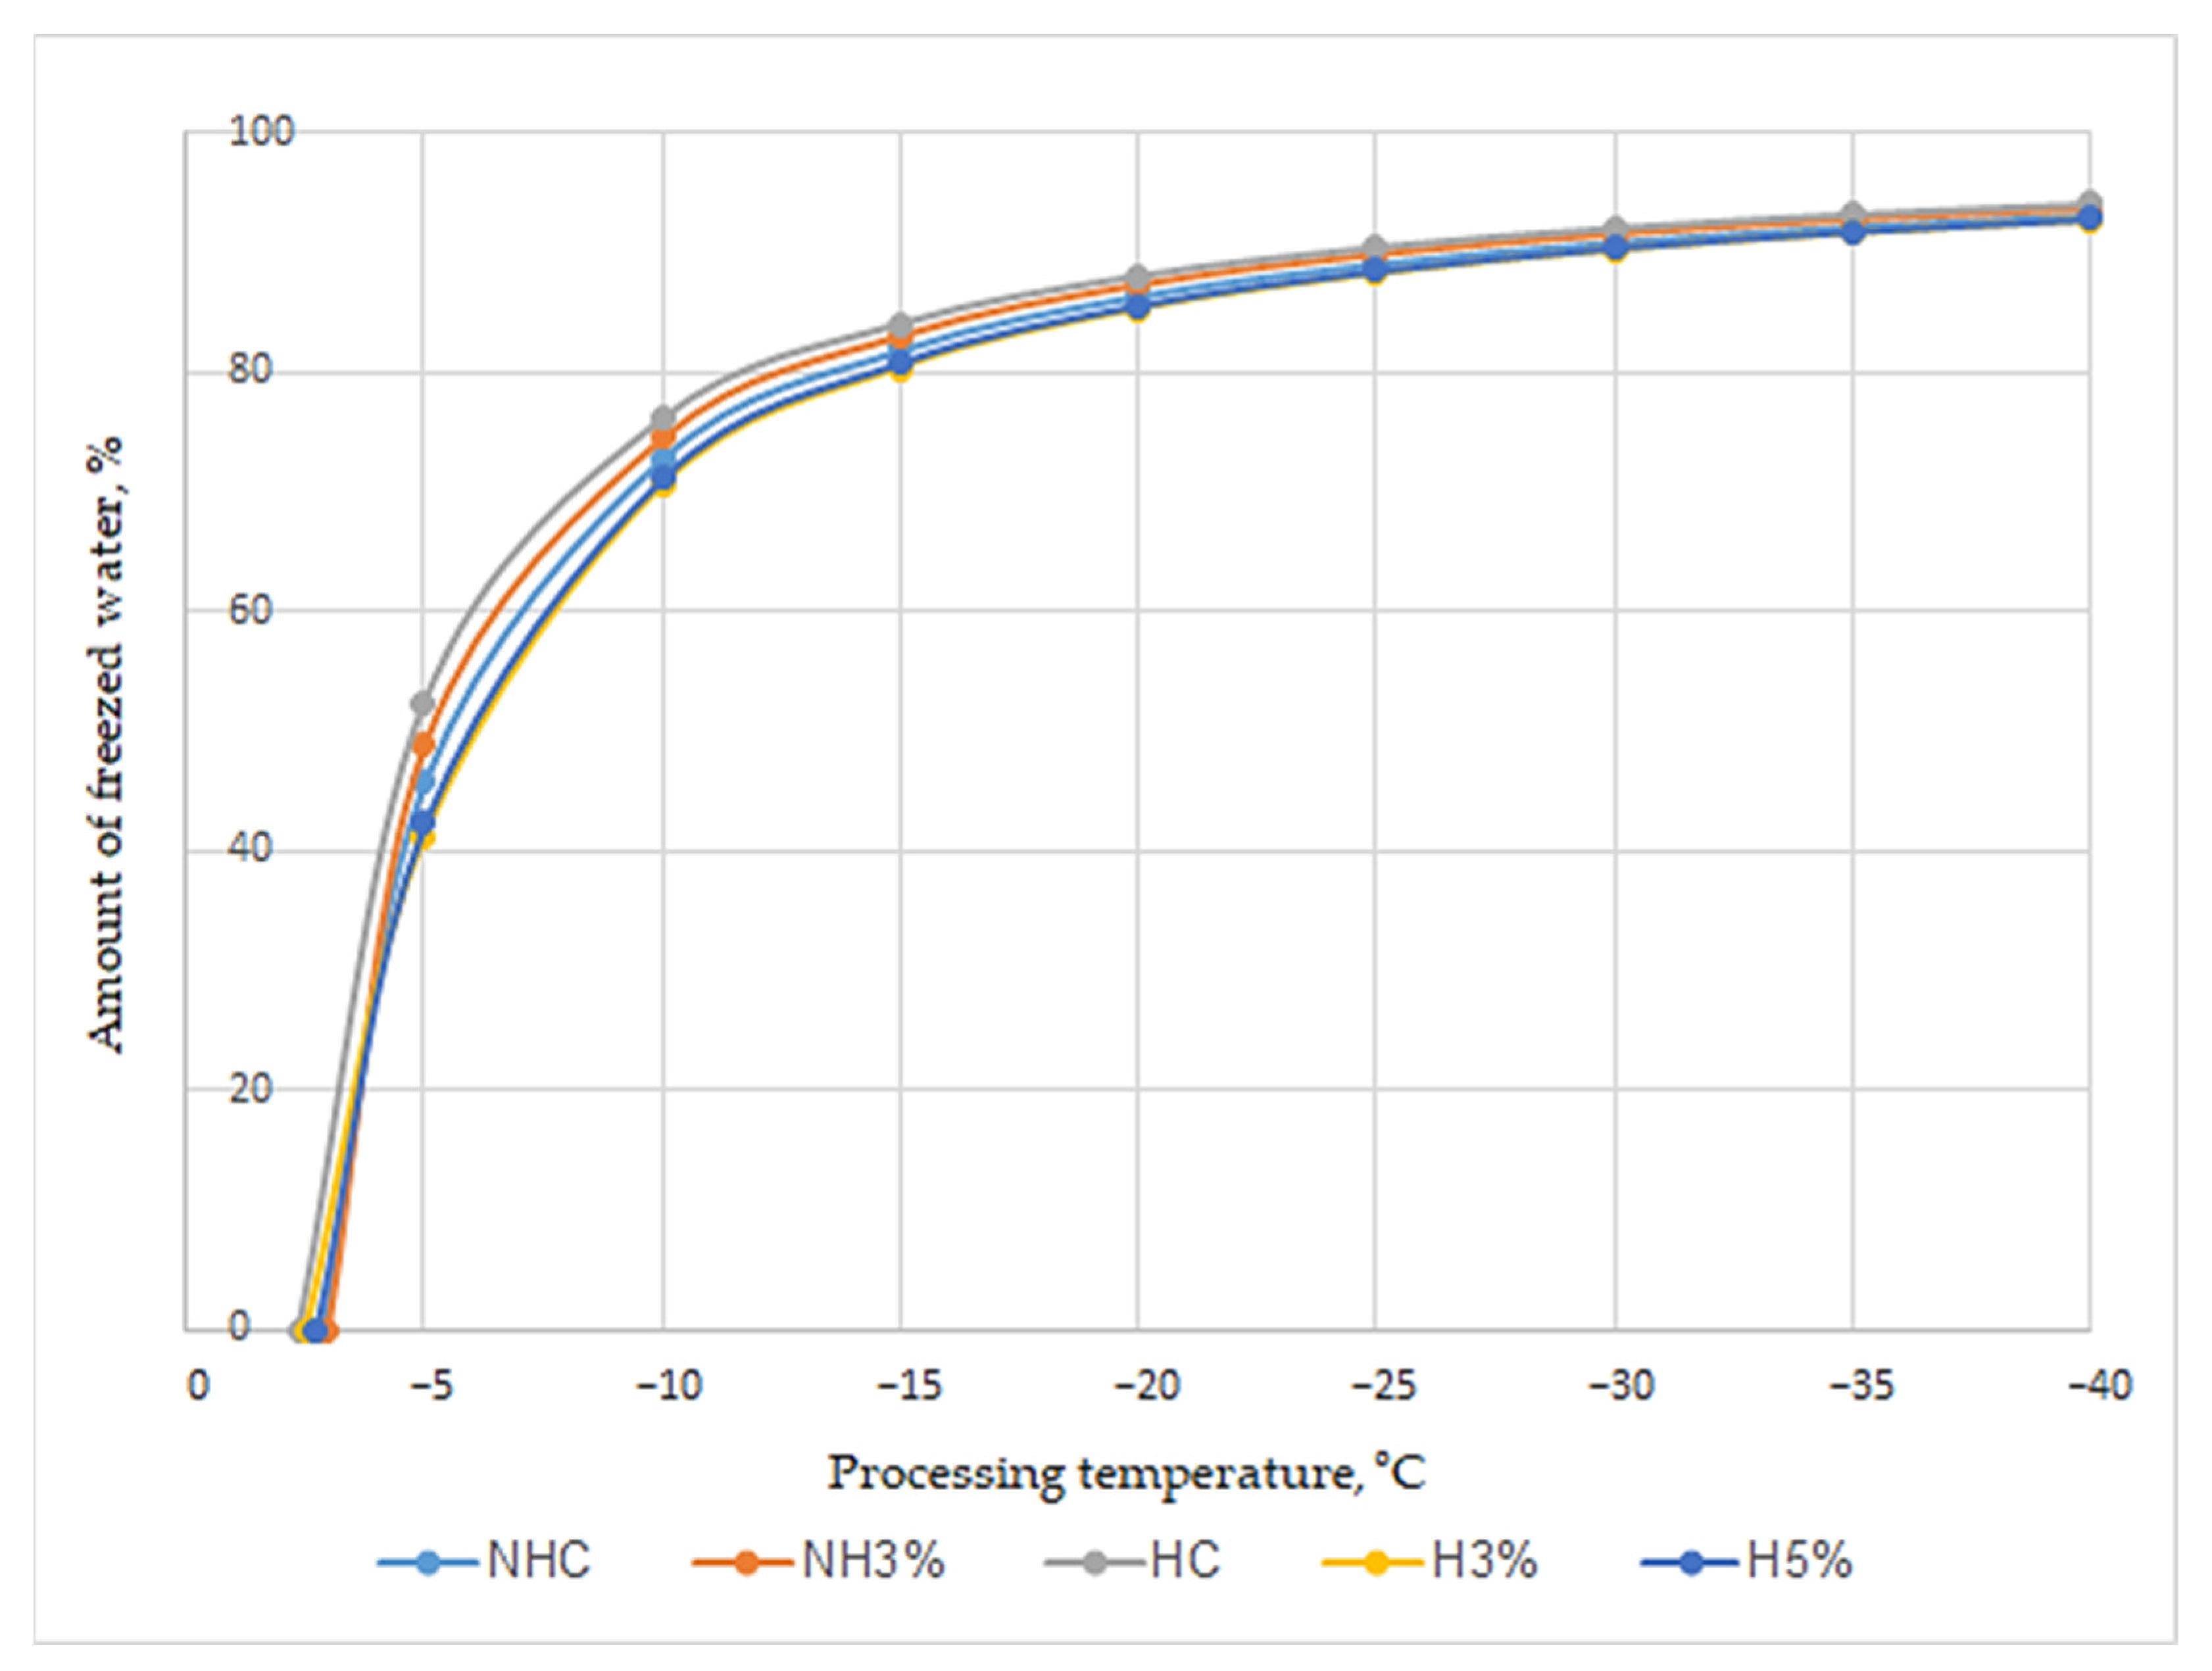
To compare the dynamics of changes in the freezing process in ice cream with whey protein isolate of free water during freezing and subsequent storage of the product at sub-zero temperatures;
-
To study the microstructure of soft ice cream and determine the main physical and chemical parameters;
-
To measure the microbiological indicators of ice cream during storage.

2. Materials and Methods

2.1. Raw Materials

Liquid concentrates of demineralized whey with a solids content of 40% were used to make experimental ice cream samples. Non-hydrolyzed concentrates of demineralized whey were produced by the reconstitution of whey powder with a degree of demineralization of 90% (Herkules, MLEKOVITA, High Mazovia, Poland) in water. Hydrolyzed concentrates of demineralized whey were obtained by lactose fermenting using the enzyme lactase (β-galactosidase) with an activity of 5200 NLU/g (SEROWAR s.c., Szczecin, Poland) and the starter preparation nu-trish® LA-5® containing L. acidophilus (Chr. Hansen A/S, Hoersholm, Denmark). Whey protein isolate 90% (SPOMLEK, Radzyń Podlaski, Poland) was used as a protein supplement. Water, white (regular) sugar, vanillin, activated starter and the stabilization system Cremodan SI 320 (Danisco A/S, Brabrand, Denmark) were used to prepare ice cream mixes. The content of whey protein isolate was explained by its influence on the thixotropic properties of ice cream mixes, which was explained at the previous stage of the experiment [15]. In ice cream based on non-hydrolyzed whey protein concentrate, its maximum effective amount is 3%, while in ice cream based on hydrolyzed whey concentrate, it is up to 5%. The difference in sugar content (11% and 9%) for ice cream samples with non-hydrolyzed and hydrolyzed concentrates of demineralized whey, respectively, is explained by the different degrees of sweetness, which increases during the hydrolysis of lactose into monosaccharides and, accordingly, allows reducing the amount of sugar to 9% in the case of using hydrolyzed concentrates [9]. The content of the stabilization system (0.6%) was chosen in accordance with the manufacturer’s recommendations for the production of low-fat types of ice cream. Liquid concentrates of demineralized whey were made on the basis of water and demineralized whey powder 90% (Herkules, MLEKOVITA, High Mazovia, Poland). Enzymolysis of lactose in concentrates was carried out using the enzyme lactase (β-galactosidase) with an activity of 5200 NLU/g (SEROWAR s.c., Szczecin, Poland) and the starter nu-trish® LA-5® (Chr. Hansen A/S, Hoersholm, Denmark).

2.2. Ice Cream Production

2.2.1. Activated Starter

To obtain an activated starter, ultra-pasteurized skimmed milk was heated to an inoculation temperature of 38–42 °C, after which a pre-calculated amount of starter was added. Fermentation was carried out until pH 5.4–5.2.

2.2.2. Hydrolyzed Concentrates

Demineralized whey powder was reconstituted in water at a temperature of (40–45) °C to obtain concentrates with a solids content of 40%. The concentrates were filtered, pasteurized at (85–88) °C for 3–5 min and cooled to the storage temperature for non-hydrolyzed concentrates.
Hydrolyzed concentrates of demineralized whey were obtained according to the technology of Osmak et al. [42]. For the production of hydrolyzed whey concentrates, after pasteurization, they were cooled to (40–43) °C and simultaneously fermented with β-galactosidase preparation and starter nu-trish® LA-5®. With the simultaneous introduction of the β-galactosidase enzyme and the starter during the lag phase of L. acidophilus development (2–4 h), the enzyme has time to reveal hydrolytic activity at pH ≥ 5.7, which makes it possible to achieve maximum hydrolysis of lactose within 8 h of enzymolysis.

2.2.3. Ice Cream

Dry components (white sugar, stabilization system, vanilla and whey protein isolate) were mixed and added to preheated water (40–45 °C). Then, liquid concentrates of demineralized whey were added. The obtained mixes were filtered, pasteurized at 83–87 °C for 5 min and homogenized under a pressure of 12.0 ± 2.5 MPa using a laboratory homogenizer-disperser 15M-8TA “Lab Homogenizer & Sub-Micron Disperser” (GAULIN. CORPORATION, Boston, MA, USA). The homogenized mixes were cooled to 38–42 °C, and 3% activated starter was added. The fermentation process was carried out until pH 5.25–5.1, followed by cooling to 2–6 °C and maturation for 24 h. The matured mixes were frozen on a periodic freezer FPM-3.5/380-50 “Elbrus-400” (JSC “ROSS”, Kharkiv, Ukraine). At the first stage of freezing, the mixes were cooled in a cooling cylinder (volume—7 L) to −1 °C at a rotation frequency of the scraper stirrer of 4.5 s−1 for 120 s. At the second stage, the mixes were frozen at a rotation frequency of 9 s−1 for 180 s to −5.0 ± 0.5 °C. The formulations of experimental samples of ice cream are given in Table 1.

2.3. Methods

2.3.1. Chemical Composition

The total solids content in ice cream samples was determined by the arbitration method, the principle of which consists in drying the sample diluted with distilled water and mixed with sand at 102 °C to a constant mass, followed by weighing to determine the mass of the residue.
The protein content was determined using the Kjeldahl method, the fat content using the modified Gerber method [43], and the carbohydrate content using the Bertrand method [44]. The lactose content in whey concentrates and test samples of ice cream mixes was determined using iodometric and refractometric methods [45]. The degree of lactose hydrolysis was calculated based on the found lactose content [46]:
Degree of lactose hydrolysis (%) = 100% − residual lactose content (%)
The level of protein supply (%) in the finished product was calculated as the ratio of the protein content to the sum of the protein, fat and carbohydrate content, multiplied by 100.

2.3.2. Rheological and Thermophysical Characteristics of Ice Cream Mixes

After cooling to 2–6 °C, the ice cream mixes were whipped for 5, 10 and 15 min with 5 min breaks according to the modified method of Lim et al. [47]. Foam overrun was determined as the ratio of the volume of the whipped mix to its initial volume, expressed as a percentage. The foam resistance of ice cream mixes was determined according to the modified method of Philips L., according to which a container with a hole in the bottom was used for the foam to drain after whipping [47]. The time during which 50% of the initial volume of the mix used for whipping is formed as a result of foam destruction was taken as an indicator of foam stability. The viscosity of ice cream mixes was determined from warmed samples using a viscometer IKA ROTAVISC lo-vi Complete (IKA, Staufen, Germany). A spindle SP-4 was used to measure viscosity, which was immersed in a prepared sample at 20 °C and a shear rate of 200 rpm. Viscosity values were read after 2 min [48]. Water activity was determined on a water activity analyzer “HygroLab 2” (Rotronic, Bassersdorf, Switzerland) at 20 °C in a measurement range of 0–1 Aw (0–100% rh) [49]. The cryoscopic temperature was set using a cryostat and Beckman thermometer (TL-1). Based on Raoult’s law for non-dissociated molecular solutions, the amount of frozen water at different temperature stages was calculated using the following formula [50]:
ω = (1 − tcr/t) × 100
where ω is content of frozen water, %; tcr is cryoscopic temperature, °C; and t is the temperature at each stage of technological processing, °C.

2.3.3. Color

Color parameters were determined using a colorimeter (Precision Colorimeter, Model NR 145, Shenzhen, China) and the CIE LAB system. The following parameters were defined: L* as whiteness (from 0—black to 100—white), a* as a color from red (+) to green (−), b* as a color from yellow (+) to blue (−), C* as the purity and intensity of color from gray (C* = 0) to the direction of pure colors (C* = 100) and h° as a color shade (within 0–360°). Before measurement, the device was calibrated against a white standard.

2.3.4. Microstructure

The ice cream sample was taken from the center of the sample in at least three different places and at a distance of 3 cm from the surface of the product, placed at 19 ± 1 °C in a Goryaev chamber covered with glass and immediately subjected to microscopy at a magnification of 160 times. At the same time, the ice crystals melted, but the foam remained, because under these conditions, the air bubble envelopes did not dehydrate. Photomicrographs were obtained using an Olympus CX41 light microscope (Olympus Corporation, Tokyo, Japan) and camera [19].

2.3.5. Analysis of Ice Crystals

Ice cream samples were taken from the center of the sample, from at least 3 different locations, at least 3 cm from the surface of the ice cream, and placed on a glass slide using a spatula and then covered with a glass. The samples were transferred to a microscope with a cooling system (Linkam LTS420, Tokyo, Japan). The recrystallization process was analyzed based on images of ice crystals taken after preparation, using an Olympus BX53 microscope (Olympus Corporation, Tokyo, Japan) with a Linkam LTS420 (Tokyo, Japan) cooling system (temperature range from −196 °C to −420 °C) and an Olympus SC50 camera (Olympus Corporation, Tokyo, Japan). The resulting images were then analyzed using software NIS Elements D (version 5.30.00, Nikon, Tokyo, Japan). Between 300 and 500 crystals were labeled for each sample, and area, equivalent diameter and standard deviation were then calculated using software NIS Elements D Imaging (version 5.30.00, Nikon). Crystal size frequency distributions were calculated using Microsoft Excel 2011 macro data analysis. The relative frequency of any class interval was calculated as the number of crystals in that class (class frequency) divided by the total number of crystals and expressed as a percentage. The X50 parameter was analyzed as the average diameter (DA) for 50% of the crystals in the sample. The mean diameter (DA) and standard deviation (SD) of each class were also calculated. The method of determination is given in scientific works [51,52,53].

2.3.6. Quality Indicators of Ice Cream

The overrun of the ice cream was determined using the weighing method, according to which the ice cream mix was weighed before freezing and the same volume of soft ice cream after freezing. Overrun (O, %) was calculated according to the following formula [54]:
O = (M1 − M2/M2) × 100
where M1 is the mass of the glass with the mix, g, and M2 is the mass of a glass with ice cream, g.
Resistance to melting (the time of the first drop flowing out and the time of accumulation of 10 cm3) was determined at an ambient temperature of 22 °C. The ice cream samples were placed on a grid (d = 95 mm, holes 5 × 5 mm, wire thickness 0.5 mm). Then, the time until complete melting was recorded for ice cream melting [51]. Hardness of ice cream samples was determined using a Brookfield CT-3 model texture analyzer. Hardness measurements were made between −6 °C and −2 °C, using texture software Pro CT V1.6 (Brookfield Engineering Laboratories Onc., ABD, Middleboro, MA, USA). A conical probe TA 15/1000 was used for analysis. Test speed was 2 mm/s, distance 15 mm, trigger load 6.8 g, length 40 mm and diameter 60 mm.

2.3.7. Microbiological Analysis

For the study, 5 g of each sample was diluted in 45 cm3 of physiological saline. Microbiological analysis was performed under the following conditions: the total number of microorganisms on PCA (Plate Count Agar, Oxoid, Basingstoke, UK) at 30 °C for 48–72 h and the number of intestinal bacteria on VRBL agar (Violet Red Bile agar with lactose, Oxoid, Basingstoke, UK) at 37 °C for 24–48 h. Acidophilic bacilli counts on MRS (De Man Rogosa Sharpe, Oxoid, Basingstoke, UK) and MSE (Mayeux, Sandine & Elliker, Oxoid, Basingstoke, UK) were analyzed at 37 °C for 48–72 h and microscopic fungi and yeast on MEA (malt extract agar, Oxoid, Basingstoke, UK) at 25 °C for 5 days. For Lactobacillus acidophilus, the study was carried out using the plate method with MRS (Biocorp, Warsaw, Poland). Lactobacillus acidophilus was cultivated in microaerophilic conditions with 5% CO2 at 37 °C.

2.3.8. Statistical Processing

Analysis of variance (ANOVA) was performed using STATISTICA 13 software. The significance of the test was set at α = 0.05. Data are expressed as mean with standard deviations (±SD), and differences between groups were assessed using Tukey’s HSD test. The study of physicochemical indicators of ice cream samples was conducted three times to ensure the reliability of the data obtained.

3. Results and Discussion

3.1. Chemical Composition

The chemical composition of liquid concentrates of demineralized whey (Table 2) differs slightly from the examples of liquid whey concentrates given in the literature, which usually have a higher protein content (5.09–11.93%) but a lower solids content (14.09–26.45%), while the content of fat varies from 0.43–0.78% for low-fat concentrates to 6.43–7.82% for full-fat concentrates [3,5,55]. The use of highly demineralized whey to obtain concentrates in this study significantly increases the lactose content to 30.5%, which could significantly affect the quality of ice cream during storage. The hydrolysis of lactose in whey concentrates allows reducing its content to 0.98%, which is lower than the value (4.95%) reported in another study [3]. At the same time, the high proportion of solids (39.92–40.01%) in these liquid concentrates could help to ensure the recommended level of solids in ice cream in the range of 25–35% [42], which is especially important for low-fat types of ice cream. The difference in the obtained values could be explained by the use of whey of different origins, as well as the use of special technologies for the production of concentrates.
Ice cream based on liquid whey concentrates in terms of solids content could be attributed to the full-fat analog (12–18% fat), namely the category of super-premium type of ice cream (40–42% solids) for all samples, except for NHC, which belongs to the premium category (38–40% solids) [56]. The content of high-value whey proteins in ice cream based on whey concentrates exceeds the average protein content (2.6–4.6%) in traditional types of ice cream (10–16% fat) [57]. However, it is insufficient for NHC and HC samples for their classification as ice cream enriched with protein (more than 12% protein supply according to EU regulation No. 1924/2006). Samples of ice cream with whey protein isolate are protein-enriched products, but their protein content does not allow them to be classified as a product source of protein (more than 20% protein supply in accordance with EU Regulation No. 1924/2006), which is a perspective for further research. In general, the data from Table 1 indicate a significant increase in the nutritional value of the developed ice cream compositions based on whey concentrates. However, in terms of the lactose content, the sample NH3% significantly exceeds the others, which could cause defects in consistency and taste during low-temperature storage of the product.

3.2. Physical Characteristics of Ice Cream Mixes

Table 3 shows the thermophysical characteristics of ice cream mixes based on liquid concentrates of demineralized whey. The addition of whey protein isolate (3–5%) increases foam overrun and foam resistance, and the maximum effect is observed in ice cream mixes based on hydrolyzed whey concentrates. The foam overrun of the mixes increases after 5 min of whipping and decreases after 10 min, except for samples with hydrolyzed whey concentrate and whey protein isolate, which could be explained by the lower viscosity of the mixes due to the presence of lactose hydrolysis products [58,59], as well as a slightly lower sugar content, which usually appears in ice cream mixes as a component that increases viscosity [56]. Lee and Duggan [60] found that the foam overrun of native mixes with whey protein isolate is significantly higher than microgels with WPI, but their foam stability is slightly lower. In this study, we observed a significant increase in both the foam overrun and foam resistance of whey ice cream mixes due to the fact that the ice cream mix is a multicomponent system in which the synergistic interactions of the ingredients could significantly influence its rheological properties. The combination of whey proteins with monosaccharides provides a significant increase in the foaming properties of mixes. Puangmanee et al. [61] compared the influence of ordinary whey protein isolate and its glycated species with various monosaccharides on the rheological properties of mixes. It was shown that the presence of d-glucose, d-fructose, d-allose and d-psicose additionally increases the foam resistance and foam overrun of the mixes, and this value only increases during the whipping interval from 15 to 30 min. This suggests that the presence of high amounts of monosaccharides in hydrolyzed whey concentrate ice cream mixes exhibits a synergistic effect with WPI. The obtained viscosity values are correlated with the indicators of foam overrun and foam resistance, confirming the regularity of the decrease in this indicator in mixes with a high content of monosaccharides (glucose, galactose). Akalin et al. [62] reported that the addition of 4% WPI resulted in the excessive thickening and gelation of ice cream with an increase in the viscosity of the ice cream mix. Another study reported that the combination of WPI with polysaccharides significantly increased the viscosity of ice cream mixes, which overall had a positive effect on its quality [23].
The cryoscopic temperature of ice cream mixes based on non-hydrolyzed concentrate is slightly higher than samples based on hydrolyzed concentrate, which is explained by the high content of monosaccharides in the latter, as a result of which a depression of the freezing point of ice cream is observed [63]. The high content of solids in all ice cream samples reduces the range of cryoscopic temperature depressions of ice cream mixes within the range of values from −2.39 to −2.95 °C, which is similar to the results of other scientists who studied low-fat or high-protein ice cream [19,64,65,66]. The study of osmotic pressure in the aqueous phase of whey ice cream mixes shows (Table 3) a decrease in water activity in mixes based on hydrolyzed whey concentrate. The addition of WPI reduces water activity, but the most significant effect on this indicator, in our opinion, is the presence of monosaccharides, which have a higher ability to bind free water than sucrose [67]. Thus, samples NHC, NH3%, HC and H3% could be attributed to systems with high water activity (aw = 1.0–0.9), while H5% could be attributed to a food system with intermediate moisture (aw = 0.9–0.6) [68]. A decrease in water activity will affect the quality of ice cream due to a decrease in the freezing point caused by the hydrolysis of lactose in the samples HC, H3% and H5%. This and other influences will be considered in the following sections of this article.
Water in ice cream is in a bound and free state [69]. The latter could freeze in the form of ice crystals at temperatures below the cryoscopic temperature [70]. During product storage, even with slight temperature fluctuations, migratory recrystallization of ice crystals and their fusion occur, which is accompanied by the disappearance of small crystals and the growth of large ones [71]. The recommended storage temperature of ice cream is not lower than −16 to −25 °C [19]; therefore, even with slight fluctuations in it, in ice cream with a high content of free water, the appearance of a coarse crystalline structure is possible. The change in the physical state of the aqueous phase of ice cream has been studied by many scientists [72,73,74], but the use of protein ingredients in its composition requires additional research. Proteins, as well as mono- and disaccharides, could, to some extent, affect the cryoscopic temperature of mixes and, accordingly, the proportion of frozen water and the structure of ice cream. Based on the values of the cryoscopic temperature of the studied mixes (Table 3), the content of frozen water in ice cream was calculated in the temperature range of technological processing from −5 to −40 °C, and it was shown that the proportion of frozen water reached values at the beginning and at the end of freezing from 42.40–52.20% to 92.80–94.03%, respectively (Figure 1).
The maximum difference in the amount of frozen water in the studied samples (up to 9.8%) was found at −5 °C, but with a further decrease in temperature, the difference in the amount of frozen water in ice cream decreased to 1.4%. In general, the most significant freezing of free water was observed in the temperature range from the cryoscopic temperature to −10 °C. Under these conditions, 70.5–71.2% of water froze in the samples NHC and NH3% and 72.9–76.1% in the samples HC, H3% and H5%, which indicates the most significant cryoprotective activity of monosaccharides in the hydrolyzed whey concentrate, including combination with whey protein concentrate. A significant part of the water (up to 17.1–19.7%) continued to freeze when the mixes reached a temperature of −30 °C. The further change in this indicator in the temperature range from −30 to −40 °C was quite insignificant. The obtained data confirm the dynamics of freezing of water in ice cream based on whey concentrates, typical for classic types of ice cream, at low temperatures during the freezing of mixes and hardening and storage of the studied samples.

3.3. Color

The lowest value of whiteness L* (p ≤ 0.05) was recorded for H5% (Table 4) which contained the largest amount of added whey protein isolate (5%), which gives the product a yellow color [24]. Barros et al. [75] also reported a decrease in whiteness in ice cream samples from 87.65 to 82.45 units depending on the content of concentrated whey (70–280 g per ice cream sample). The obtained L* values for all ice cream samples are lower than the reported results [76], which is explained by the higher content of whey ingredients than in the recipes of known analogs, as well as the absence in these samples of pasteurized or dry milk as raw components that give whiteness to dairy products due to the presence of colloidal particles, such as milk fat globules and casein micelles, capable of scattering light in the visible spectrum [77]. During 14 days of storage, the value of whiteness (L*) in ice cream decreases; however, for samples with hydrolyzed whey concentrate, this process occurs less intensively, which is associated with the effect of lactose hydrolysis, which increases the whiteness of the food system [78]. The values of parameters a* and b* indicate the predominance of green and yellow colors in the product, respectively, which is due to the color characteristics of whey and its processing products [79,80], which were the main ingredients in ice cream production for this study.
A decrease in the parameter b* was observed for HC which means a decrease in the intensity of the yellow color and correlates with the L* indicator, which, on the contrary, increases for this ice cream sample. The addition of whey protein isolate to samples based on hydrolyzed concentrate leads to an increase in b* (increased yellowness). Barros et al. [75] also reported an increase in the b* indicator from 16.27 to 18.02% with an increase in the content of concentrated whey in the composition of ice cream. However, Meneses et al. [80] showed that the b* indicator increased from 57.64 to 60.92 units when adding whey at different mass fractions. A significant difference in the results obtained in this study may be related to the hydrolysis of lactose, as well as the type of whey used. During storage, the degree of green and yellow coloring increases (p ≤ 0.05) for all samples. Color intensity and purity (C*) increase for HC, but further addition of whey protein isolate (H3% and H5%) shifts this parameter toward gray colors (less pure and intense color). During storage, the largest decrease in the C* index occurs for NHC, which emphasizes the instability of its color at low temperatures. The NH3% sample shows greater stability to maintain purity and color intensity. The value of the hue (h°) by the position in the spectrum makes it possible to conclude that the ice cream samples are between yellow and green with a predominance toward the first, which is correlated with indicators a* and b*.

3.4. Microstructure

Analysis of the microstructure indicates that whey protein isolate (3–5%) contributes to the increase in the size of air bubbles in ice cream, as well as non-hydrolyzed whey concentrate as an ice cream base (Figure 2). The sample HC is characterized by a finer dispersion (average diameter of air bubbles—6.4 μm) and uniform distribution of the air phase in the thickness of the product, compared to NHC (average diameter of air bubbles—8.8 μm), which is due to the higher content of solids in the latter, as well as slightly higher viscosity as a result of significant lactose content. At the same time, the addition of 3% whey protein isolate in combination with non-hydrolyzed concentrate (NH3%) leads to the formation of large air bubbles (up to 12.5–24.1 μm in diameter) due to the increased viscosity of the ice cream mix, which makes it difficult to saturate mixes with air during the freezing process. Whey protein isolate in the samples NH3% and NH5% also leads to the formation of larger air bubbles than in the control samples (NHC, HC); however, their number is significantly lower than for NH3%. In addition, for the above-mentioned samples, a significantly larger number of finely dispersed air bubbles are observed, which show the ability to aggregate among themselves and concentrate around larger air bubbles.
The effect of sticking air bubbles and their uniform distribution in ice cream was observed by scientists when using polysaccharides, protein concentrates and isolates [64,72,81]. In whey ice cream, the size of air bubbles depends not only on the type of raw materials and components but also on the solid content. The small number of solids in MSNF (milk solids non-fat) leads to a structure with inclusions of large air cells [82] and, accordingly, a decrease in the melting rate [25]. The presence of monosaccharides in samples HC, H3% and H5% indirectly affects the distribution of the air phase in the product thickness [83], primarily due to a decrease in the viscosity of ice cream mixes, which increases their saturation by air during freezing. El-Hadad et al. [84] reported that emulsifiers and stabilizers can also affect the even distribution of air bubbles in ice cream. At the same time, the homogenization under pressure of ice cream mixes could have an indirect effect [65], since finely dispersed fat takes an active part in the stabilization of air bubbles [85]. In low-fat ice cream, as in our case, the stabilizing role is performed by whey proteins [86], the high content of which forms a coagulation-type structure, which subsequently leads to a high overrun of ice cream after freezing.

3.5. Microscopy Analysis

The recommended size of ice crystals in ice cream should not exceed 50 μm [87]; however, the formation of ice crystals with a size of 10 to 20 μm, according to some scientists, gives ice cream the proper smoothness and creaminess [53,88], while ice crystals larger than 50 μm give the product an undesirable texture [89,90]. Crystal diameters smaller than 20 μm were found in ice cream after 24 h in the freezer storage and may contribute to the stabilization of the crystal structure during longer storage of the product, which needs to be verified experimentally in further studies. Table 5 clearly demonstrates changes in the equivalent diameter of ice crystals for the studied samples. Samples H3% and H5% are characterized by crystals with the smallest sizes at the level of 12.23–13.18 μm (Table 5, Figure 3), which corresponds to the average diameter of ice crystals in milk ice cream stabilized with special cryoprotectants [53].
In ice cream samples (HC, H3% and H5%), 50% of the tested crystal diameters (parameter X50) did not exceed 12.23–13.68 μm (Figure 3). This crystal size after 24 h of ice cream production will ensure stable storage of this product at the specified temperature (−18 °C). Even if temperature fluctuations occur and crystals grow as a result of the recrystallization process, they will not exceed the recommended size (25–50 µm). It has been reported that the growth of ice crystals to diameters greater than 50 μm after one month of storage in dairy ice cream is possible if stabilizers are not used [51,91,92]. Analyzing the diameter of ice crystals according to the studied parameter X50, it is clearly seen that for the samples NHC and NH3%, the largest ice crystals were formed at the level of 16.43–25.96 μm (Table 5, Figure 3). Whey protein isolate contributes to the formation of a structure with increased water-holding capacity, which leads to the formation of a strong three-dimensional network in the NH3%, HC, H3% and H5%. The resulting structure can even mechanically counteract the growth of ice crystals.
Scientists have proven that adding proteins to ice cream can lead to the growth of non-hexagonal crystals, the structure of which is more favorable for binding numerous water molecules [93]. It was also shown that the shape of ice crystals strictly depends on the type of added stabilizers, while their diameter is also affected by the ice cream composition [53,89,90]. This result was also obtained for proteins binding free water in ice cream [94].
Based on the observations (Figure 4), it could be assumed that the mechanisms of retention of water molecules by the whey protein isolate added to the studied samples (NH3%, H3% and H5%) may be similar. Changes in the shape of the ice crystals, especially visible in NHC and NH3%, may indicate that recrystallization processes have occurred. In contrast, HC, H3% and H5% showed smaller crystal diameters, which moreover have regular shapes, compared to samples based on non-hydrolyzed concentrate (NHC and NH3%). A noticeable feature of NHC and NH3% is also a different appearance of the crystal structure, in which the crystals are arranged quite densely, and clearly defined edges create a three-dimensional effect. The shape of the crystals in NH3% indicates that coalescence and migration processes have taken place.

3.6. Quality Indicators

The overrun of ice cream for HC, H3% and H5% is the highest (71.98–79.18%) (Table 6), which is associated with the presence of monosaccharides (glucose, galactose) and their influence on the viscosity of ice cream mixes.
At the same time, even with the addition of whey protein isolate, the H3% and H5% have higher overrun than NHC and NH3%, although it is still slightly lower than HC. Lee and Duggan [60] reported on the foaming properties of whey protein isolate microgels. Due to the formation of elastic bonds, whey protein isolate contributes to the formation of more intense intermolecular interactions [95], as well as the uniform distribution of air bubbles, which ensure the production of ice cream with a high overrun. On the other hand, the addition of whey protein isolate, even in a smaller amount (3%), leads to a decrease in overrun, compared to the control sample (HC), because it increases the viscosity of the mixes, which limits the saturation of the mix with air during freezing [96]. Ice cream with non-hydrolyzed whey concentrates has a higher resistance to melting than samples based on hydrolyzed concentrates. The high content of monosaccharides, which are more effective cryoprotectants, leads to a decrease in the resistance to melting of HC, H3% and H5%. Whey protein isolate increases resistance to melting, but in samples with hydrolyzed concentrates, this indicator is still lower than in samples NHC and NH3%. A correlation was observed between the values of overrun and resistance to melting: the higher the air saturation of the ice cream, the higher the speed of its melting, respectively. This trend is comparable to the data of other scientists who determined overrun and resistance to melting in ice cream and frozen desserts [96,97,98]. However, Warren and Hartel [99] found that ice cream with a low overrun melts quickly, while ice cream with a high overrun slows down the melting rate.
Other scientists reported that there is no interdependence between the overrun and resistance to melting [54,100]. The speed of ice cream melting could also be affected by the size of ice crystals [54], and the larger they are, the lower the resistance to melting, which is consistent with our data on the size of ice crystals in experimental samples based on non-hydrolyzed whey concentrates (NHC, NH3%). The presence of hydrolysis products in the samples HC, H3% and H5% increases the melting rate, despite the formed small-size ice crystals in these samples. Lindamo et al. [101] reported a similar trend of decreasing melting resistance as the degree of lactose hydrolysis increased in ice cream samples. Due to its high moisture-binding capacity, whey protein isolate increases the viscosity of ice cream mixes [51], which limits the excessive growth of ice crystals, ensures the formation of a creamy consistency of ice cream and increases the resistance to melting of ice cream due to the structural and mechanical factor of foam stabilization as a dispersed system. For the purpose of a deeper study of the regularities of the formation of physicochemical parameters of ice cream, their hardness was determined. The hardness of HC with hydrolyzed concentrate (p < 0.05) is less than that of NHC, but the further addition of whey protein isolate to the composition of ice cream increases the hardness in samples H3% and H5%, although it is slightly less, compared to NH3%. During 14 days of storage, the hardness of all ice cream samples increased, and this was most noticeable for H3% and H5%. Patel, Baer and Acharya [102] reported that increasing the protein content of vanilla ice cream resulted in excessive firmness with lower overrun. The authors explained this by a hard three-dimensional gel formed by proteins, which led to an increase in viscosity. The obtained data coincide with the studied dynamics of crystal formation in ice cream, confirming that the larger the ice crystals, the higher the hardness of the ice cream, but this correlation is also not always confirmed by scientists [12,54]. Alfaifi and Stathopoulos [103] reported that the addition of whey protein isolate increased ice cream hardness, and Danesh et al. [104], on the contrary, found that hardness decreases when using whey protein isolate. From the data in Table 6, there is no direct dependence of the hardness on the resistance to melting or overrun, which is related to the peculiarities of the chemical composition of whey ice cream samples as a food system, in particular, the presence of lactose or monosaccharides, a reduced MSNF content and an increased protein content. The existing contradictions in the scientific literature regarding the interdependence of whipping, resistance to melting and hardness, as well as their correlation with the processes of ice crystal formation and saturation of ice cream with air bubbles are due to the difficulty of obtaining data on ice cream samples with an individual recipe composition. These dynamics may also depend on many factors and require a complex approach to analysis.

3.7. Microbiological Analysis

The number of Lactobacillus acidophilus probiotic cells for all samples was not lower than 6.2 log CFU/g during two weeks of storage (Table 7), which allows the developed ice cream compositions to be classified as probiotic, which means it contains at least 6 log CFU/g of probiotic cultures [105].
The decrease in Lactobacillus acidophilus from 6.6 log CFU/g (sample 1) to 6.2–6.3 log CFU/g (sample 2) is likely due to a high solid content, resulting in a decrease in water activity and an increase in osmotic pressure, which negatively affects the vital activity of starter microorganisms. The increase in the number of Lactobacillus acidophilus bacterial cells in samples with hydrolyzed whey concentrate, despite an even greater increase in the solid content, is due to the presence of glucose and galactose, which are a nutrient medium and stimulate the development process of probiotic cultures [42]. The presence of whey protein isolate could also contribute to the development of Lactobacillus acidophilus to some extent. Afzaal et al. [106] showed that whey protein isolates were more effective due to their amino acid composition as a protective medium for probiotic cell strains. Burgain et al. [107] reported that some of the molecules present in the cells of probiotic bacteria are involved in adhesion with polysaccharides, acids, proteins and lipids. Milk protein ingredients, as representatives of biopolymers, are common components of bioactive agents (encapsulants, protectors) used to protect probiotic bacteria [108,109]. The combination of probiotics with whey protein isolate can add more value to processed foods, but the main disadvantage associated with this combination is the instability of bacteria, since WPI is an ideal food source for the growth and reproduction of microorganisms at high moisture content [40]. The results of counting yeasts and fungi in the ice cream samples indicate that H3% and H5% have a lower content of them compared to other samples. Due to the active binding of free water and increased osmotic pressure in the product, whey protein isolate creates unfavorable conditions for the development of fungi and yeast, which correlates with the obtained data on the activity of water in ice cream mixes.

4. Conclusions

Whey protein isolate has a significant effect on the rheological properties of ice cream mixes based on hydrolyzed whey concentrates, namely, an increase in viscosity indicators. Substantial freezing of free water in ice cream occurs in the temperature range from the cryoscopic temperature to −10 °C, which ensures the freezing of 70.5–71.2% of water and, in samples HC, H3% and H5% up to 72.9–76.1%. Whey protein isolate contributes to the formation of a structure with increased water-holding capacity, which leads to the formation of a more uniform crystal structure (average diameter of ice crystals from 13.75 to 14.75 μm) in HC, H3% and H5% samples. Analysis of the microstructure confirms the feasibility of using whey protein isolate (3–5%), which ensures an even distribution of air bubbles in the ice cream and contributes to obtaining a product with a high whipping index. The combination of non-hydrolyzed whey concentrate and 3% whey protein isolate (NH3%) provides the greatest stability to preserve the purity and color intensity of the ice cream during storage. According to the microbiological analysis, the developed types of ice cream can be classified as probiotic based on the amount of Lactobacillus acidophilus in all samples not being lower than 6.2 log CFU/g. According to the results of the research, H3% and H5% were selected as the best ice cream recipes, which ensure the proper formation of quality indicators of whey ice cream. The prospect of further research is the study of a complex of quality indicators for acidophilic ice cream based on hydrolyzed whey concentrates during storage.

Author Contributions

Conceptualization, A.M. and G.P.; methodology, A.M.; software, M.B.-O.; validation, A.M., A.K.-D. and A.B-P.; formal analysis, M.B.-O.; investigation, M.B.-O. and A.M.; resources, A.B.-P.; data curation, A.K.-D.; writing—original draft preparation, A.M.; writing—review and editing, M.B.-O.; visualization, A.B.-P.; supervision, G.P.; project administration, C.P.; funding acquisition, C.P. All authors have read and agreed to the published version of the manuscript.

Funding

The project is financed by the program of the Minister of Education and Science named “Regional Initiative of Excellence” in the years 2019–2023, project number 026/RID/2018/19, the amount of financing PLN 9 542 500.00.

Institutional Review Board Statement

Not applicable.

Informed Consent Statement

Not applicable.

Data Availability Statement

Data is contained within the article.

Conflicts of Interest

The authors declare no conflicts of interest.

References

  1. Yadav, J.S.S.; Yan, S.; Pilli, S.; Kumar, L.; Tyagi, R.D.; Surampalli, R.Y. Cheese whey: A potential resource to transform into bioprotein, functional/nutritional proteins and bioactive peptides. Biotechnol. Adv. 2015, 33, 756–774. [Google Scholar] [CrossRef] [PubMed]
  2. Patel, S. Functional food relevance of whey protein: A review of recent findings and scopes ahead. J. Funct. Foods 2015, 19, 308–319. [Google Scholar] [CrossRef]
  3. Henriques, M.H.F.; Gomes, D.M.G.S.; Borges, A.R.; Pereira, C.J.D. Liquid whey protein concentrates as primary raw material for acid dairy gels. Food Sci. Technol. 2019, 40, 361–369. [Google Scholar] [CrossRef]
  4. Henriques, M.H.F.; Gomes, D.M.G.S.; Pereira, C.J.D.; Gil, M.H.M. Effects of Liquid Whey Protein Concentrate on Functional and Sensorial Properties of Set Yogurts and Fresh Cheese. Food Bioprocess Technol. 2013, 6, 952–963. [Google Scholar] [CrossRef]
  5. Henriques, M.; Gomes, D.; Rodrigues, D.; Pereira, C.; Gil, M. Performance of bovine and ovine liquid whey protein concentrate on functional properties of set yoghurts. Procedia Food Sci. 2011, 1, 2007–2014. [Google Scholar] [CrossRef]
  6. Pereira, C.; Henriques, M.; Gomes, D.; Gomez-Zavaglia, A.; de Antoni, G. Novel functional whey-based drinks with great potential in the dairy industry. Food Technol. Biotechnol. 2015, 53, 307–314. [Google Scholar] [CrossRef] [PubMed]
  7. Mykhalevych, A.; Kostenko, O.; Polishchuk, G.; Bandura, U. Application of milk protein concentrates in preparation of reduced fat sour cream. Ukr. Food J. 2022, 11, 429–447. [Google Scholar] [CrossRef]
  8. Polishchuk, G.; Sharakhmatova, T.; Shevchenko, I.; Manduk, O.; Mykhalevych, A.; Pukhlyak, A. Scientific substantiation of cream heating duration in the technology of sour cream, enriched with protein. Food Sci. Technol. 2023, 17, 3–10. [Google Scholar] [CrossRef]
  9. Shevchenko, O.; Mykhalevych, A.; Polischuk, G.; Buniowska-Olejnik, M.; Bass, O.; Bandura, U. Technological functions of hydrolyzed whey concentrate in ice cream. Ukr. Food J. 2022, 11, 498–517. [Google Scholar] [CrossRef]
  10. Dekker, P.; Koenders, D.; Bruins, M. Lactose-Free Dairy Products: Market Developments, Production, Nutrition and Health Benefits. Nutrients 2019, 11, 551. [Google Scholar] [CrossRef]
  11. Wang, G.; Guo, M. Manufacturing Technologies of Whey Protein Products. In Whey Protein Production, Chemistry, Functionality, and Applications; Guo, M., Ed.; John Wiley & Sons Ltd.: Chichester, UK, 2019; pp. 13–37. [Google Scholar] [CrossRef]
  12. Sofjan, R.P.; Hartel, R.W. Effects of overrun on structural and physical characteristics of ice cream. Int. Dairy J. 2004, 14, 255–262. [Google Scholar] [CrossRef]
  13. Panghal, A.; Patidar, R.; Jaglan, S.; Chhikara, N.; Khatkar, S.K.; Gat, Y.; Sindhu, N. Whey valorization: Current options and future scenario–a critical review. Nutr. Food Sci. 2018, 48, 520–535. [Google Scholar] [CrossRef]
  14. Pires, A.F.; Marnotes, N.G.; Rubio, O.D.; Garcia, A.C.; Pereira, C.D. Dairy By-Products: A Review on the Valorization of Whey and Second Cheese Whey. Foods 2021, 10, 1067. [Google Scholar] [CrossRef] [PubMed]
  15. Mykhalevych, A.; Polishchuk, G.; Buniowska-Olejnik, M.; Tomczyńska-Mleko, M.; Mleko, S. Functional and technological properties of protein ingredients in whey ice cream. Ukr. J. Food Sci. 2022, 10, 125–135. [Google Scholar] [CrossRef]
  16. Axentii, M.; Stroe, S.-G.; Codină, G.G. Development and Quality Evaluation of Rigatoni Pasta Enriched with Hemp Seed Meal. Foods 2023, 12, 1774. [Google Scholar] [CrossRef] [PubMed]
  17. Arranz, E.; Segat, A.; Velayos, G.; Flynn, C.; Brodkorb, A.; Giblin, L. Dairy and plant based protein beverages: In vitro digestion behaviour and effect on intestinal barrier biomarkers. Food Res. Int. 2023, 169, 112815. [Google Scholar] [CrossRef] [PubMed]
  18. Liu, Y.; Liu, A.; Liu, L.; Kan, Z.; Wang, W. The relationship between water-holding capacities of soybean–whey mixed protein and ice crystal size for ice cream. J. Food Process Eng. 2021, 44, e13723. [Google Scholar] [CrossRef]
  19. Tvorogova, A.A.; Gurskiy, I.A.; Shobanova, T.V.; Smykov, I.T. Effect of Protein Concentrates and Isolates on the Rheological, Structural, Thermal and Sensory Properties of Ice Cream. Curr. Res. Nutr. Food Sci. J. 2023, 11, 294–306. [Google Scholar] [CrossRef]
  20. El-Zeini, H.M.; El-Abd, M.M.; Mostafa, A.Z.; El-Ghany, F.H.Y. Effect of incorporating whey protein concentrate on chemical, rheological and textural properties of ice cream. J. Food Process. Technol. 2016, 7, 1000546. [Google Scholar]
  21. Hossain, M.K.; Petrov, M.; Hensel, O.; Diakité, M. Microstructure and Physicochemical Properties of Light Ice Cream: Effects of Extruded Microparticulated Whey Proteins and Process Design. Foods 2021, 10, 1433. [Google Scholar] [CrossRef]
  22. Das, N.; Hooda, A. Chemistry and Different Aspects of Ice Cream. In The Chemistry of Milk and Milk Products; Apple Academic Press: New York, NY, USA, 2023; pp. 65–86. [Google Scholar]
  23. Saentaweesuk, S.; Chaikham, P. Effect of whey protein isolate incorporated with various carbohydratebased fat replacers on physicochemical and sensorial properties of low-fat chocolate ice cream. Food Res. 2023, 7, 167–176. [Google Scholar] [CrossRef] [PubMed]
  24. Saentaweesuk, S.; Aukkanit, N. Effects of Whey Protein Isolate and Soy Protein Isolate as Fat Replacers on the Physicochemical and Sensory Properties of Low-Fat Chocolate Ice Cream. Burapha Sci. J. 2022, 27, 686–701. [Google Scholar]
  25. Roy, S.; Hussain, S.A.; Prasad, W.G.; Khetra, Y. Quality attributes of high protein ice cream prepared by incorporation of whey protein isolate. Appl. Food Res. 2022, 2, 100029. [Google Scholar] [CrossRef]
  26. Song, X.; Perez-Cueto, F.; Bredie, W. Sensory-Driven Development of Protein-Enriched Rye Bread and Cream Cheese for the Nutritional Demands of Older Adults. Nutrients 2018, 10, 1006. [Google Scholar] [CrossRef] [PubMed]
  27. Salem, S.A.; Hamad, E.M.; Ashoush, I.S. Effect of partial fat replacement by whey protein, oat, wheat germ and modified starch on sensory properties, viscosity and antioxidant activity of reduced fat ice cream. Food Nutr. Sci. 2016, 7, 397–404. [Google Scholar] [CrossRef]
  28. Zhang, A.Q.; Xu, D.; Liu, B.H.; Shi, B.M.; Zhang, Y.H. Low-fat ice cream model system: Impact of incorporation of alcalase hydrolyzed zein. Food Funct. 2023, 14, 4430–4439. [Google Scholar] [CrossRef]
  29. Dhingra, M.; Singh, J. Enzymes in Food Industry and Their Regulatory Oversight. In Microbes Food Ind.; Scrivener Publishing LLC: Beverly, MA, USA, 2023; pp. 249–274. [Google Scholar] [CrossRef]
  30. Dadan, M.; Nowacka, M.; Czyzewski, J.; Witrowa-Rajchert, D. Modification of food structure and improvement of freezing processes by pulsed electric field treatment. In Pulsed Electric Fields to Obtain Healthier and Sustainable Food for Tomorrow; Academic Press: Cambridge, MA, USA, 2020; pp. 203–226. [Google Scholar] [CrossRef]
  31. Queiroz, E.S.; Rezende, A.L.L.; Perrone, Í.T.; Francisquini, J.D.A.; de Carvalho, A.F.; Alves, N.M.G.; de Oliveira, L.F.C.; Stephani, R. Spray drying and characterization of lactose-free goat milk. LWT 2021, 147, 111516. [Google Scholar] [CrossRef]
  32. Pertsevoy, F.; Ladyka, V.; Smetanska, I.; Bienias, D.; Ianchyk, M.; Grynchenko, N.; Omelchenko, S.; Hrynchenko, O. Technology of Thermostable and Frozen Fillings Using Dairy Raw Materials and Sesame Seeds Concentrate; Dissa+: Kharkiv, Ukraine, 2022; 192p. [Google Scholar]
  33. Arellano, M.; Benkhelifa, H.; Flick, D.; Alvarez, G. Online ice crystal size measurements during sorbet freezing by means of the focused beam reflectance measurement (FBRM) technology. Influence of operating conditions. J. Food Eng. 2012, 113, 351–359. [Google Scholar] [CrossRef]
  34. Buyck, J.R.; Baer, R.J.; Choi, J. Effect of storage temperature on quality of light and full-fat ice cream. J. Dairy Sci. 2011, 94, 2213–2219. [Google Scholar] [CrossRef]
  35. Tay, R.R.E.; Agatha, T.; Somang, G.; Yuliarti, O.; Tan, E.L.L. Structuring wheat flour-based crackers using whey protein isolate. Int. Dairy J. 2022, 128, 105314. [Google Scholar] [CrossRef]
  36. Attia, Y.A.; Al-Harthi, M.A.; Korish, M.A.; Shiboob, M.H. Protein and Amino Acid Content in Four Brands of Commercial Table Eggs in Retail Markets in Relation to Human Requirements. Animals 2020, 10, 406. [Google Scholar] [CrossRef] [PubMed]
  37. Loveday, S.M. Food proteins: Technological, nutritional, and sustainability attributes of traditional and emerging proteins. Annu. Rev. Food Sci. Technol. 2019, 10, 311–339. [Google Scholar] [CrossRef] [PubMed]
  38. Van Vlierberghe, S.; Graulus, G.J.; Keshari Samal, S.; Van Nieuwenhove, I.; Dubruel, P. Porous hydrogel biomedical foam scaffolds for tissue repair. In Biomedical Foams for Tissue Engineering Applications; Netti, P.A., Ed.; Woodhead Publishing: Cambridge, UK, 2014; pp. 335–390. [Google Scholar] [CrossRef]
  39. de Castro, R.J.S.; Domingues, M.A.F.; Ohara, A.; Okuro, P.K.; dos Santos, J.G.; Brexó, R.P.; Sato, H.H. Whey protein as a key component in food systems: Physicochemical properties, production technologies and applications. Food Struct. 2017, 14, 17–29. [Google Scholar] [CrossRef]
  40. Khem, S.; Small, D.M.; May, B.K. The behaviour of whey protein isolate in protecting Lactobacillus plantarum. Food Chem. 2016, 190, 717–723. [Google Scholar] [CrossRef] [PubMed]
  41. Maleki, O.; Khosrowshahi Asl, A.; Alizadeh Khaledabad, M.; Amiri, S. Production and characterization of synbiotic ice cream using microencapsulation and cryopreservation of Lactobacillus rhamnosus in whey protein/bio-cellulose/inulin composite microcapsules. J. Food Meas. Charact. 2023, 17, 3909–3917. [Google Scholar] [CrossRef]
  42. Osmak, T.; Mleko, S.; Bass, O.; Mykhalevych, A.; Kuzmyk, U. Enzymatic hydrolysis of lactose in concentrates of reconstituted demineralized whey, intended for ice cream production. Ukr. Food J. 2021, 10, 277–288. [Google Scholar] [CrossRef]
  43. Instituto Português da Qualidade. Milk—Fat Content Determination, Gerber Method (NP Standard No. 469 in Portuguese); IPQ: Monte de Caparica, Portugal, 2002. [Google Scholar]
  44. Slashcheva, A.; Nykyforov, R.; Popova, S.; Korenets, Y. Rationale for the use of protein-carbohydrate mix in the technology of disperse products. East.-Eur. J. Enterp. Technol. 2016, 2, 64–71. [Google Scholar] [CrossRef]
  45. Romanchuk, I.; Minorova, A.; Krushelnytska, N. Physical-chemical composition and technological properties of demineralized milk whey received by membrane methods. Agric. Sci. Pract. 2018, 5, 33–39. [Google Scholar] [CrossRef]
  46. Frenzel, M.; Zerge, K.; Clawin-Rädecker, I.; Lorenzen, P.C. Comparison of the galacto-oligosaccharide forming activity of different β-galactosidases. LWT-Food Sci. Technol. 2015, 60, 1068–1071. [Google Scholar] [CrossRef]
  47. Lim, S.Y.; Swanson, B.G.; Clark, S. High hydrostatic pressure modification of whey protein concentrate for improved functional properties. J. Dairy Sci. 2008, 91, 1299–1307. [Google Scholar] [CrossRef]
  48. Nazarewicz, S.; Kozłowicz, K.; Kobus, Z.; Gładyszewska, B.; Matwijczuk, A.; Ślusarczyk, L.; Skrzypek, T.; Sujka, M.; Kozłowicz, N. The Use of Ultrasound in Shaping the Properties of Ice Cream with Oleogel Based on Oil Extracted from Tomato Seeds. Appl. Sci. 2022, 12, 9165. [Google Scholar] [CrossRef]
  49. Kuzmyk, U.; Marynin, A.; Svyatnenko, R.; Zheludenko, Y.; Kurmach, M.; Shvaiko, R. Prospects of use of vegetable raw materials in the technology of sour-milk dessert. EUREKA Life Sci. 2021, 3, 29–35. [Google Scholar] [CrossRef]
  50. Polischuk, G.; Sharahmatova, T.; Breus, N.; Bass, O.; Shevchenko, I. Studies of water freezing features in ice cream with starch syrup. Food Sci. Technol. 2019, 13, 71–77. [Google Scholar] [CrossRef]
  51. Goff, H.D.; Hartel, R.W. Ice cream structure. In Ice Cream; Springer: Boston, MA, USA, 2013; pp. 313–352. [Google Scholar]
  52. Herrera, M.L.; M’Cann, J.I.; Ferrero, C.; Hagiwara, T.; Zaritzky, N.E.; Hartel, R.W. Thermal, mechanical, and molecular relaxation properties of frozen sucrose and fructose solutions containing hydrocolloids. Food Biophys. 2007, 2, 20–28. [Google Scholar] [CrossRef]
  53. Kamińska-Dwórznicka, A.; Łaba, S.; Jakubczyk, E. The effects of selected stabilizers addition on physical properties and changes in crystal structure of whey ice cream. LWT 2022, 154, 112841. [Google Scholar] [CrossRef]
  54. Muse, M.R.; Hartel, R.W. Ice cream structural elements that affect melting rate and hardness. J. Dairy Sci. 2004, 87, 1–10. [Google Scholar] [CrossRef] [PubMed]
  55. Henriques, M.; Gomes, D.; Pereira, C. Liquid whey protein concentrates produced by ultrafiltration as primary raw materials for thermal dairy gels. Food Technol. Biotechnol. 2017, 55, 454. [Google Scholar] [CrossRef] [PubMed]
  56. Romulo, A.; Meindrawan, B. Effect of Dairy and Non-Dairy Ingredients on the Physical Characteristic of Ice Cream. IOP Conf. Ser. Earth Environ. Sci. 2021, 794, 012145. [Google Scholar] [CrossRef]
  57. Arbuckle, W.S. Ice Cream; Springer: New York, NY, USA, 2013. [Google Scholar] [CrossRef]
  58. Özdemir, C.; Dağdemir, E.U.; Özdemir, S.; Sağdıç, O. The Effects of Using Alternative Sweeteners to Sucrose on Ice Cream Quality. J. Food Qual. 2008, 31, 415–428. [Google Scholar] [CrossRef]
  59. Özdemir, C.; Arslaner, A.; Özdemir, S.; Özdemir, G.U.C. Ice-Cream Production from Lactose-Free UHT Milk. J. Food Sci. Eng. 2018, 8, 210–214. [Google Scholar] [CrossRef]
  60. Lee, J.; Duggan, E. Whey protein microgels for stabilisation of foams. Int. Dairy J. 2022, 132, 105399. [Google Scholar] [CrossRef]
  61. Puangmanee, S.; Hayakawa, S.; Sun, Y.; Ogawa, M. Application of whey protein isolate glycated with rare sugars to ice cream. Food Sci. Technol. Res. 2008, 14, 457. [Google Scholar] [CrossRef]
  62. Akalın, A.S.; Karagözlü, C.; Ünal, G. Rheological properties of reduced-fat and low-fat ice cream containing whey protein isolate and inulin. Eur. Food Res. Technol. 2008, 227, 889–895. [Google Scholar] [CrossRef]
  63. Koretska, I.; Polyovyk, V.; Maslikov, M.; Kuzmin, O. Thermophysical characteristics of frozen semifinished products for restaurant technology. Ukr. J. Food Sci. 2020, 8, 231–240. [Google Scholar] [CrossRef]
  64. Kozłowicz, K.; Nazarewicz, S.; Różyło, R.; Nastaj, M.; Parafiniuk, S.; Szmigielski, M.; Bieńczak, A.; Kozłowicz, N. The Use of Moldavian Dragonhead Bagasse in Shaping the Thermophysical and Physicochemical Properties of Ice Cream. Appl. Sci. 2021, 11, 8598. [Google Scholar] [CrossRef]
  65. Kot, A.; Jakubczyk, E.; Kamińska-Dwórznicka, A. The Effectiveness of Combination Stabilizers and Ultrasound Homogenization in Milk Ice Cream Production. Appl. Sci. 2023, 13, 7561. [Google Scholar] [CrossRef]
  66. Landikhovskaya, A.V.; Tvorogova, A.A. Ice cream and frozen desserts nutrient compositions: Current trends of researches. Food Syst. 2021, 4, 74–81. [Google Scholar] [CrossRef]
  67. Fernández-Garía, E.; McGregor, J.U.; Traylor, S. The addition of oat fiber and natural alternative sweeteners in the manufacture of plain yogurt. J. Dairy Sci. 1998, 81, 655–663. [Google Scholar] [CrossRef]
  68. Belokurova, E.S.; Pankina, I.A.; Sevastianova, A.D.; Asfondiarova, I.V.; Katkova, N.M. The effect of functional additives on the indicator “water activity” of biscuit semi-finished products. IOP Conf. Ser. Earth Environ. Sci. 2021, 640, 022022. [Google Scholar] [CrossRef]
  69. de Souza Fernandes, D.; Leonel, M.; Del Bem, M.S.; Mischan, M.M.; Garcia, É.L.; Dos Santos, T.P.R. Cassava derivatives in ice cream formulations: Effects on physicochemical, physical and sensory properties. J. Food Sci. Technol. 2017, 54, 1357–1367. [Google Scholar] [CrossRef]
  70. Cook, K.L.K.; Hartel, R.W. Mechanisms of ice crystallization in ice cream production. Compr. Rev. Food Sci. Food Saf. 2010, 9, 213–222. [Google Scholar] [CrossRef]
  71. Kumar, P.K.; Rasco, B.A.; Tang, J.; Sablani, S.S. State/phase transitions, ice recrystallization, and quality changes in frozen foods subjected to temperature fluctuations. Food Eng. Rev. 2020, 12, 421–451. [Google Scholar] [CrossRef]
  72. Goff, H.D. Ice cream. In Advanced Dairy Chemistry; Springer: Boston, MA, USA, 2013; pp. 441–450. [Google Scholar]
  73. Syed, Q.A.; Anwar, S.; Shukat, R.; Zahoor, T. Effects of different ingredients on texture of ice cream. J. Nutr. Health Food Eng. 2018, 8, 422–435. [Google Scholar]
  74. Leducq, D.; Ndoye, F.T.; Alvarez, G. Phase change material for the thermal protection of ice cream during storage and transportation. Int. J. Refrig. 2015, 52, 133–139. [Google Scholar] [CrossRef]
  75. Barros, E.L.D.S.; Silva, C.C.; Canella, M.H.M.; Verruck, S.; Prestes, A.A.; Vargas, M.O.; Maran, B.M.; Esmerino, E.A.; Silva, R.; Balthazar, C.F.; et al. Effect of replacement of milk by block freeze concentrated whey in physicochemical and rheological properties of ice cream. Food Sci. Technol. 2021, 42, 1–9. [Google Scholar] [CrossRef]
  76. de Meneses, R.B.; Moura, D.C.C.; de Almeida, D.T.; da Silva Bispo, E.; Maciel, L.F.; da Rocha-Leão, M.H.M.; Conte-Junior, C.A. Impact of different dairy wheys on quality parameters of ice cream. Rev. Bras. Ciências Agrárias 2021, 16, 1–10. [Google Scholar] [CrossRef]
  77. García-Pérez, F.J.; Lario, Y.; Fernández-López, J.; Sayas, E.; Pérez-Alvarez, J.A.; Sendra, E. Effect of orange fiber addition on yogurt color during fermentation and cold storage. Color Res. Appl. 2005, 30, 457–463. [Google Scholar] [CrossRef]
  78. Skryplonek, K.; Gomes, D.; Viegas, J.; Pereira, C.; Henriques, M. Lactose-free frozen yogurt: Production and characteristics. Acta Sci. Pol. Technol. Aliment. 2017, 16, 171–179. [Google Scholar] [CrossRef]
  79. Meneses, R.B.; Silva, M.S.; Monteiro, M.L.G.; Rocha-Leão, M.H.M.; Conte-Junior, C.A. Effect of dairy by-products as milk replacers on quality attributes of ice cream. J. Dairy Sci. 2020, 103, 10022–10035. [Google Scholar] [CrossRef]
  80. Moschopoulou, E.; Dernikos, D.; Zoidou, E. Ovine ice cream made with addition of whey protein concentrates of ovine-caprine origin. Int. Dairy J. 2021, 122, 105146. [Google Scholar] [CrossRef]
  81. Buniowska-Olejnik, M.; Mykhalevych, A.; Polishchuk, G.; Sapiga, V.; Znamirowska-Piotrowska, A.; Kot, A.; Kamińska-Dwórznicka, A. Study of Water Freezing in Low-Fat Milky Ice Cream with Oat β-Glucan and Its Influence on Quality Indicators. Molecules 2023, 28, 2924. [Google Scholar] [CrossRef] [PubMed]
  82. Mykhalevych, A.; Sapiga, V.; Polischuk, G.; Osmak, T. Functional and technological properties of oat beta-glucan in acidophilic-whey ice cream. Food Environ. Saf. J. 2022, 21, 116–128. [Google Scholar] [CrossRef]
  83. Zhang, H.; Chen, J.; Li, J.; Wei, C.; Ye, X.; Shi, J.; Chen, S. Pectin from citrus canning wastewater as potential fat replacer in ice cream. Molecules 2018, 23, 925. [Google Scholar] [CrossRef] [PubMed]
  84. El-Hadad, S.S.; Tikhomirova, N.A.; Tvorogova, A.A.; Shobanova, T.V.; El-Aziz, M.A. Physical properties and microstructure of ice cream supplemented with minor components of wheat germ oil. Int. J. Dairy Sci. 2020, 15, 189–199. [Google Scholar] [CrossRef]
  85. Arief, M.F.; Andini, R.D.; Rosyidi, D.; Radiati, L.E. Effect of Goat Kefir Utilization on Physicochemical Quality and Sensory Attributes of Ice Cream Probiotic. In Proceedings of the 3rd International Conference on Environmentally Sustainable Animal Industry 2022 (ICESAI 2022); Atlantis Press: Dordrecht, The Netherlands, 2022. [Google Scholar]
  86. Liu, X.; Sala, G.; Scholten, E. Structural and functional differences between ice crystal-dominated and fat network-dominated ice cream. Food Hydrocoll. 2023, 138, 108466. [Google Scholar] [CrossRef]
  87. Drewett, E.M.; Hartel, R.W. Ice crystallization in a scraped surface freezer. J. Food Eng. 2007, 78, 1060–1066. [Google Scholar] [CrossRef]
  88. Kamińska-Dwórznicka, A. Wpływ stabilizatorów na ograniczenie rekrystalizacji w lodach typu sorbet. Przemysł Spożywczy 2016, 1, 34–37. [Google Scholar] [CrossRef]
  89. Arellano, M.; Gonzalez, J.E.; Alvarez, G.; Benkhelifa, H.; Flick, D.; Leducq, D. Online ice crystal size measurements by the focused beam reflectance method (FBRM) during sorbet freezing. Procedia Food Sci. 2011, 1, 1256–1264. [Google Scholar] [CrossRef]
  90. Kamińska-Dwórznicka, A.; Matusiak, M.; Samborska, K.; Witrowa-Rajchert, D.; Gondek, E.; Jakubczyk, E.; Antczak, A. The influence of kappa carrageenan and its hydrolysates on the recrystallization process in sorbet. J. Food Eng. 2015, 167, 162–165. [Google Scholar] [CrossRef]
  91. Lomolino, G.; Zannoni, S.; Zabara, A.; Da Lio, M.; De Iseppi, A. Ice recrystallisation and melting in ice cream with different proteins levels and subjected to thermal fluctuation. Int. Dairy J. 2020, 100, 104557. [Google Scholar] [CrossRef]
  92. Regand, A.; Goff, H.D. Structure and ice recrystallization in frozen stabilized ice cream model systems. Food Hydrocoll. 2003, 17, 95–102. [Google Scholar] [CrossRef]
  93. Gruneberg, A.K.; Graham, L.A.; Eves, R.; Agrawal, P.; Oleschuk, R.D.; Davies, P.L. Ice recrystallization inhibition activity varies with ice-binding protein type and does not correlate with thermal hysteresis. Cryobiology 2021, 99, 28–39. [Google Scholar] [CrossRef] [PubMed]
  94. Kaleda, A.; Tsanev, R.; Klesment, T.; Vilu, R.; Laos, K. Ice cream structure modification by ice-binding proteins. Food Chem. 2018, 246, 164–171. [Google Scholar] [CrossRef]
  95. Keim, S.; Hinrichs, J. Influence of stabilizing bonds on the texture properties of high-pressure-induced whey protein gels. Int. Dairy J. 2004, 14, 355–363. [Google Scholar] [CrossRef]
  96. O’Chiu, E.; Vardhanabhuti, B. Utilizing whey protein isolate and polysaccha-ride complexes to stabilize aerated dairy gels. J. Dairy Sci. 2017, 100, 3404–3412. [Google Scholar] [CrossRef] [PubMed]
  97. Liu, X.; Sala, G.; Scholten, E. Effect of fat aggregate size and percentage on the melting properties of ice cream. Food Res. Int. 2022, 160, 111709. [Google Scholar] [CrossRef] [PubMed]
  98. Azari-Anpar, M.; Khomeiri, M.; Daraei Garmakhany, A.; Lotfi-Shirazi, S. Development of camel and cow’s milk, low-fat frozen yoghurt incorporated with Qodume Shahri (Lepidium perfoliatum) and cress seeds (Lepidium sativum) gum: Flow behavior, textural, and sensory attributes’ assessment. Food Sci. Nutr. 2021, 9, 1640–1650. [Google Scholar] [CrossRef]
  99. Warren, M.M.; Hartel, R.W. Effects of emulsifier, overrun and dasher speed on ice cream microstructure and melting properties. J. Food Sci. 2018, 83, 639–647. [Google Scholar] [CrossRef]
  100. Wu, B.; Freire, D.O.; Hartel, R.W. The effect of overrun, fat destabilization, and ice cream mix viscosity on entire meltdown behavior. J. Food Sci. 2019, 84, 2562–2571. [Google Scholar] [CrossRef]
  101. Lindamood, J.B.; Grooms, D.J.; Hansen, P.M.T. Effect of hydrolysis of lac-tose and sucrose on firmness of ice cream. Food Hydrocoll. 1989, 3, 379–388. [Google Scholar] [CrossRef]
  102. Patel, M.R.; Baer, R.J.; Acharya, M.R. Increasing the protein content of ice cream. J. Dairy Sci. 2006, 89, 1400–1406. [Google Scholar] [CrossRef] [PubMed]
  103. Alfaifi, M.S.; Stathopoulos, C.E. Effect of egg yolk substitution by sweet whey protein isolate on texture, stability and colour of Gelato-style vanilla ice cream. Int. J. Dairy Technol. 2010, 63, 593–598. [Google Scholar] [CrossRef]
  104. Danesh, E.; Goudarzi, M.; Jooyandeh, H. Effect of whey protein addition and transglutaminase treatment on the physical and sensory properties of reduced-fat ice cream. J. Dairy Sci. 2017, 100, 5206–5211. [Google Scholar] [CrossRef] [PubMed]
  105. Pimentel, T.C.; de Oliveira, L.I.G.; de Souza, R.C.; Magnani, M. Probiotic ice cream: A literature overview of the technological and sensory aspects and health properties. Int. J. Dairy Technol. 2022, 75, 59–76. [Google Scholar] [CrossRef]
  106. Afzaal, M.; Saeed, F.; Hussain, M.; Ismail, Z.; Siddeeg, A.; Ammar, A.F.; Aljobair, M.O. Influence of encapsulation on the survival of probiotics in food matrix under simulated stress conditions. Saudi J. Biol. Sci. 2022, 29, 103394. [Google Scholar] [CrossRef]
  107. Burgain, J.; Scher, J.; Lebeer, S.; Vanderleyden, J.; Cailliez-Grimal, C.; Corgneau, M.; Francius, G.; Gaiani, C. Significance of bacterial surface molecules interactions with milk proteins to enhance microencapsulation of Lactobacillus rhamnosus GG. Food Hydrocoll. 2014, 41, 60–70. [Google Scholar] [CrossRef]
  108. Heidebach, T.; Först, P.; Kulozik, U. Microencapsulation of probiotic cells for food applications. Crit. Rev. Food Sci. Nutr. 2012, 52, 291–311. [Google Scholar] [CrossRef]
  109. Tavares, G.M.; Croguennec, T.; Carvalho, A.F.; Bouhallab, S. Milk proteins as encapsulation devices and delivery vehicles: Applications and trends. Trends Food Sci. Technol. 2014, 37, 5–20. [Google Scholar] [CrossRef]
Figure 1. Free water freezing dynamics under different modes of low-temperature processing. Note. NHC—ice cream based on non-hydrolyzed whey concentrate; NH3%—ice cream based on non-hydrolyzed whey concentrate + 3% whey protein isolate; HC—ice cream based on hydrolyzed whey concentrate; H3%—ice cream based on hydrolyzed whey concentrate + 3% whey protein isolate; H5%—ice cream based on hydrolyzed whey concentrate + 5% whey protein isolate.
Foods 13 00170 g001
Figure 2. Microstructure of soft ice cream at a magnification of 160 times. NHC—ice cream based on non-hydrolyzed whey concentrate; NH3%—ice cream based on non-hydrolyzed whey concentrate + 3% whey protein isolate; HC—ice cream based on hydrolyzed whey concentrate; H3%—ice cream based on hydrolyzed whey concentrate + 3% whey protein isolate; H5%—ice cream based on hydrolyzed whey concentrate + 5% whey protein isolate.
Foods 13 00170 g002aFoods 13 00170 g002b
Figure 3. Distribution of ice crystals in whey ice cream samples. Note. NHC—ice cream based on non-hydrolyzed whey concentrate; NH3%—ice cream based on non-hydrolyzed whey concentrate + 3% whey protein isolate; HC—ice cream based on hydrolyzed whey concentrate; H3%—ice cream based on hydrolyzed whey concentrate + 3% whey protein isolate; H5%—ice cream based on hydrolyzed whey concentrate + 5% whey protein isolate.
Foods 13 00170 g003
Figure 4. Photographs of ice crystals after 24 h of storage at −18 °C. Note. NHC—ice cream based on non-hydrolyzed whey concentrate; NH3%—ice cream based on non-hydrolyzed whey concentrate + 3% whey protein isolate; HC—ice cream based on hydrolyzed whey concentrate; H3%—ice cream based on hydrolyzed whey concentrate + 3% whey protein isolate; H5%—ice cream based on hydrolyzed whey concentrate + 5% whey protein isolate.
Foods 13 00170 g004aFoods 13 00170 g004b
Table 1. Formulations of experimental samples of whey ice cream.
Ingredients, %Ice Cream Samples
NHC NH3%HCH3%H5%
Non-hydrolyzed concentrate of demineralized whey75.075.0
Hydrolyzed concentrate of demineralized whey75.075.075.0
White sugar11.011.09.09.09.0
Whey protein isolate 90%3.03.05.0
Stabilization system0.60.60.60.60.6
Activated starter3.03.03.03.03.0
Vanilla0.10.10.10.10.1
Water10.37.312.39.37.3
Total100.0100.0100.0100.0100.0
Note. NHC—ice cream based on non-hydrolyzed whey concentrate; NH3%—ice cream based on non-hydrolyzed whey concentrate + 3% whey protein isolate; HC—ice cream based on hydrolyzed whey concentrate; H3%—ice cream based on hydrolyzed whey concentrate + 3% whey protein isolate; H5%—ice cream based on hydrolyzed whey concentrate + 5% whey protein isolate.
Table 2. Chemical composition of whey concentrates and whey ice cream.
SampleTotal Solids, %Protein, %Fat, %Carbohydrates, %Lactose, %The Degree of Lactose Hydrolysis, %Level of Protein Supply, %Ice Cream Category/
Nutritional Status
Whey concentrates
NHCDW39.92 a ± 0.304.45 a ± 0.120.43 b ± 0.0130.71 a ± 0.6830.50 b ± 1.19
HCDW40.01 a ± 0.844.41 a ± 0.550.40 a ± 0.0130.61 a ± 0.511.29 a ± 0.0498.71 a ± 0.04
Whey ice cream
NHC41.61 ab ± 1.243.31 a ± 0.110.74 abc ± 0.0233.05 a ± 1.5222.90 b ± 0.538.92 a ± 0.52premium
NH3%44.55 b ± 0.876.10 b ± 0.250.72 a ± 0.0133.46 a ± 0.7922.87 b ± 0.1215.11 b ± 0.35super premium, enriched with protein
HC39.58 a ± 1.533.30 a ± 0.140.72 a ± 0.0333.10 a ± 0.650.97 a ± 0.0199.03 a ± 0.018.89 a ± 0.27super premium
H3%42.54 ab ± 1.146.02 b ± 0.110.78 bc ± 0.0133.28 a ± 0.470.98 a ± 0.0399.02 a ± 0.0315.02 b ± 0.19super premium, enriched with protein
H5%44.63 b ± 1.017.84 c ± 0.050.79 b ± 0.0133.53 a ± 0.340.98 a ± 0.0199.02 a ± 0.0118.59 c ± 0.13super premium, enriched with protein
Note. NHCDW—non-hydrolyzed concentrate of demineralized whey; HCDW—hydrolyzed concentrate of demineralized whey; NHC—ice cream based on non-hydrolyzed whey concentrate; NH3%—ice cream based on non-hydrolyzed whey concentrate + 3% whey protein isolate; HC—ice cream based on hydrolyzed whey concentrate; H3%—ice cream based on hydrolyzed whey concentrate + 3% whey protein isolate; H5%—ice cream based on hydrolyzed whey concentrate + 5% whey protein isolate. a–c—different superscript letters in the columns represent significant differences in the mean values of the same parameter (p ≤ 0.05).
Table 3. Thermophysical characteristics of whey ice cream mixes.
IndicatorSample
NHCNH3%HCH3%H5%
Foam overrun, %5144.58 a ± 1.67158.74 c ± 2.10150.08 b ± 1.5203.33 d ± 1.7192.14 e ± 2.0
10177.51 a ± 1.59184.96 a ± 1.47201.42 b ± 4.2236.78 d ± 2.5220.43 c ± 3.2
15164.23 a ± 2.54179.7 b ± 1.89187.54 c ± 1.6246.75 e ± 4.7221.59 d ± 1.2
Foam resistance, хв531.57 a ± 0.8733.89 b ± 0.2744.82 c ± 0.6748.41 d ± 0.7445.90 c ± 0.81
1032.46 a ± 0.5439.94 b ± 0.7149.55 c ± 0.5658.45 d ± 0.2557.63 d ± 0.90
1532.11 a ± 0.6838.43 b ± 0.4448.13 c ± 1.3661.94 e ± 0.4959.33 d ± 1.01
Viscosity, Mpa × s254.42 b ± 1.86384.55 d ± 1.12228.61 a ± 2.54339.47 c ± 1.07511.05 e ± 1.24
Cryoscopic temperature, °C−2.88 a ± 0.01−2.95 a ± 0.08−2.39 d ± 0.01−2.55 c ± 0.02−2.71 b ± 0.05
Water activity, units0.955 e ± 0.020.941 d ± 0.030.912 c ± 0.010.905 b ± 0.010.896 a ± 0.02
Note. NHC—ice cream based on non-hydrolyzed whey concentrate; NH3%—ice cream based on non-hydrolyzed whey concentrate + 3% whey protein isolate; HC—ice cream based on hydrolyzed whey concentrate; H3%—ice cream based on hydrolyzed whey concentrate + 3% whey protein isolate; H5%—ice cream based on hydrolyzed whey concentrate + 5% whey protein isolate. 5, 10, 15—time of ice cream mix whipping, min. a–e—different superscript letters in the lines represent significant differences in the mean values of the same parameter (p ≤ 0.05).
Table 4. Color parameters of ice cream mixes.
SampleColor Parameters
L*a*b*C*
NHCmix72.80 a ± 1.08−4.38 b ± 0.1220.50 a ± 0.8820.96 a ± 0.66102.07 a ± 2.28
ice cream1st day81.66 a ± 2.54−4.09 b ± 0.0420.16 a ± 0.5014.73 a ± 0.05101.50 a ± 2.05
14th day76.81 a ± 1.27−4.11 b ± 0.1721.84 ab ± 0.1713.52 a ± 0.64103.17 b ± 1.84
NH3%mix69.56 a ± 1.59−3.61 a ± 0.0920.18 a ± 0.0120.37 a ± 0.95100.24 a ± 1.10
ice cream1st day82.78 a ± 2.22−2.98 a ± 0.1321.03 a ± 0.6721.26 b ± 0.5498.08 a ± 2.89
14th day76.07 a ± 2.18−3.05 a ± 0.0121.56 ab ± 0.9420.90 b ± 0.9698.99 a ± 2.17
HCmix79.03 a ± 2.01−3.94 a ± 0.1124.07 a ± 0.5824.41 a ± 1.1499.19 a ± 2.74
ice cream1st day82.31 a ± 0.87−2.42 a ± 0.1014.55 b ± 0.6920.57 a ± 0.7199.11 a ± 2.54
14th day80.98 a ± 1.85−2.55 a ± 0.0214.69 a ± 0.5418.09 b ± 0.0599.54 a ± 1.71
H3%mix81.36 a ± 1.54−3.17 a ± 0.1324.43 a ± 0.4724.66 a ± 1.1997.46 a ± 0.86
ice cream1st day83.25 a ± 1.73−2.84 a ± 0.0818.84 a ± 0.5418.57 a ± 0.5598.23 a ± 3.57
14th day78.56 a ± 1.25−2.91 a ± 0.1119.63 ab ± 0.0718.08 b ± 0.7699.07 a ± 2.60
H5%mix77.20 a ± 1.89−2.71 a ± 0.0123.39 a ± 1.0523.08 a ± 1.0096.54 a ± 0.97
ice cream1st day80.01 a ± 2.12−3.30 a ± 0.1321.58 a ± 0.6821.84 a ± 0.5898.33 a ± 1.18
14th day77.88 a ± 2.57−3.35 a ± 0.0522.42 b ± 0.8420.05 b ± 1.1398.74 a ± 1.36
Note. NHC—ice cream based on non-hydrolyzed whey concentrate; NH3%—ice cream based on non-hydrolyzed whey concentrate + 3% whey protein isolate; HC—ice cream based on hydrolyzed whey concentrate; H3%—ice cream based on hydrolyzed whey concentrate + 3% whey protein isolate; H5%—ice cream based on hydrolyzed whey concentrate + 5% whey protein isolate. a,b—different superscript letters in the columns represent significant differences in the mean values of the same parameter (p ≤ 0.05).
Table 5. Comparison of ice crystal sizes after 24 h of storage at −18°C.
SampleMinimum Diameter of Ice Crystals (μm)Maximum Diameter of Ice Crystals (μm)The Average Value of the Diameter of Ice Crystals (μm)
NHC7.55 d ± 0.1244.36 d ± 2.0325.96 c ± 1.04
NH3%6.85 c ± 0.0926.00 c ± 0.5216.43 b ± 1.17
HC4.68 a ± 0.1022.68 b ± 0.1613.68 a ± 0.02
H3%5.41 b ± 0.2419.04 a ± 0.1212.23 a ± 0.18
H5%5.18 a ± 0.0221.17 ab ± 0.9513.18 a ± 0.56
Note. NHC—ice cream based on non-hydrolyzed whey concentrate; NH3%—ice cream based on non-hydrolyzed whey concentrate + 3% whey protein isolate; HC—ice cream based on hydrolyzed whey concentrate; H3%—ice cream based on hydrolyzed whey concentrate + 3% whey protein isolate; H5%—ice cream based on hydrolyzed whey concentrate + 5% whey protein isolate. a–d—different superscript letters in the columns represent significant differences in the mean values of the same parameter (p ≤ 0.05).
Table 6. Physicochemical indicators of ice cream samples.
IndicatorIce Cream Samples
NHCNH3%HCH3%H5%
Overrun, %71.84 b ± 1.4559.3 a ± 0.8679.18 c ± 2.5576.55 bc ± 3.0871.98 b ± 2.72
pH1st day5.25 a ± 0.015.22 a ± 0.055.23 a ± 0.085.19 a ± 0.035.17 a ± 0.01
14th day5.20 b ± 0.105.13 ab ± 0.045.12 ab ± 0.015.09 ab ± 0.015.05 a ± 0.04
Resistance to melting1 drop1st day29.81 b ± 0.5334.58 c ± 1.0424.85 a ± 0.9526.07 a ± 1.1729.11 b ± 1.50
14th day30.11 bc ± 1.0835.87 d ± 1.5525.04 a ± 0.3728.54 b ± 1.2032.42 c ± 1.16
10 cm31st day44.08 b ± 1.6249.76 c ± 1.8933.69 a ± 1.3636.25 a ± 1.2440.67 b ± 1.33
14 th day46.11 c ± 1.9152.32 d ± 1.0134.78 a ± 0.8839.82 b ± 1.4543.83 c ± 1.57
Hardness, g/cm31st day1734.88 b ± 44.372512.46 d ± 50.271580.27 a ± 41.861941.43 c ± 51.872409.74 d ± 47.08
14th day1808.51 b ± 30.272567.09 d ± 14.901602.82 a ± 55.682154.37 c ± 44.202618.74 d ± 36.17
Note. NHC—ice cream based on non-hydrolyzed whey concentrate; NH3%—ice cream based on non-hydrolyzed whey concentrate + 3% whey protein isolate; HC—ice cream based on hydrolyzed whey concentrate; H3%—ice cream based on hydrolyzed whey concentrate + 3% whey protein isolate; H5%—ice cream based on hydrolyzed whey concentrate + 5% whey protein isolate. a–d—different superscript letters in the lines represent significant differences in the mean values of the same parameter (p ≤ 0.05).
Table 7. Microbiological indicators of ice cream samples.
SampleStorage Time (Days)Counting (log CFU/g)
ColiformLA-5®YeastsFungi
NHC1ND6.65.16.0
14ND6.65.56.2
NH3%1ND6.35.4ND
14ND6.25.75.1
HC1ND>7.75.35.3
14ND>7.75.55.5
H3%1ND7.65.0ND
14ND7.65.3ND
H5%1ND7.45.0ND
14ND7.35.2ND
Note. ND—not detected. NHC—ice cream based on non-hydrolyzed whey concentrate; NH3%—ice cream based on non-hydrolyzed whey concentrate + 3% whey protein isolate; HC—ice cream based on hydrolyzed whey concentrate; H3%—ice cream based on hydrolyzed whey concentrate + 3% whey protein isolate; H5%—ice cream based on hydrolyzed whey concentrate + 5% whey protein isolate.
Disclaimer/Publisher’s Note: The statements, opinions and data contained in all publications are solely those of the individual author(s) and contributor(s) and not of MDPI and/or the editor(s). MDPI and/or the editor(s) disclaim responsibility for any injury to people or property resulting from any ideas, methods, instructions or products referred to in the content.

