
The Role of Amylose in Gel Forming of Rice Flour

Abstract
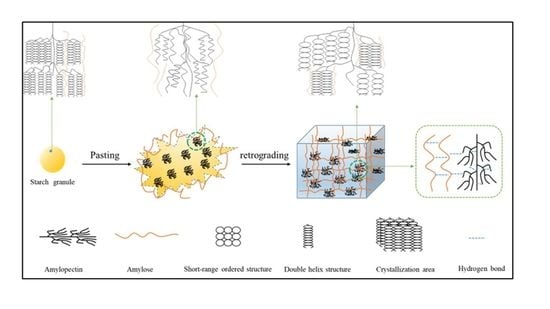
1. Introduction
2. Materials and Methods
2.1. Materials
2.2. Determination of Amylose Content
2.3. Preparation of Rice Samples
2.4. Monitoring of Thermal Properties
2.5. Dynamic Rheology Analysis
2.6. Identification of Crystal Structures
2.7. Determination of Functional Groups and Short-Range Ordered Structures
2.8. Monitoring of Microstructures
2.9. Statistical Analysis
3. Results and Discussion
3.1. Amylose Content of Rice
3.2. Thermal Properties of Rice Flour
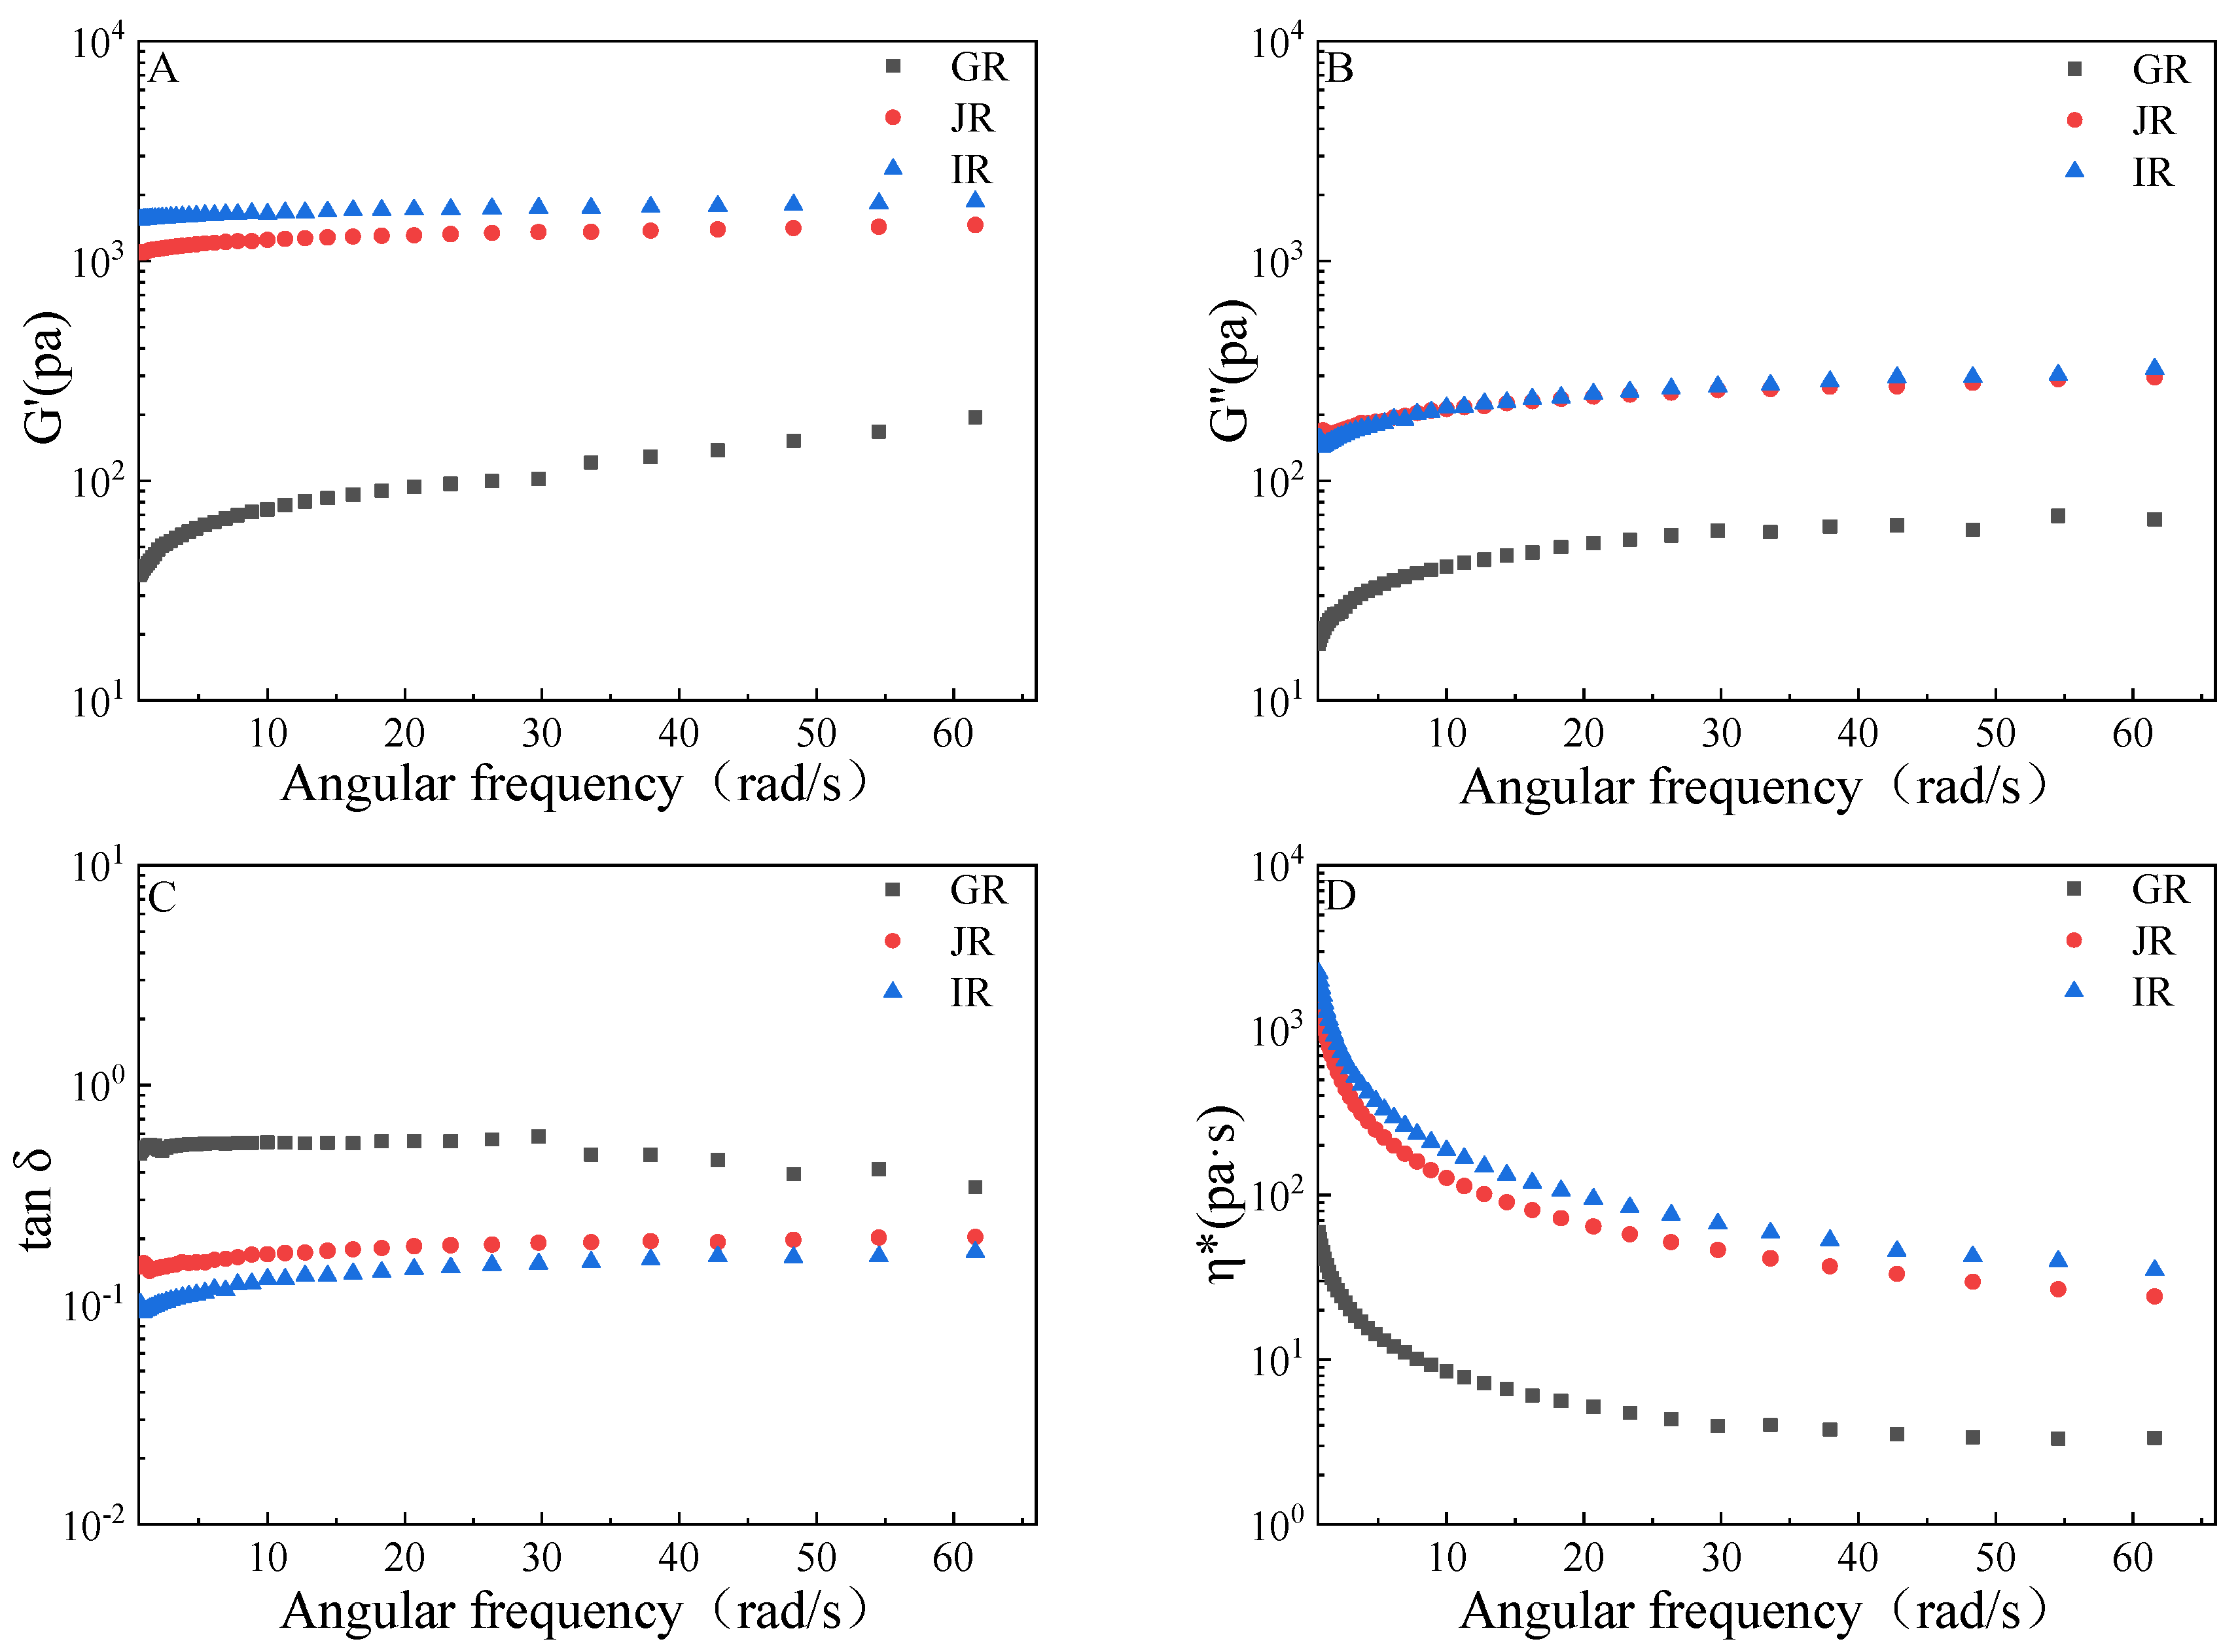
3.3. Rheological Properties of Gels
3.4. Thermal Properties of Retrograded Gels
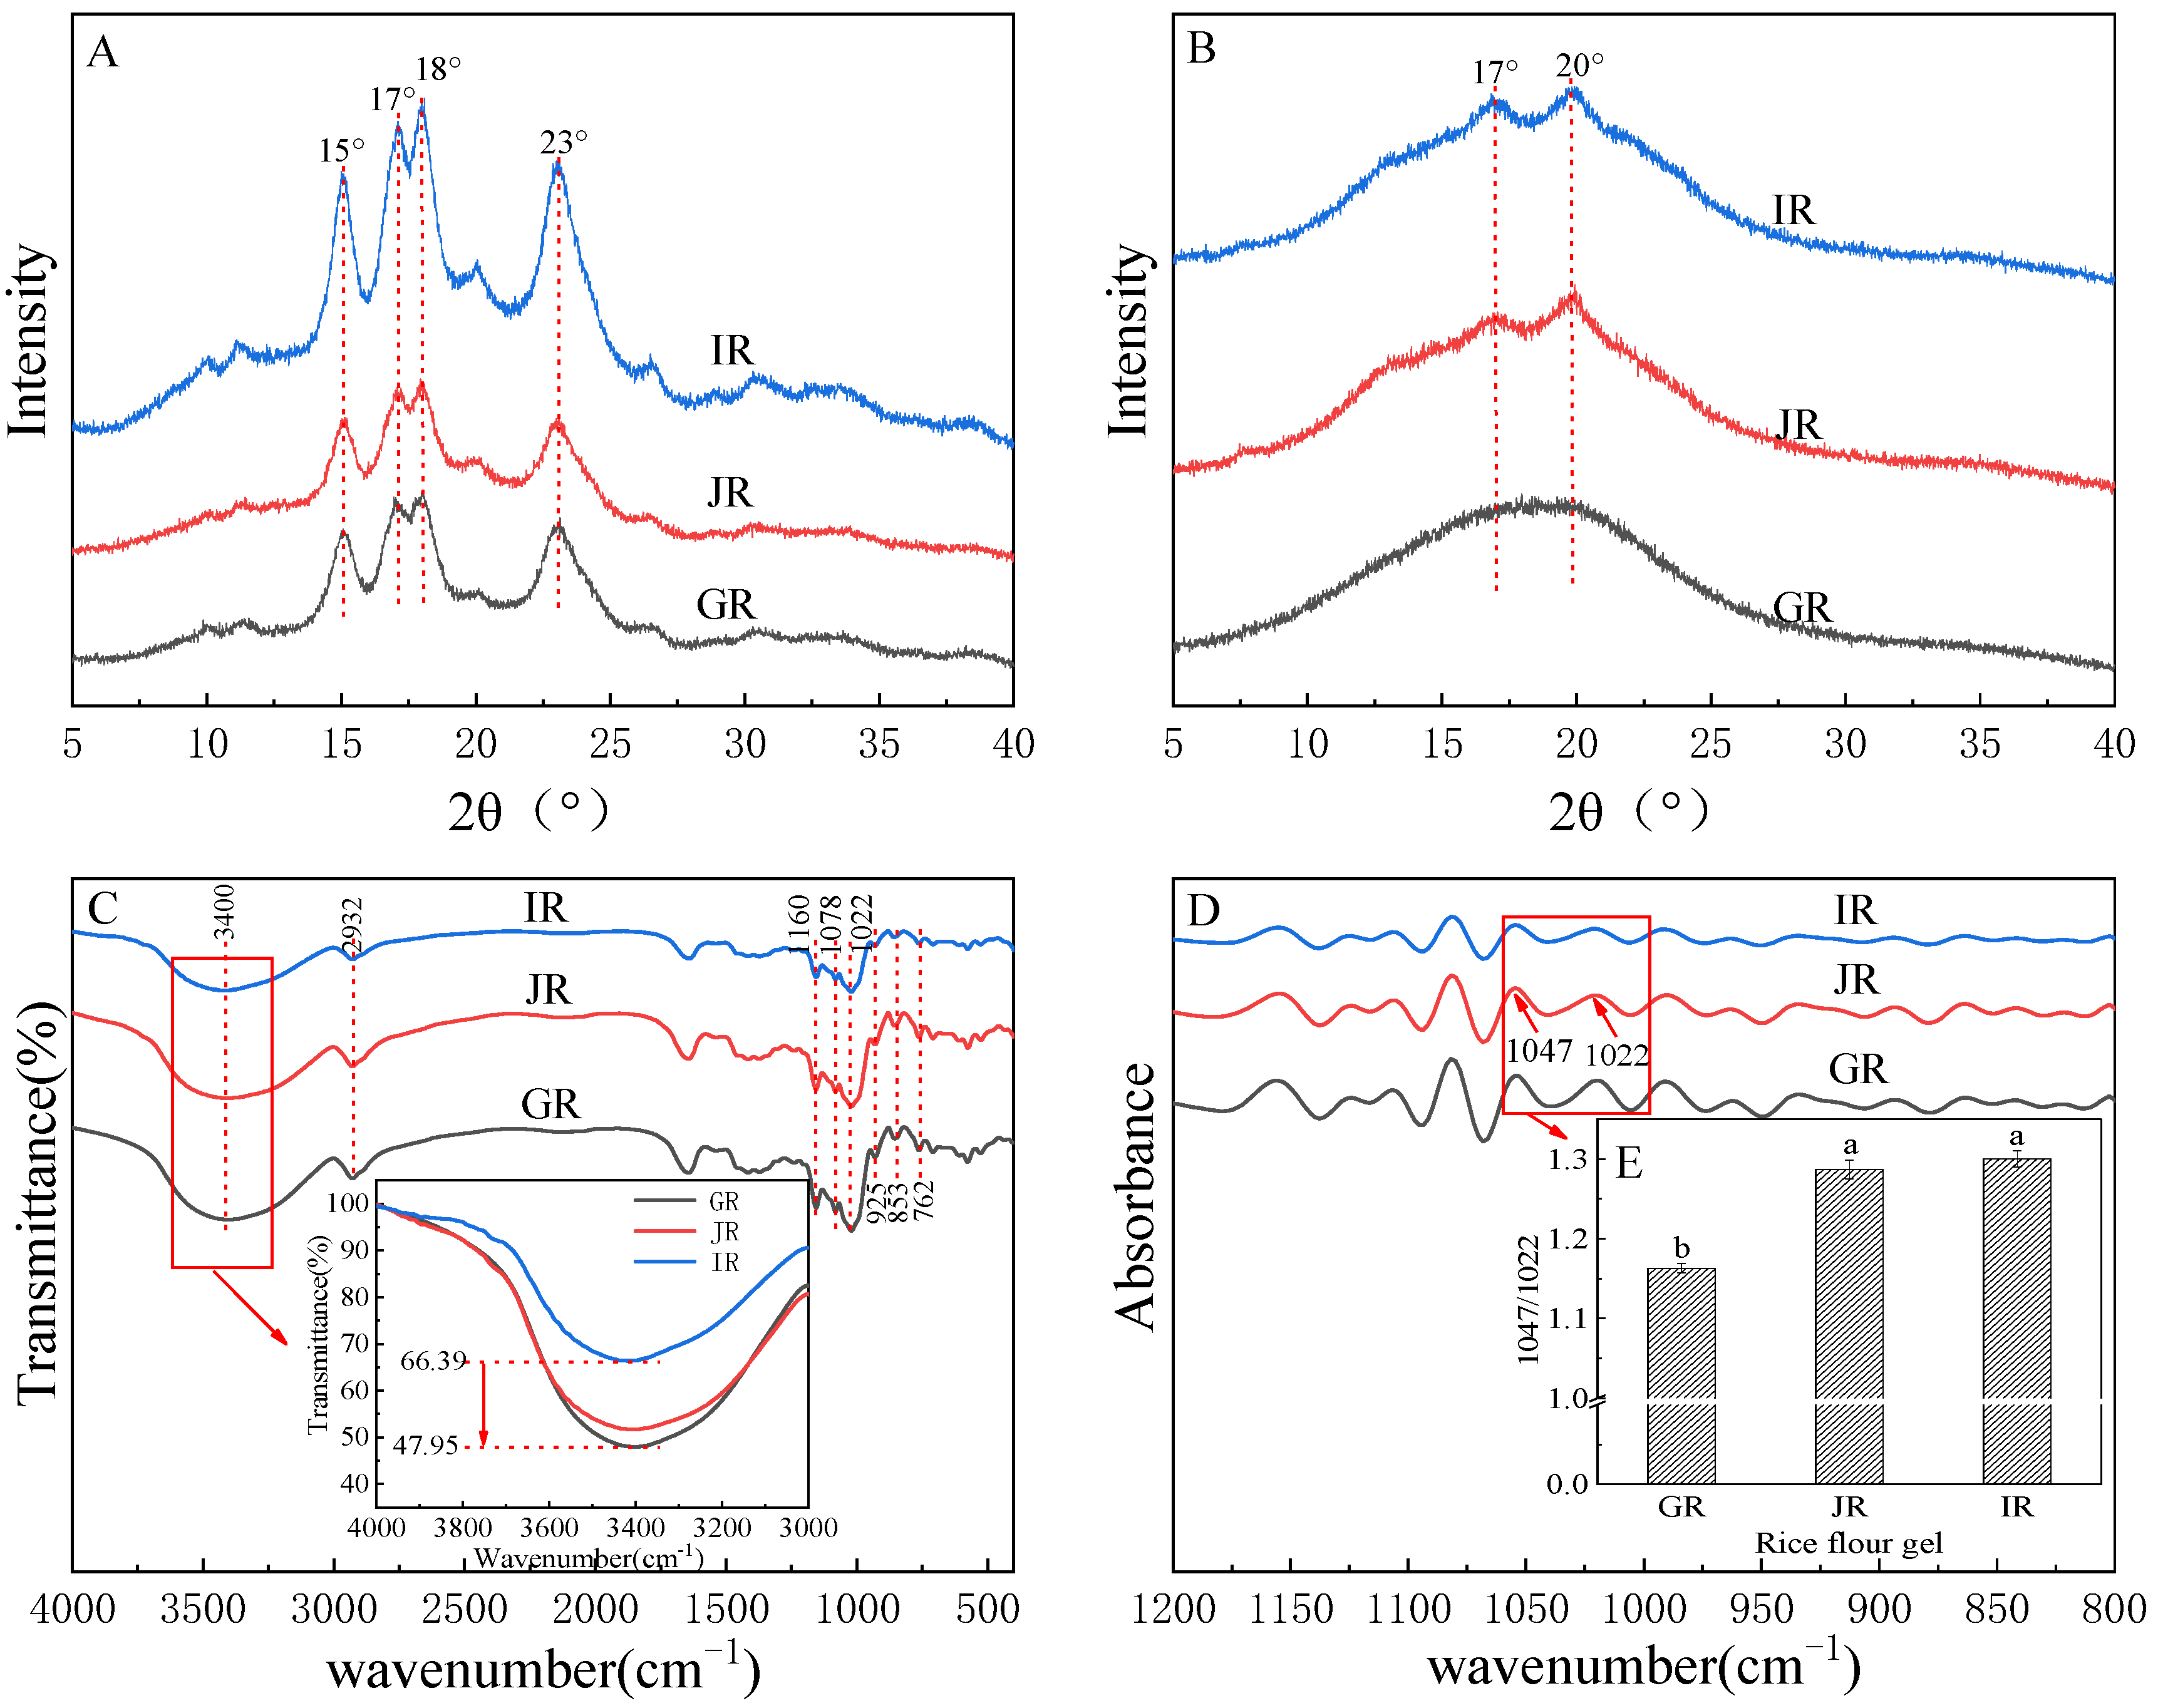
3.5. Crystal Structures of Retrograded Gels
3.6. Functional Groups and Short-Range Ordered Structures of Retrograded Gels
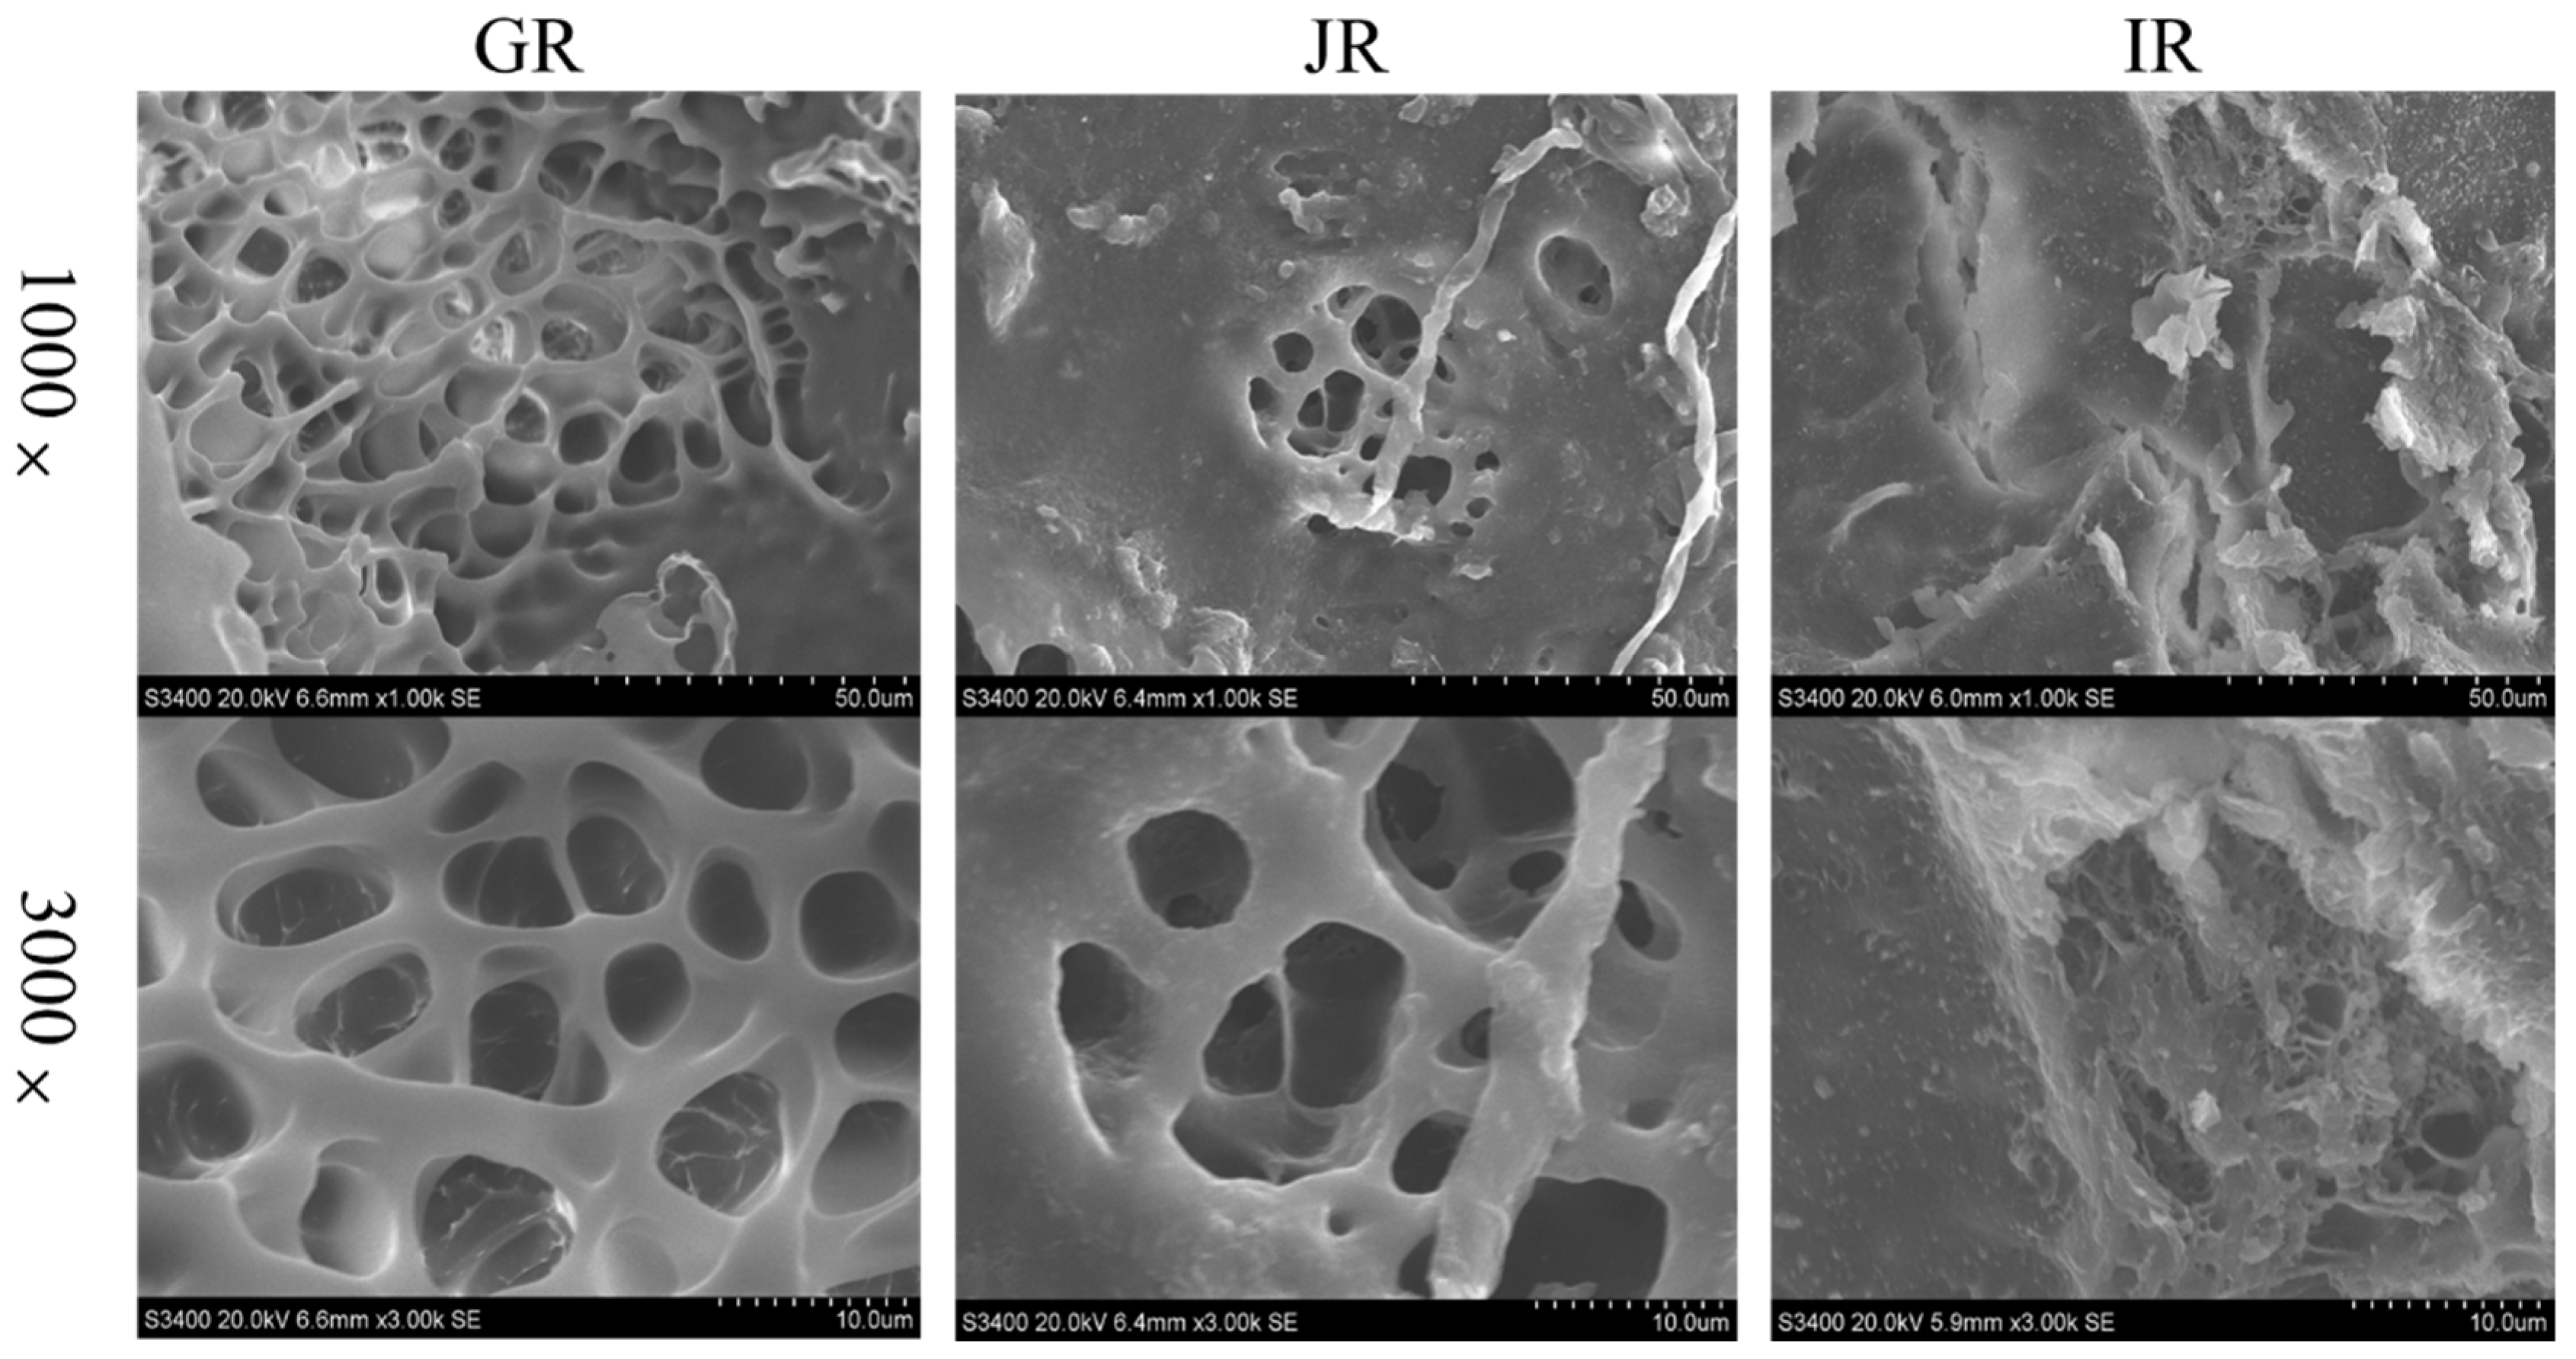
3.7. Microstructures of Retrograded Gels
4. Conclusions
Author Contributions
Funding
Data Availability Statement
Acknowledgments
Conflicts of Interest
References
- Li, L.; Xu, H.; Zhou, J.; Yu, J.; Copeland, L.; Wang, S. Mechanisms Underlying the Effect of Tea Extracts on In Vitro Digestion of Wheat Starch. J. Agric. Food Chem. 2021, 69, 8227–8235. [Google Scholar] [CrossRef] [PubMed]
- Lian, X.; Kang, H.; Sun, H.; Liu, L.; Li, L. Identification of the Main Retrogradation-Related Properties of Rice Starch. J. Agric. Food Chem. 2015, 63, 1562–1572. [Google Scholar] [CrossRef]
- Amagliani, L.; O’Regan, J.; Kelly, A.L.; O’Mahony, J.A. Chemistry, Structure, Functionality and Applications of Rice Starch. J. Cereal Sci. 2016, 70, 291–300. [Google Scholar] [CrossRef]
- Li, H.; Prakash, S.; Nicholson, T.M.; Fitzgerald, M.A.; Gilbert, R.G. Instrumental Measurement of Cooked Rice Texture by Dynamic Rheological Testing and Its Relation to the Fine Structure of Rice Starch. Carbohydr. Polym. 2016, 146, 253–263. [Google Scholar] [CrossRef] [PubMed]
- Li, C.; Hu, Y. Combination of Parallel and Sequential Digestion Kinetics Reveals the Nature of Digestive Characteristics of Short-Term Retrograded Rice Starches. Food Hydrocoll. 2020, 108, 106071. [Google Scholar] [CrossRef]
- Fredriksson, H.; Silverio, J.; Andersson, R.; Eliasson, A.-C.; Åman, P. The Influence of Amylose and Amylopectin Characteristics on Gelatinization and Retrogradation Properties of Different Starches. Carbohydr. Polym. 1998, 35, 119–134. [Google Scholar] [CrossRef]
- Biduski, B.; Silva, W.M.F.d.; Colussi, R.; Halal, S.L.d.M.E.; Lim, L.-T.; Dias, Á.R.G.; Zavareze, E.d.R. Starch Hydrogels: The Influence of the Amylose Content and Gelatinization Method. Int. J. Biol. Macromol. 2018, 113, 443–449. [Google Scholar] [CrossRef]
- Karim, A.A.; Norziah, M.H.; Seow, C.C. Methods for the Study of Starch Retrogradation. Food Chem. 2000, 71, 9–36. [Google Scholar] [CrossRef]
- Dun, H.; Liang, H.; Li, S.; Li, B.; Geng, F. Influence of an O/W Emulsion on the Gelatinization, Retrogradation and Digestibility of Rice Starch with Varying Amylose Contents. Food Hydrocoll. 2021, 113, 106547. [Google Scholar] [CrossRef]
- Ambigaipalan, P.; Hoover, R.; Donner, E.; Liu, Q. Retrogradation Characteristics of Pulse Starches. Food Res. Int. 2013, 54, 203–212. [Google Scholar] [CrossRef]
- GB/T 15683-2008; Rice-Determination of Amylose Content. General Administration of Quality Supervision, Inspection and Quarantine of the People’s Republic of China. Standardization Administration of China: Beijing, China, 2008; pp. 1–4.
- Wu, Y.; Niu, M.; Xu, H. Pasting Behaviors, Gel Rheological Properties, and Freeze-Thaw Stability of Rice Flour and Starch Modified by Green Tea Polyphenols. LWT Food Sci. Technol. 2020, 118, 108796. [Google Scholar] [CrossRef]
- Yi, C.; Zhu, H.; Zhang, Y.; Wu, S.; Bao, J. The Role of Indica Starch in the Mechanism of Formation of Fresh Rice Noodles. J. Cereal Sci. 2021, 99, 103212. [Google Scholar] [CrossRef]
- Holdsworth, S.D. Applicability of Rheological Models to the Interpretation of Flow and Processing Behaviour of Fluid Food Products. J. Texture Stud. 1971, 2, 393–418. [Google Scholar] [CrossRef] [PubMed]
- Huang, S.; Chi, C.; Li, X.; Zhang, Y.; Chen, L. Understanding the Structure, Digestibility, Texture and Flavor Attributes of Rice Noodles Complexation with Xanthan and Dodecyl Gallate. Food Hydrocoll. 2022, 127, 107538. [Google Scholar] [CrossRef]
- Zhang, H.; Wu, F.; Xu, D.; Xu, X. Endogenous Alpha-Amylase Explains the Different Pasting and Rheological Properties of Wet and Dry Milled Glutinous Rice Flour. Food Hydrocoll. 2021, 113, 106425. [Google Scholar] [CrossRef]
- Zhu, F.; Liu, P. Starch Gelatinization, Retrogradation, and Enzyme Susceptibility of Retrograded Starch: Effect of Amylopectin Internal Molecular Structure. Food Chem. 2020, 316, 126036. [Google Scholar] [CrossRef]
- Xiao, H.; Lin, Q.; Liu, G.-Q.; Yu, F. Evaluation of Black Tea Polyphenol Extract Against the Retrogradation of Starches from Various Plant Sources. Molecules 2012, 17, 8147–8158. [Google Scholar] [CrossRef]
- Gidley, M.J.; Bulpin, P.V. Crystallisation of Malto-Oligosaccharides as Models of the Crystalline Forms of Starch: Minimum Chain-Length Requirement for the Formation of Double Helices. Carbohydr. Res. 1987, 161, 291–300. [Google Scholar] [CrossRef]
- Park, I.-M.; Ibáñez, A.M.; Zhong, F.; Shoemaker, C.F. Gelatinization and Pasting Properties of Waxy and Non-Waxy Rice Starches. Starch Stärke 2007, 59, 388–396. [Google Scholar] [CrossRef]
- Li, C.; Hu, Y.; Li, E. Effects of Amylose and Amylopectin Chain-Length Distribution on the Kinetics of Long-Term Rice Starch Retrogradation. Food Hydrocoll. 2021, 111, 106239. [Google Scholar] [CrossRef]
- Correa, M.J.; Ferrero, C.; Puppo, C.; Brites, C. Rheological Properties of Rice–Locust Bean Gum Gels from Different Rice Varieties. Food Hydrocoll. 2013, 31, 383–391. [Google Scholar] [CrossRef]
- Jeong, S.; Kim, Y.; Ko, S.; Yoon, M.-R.; Lee, J.-S.; Lee, S. Physicochemical Characterization and In-Vitro Digestibility of Extruded Rice Noodles with Different Amylose Contents Based on Rheological Approaches. J. Cereal Sci. 2016, 71, 258–263. [Google Scholar] [CrossRef]
- Mariotti, M.; Caccialanza, G.; Cappa, C.; Lucisano, M. Rheological Behaviour of Rice Flour Gels during Formation: Influence of the Amylose Content and of the Hydrothermal and Mechanical History. Food Hydrocoll. 2018, 84, 257–266. [Google Scholar] [CrossRef]
- Wang, S.; Li, C.; Copeland, L.; Niu, Q.; Wang, S. Starch Retrogradation: A Comprehensive Review. Compr. Rev. Food Sci. Food Saf. 2015, 14, 568–585. [Google Scholar] [CrossRef]
- Vamadevan, V.; Bertoft, E. Impact of Different Structural Types of Amylopectin on Retrogradation. Food Hydrocoll. 2018, 80, 88–96. [Google Scholar] [CrossRef]
- Matignon, A.; Tecante, A. Starch Retrogradation: From Starch Components to Cereal Products. Food Hydrocoll. 2017, 68, 43–52. [Google Scholar] [CrossRef]
- Chen, L.; Ren, F.; Zhang, Z.; Tong, Q.; Rashed, M.M.A. Effect of Pullulan on the Short-Term and Long-Term Retrogradation of Rice Starch. Carbohydr. Polym. 2015, 115, 415–421. [Google Scholar] [CrossRef] [PubMed]
- Ye, J.; Yang, R.; Liu, C.; Luo, S.; Chen, J.; Hu, X.; Wu, J. Improvement in Freeze-Thaw Stability of Rice Starch Gel by Inulin and Its Mechanism. Food Chem. 2018, 268, 324–333. [Google Scholar] [CrossRef]
- Sheng, L.; Li, P.; Wu, H.; Liu, Y.; Han, K.; Gouda, M.; Tong, Q.; Ma, M.; Jin, Y. Tapioca Starch-Pullulan Interaction during Gelation and Retrogradation. LWT Food Sci. Technol. 2018, 96, 432–438. [Google Scholar] [CrossRef]
- He, H.; Chi, C.; Xie, F.; Li, X.; Liang, Y.; Chen, L. Improving the in Vitro Digestibility of Rice Starch by Thermomechanically Assisted Complexation with Guar Gum. Food Hydrocoll. 2020, 102, 105637. [Google Scholar] [CrossRef]
- Wang, B.; Gao, W.; Kang, X.; Dong, Y.; Liu, P.; Yan, S.; Yu, B.; Guo, L.; Cui, B.; Abd El-Aty, A.M. Structural Changes in Corn Starch Granules Treated at Different Temperatures. Food Hydrocoll. 2021, 118, 106760. [Google Scholar] [CrossRef]
- Feltre, G.; Almeida, F.S.; Sato, A.C.K.; Dacanal, G.C.; Hubinger, M.D. Alginate and Corn Starch Mixed Gels: Effect of Gelatinization and Amylose Content on the Properties and in Vitro Digestibility. Food Res. Int. 2020, 132, 109069. [Google Scholar] [CrossRef] [PubMed]


| Sample | Thermal Properties | Rheological Parameters | ||||||
|---|---|---|---|---|---|---|---|---|
| To (°C) | Tp (°C) | Tc (°C) | ΔT (°C) | ΔH (J/g) | tan δ (ω = 10 rad/s) | K* | n* | |
| GR | 64.74 ± 0.48 c | 73.35 ± 0.27 c | 80.41 ± 0.28 b | 15.67 ± 0.74 b | 13.25 ± 0.24 a | 0.552 ± 0.003 a | 11.36 ± 0.55 c | 0.3844 ± 0.0029 a |
| JR | 66.15 ± 0.55 b | 76.73 ± 0.17 b | 83.99 ± 0.62 a | 17.84 ± 0.52 a | 10.48 ± 0.25 b | 0.164 ± 0.004 b | 200.3 ± 4.8 b | 0.0727 ± 0.0036 b |
| IR | 73.71 ± 0.24 a | 77.35 ± 0.04 a | 80.60 ± 0.09 b | 6.90 ± 0.33 c | 7.65 ± 0.05 c | 0.088 ± 0.000 c | 282.3 ± 5.0 a | 0.0589 ± 0.0029 c |
| Sample | Thermal Properties | RD (%) | Relative Crystallinity (%) | |||||
|---|---|---|---|---|---|---|---|---|
| TrO (°C) | Trp (°C) | Trc (°C) | ΔHr (J/g) | B-Type | V-Type | Total | ||
| GR | 50.92 ± 0.09 c | 59.24 ± 0.12 c | 64.90 ± 0.15 c | 0.30 ± 0.01 c | 2.27 ± 0.03 c | ND | ND | 2.035 ± 0.022 c |
| JR | 51.94 ± 0.09 b | 61.52 ± 0.18 b | 72.28 ± 0.13 b | 2.24 ± 0.05 a | 21.41 ± 0.22 b | 2.482 ± 0.030 b | 5.555 ± 0.007 a | 8.912 ± 0.086 b |
| IR | 54.26 ± 0.11 a | 63.21 ± 0.13 a | 74.69 ± 0.14 a | 1.97 ± 0.01 b | 25.79 ± 0.16 a | 3.542 ± 0.041 a | 5.615 ± 0.069 a | 10.67 ± 0.16 a |
Disclaimer/Publisher’s Note: The statements, opinions and data contained in all publications are solely those of the individual author(s) and contributor(s) and not of MDPI and/or the editor(s). MDPI and/or the editor(s) disclaim responsibility for any injury to people or property resulting from any ideas, methods, instructions or products referred to in the content. |
© 2023 by the authors. Licensee MDPI, Basel, Switzerland. This article is an open access article distributed under the terms and conditions of the Creative Commons Attribution (CC BY) license (https://creativecommons.org/licenses/by/4.0/).
Share and Cite
Tian, J.; Qin, L.; Zeng, X.; Ge, P.; Fan, J.; Zhu, Y. The Role of Amylose in Gel Forming of Rice Flour. Foods 2023, 12, 1210. https://doi.org/10.3390/foods12061210
Tian J, Qin L, Zeng X, Ge P, Fan J, Zhu Y. The Role of Amylose in Gel Forming of Rice Flour. Foods. 2023; 12(6):1210. https://doi.org/10.3390/foods12061210
Chicago/Turabian StyleTian, Jinmu, Likang Qin, Xuefeng Zeng, Pingzhen Ge, Jin Fan, and Yong Zhu. 2023. "The Role of Amylose in Gel Forming of Rice Flour" Foods 12, no. 6: 1210. https://doi.org/10.3390/foods12061210
APA StyleTian, J., Qin, L., Zeng, X., Ge, P., Fan, J., & Zhu, Y. (2023). The Role of Amylose in Gel Forming of Rice Flour. Foods, 12(6), 1210. https://doi.org/10.3390/foods12061210