
Ancient Grain Flours with Different Degrees of Sifting: Advances in Knowledge of Nutritional, Technological, and Microbiological Aspects

 ,
,  , ,
, ,  ,
,  and
and 
Abstract
:1. Introduction
2. Materials and Methods
2.1. Chemicals
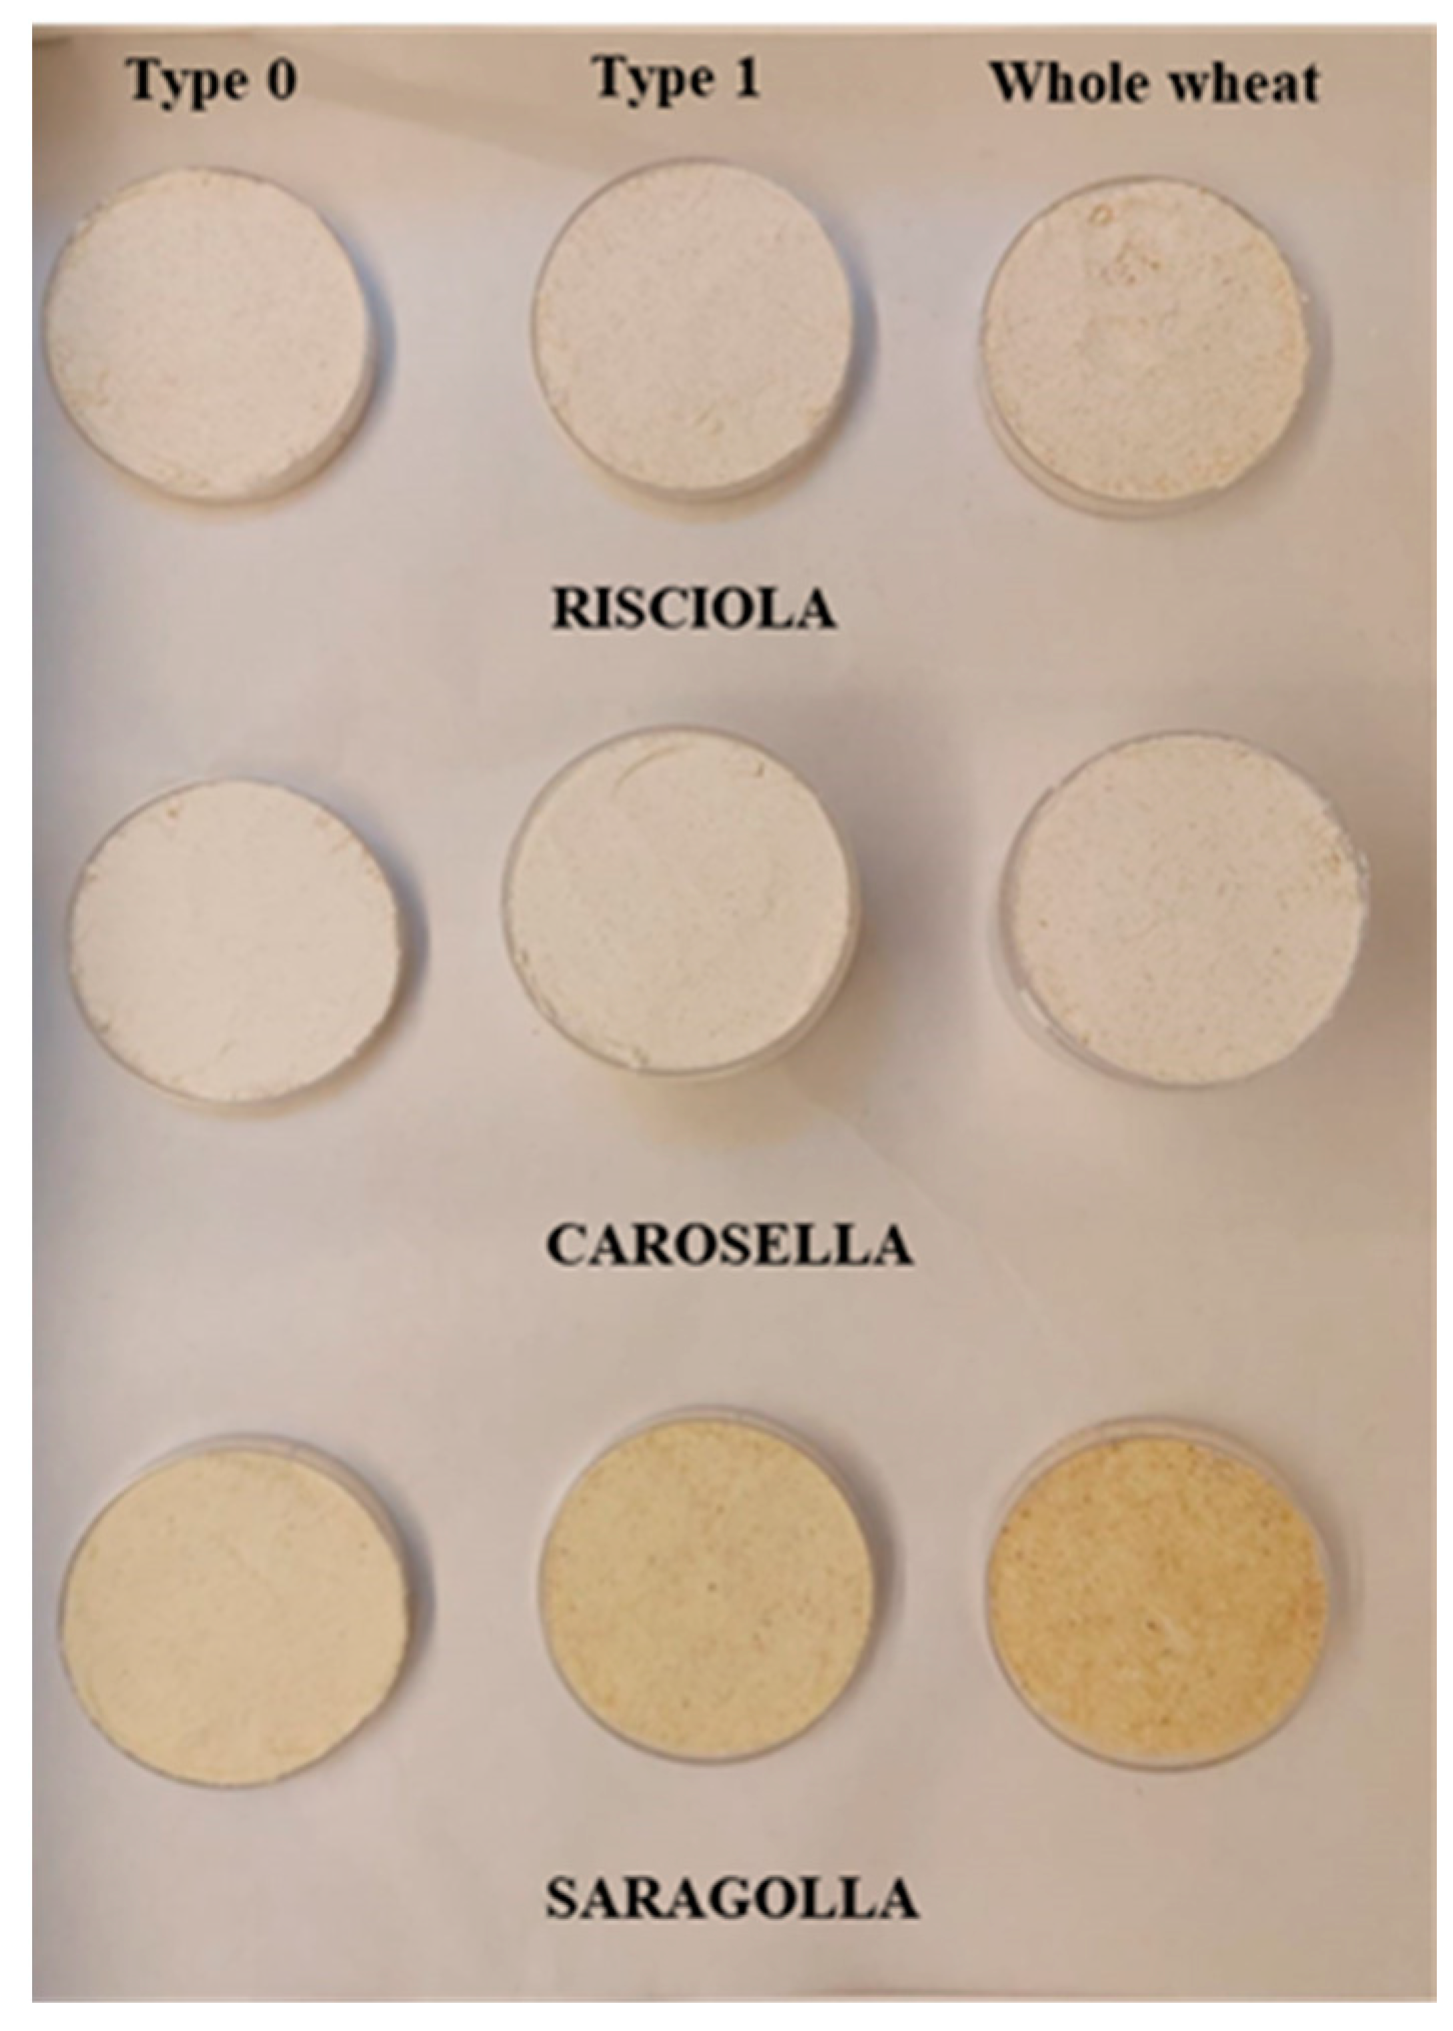
2.2. Raw Materials
2.3. ATR-FTIR Spectroscopy
2.4. Color, pH and Water Activity Measurement
2.5. Proximate Composition Analysis
2.6. Determination of the Amylose and Amylopectin Contents of Starch
2.7. In Vitro Starch Digestibility and Predicted Glycemic Index (pGI)
Application of a Mathematical Model
2.8. Quality Traits Assessment
2.9. Microbiological Analysis
2.10. Statistical Analysis
3. Results and Discussion
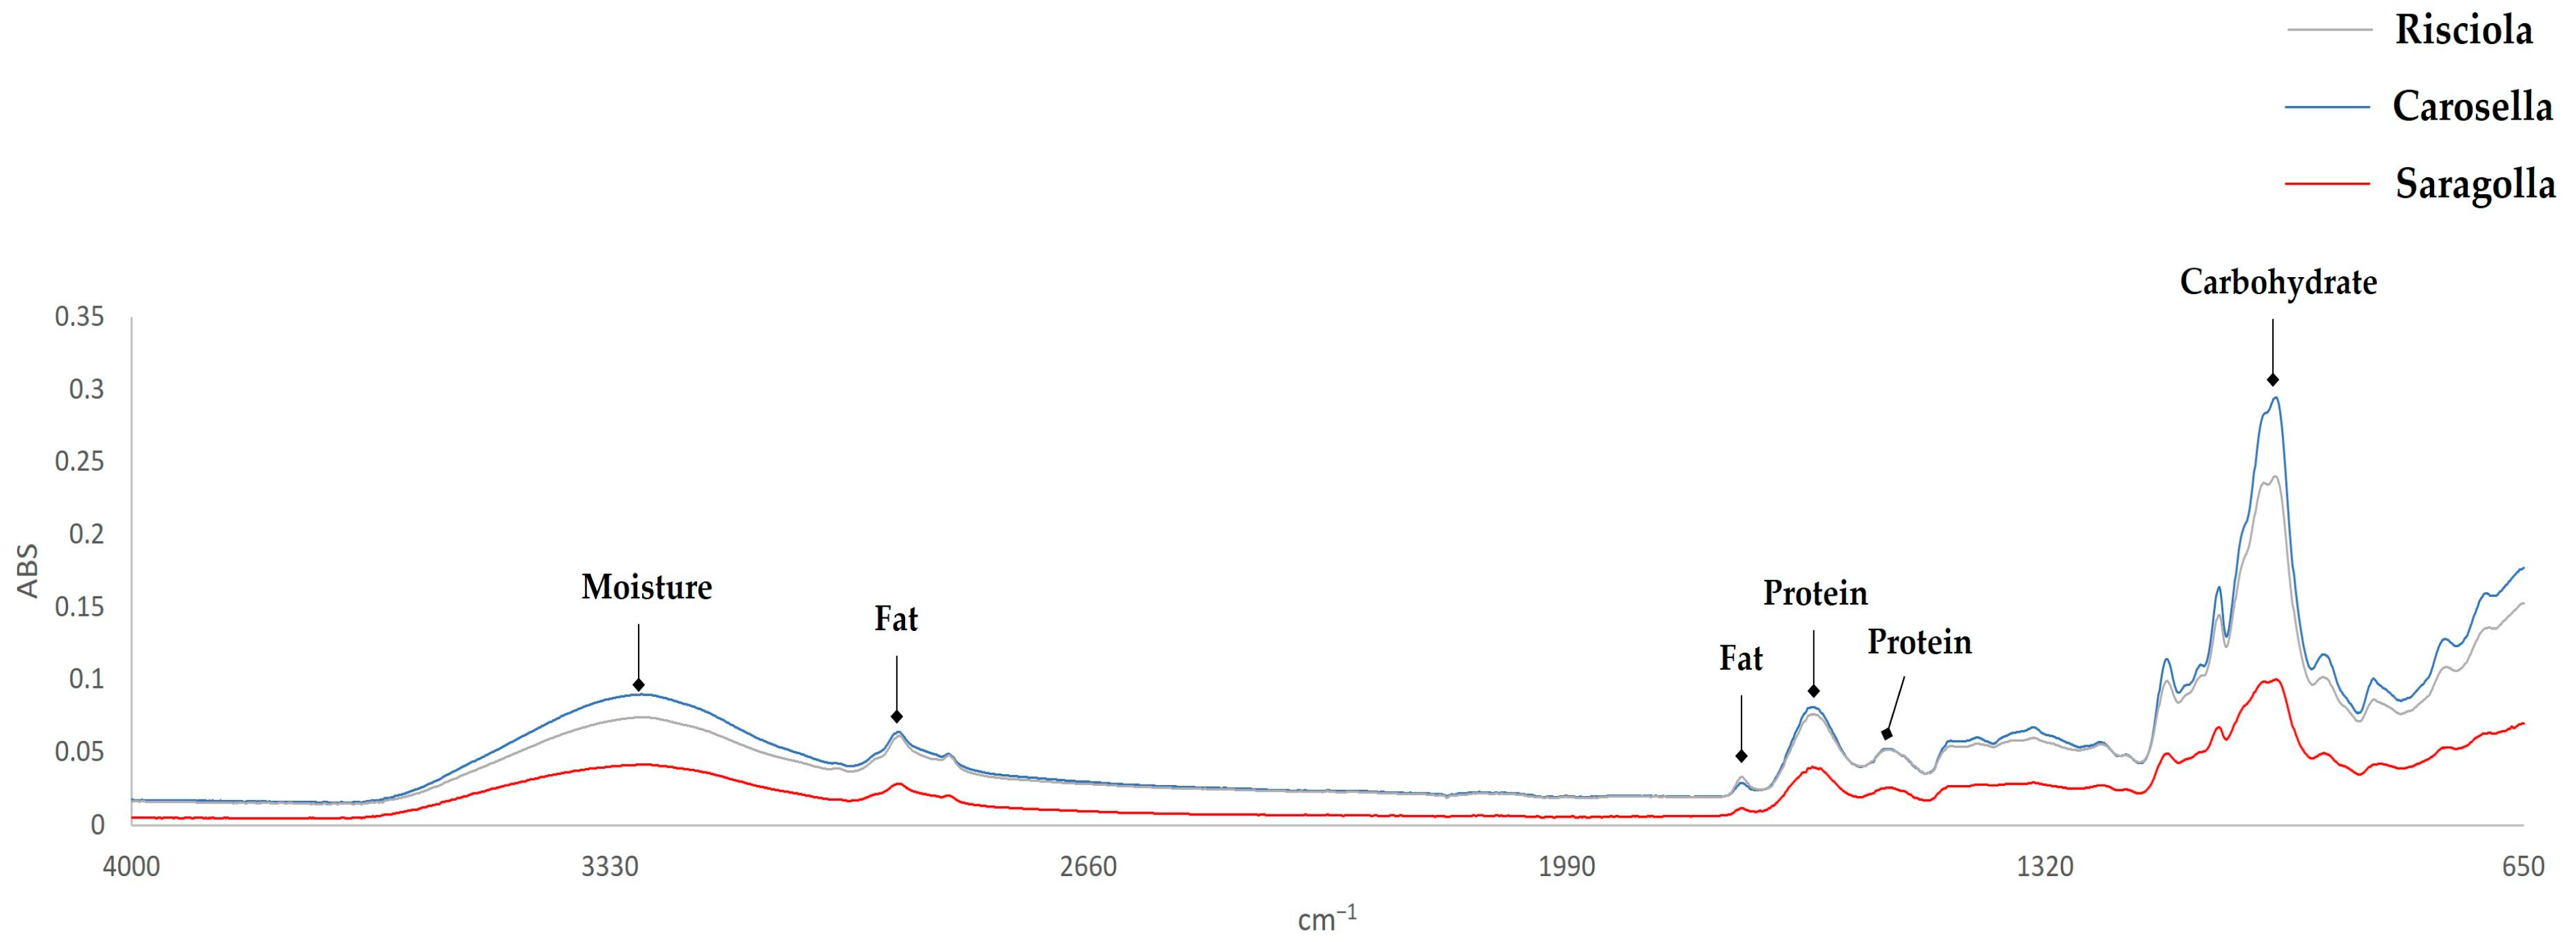
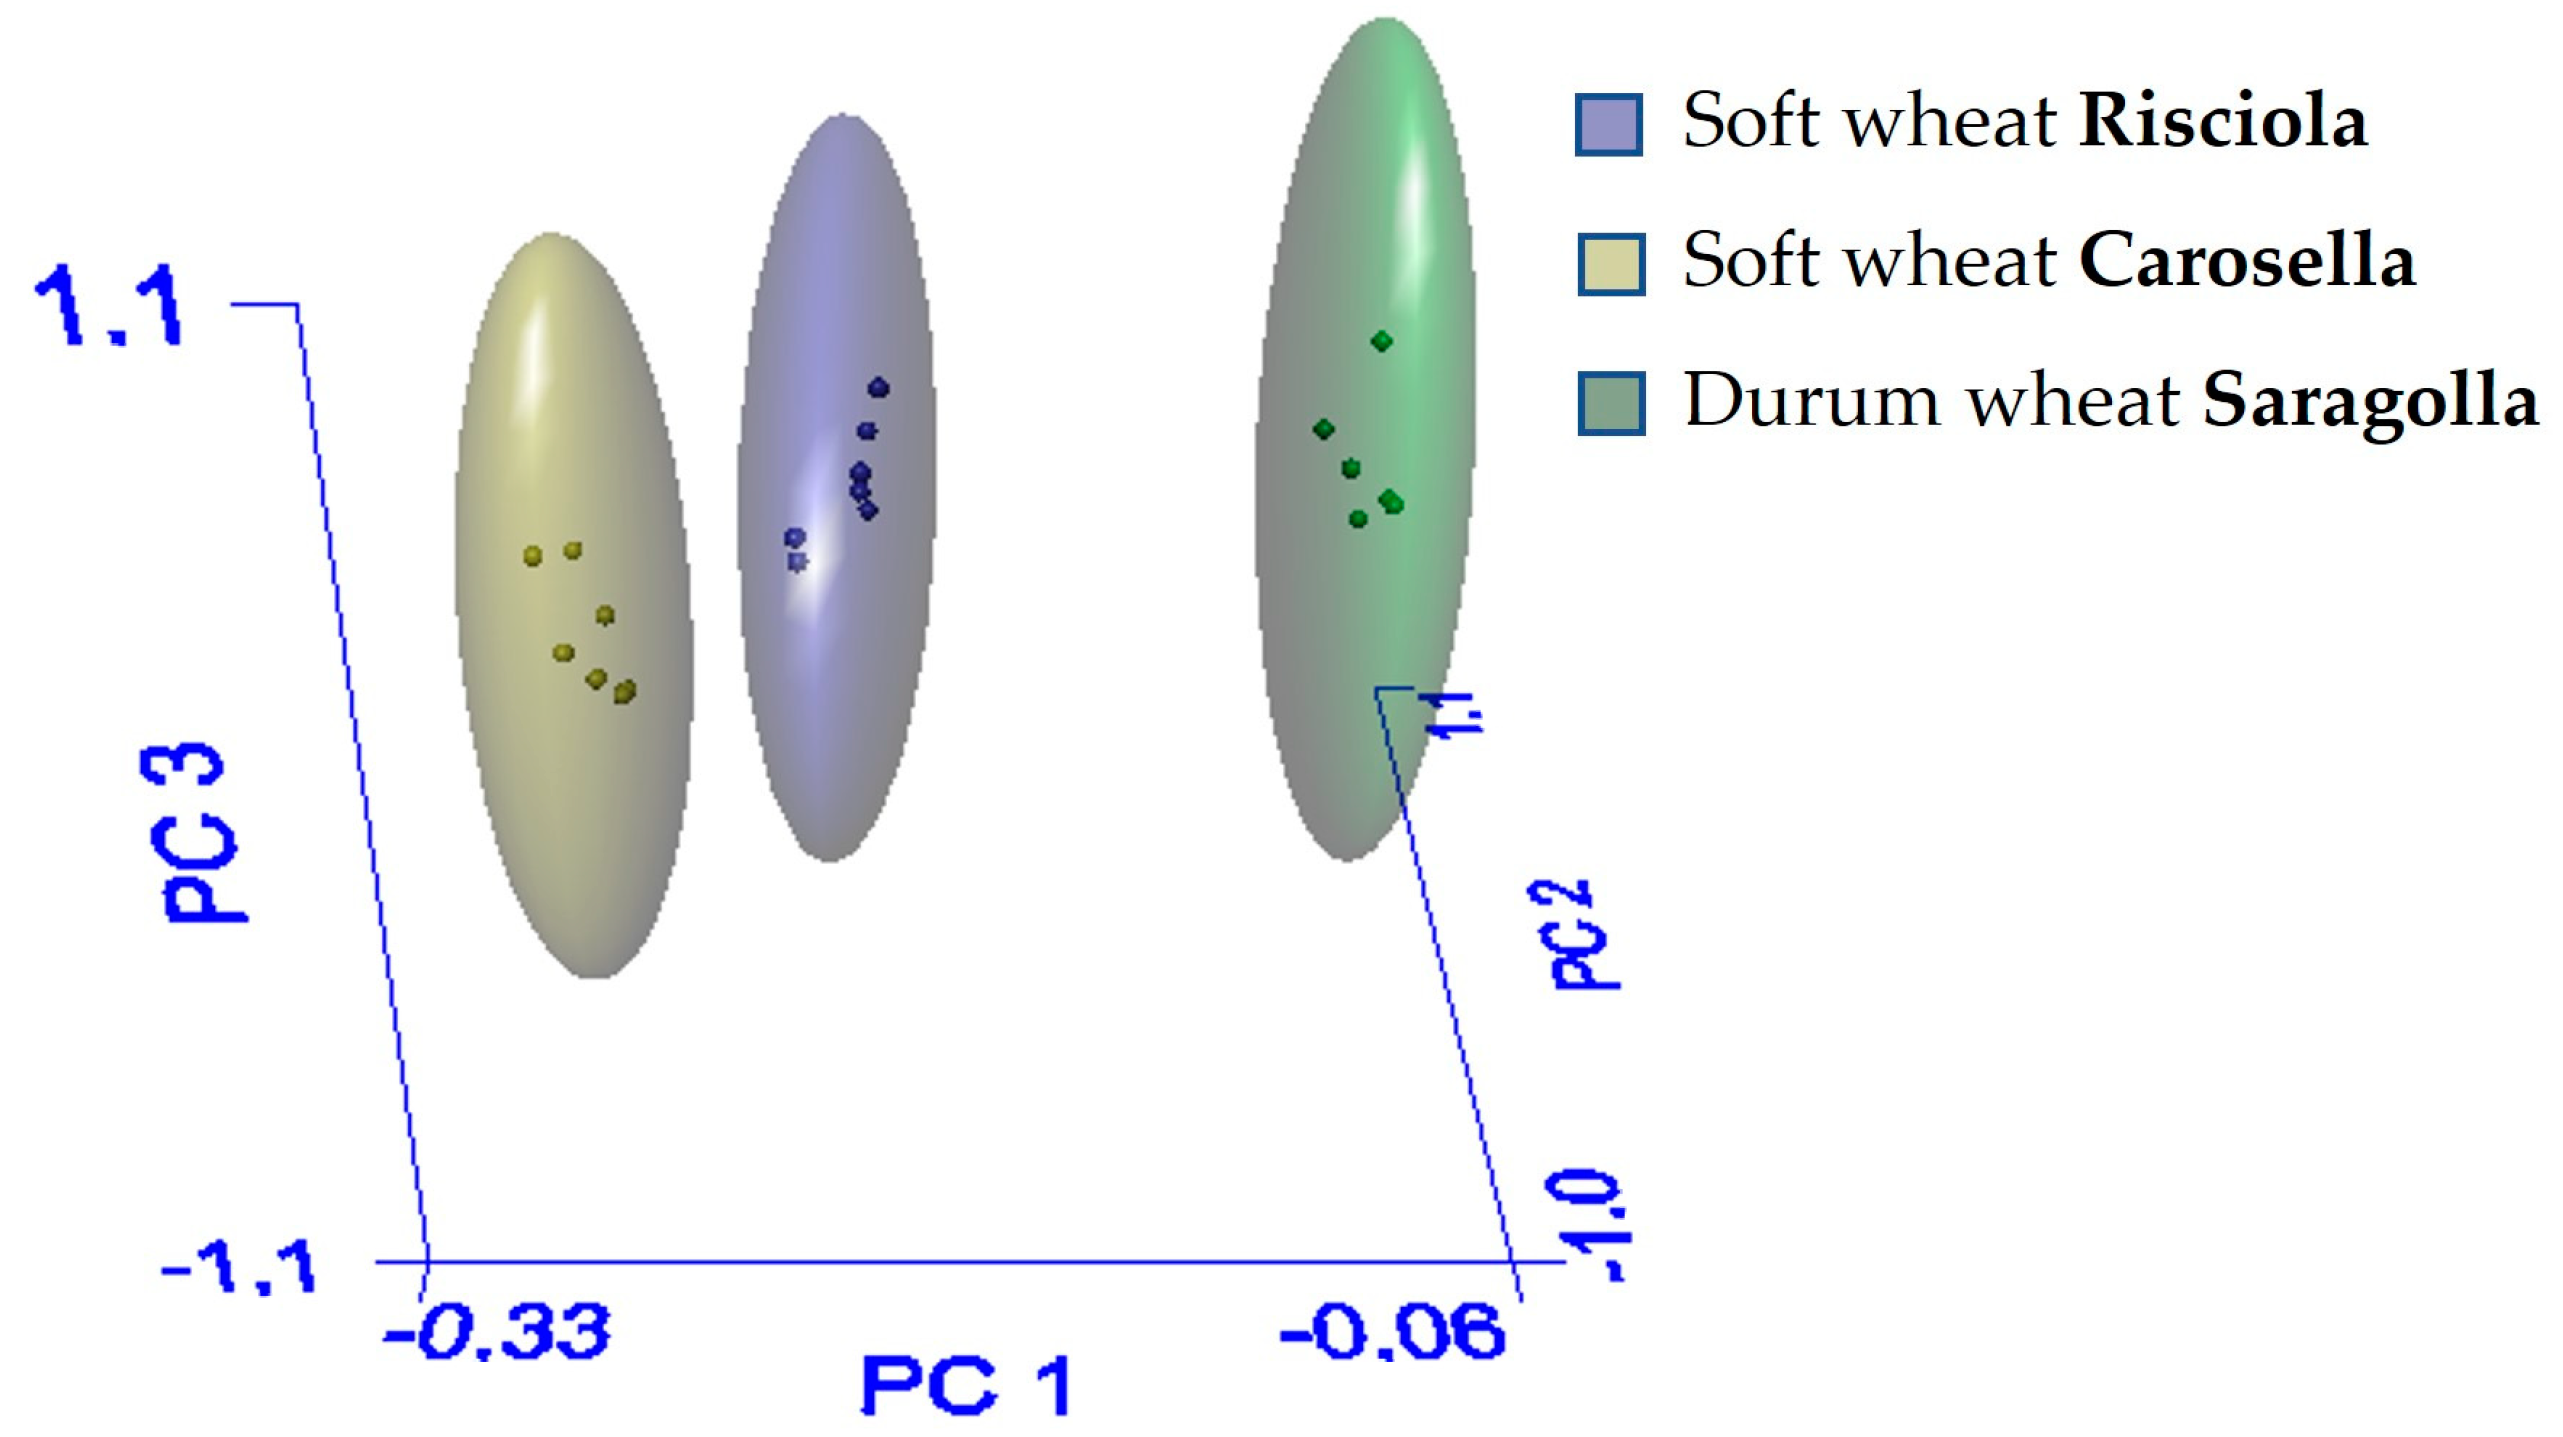
3.1. ATR-FTIR Spectral Analysis
3.2. Flour’s Color, pH and Water Activity
3.3. Proximate Composition
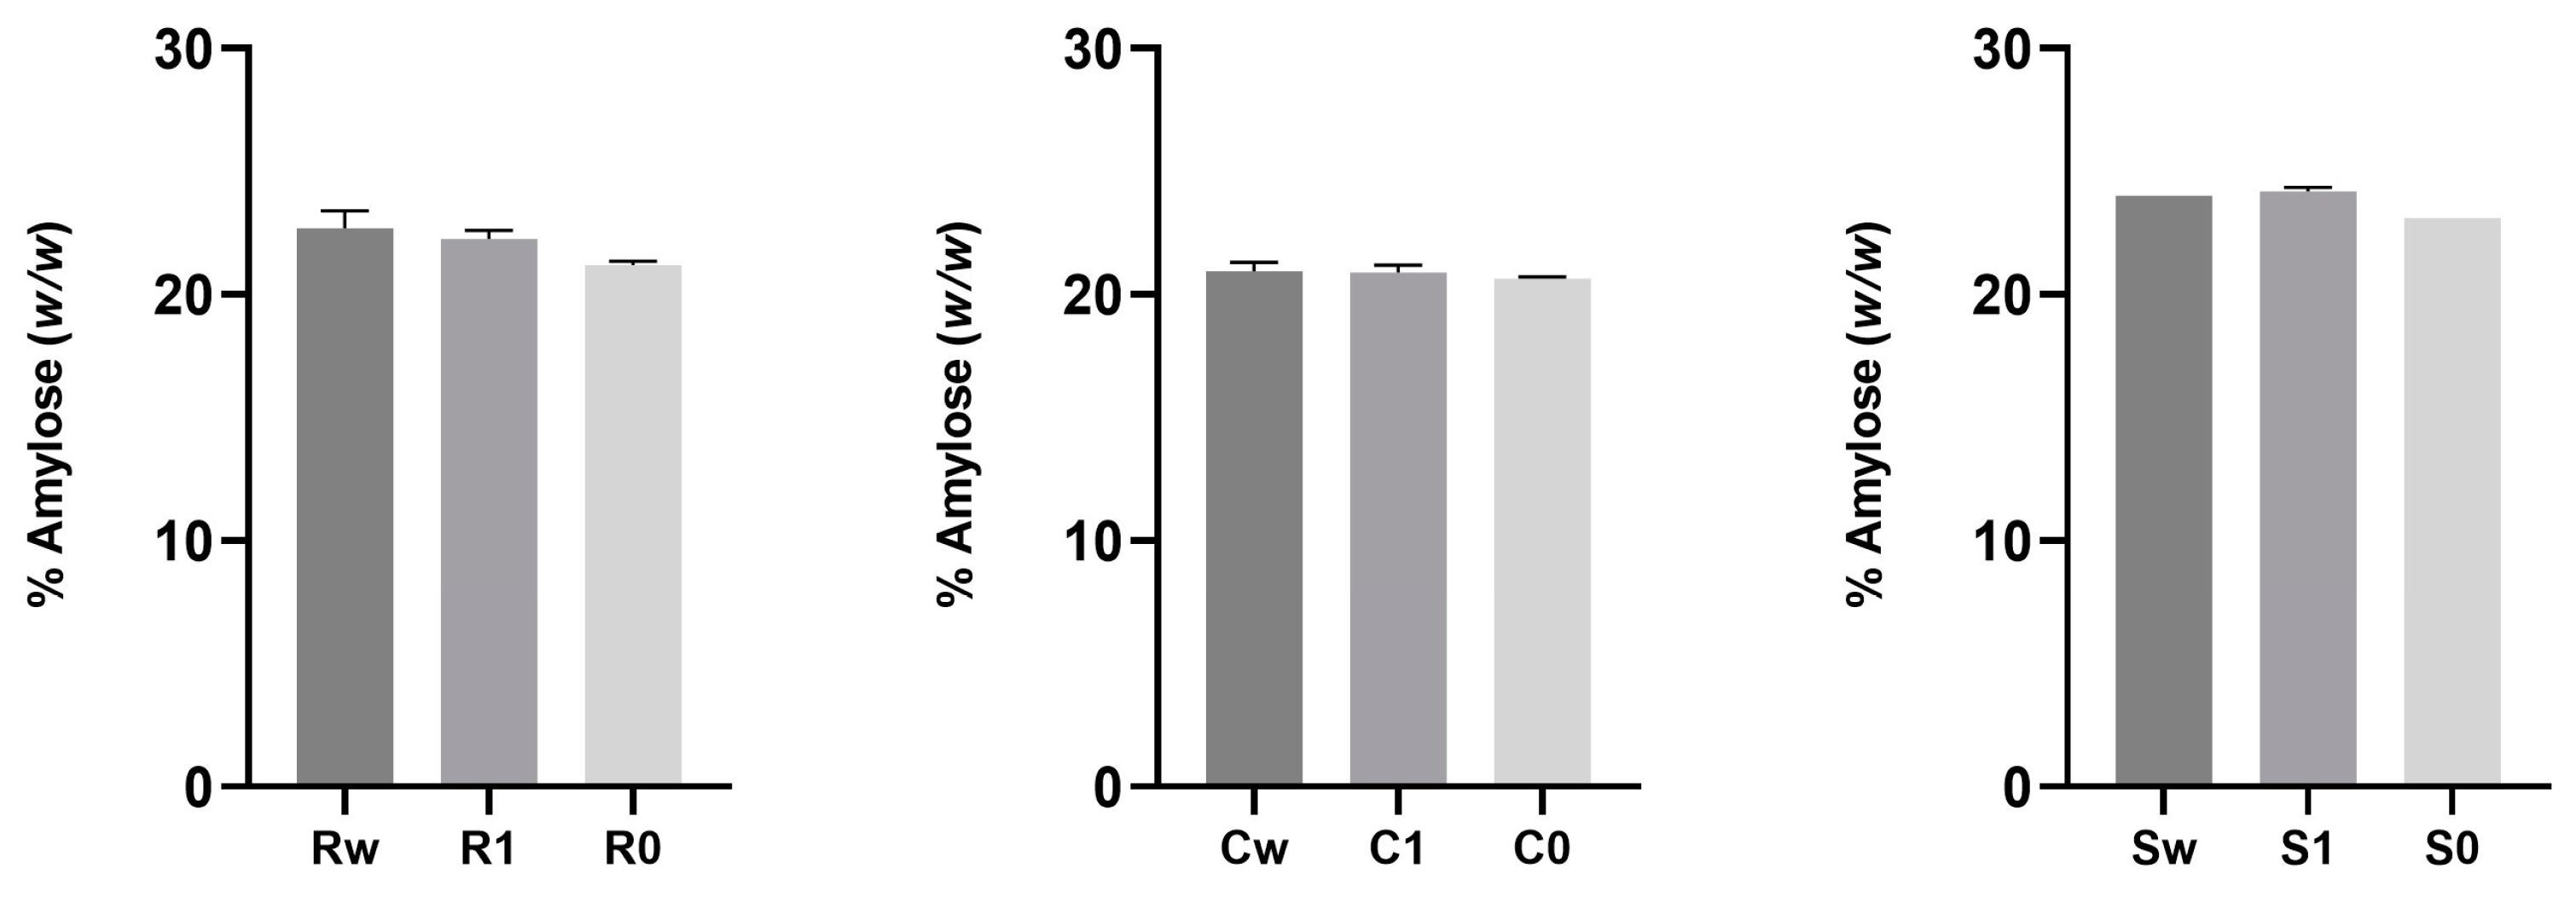
3.4. Determination of the Amylose and Amylopectin Contents in Starch
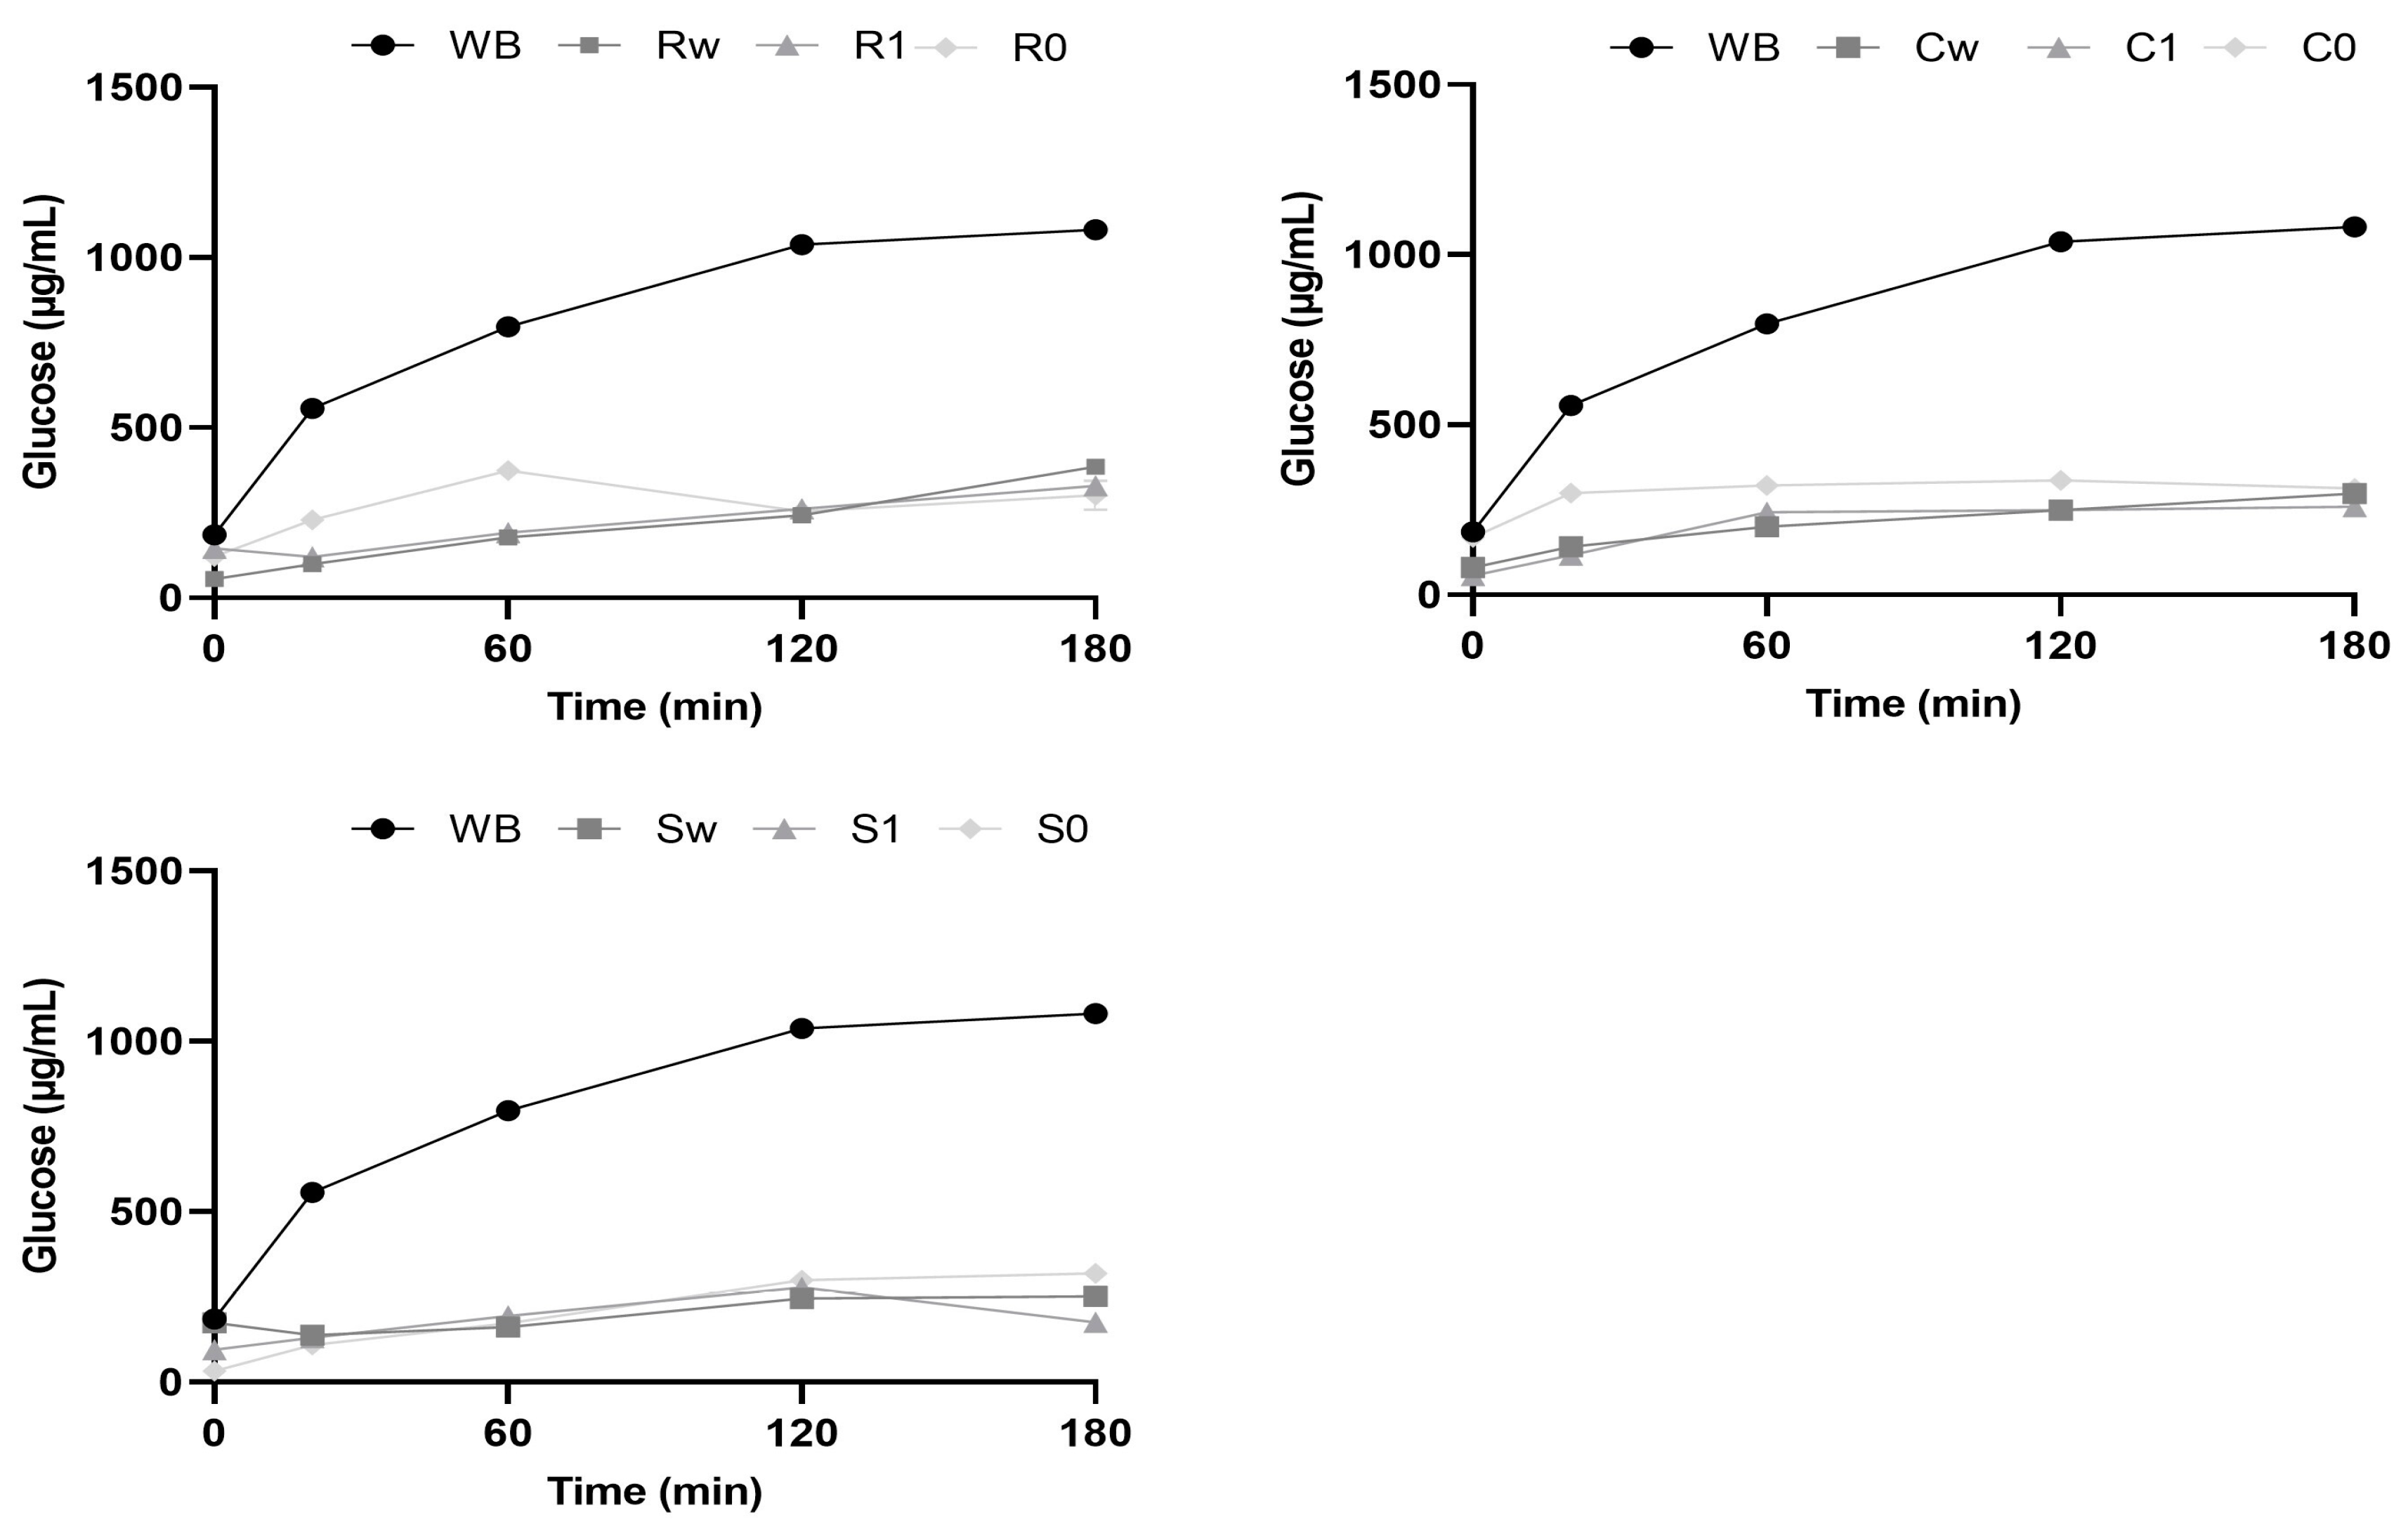
3.5. In Vitro Starch Digestibility and Predicted Glycemic Index (pGI)
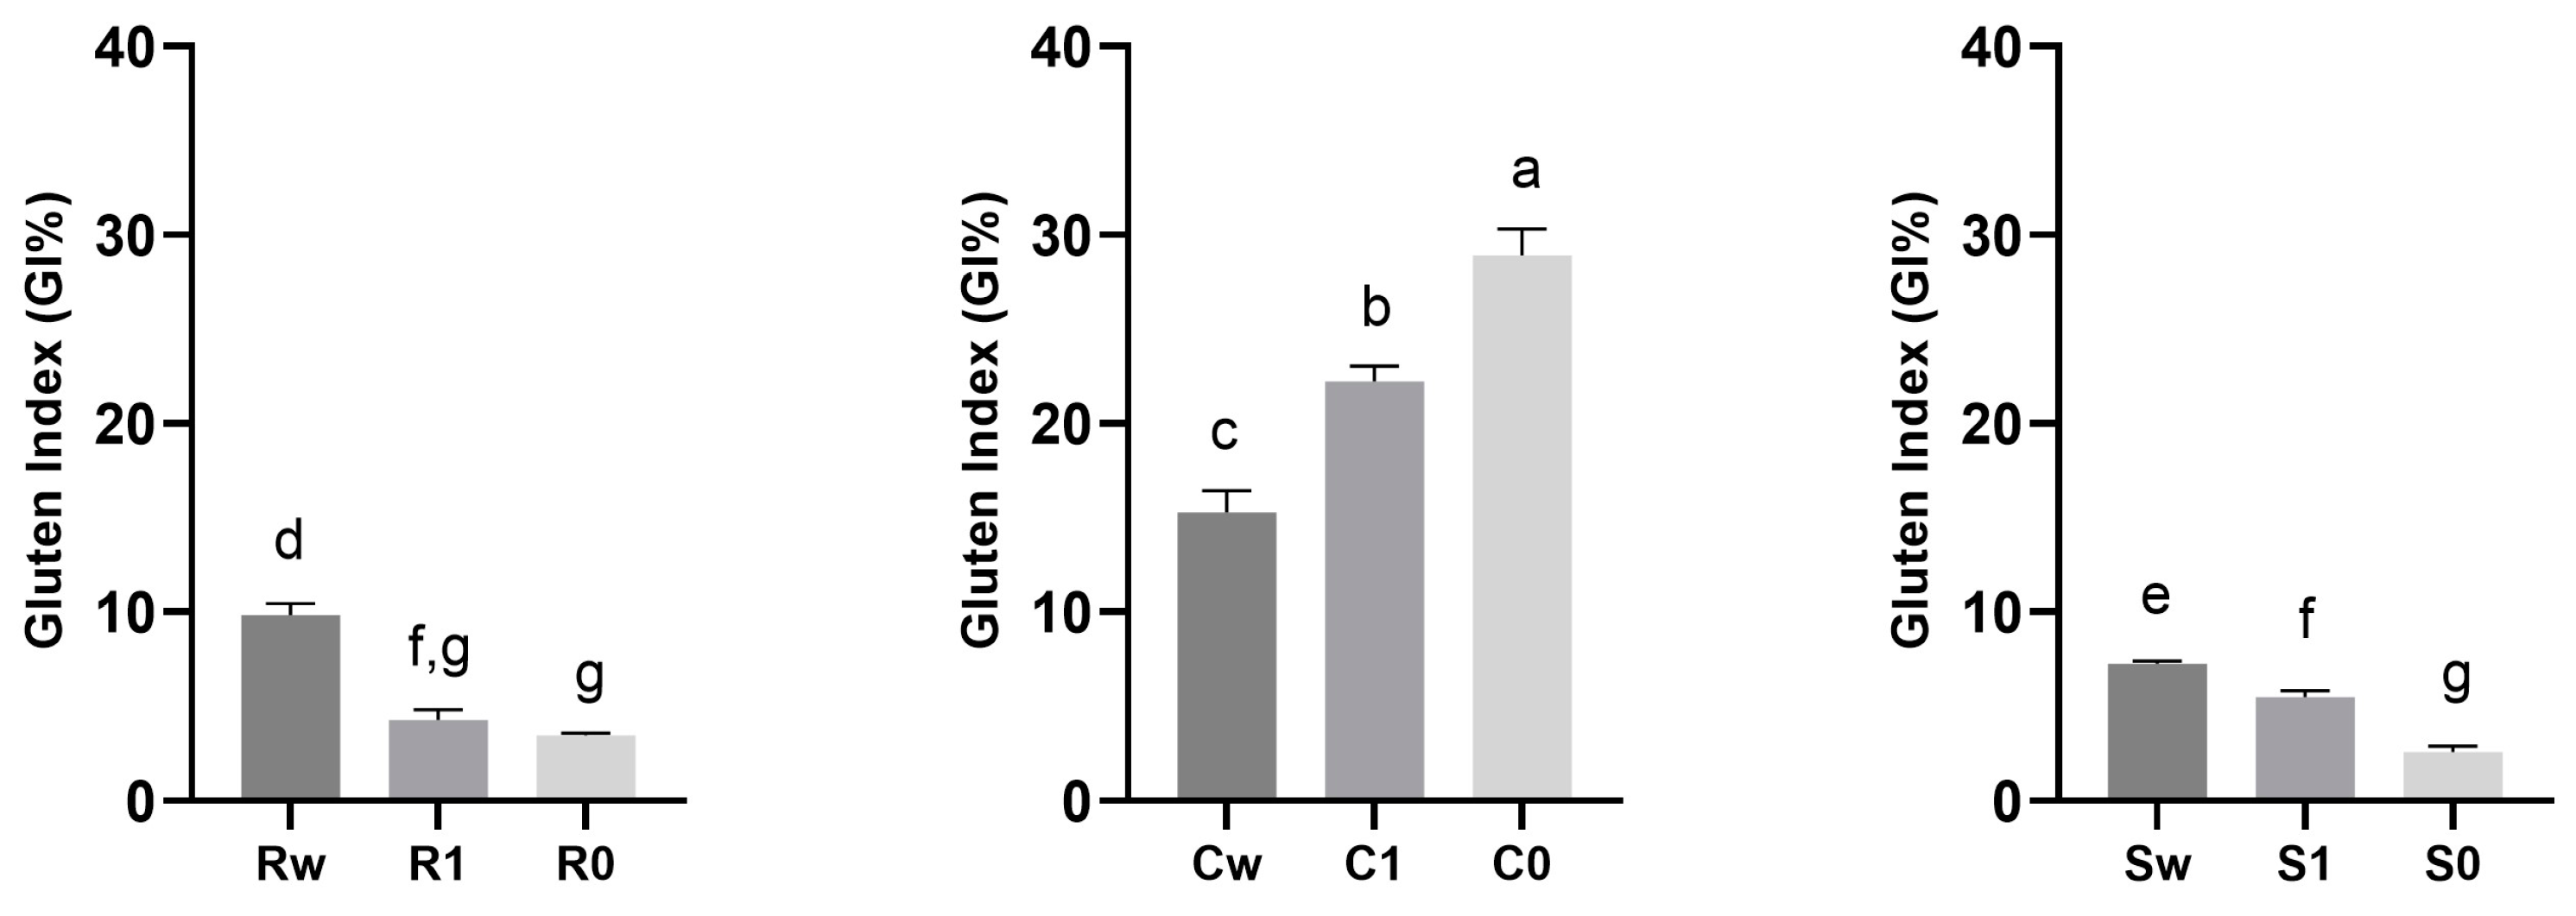
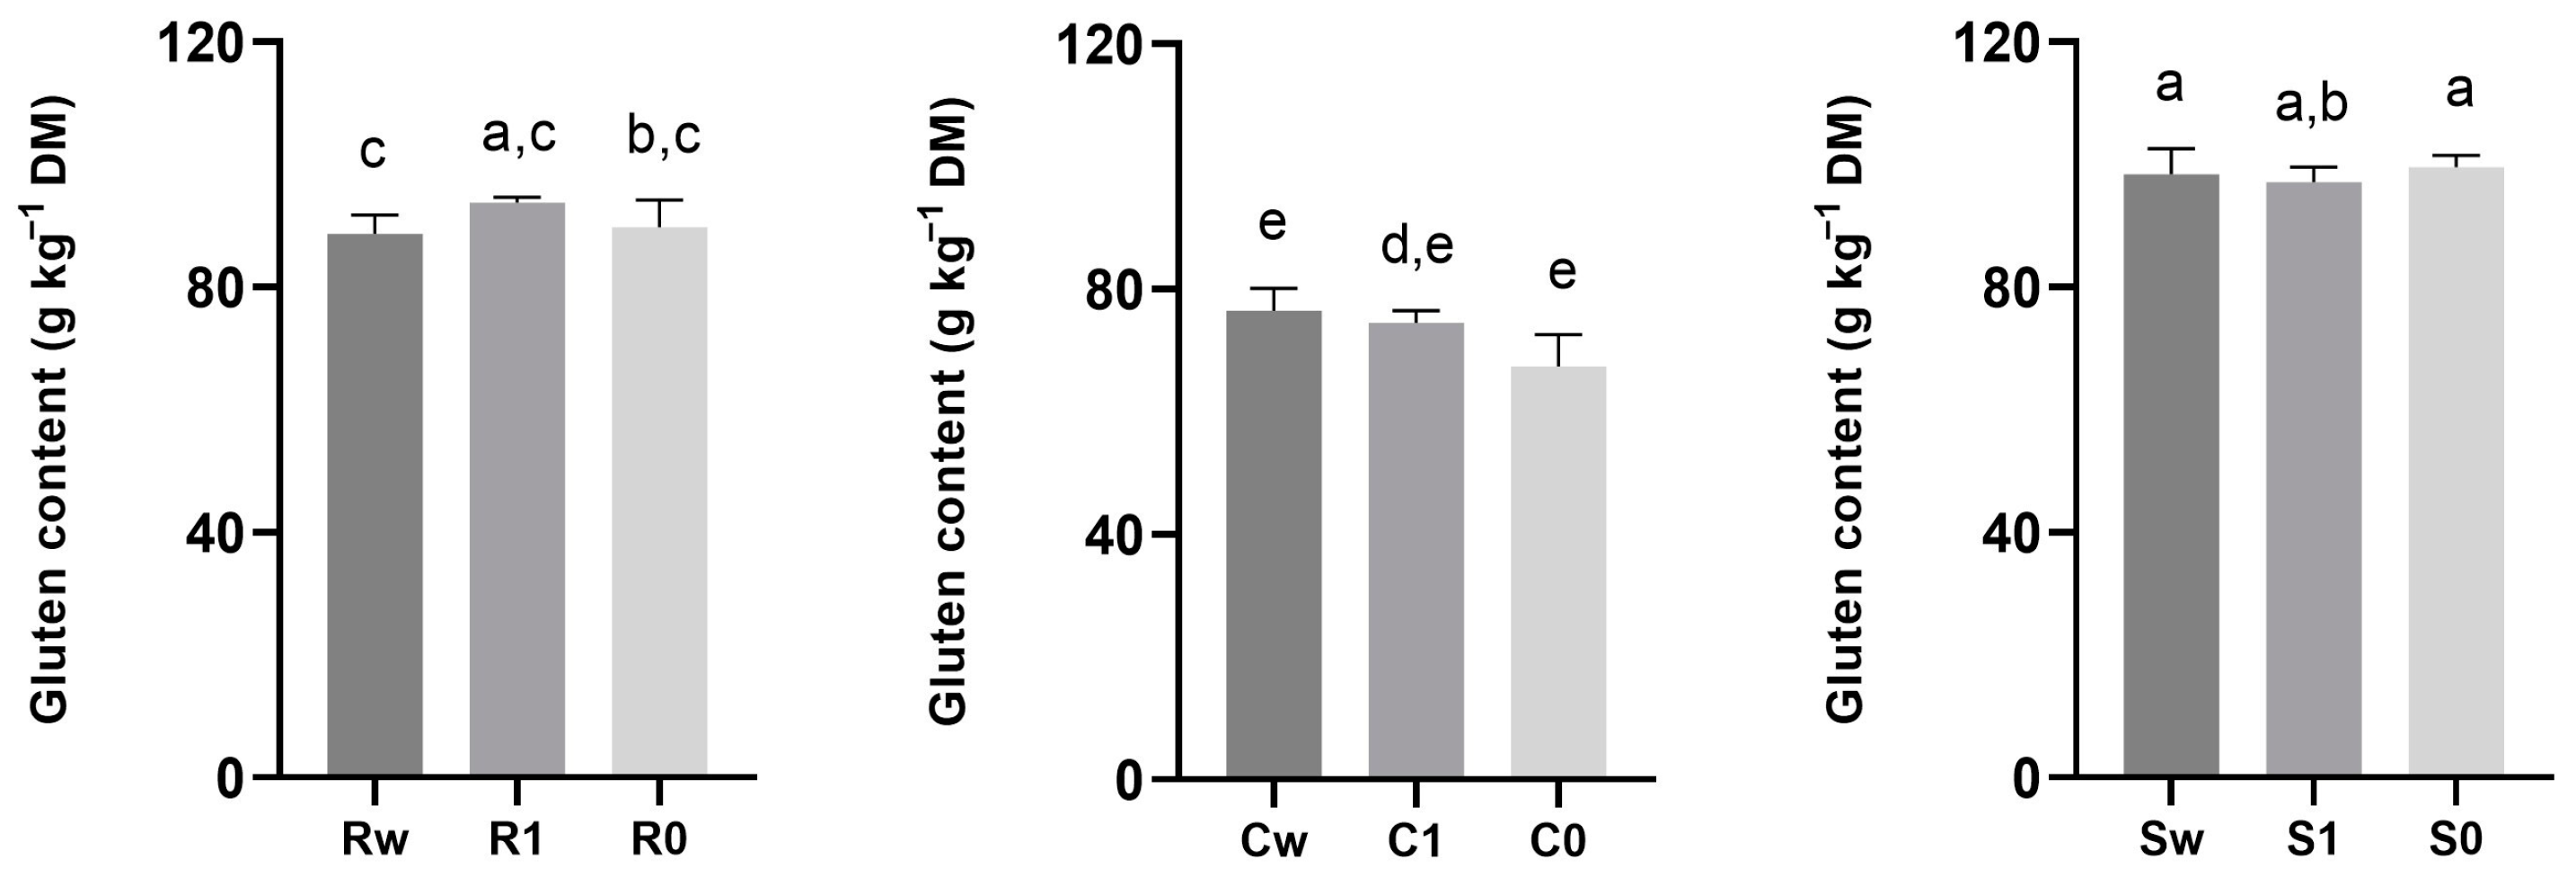
3.6. Quality Traits Assessment
3.7. Microbiological Analysis
4. Conclusions
Author Contributions
Funding
Data Availability Statement
Conflicts of Interest
References
- Călinoiu, L.F.; Vodnar, D.C. Whole grains and phenolic acids: A review on bioactivity, functionality, health benefits and bioavailability. Nutrients 2018, 10, 1615. [Google Scholar] [CrossRef] [PubMed]
- de Sousa, T.; Ribeiro, M.; Sabença, C.; Igrejas, G. The 10,000-year success story of wheat! Foods 2021, 10, 2124. [Google Scholar] [CrossRef] [PubMed]
- Food and Agricultural Organization of the United Nations (FAO). Cereal Supply and Demand Brief. In FAO Cereal Supply and Demand Situation; Food and Agricultural Organization: Rome, Italy, 2016; Available online: https://www.fao.org/worldfoodsituation/csdb/en/ (accessed on 22 September 2023).
- Dinu, M.; Whittaker, A.; Pagliai, G.; Benedettelli, S.; Sofi, F. Ancient wheat species and human health: Biochemical and clinical implications. J. Nutr. Biochem. 2018, 52, 1–9. [Google Scholar] [CrossRef]
- Campbell, G.M. Roller Milling of Wheat. In Handbook of Powder Technology; Salman, A.D., Ghadiri, M., Hounslow, M.J., Eds.; Elsevier Science BV: Amsterdam, The Netherlands, 2007; Volume 12, pp. 383–419. ISBN 9780444530806. [Google Scholar]
- Cappelli, A.; Oliva, N.; Cini, E. Stone milling versus roller milling: A systematic review of the effects on wheat flour quality, dough rheology, and bread characteristics. Trends Food Sci. Technol. 2020, 97, 147–155. [Google Scholar] [CrossRef]
- Doblado-Maldonado, A.F.; Pike, O.A.; Sweley, J.C.; Rose, D.J. Key issues and challenges in whole wheat flour milling and storage. J. Cereal Sci. 2012, 56, 119–126. [Google Scholar] [CrossRef]
- Decreto del Presidente Della Repubblica 9 Febbraio 2001, n. 187. Regolamento per la Revisione Della Normativa Sulla Produzione e Commercializzazione di Sfarinati e Paste Alimentari, a Norma Dell’articolo 50 Della Legge 22 Febbraio 1994, n. 146. (GU Serie Generale n.117 del 22-05-2001). Available online: https://www.gazzettaufficiale.it/atto/serie_generale/caricaDettaglioAtto/originario?atto.dataPubblicazioneGazzetta=2001-05-22&atto.codiceRedazionale=001A5636&elenco30giorni=false (accessed on 31 August 2023).
- Majzoobi, M.; Jafarzadeh, S.; Teimouri, S.; Ghasemlou, M.; Hadidi, M.; Brennan, C.S. The Role of Ancient Grains in Alleviating Hunger and Malnutrition. Foods 2023, 12, 2213. [Google Scholar] [CrossRef] [PubMed]
- Boukid, F.; Folloni, S.; Sforza, S.; Vittadini, E.; Prandi, B. Current Trends in Ancient Grains-Based Foodstuffs: Insights into Nutritional Aspects and Technological Applications. Compr. Rev. Food Sci. Food Saf. 2017, 17, 123–136. [Google Scholar] [CrossRef]
- Morrison, L.A.; Wrigley, C.W. Taxonomic classification of grain species. In Encyclopedia of Grain Science; Elsevier: Oxford, UK, 2004; pp. 271–280. [Google Scholar]
- Spisni, E.; Imbesi, V.; Giovanardi, E.; Petrocelli, G.; Alvisi, P.; Valerii, M.C. Differential Physiological Responses Elicited by Ancient and Heritage Wheat Cultivars Compared to Modern Ones. Nutrients 2019, 11, 2879. [Google Scholar] [CrossRef] [PubMed]
- Mefleh, M.; Conte, P.; Fadda, C.; Giunta, F.; Piga, A.; Hassounc, G.; Motzoa, R. From ancient to old and modern durum wheat varieties: Interaction among cultivar traits, management, and technological quality. J. Sci. Food Agric. 2018, 99, 2059–2067. [Google Scholar] [CrossRef]
- Arzani, A.; Ashraf, M. Cultivated Ancient Wheats (Triticum spp.): A Potential Source of Health-Beneficial Food Products. Compr. Rev. Food Sci. Food Saf. 2017, 16, 477–488. [Google Scholar] [CrossRef]
- Seidita, A.; Mansueto, P.; Giuliano, A.; Chiavetta, M.; Mandreucci, F.; Soresi, M.; Pistone, M.; Compagnoni, S.; Castellucci, D.; Bisso, G.; et al. Potential tolerability of ancient grains in non-celiac wheat sensitivity patients: A preliminary evaluation. Front. Med. 2022, 9, 995019. [Google Scholar] [CrossRef] [PubMed]
- Golea, C.M.; Stroe, S.-G.; Gâtlan, A.-M.; Codină, G.G. Physicochemical Characteristics and Microstructure of Ancient and Common Wheat Grains Cultivated in Romania. Plants 2023, 12, 2138. [Google Scholar] [CrossRef] [PubMed]
- Basile, G.; De Maio, A.C.; Catalano, A.; Ceramella, J.; Iacopetta, D.; Bonofiglio, D.; Saturnino, C.; Sinicropi, M.S. Ancient Wheat as Promising Nutraceuticals for the Prevention of Chronic and Degenerative Diseases. Curr. Med. Chem. 2023, 30, 3384–3403. [Google Scholar] [CrossRef]
- Marrelli, M.; Sprovieri, P.; Conforti, F.; Statti, G. Phytochemical Content and Antioxidant Activity of Ancient Majorca and Carosella (Triticum aestivum L.) Wheat Flours. Agronomy 2021, 11, 1217. [Google Scholar] [CrossRef]
- Reale, A.; Messia, M.C.; Pulvento, C.; Lavini, A.; Nazzaro, S.; Di Renzo, T. Microbial and Qualitative Traits of Quinoa and Amaranth Seeds from Experimental Fields in Southern Italy. Foods 2023, 12, 1866. [Google Scholar] [CrossRef] [PubMed]
- Santagata, G.; Di Renzo, T.; Mallardo, S.; Reale, A.; Cascone, G.; Boscaino, F.; Volpe, M.G. Innovative technologies optimizing the production process of “Castagne del Prete”: Impact on microstructure and volatile compounds. LWT 2022, 168, 113881. [Google Scholar]
- AACC International. Approved Methods of Analysis, 10th ed.; American Association of Cereal Chemists International: St. Paul, MN, USA, 2000. [Google Scholar]
- Lee, S.C.; Prosky, L.; De Vries, J.W. Determination of Total, Soluble, and Insoluble Dietary Fiber in Foods—Enzymatic-Gravimetric Method, MES-TRIS Buffer: Collaborative Study. J. Assoc. Off. Anal. Chem. 1992, 75, 395–416. [Google Scholar] [CrossRef]
- Prosky, L.; Asp, N.G.; Schweizer, T.F.; DeVries, J.W.; Furda, I. Determination of Insoluble, Soluble, and Total Dietary Fiber in Foods and Food Products: Interlaboratory Study. J. Assoc. Off. Anal. Chem. 1988, 71, 1017–1023. [Google Scholar] [CrossRef]
- Prosky, L.; Asp, N.G.; Schweizer, T.F.; DeVries, J.W.; Furda, I. Determination of Insoluble and Soluble Dietary Fiber in Foods and Food Products: Collaborative Study. J. Assoc. Off. Anal. Chem. 1992, 75, 360–367. [Google Scholar] [CrossRef]
- Cascone, G.; Crescente, G.; Sorrentino, A.; Volpe, M.G.; Moccia, S. Physicochemical characterization of a functional chestnut sweet cream enriched with carotenoids and fiber. LWT 2023, 177, 114583. [Google Scholar] [CrossRef]
- Hoyos-Leyva, J.D.; Bello-Pérez, L.A.; Agama-Acevedo, E.; Alvarez-Ramirez, J. Optimising the heat moisture treatment of Morado banana starch by response surface analysis. Starch-Stärke 2015, 67, 1026–1034. [Google Scholar] [CrossRef]
- Ficco, D.B.M.; Muccilli, S.; Padalino, L.; Giannone, V.; Lecce, L.; Giovanniello, V.; Del Nobile, M.A.; De Vita, P.; Spina, A. Durum wheat breads ‘high in fibre’ and with reduced in vitro glycaemic response obtained by partial semolina replacement with minor cereals and pulses. J. Food Sci. Technol. 2018, 55, 4458–4467. [Google Scholar] [CrossRef] [PubMed]
- Goñi, I.; Garcia-Alonso, A.; Saura-Calixto, F. A starch hydrolysis procedure to estimate glycemic index. Nutr. Res. 1997, 17, 427–437. [Google Scholar] [CrossRef]
- Maibam, B.D.; Chakraborty, S.; Nickhil, C.; Deka, S.C. Effect of Euryale ferox seed shell extract addition on the in vitro starch digestibility and predicted glycemic index of wheat-based bread. Int. J. Biol. Macromol. 2023, 226, 1066–1078. [Google Scholar] [CrossRef] [PubMed]
- ICC Standards: Standard Methods of the International Association for Cereal Science and Technology (ICC); ICC: Vienna, Austria, 1996.
- Reale, A.; Di Renzo, T.; Succi, M.; Tremonte, P.; Coppola, R.; Sorrentino, E. Microbiological and Fermentative Properties of Baker’s Yeast Starter Used in Breadmaking. J. Food Sci. 2013, 78, M1224–M1231. [Google Scholar] [CrossRef] [PubMed]
- Gunarathne, R.; Marikkar, N.; Yalegama, C.; Mendis, E. FTIR spectral analysis combined with chemometrics in evaluation of composite mixtures of coconut testa flour and wheat flour. J. Food Meas. Charact. 2022, 16, 1796–1806. [Google Scholar] [CrossRef]
- Esposito, T.; Paolucci, M.; Sansone, F.; Mencherini, T.; Pacifico, S.; Volpe, M.G. Exploitation and Valorization of Agro-Food Wastes from Grape Harvesting: Production, Characterization of MAE-Extracts from Vitis vinifera Leaves and Stabilization in Microparticulate Powder Form. Appl. Sci. 2021, 11, 5827. [Google Scholar] [CrossRef]
- Ramashia, S.E.; Gwata, E.T.; Meddows-Taylor, S.; Anyasi, T.A.; Jideani, A.I.O. Some physical and functional properties of finger millet (Eleusine coracana) obtained in sub-Saharan Africa. Food Res. Int. 2018, 104, 110–118. [Google Scholar] [CrossRef]
- Blanco, A.; Colasuonno, P.; Gadaleta, A.; Mangini, G.; Schiavulli, A.; Simeone, R.; Digesù, A.M.; De Vita, P.; Mastrangelo, A.M.; Cattivelli, L. Quantitative trait loci for yellow pigment concentration and individual carotenoid compounds in durum wheat. J. Cereal Sci. 2011, 54, 255–264. [Google Scholar] [CrossRef]
- Hidalgo, A.; Fongaro, L.; Brandolini, A. Colour screening of whole meal flours and discrimination of seven Triticum subspecies. J. Cereal Sci. 2017, 77, 9–16. [Google Scholar] [CrossRef]
- Cardoso, R.V.C.; Fernandes, Â.; Heleno, S.A.; Rodrigues, P.; Gonzaléz-Paramás, A.M.; Barros, L.; Ferreira, I.C.F.R. Physicochemical characterization and microbiology of wheat and rye flours. Food Chem. 2019, 280, 123–129. [Google Scholar] [CrossRef]
- Escobedo-Avellaneda, Z.; Rodríguez-Martínez, V.; Serment-Moreno, V.; Velázquez, G.; Welti-Chanes, J.; Torres, J.A. Selected Applications of Water Activity Management in the Food Industry. In Water Activity in Foods: Fundamentals and Applications, 2nd ed.; Barbosa-Cánovas, G.V., Fontana, A.J., Jr., Schmidt, S.J., Labuza, T.P., Eds.; Wiley: Hoboken, NJ, USA, 2020; pp. 465–482. [Google Scholar]
- López-Malo, A.; Alzamora, S.M. Water Activity and Microorganism Control: Past and Future. In Water Stress in Biological, Chemical, Pharmaceutical and Food Systems; Gutiérrez-López, G.F., Alamilla-Beltrán, L., del Pilar Buera, M., Welti-Chanes, J., Parada-Arias, E., Barbosa-Cánovas, G.V., Eds.; Springer: New York, NY, USA, 2015; pp. 245–262. [Google Scholar]
- Best, I.; Portugal, A.; Casimiro-Gonzales, S.; Aguilar, L.; Ramos-Escudero, F.; Honorio, Z.; Rojas-Villa, N.; Benavente, C.; Muñoz, A.M. Physicochemical and Rheological Characteristics of Commercial and Monovarietal Wheat Flours from Peru. Foods 2023, 12, 1789. [Google Scholar] [CrossRef] [PubMed]
- David, O.; Arthur, E.; Kwadwo, S.O.; Badu, E.; Sakyi, P. Proximate Composition and Some Functional Properties of Soft Wheat Flour. Int. J. Innov. Res. Sci. Eng. Technol. 2015, 4, 753–758. [Google Scholar]
- Kaur, A.; Singh, N.; Kaur, S.; Ahlawat, A.K.; Singh, A.M. Relationships of flour solvent retention capacity, secondary structure and rheological properties with the cookie making characteristics of wheat cultivars. Food Chem. 2014, 158, 48–55. [Google Scholar] [CrossRef] [PubMed]
- Singh, S.; Singh, N. Relationship of polymeric proteins and empirical dough rheology with dynamic rheology of dough and gluten from different wheat varieties. Food Hydrocoll. 2013, 33, 342–348. [Google Scholar] [CrossRef]
- Cornell, H.J. The chemistry and biochemistry of wheat. In Breadmaking; Woodhead Publishing Ltd.: Cambridge, UK, 2012; pp. 35–76. [Google Scholar]
- Kaplan Evlice, A.; Pehlivan, A.; Keçeli, A.; Şanal, T.; Karabak, S.; Zencirci, N.; Yaman, H.M. Nutritional and Technological Aspects of Ancient Wheat. In Ancient Wheats; Springer International Publishing: Cham, Switzerland, 2022; pp. 147–179. [Google Scholar]
- Ntuli, V.; Mekbib, S.B.; Asita, A.; Molebatsi, N.; Makotoko, M.; Chatanga, P. Microbial and Physicochemical Characterization of Maize and Wheat Flour from a Milling Company, Lesotho. Internet J. Food Saf. 2013, 15, 11–19. [Google Scholar]
- Prasadi, V.P.N.; Joye, I.J. Dietary Fibre from Whole Grains and Their Benefits on Metabolic Health. Nutrients 2020, 12, 3045. [Google Scholar]
- Revanappa, S.B.; Salimath, P.V. Phenolic acid profiles and antioxidant activities of different wheat (Triticum aestivum L.) varieties. J. Food Biochem. 2011, 35, 759–775. [Google Scholar] [CrossRef]
- McKee, L.H.; Latner, T.A. Underutilized sources of dietary fiber: A review. Plant Foods Hum. Nutr. 2000, 55, 285–304. [Google Scholar] [CrossRef]
- Melini, V.; Melini, F.; Acquistucci, R. Phenolic Compounds and Bioaccessibility Thereof in Functional Pasta. Antioxidants 2020, 9, 343. [Google Scholar] [CrossRef]
- Rosell, C.M. The Nutritional Enhancement of Wheat Flour. In Bread Making: Improving Quality; Woodhead Publishing Ltd.: Cambridge, UK, 2003; pp. 253–269. ISBN 1-85573-553-9. [Google Scholar]
- Frakolaki, G.; Giannou, V.; Topakas, E.; Tzia, C. Chemical characterization and breadmaking potential of spelt versus wheat flour. J. Cereal Sci. 2018, 79, 50–56. [Google Scholar] [CrossRef]
- Van Hung, P.; Maeda, T.; Morita, N. Waxy and high-amylose wheat starches and flours—Characteristics, functionality and application. Trends Food Sci. Technol. 2006, 17, 448–456. [Google Scholar] [CrossRef]
- Hallström, E.; Sestili, F.; Lafiandra, D.; Björck, I.; Östman, E. A novel wheat variety with elevated content of amylose increases resistant starch formation and may beneficially influence glycaemia in healthy subjects. Food Nutr. Res. 2011, 55, 7074. [Google Scholar] [CrossRef] [PubMed]
- Cano, A.; Jiménez, A.; Cháfer, M.; Gónzalez, C.; Chiralt, A. Effect of amylose: Amylopectin ratio and rice bran addition on starch films properties. Carbohydr. Polym. 2014, 111, 543–555. [Google Scholar] [CrossRef] [PubMed]
- Emide, D.; Magni, C.; Saitta, F.; Cardone, G.; Botticella, E.; Fessas, D.; Iametti, S.; Lafiandra, D.; Sestili, F.; Marti, A.; et al. Molecular insights into the role of amylose/amylopectin ratio on gluten protein organization. Food Chem. 2023, 404, 134675. [Google Scholar] [CrossRef] [PubMed]
- Valková, V.; Ďúranová, H.; Bilčíková, J.; Žofajová, A.; Havrlentová, M. The content and quality of starch in different wheat varieties growing in experimental conditions. J. Microbiol. Biotechnol. Food Sci. 2021, 2021, 462–466. [Google Scholar] [CrossRef]
- Murugadass, G.; Dipnaik, K. Preliminary study of ratio of amylose and amylopectin as indicators of glycemic index and in vitro enzymatic hydrolysis of rice and wheat starches. Int. J. Res. Med. Sci. 2018, 6, 3095. [Google Scholar] [CrossRef]
- Imanningsih, N. Gelatinisation profile of several flour formulations for estimating cooking behaviour. J. Nutr. Food Res. 2012, 35, 13–22. [Google Scholar]
- Singh, S.; Singh, N.; Isono, N.; Noda, T. Relationship of Granule Size Distribution and Amylopectin Structure with Pasting, Thermal, and Retrogradation Properties in Wheat Starch. J. Agric. Food Chem. 2010, 58, 1180–1188. [Google Scholar] [CrossRef]
- Morales-Guerrero, J.C.; Rosas-Romero, R.; Mariscal-Gálvez, M.A.; Ayala-Alcántara, F.; Bourges-Rodríguez, H. Glycemic Index and Glycemic Load of Two Dishes Cooked with Alache (Anoda cristata) and Chaya (Cnidoscolus aconitifolius) Plants from the Traditional Mexican Diet. J. Med. Food 2023, 26, 416–421. [Google Scholar] [CrossRef]
- Dipnaik, K.; Kokare, P. Ratio of Amylose and Amylopectin as indicators of glycaemic index and in vitro enzymatic hydrolysis of starches of long, medium and short grain rice. Int. J. Res. Med. Sci. 2017, 5, 4502–4505. [Google Scholar] [CrossRef]
- Kaur, H.; Gill, B.S.; Karwasra, B.L. In vitro digestibility, pasting, and structural properties of starches from different cereals. Int. J. Food Prop. 2018, 21, 70–85. [Google Scholar] [CrossRef]
- Soong, Y.Y.; Quek, R.Y.C.; Henry, C.J. Glycemic potency of muffins made with wheat, rice, corn, oat and barley flours: A comparative study between in vivo and in vitro. Eur. J. Nutr. 2015, 54, 1281–1285. [Google Scholar] [CrossRef] [PubMed]
- Tosi, P.; Parker, M.; Gritsch, C.S.; Carzaniga, R.; Martin, B.; Shewry, P.R. Trafficking of storage proteins in developing grain of wheat. J. Exp. Bot. 2009, 60, 979–991. [Google Scholar] [CrossRef]
- Cubadda, R.; Carcea, M.; Pasqui, L.A. Suitability of the gluten index method for assessing gluten strength in durum wheat and semolina. Cereal Foods World 1992, 37, 866–869. [Google Scholar]
- Giunta, F.; Bassu, S.; Mefleh, M.; Motzo, R. Is the Technological Quality of Old Durum Wheat Cultivars Superior to That of Modern Ones When Exposed to Moderately High Temperatures during Grain Filling? Foods 2020, 9, 778. [Google Scholar] [CrossRef]
- Barrera, G.N.; Ribotta, P.D.; Pérez, E.; Pérez, G.T.; León, A.E. Influence of amylases on the rheological properties of wheat flour with partially damaged starch. Conf. Latinoam. ICC 2007, 1, 131. [Google Scholar]
- Laca, A.; Mousia, Z.; Dıaz, M.; Webb, C.; Pandiella, S.S. Distribution of microbial contamination within cereal grains. J. Food Eng. 2006, 72, 332–338. [Google Scholar] [CrossRef]
- Alfonso, A.; Ventimiglia, G.; Corona, O.; Di Gerlando, R.; Gaglio, R.; Francesca, N.; Moschetti, G.; Settanni, L. Diversity and technological potential of lactic acid bacteria of wheat flours. Food Microbiol. 2013, 36, 343–354. [Google Scholar] [CrossRef]
- Zhao, J.; Liu, X.; Wang, F. DON reduction of wheat grain without compromising the lab-scale milling properties of flour. Grain Oil Sci. Technol. 2019, 2, 62–66. [Google Scholar] [CrossRef]
- Berghofer, L.K.; Hocking, A.D.; Miskelly, D.; Jansson, E. Microbiology of wheat and flour milling in Australia. Int. J. Food Microbiol. 2003, 85, 137–149. [Google Scholar] [CrossRef] [PubMed]
- Qi, Y.; Yang, Y.; Hassane Hamadou, A.; Li, B.; Xu, B. Gentle debranning as a technology to reduce microbial and deoxynivalenol levels in common wheat (Triticum aestivum L.) and its application in milling industry. J. Cereal Sci. 2022, 107, 103518. [Google Scholar] [CrossRef]
- Iurlina, M.O.; Saiz, A.I.; Fuselli, S.R.; Fritz, R. Prevalence of Bacillus spp. in different food products collected in Argentina. LWT 2006, 39, 105–110. [Google Scholar] [CrossRef]
- Fangio, M.F.; Roura, S.I.; Fritz, R. Isolation and Identification of Bacillus spp. and Related Genera from Different Starchy Foods. J. Food Sci. 2010, 75, M218–M221. [Google Scholar] [CrossRef]
- Eglezos, S. Microbiological Quality of Wheat Grain and Flour from Two Mills in Queensland, Australia. J. Food Prot. 2010, 73, 1533–1536. [Google Scholar] [CrossRef]
- European Commission. Commission Regulation (EC) No 2073/2005 of 15 November 2005 on microbiological criteria for foodstuffs. Off. J. Eur. Union 2005, 50, 1–26. [Google Scholar]

| (a) | ||||
|---|---|---|---|---|
| Material | Interclass Distance | |||
| Saragolla | Risciola | Carosella | ||
| Risciola | - | - | 2.20 | |
| Saragolla | - | 2.14 | 3.22 | |
| (b) | ||||
| Material | Recognition Rate (%) | Rejection Rate (%) | ||
| Risciola | 100 (7/7) | 69 (9/13) | ||
| Carosella | 100 (7/7) | 76 (10/13) | ||
| Saragolla | 100 (6/6) | 42 (6/14) | ||
| Sample | Colorimetric Indices | pH | aw | ||||
|---|---|---|---|---|---|---|---|
| L* | a* | b* | C* | h* | |||
| Rw | 67.86 ± 0.36 d | 0.54 ± 0.04 b | 8.39 ± 0.12 f | 8.41 ± 0.13 | 85.72 ± 0.65 i | 6.05 ± 0.04 a | 0.467 ± 0.005 b |
| R1 | 68.91 ± 0.31 c | 0.28 ± 0.04 c | 8.61 ± 0.03 e | 8.61 ± 0.03 d | 88.30 ± 0.14 g | 6.08 ± 0.01 a | 0.476 ± 0.008 b |
| R0 | 69.04 ± 0.14 c | 0.17 ± 0.03 d | 9.01 ± 0.08 d | 9.01 ± 0.08 e | 88.96 ± 0.15 f | 6.07 ± 0.02 a | 0.486 ± 0.007 a,b |
| Cw | 70.51 ± 0.21 b | −0.22 ± 0.01 e | 7.82 ± 0.02 g | 7.83 ± 0.02 b | 91.54 ± 0.05 d | 6.07 ± 0.04 a | 0.510 ± 0.002 a |
| C1 | 70.58 ± 0.52 b | −0.27 ± 0.03 f | 7.70 ± 0.08 h | 7.70 ± 0.08 a | 91.96 ± 0.13 b | 6.09 ± 0.01 a | 0.511 ± 0.011 a |
| C0 | 71.29 ± 0.16 a | −0.39 ± 0.02 g | 7.57 ± 0.09 h | 7.57 ± 0.09 a | 92.86 ± 0.17 a | 6.12 ± 0.05 a | 0.513 ± 0.002 a |
| Sw | 61.26 ± 0.15 g | 0.77 ± 0.12 a | 17.30 ± 0.28 a | 17.30 ± 0.28 h | 87.48 ± 0.42 h | 6.10 ± 0.02 a | 0.466 ± 0.008 b |
| S1 | 63.59 ± 0.24 f | 0.16 ± 0.05 d | 15.72 ± 0.18 b | 15.72 ± 0.18 g | 89.48 ± 0.18 e | 6.11 ± 0.02 a | 0.485 ± 0.011 a,b |
| S0 | 66.18 ± 0.12 e | −0.47 ± 0.01 h | 15.00 ± 0.05 c | 15.00 ± 0.05 f | 91.74± 0.05 c | 6.13 ± 0.04 a | 0.493 ± 0.006 a,b |
| Sample | Moisture (%) | Ash (%) | Lipid (%) | Protein (%) | TDF (%) | SDF (%) | IDF (%) | Carbohydrates (%) |
|---|---|---|---|---|---|---|---|---|
| Rw | 10.62 ± 0.07 | 2.04 ± 0.05 | 2.35 ± 0.04 * | 10.18 ± 0.01 | 13.20 ± 0.01 ** | 1.46 ± 0.04 | 11.68 ± 0.05 ** | 61.61 ± 0.10 * |
| R1 | 11.20 ± 0.08 | 1.73 ± 0.04 | 1.46 ± 0.05 | 10.54 ± 0.03 | 8.36 ± 0.00 | 2.16 ± 0.04 * | 6.35 ± 0.00 * | 66.71 ± 0.11 |
| R0 | 11.46 ± 0.03 | 1.63 ± 0.02 | 1.18 ± 0.00 | 10.38 ± 0.04 | 8.13 ± 0.02 | 1.44 ± 0.02 | 6.85 ± 0.01 | 67.22 ± 0.06 |
| Cw | 11.59 ± 0.06 * | 1.20 ± 0.08 | 2.26 ± 0.02 * | 8.14 ± 0.05 | 11.92 ± 0.06 ** | 1.48 ± 0.03 | 10.88 ± 0.07 ** | 64.89 ± 0.13 ** |
| C1 | 12.64 ± 0.00 | 1.18 ± 0.07 | 1.88 ± 0.02 | 8.96 ± 0.05 * | 5.98 ± 0.06 | 1.37 ± 0.03 | 4.36 ± 0.02 ** | 69.36 ± 0.11 |
| C0 | 12.71 ± 0.01 | 1.04 ± 0.00 | 1.00 ± 0.07 | 8.06 ± 0.01 | 6.41 ± 0.02 | 1.36 ± 0.02 | 5.05 ± 0.01 | 70.78 ± 0.07 |
| Sw | 11.08 ± 0.01 | 1.96 ± 0.01 | 2.63 ± 0.01 ** | 9.58 ± 0.02 | 10.72 ± 0.01 ** | 2.64 ± 0.04 * | 8.08 ± 0.02 ** | 64.03 ± 0.03 * |
| S1 | 11.03 ± 0.05 | 1.83 ± 0.03 | 1.61 ± 0.01 * | 9.66 ± 0.05 | 6.14 ± 0.01 | 2.35 ± 0.03 | 3.98 ± 0.07 * | 69.73 ± 0.08 |
| S0 | 11.13 ± 0.05 | 1.73 ± 0.03 | 1.12 ± 0.03 | 9.71 ± 0.01 | 5.84 ± 0.02 | 2.92 ± 0.06 | 3.07 ± 0.04 | 70.47 ± 0.07 |
| Sample | Amylose/Amylopectin Ratio |
|---|---|
| Rw | 0.294 ± 0.009 |
| R1 | 0.286 ± 0.004 |
| R0 | 0.269 ± 0.002 |
| Cw | 0.265 ± 0.004 |
| C1 | 0.264 ± 0.003 |
| C0 | 0.260 ± 0.000 |
| Sw | 0.315 ± 0.000 |
| S1 | 0.320 ± 0.002 |
| S0 | 0.301 ± 0.000 |
| Sample | pGI |
|---|---|
| Rw | 53.316 ± 0.075 |
| R1 | 53.811 ± 0.124 |
| R0 | 54.900 ± 0.259 |
| Cw | 53.726 ± 0.110 ** |
| C1 | 53.598 ± 0.086 * |
| C0 | 59.412 ± 0.026 |
| Sw | 52.208 ± 0.128 |
| S1 | 52.414 ± 0.079 * |
| S0 | 53.837 ± 0.001 |
| Sample | Water Absorption (%) | Development Time (min) | Farinograph Stability (min) | Farinograph Softening Degree (FU) |
|---|---|---|---|---|
| Rw | 66.00 ± 0.20 a | 2.10 ± 0.40 ab | 2.00 ± 0.00 ab | 132.00 ± 1.00 c |
| R1 | 63.80 ± 0.20 b | 1.80 ± 0.00 ab | 1.60 ± 0.20 b | 138.00 ± 0.00 bc |
| R0 | 64.90 ± 0.10 ab | 1.80 ± 0.20 ab | 2.00 ± 0.07 b | 141.50 ± 1.50 ab |
| Cw | 57.10 ± 0.10 d | 2.50 ± 0.20 a | 3.10 ± 0.00 a | 104.00 ± 1.00 d |
| C1 | 56.70 ± 0.20 d | 1.20 ± 0.00 b | 2.80 ± 0.20 ab | 107.00 ± 0.00 d |
| C0 | 54.70 ± 0.20 e | 1.50 ± 0.10 ab | 2.80 ± 0.10 ab | 108.00 ± 1.00 d |
| Sw | 59.40 ± 0.40 c | 2.60 ± 0.20 a | 2.50 ± 0.10 ab | 96.00 ± 1.00 e |
| S1 | 58.60 ± 0.20 c | 2.15 ± 0.15 ab | 2.50 ± 0.10 ab | 108.00 ± 2.00 d |
| S0 | 56.80 ± 0.40 d | 1.70 ± 0.20 ab | 1.95 ± 0.05 ab | 147.00 ± 1.00 a |
| Sample | Total Mesophilic Count | Presumptive Lactobacilli | Salmonella spp. | Yeasts | Molds | Presumptive B. cereus | Enterobacteriaceae | Fecal Coliforms | Total Coliforms |
|---|---|---|---|---|---|---|---|---|---|
| Rw | 4.91 b | 2.87 a,b | Absent | 1.61 b | 3.60 c | 2.00 b | 2.41 a | 2.49 b | 2.76 b |
| R1 | 4.58 c | 2.65 c | Absent | <1.00 | 2.70 e | <1.00 | 1.51 c | 1.85 d,e | 2.00 d |
| R0 | 4.06 d | 2.48 c | Absent | <1.00 | 2.30 f | <1.00 | <1.00 | 1.83 e | 1.91 d |
| Cw | 4.01 d | 2.78 b | Absent | 1.74 b | 3.00 d | 2.00 b | 2.00 b | 1.83 e | 2.30 c |
| C1 | 3.75 e | 2.68 b,c | Absent | <1.00 | 4.00 b | <1.00 | 1.32 d | 1.72 e | 2.30 c |
| C0 | 3.73 e | 2.57 c | Absent | <1.00 | 2.95 d | <1.00 | <1.00 | 1.48 f | 1.97 d |
| Sw | 5.35 a | 3.00 a | Absent | 2.03 a | 4.70 a | 2.55 a | 2.99 a | 3.19 a | 3.95 a |
| S1 | 5.03 b | 2.92 a | Absent | <1.00 | 4.08 b | <1.00 | 1.65 c | 2.00 c | 2.00 d |
| S0 | 4.90 b | 2.75 b | Absent | <1.00 | 3.00 d | <1.00 | <1.00 | 1.85 d,e | 2.00 d |
Disclaimer/Publisher’s Note: The statements, opinions and data contained in all publications are solely those of the individual author(s) and contributor(s) and not of MDPI and/or the editor(s). MDPI and/or the editor(s) disclaim responsibility for any injury to people or property resulting from any ideas, methods, instructions or products referred to in the content. |
© 2023 by the authors. Licensee MDPI, Basel, Switzerland. This article is an open access article distributed under the terms and conditions of the Creative Commons Attribution (CC BY) license (https://creativecommons.org/licenses/by/4.0/).
Share and Cite
Di Renzo, T.; Cascone, G.; Crescente, G.; Reale, A.; Menga, V.; D’Apolito, M.; Nazzaro, S.; Volpe, M.G.; Moccia, S. Ancient Grain Flours with Different Degrees of Sifting: Advances in Knowledge of Nutritional, Technological, and Microbiological Aspects. Foods 2023, 12, 4096. https://doi.org/10.3390/foods12224096
Di Renzo T, Cascone G, Crescente G, Reale A, Menga V, D’Apolito M, Nazzaro S, Volpe MG, Moccia S. Ancient Grain Flours with Different Degrees of Sifting: Advances in Knowledge of Nutritional, Technological, and Microbiological Aspects. Foods. 2023; 12(22):4096. https://doi.org/10.3390/foods12224096
Chicago/Turabian StyleDi Renzo, Tiziana, Giovanni Cascone, Giuseppina Crescente, Anna Reale, Valeria Menga, Maria D’Apolito, Stefania Nazzaro, Maria Grazia Volpe, and Stefania Moccia. 2023. "Ancient Grain Flours with Different Degrees of Sifting: Advances in Knowledge of Nutritional, Technological, and Microbiological Aspects" Foods 12, no. 22: 4096. https://doi.org/10.3390/foods12224096
APA StyleDi Renzo, T., Cascone, G., Crescente, G., Reale, A., Menga, V., D’Apolito, M., Nazzaro, S., Volpe, M. G., & Moccia, S. (2023). Ancient Grain Flours with Different Degrees of Sifting: Advances in Knowledge of Nutritional, Technological, and Microbiological Aspects. Foods, 12(22), 4096. https://doi.org/10.3390/foods12224096