Article

Use of Cyanobacterium Spirulina (Arthrospira platensis) in Buffalo Feeding: Effect on Mozzarella Cheese Quality

by
Claudia Lambiase
1,
Ada Braghieri
2,
Carmela Maria Assunta Barone
1,
Antonio Di Francia
1,
Corrado Pacelli
2,
Francesco Serrapica
1,*,
Jose Manuel Lorenzo
3,4 and
Giuseppe De Rosa
1
1
Dipartimento di Agraria, Università degli Studi di Napoli Federico II, 80055 Portici, Italy
2
Scuola di Scienze Agrarie, Forestali, Alimentari ed Ambientali, Università degli Studi della Basilicata, 85100 Potenza, Italy
3
Centro Tecnológico de la Carne de Galicia, San Cibrao das Viñas, 32900 Ourense, Spain
4
Área de Tecnología de los Alimentos, Facultad de Ciencias de Ourense, Universidade de Vigo, 32004 Ourense, Spain
*
Author to whom correspondence should be addressed.
Foods 2023, 12(22), 4095; https://doi.org/10.3390/foods12224095
Submission received: 17 October 2023 / Revised: 5 November 2023 / Accepted: 9 November 2023 / Published: 11 November 2023
(This article belongs to the Special Issue Cheese: Chemistry, Physics and Microbiology)

Abstract

:
The high demand for PDO buffalo mozzarella cheese is leading to the use of new strategies for feeding supplementation. Spirulina is acknowledged as a valuable source of protein with antioxidant and immune-modulatory effects in humans and animals. This investigation aimed to examine the effect of Spirulina integration in buffalo diets on mozzarella cheese quality, sensory profile, consumer acceptability, and willingness to pay (WTP). The trial was carried out on two groups of 12 buffaloes that differed in Spirulina integration: 50 g/head/d before calving (1 month) and 100 g/head/d after calving (2 months). Both the bulk milk and mozzarella cheese samples from the two groups did not differ in chemical composition. However, Spirulina inclusion influenced the sensory quality of mozzarella cheese, which resulted it being externally brighter, with a higher butter odour and whey flavour and greater sweetness, bitterness, juiciness, tenderness, oiliness, and buttermilk release than the control. The consumer test showed that information about Spirulina affected consumer liking, causing them to be in favour of the Spirulina group, leading to a higher price for it. In conclusion, Spirulina inclusion in buffalo diets affected the sensory quality of mozzarella cheese. The provision of product information to consumers can be a crucial factor in determining their liking and WTP.

Graphical Abstract

1. Introduction

In recent decades, buffalo breeding and milk production in Italy has been increasing, while in most other European countries, the number of buffaloes has been decreasing due to their use as draught animals, which has been replaced by mechanisation [1,2]. The growing progress of the Italian buffalo population, the nutritional and reproductive techniques, and the high quality of milk and meat products and markets have reached the top level in Europe. Many of the appreciated buffalo products come from milk, such as ricotta, provola, scamorza, and other cheeses, and from meat, such as steaks, roasts, ham, bresaola, and salami, but mozzarella cheese is the most important buffalo product on the Italian and international market (82% of consumption in Italy, and 18% for export, especially in Germany, France, UK, and USA) [1].
Almost all of the buffalo milk produced in Italy (mainly in the southern regions) is transformed into mozzarella cheese, a product of some specific areas of the Campania and Lazio regions that have been endowed with the Protected Designation of Origin (PDO) (Commission Regulation EC 103/2008) [3,4]. Buffalo mozzarella is a “pasta filata cheese”, which is sold very fresh (a few hours after the cheese is made) and is characterised by a soft, moist, and elastic texture, a bright and white porcelain colour, and a fresh flavour. Its sensory profile is influenced by the starter used in the cheesemaking process [5], the technological process [6], and most importantly, the milk composition, which is closely linked to animal feeding [7]. Although many authors have carried out studies on how a different diet can modify the chemical composition, sensory profile, or aromatic compounds of buffalo mozzarella cheese [8,9,10,11], none of them have used a “non-conventional” feed supplement. Recently, as reported in some reviews [12,13,14,15], there has been an increased focus on the impact of microalgae supplementation on the quality and production of milk in ruminants, as well as on the quality of eggs and chicken meat.
Microalgae are prokaryotic and eukaryotic organisms with a rapid growth rate, and they have the ability to grow in challenging environments, such as non-arable or marginal lands, and under different environmental conditions. They can be grown in either open or closed systems, under autotrophic or heterotrophic conditions, and their chemical compositions can be manipulated by changing the growth medium and/or the growth conditions. The species of microalgae with high concentrations of protein can partially replace conventional protein-based feeds, while those with high carbohydrate or lipid concentrations can be used as energy sources [13]. To date, Arthrospira maxima and Arthrospira platensis, both commonly known as Spirulina, are two of the microalgae registered under EU Regulation 767/2009 as feeding ingredients or animal feed [15]. Spirulina is considered one of the most nutritious foods due to its high concentrations of high-quality proteins (55–70% in dry weight, i.e., containing all essential amino acids) and vitamins and minerals such as B vitamins, iron, potassium, and many others. Currently, the effects of Spirulina as a feed supplement on animal health and/or production have been studied in different species, such as swine, poultry, and ruminants [12]. Although most ruminants have been considered in many studies [14,15], little is currently known regarding the performance and production of buffaloes when microalgae are added to their diets [16].
The objective of this study was to examine the impact of adding freeze-dried Arthrospira platensis biomass to the diets of dairy buffaloes on the chemical composition and sensory attributes of PDO mozzarella cheese. Furthermore, we assessed the influence of information regarding Spirulina’s health advantages on consumer acceptability and willingness to pay.

2. Materials and Methods

2.1. Animals, Diets, and Mozzarella Cheese Production

All cows enrolled in this study were handled in compliance with the Italian legislation concerning the protection of animals used for scientific purposes (DL n. 26, 4 March 2014), and all procedures involving animals used in this study were reviewed and approved by the Ethical Animal Care and Use Committee of the University of Napoli Federico II (Prot. 2020/007143 of 8/1/2020).
The trial was conducted on a buffalo dairy farm in the Southern Italian region of Campania (40°48′ N 15°01′ E; 14 m a.s.l.) between March 2021 and July 2021. Twenty-four late pregnant dairy buffaloes (Bubalus bubalis) were blocked for expected calving date and assigned to either a control or experimental group (hereafter referred to as C and S, respectively) balanced for cows’ number (n = 12), parity (3 secondiparous and 9 pluriparous), and milk yield from the previous lactation (2642 ± 503 kg/head and 2729 ± 492 kg/head for C and S, respectively).
The two groups were housed in 2 adjacent free-stall barns (13 × 10 m each) equipped with feed bunks, water troughs, and an outdoor exercise area. The experimental period lasted 120 days in total, including an adaptation period of 30 days before calving and a sampling period covering the early 90 days of lactation. Across the adaptation and sampling periods, all cows were fed the same standard total mixed ration (TMR) formulated to meet or exceed the recommended nutritional requirements for dairy buffaloes in the near dry period and early lactation, as recommended by Bartocci et al. [17] and Campanile et al. [18], respectively. As for the farm routine, both TMRs were offered once a day at 08:00 h, allowing for approximately 10% feed refusal. In the Spirulina group, the freeze-dried Spirulina was top-dressed just after the TMR delivery at a daily dose of 50 g/head until calving and 100 g/head during lactation. Table S1 lists the detailed ingredients and chemical compositions of the experimental TMRs (dry and lactation diets). The used Spirulina biomass (Table 1) was provided by ATI Bio-tech s.r.l. (Castel Baronia, Avellino, Italy). Cultivation was performed through industrial-scale outdoor open raceway ponds by using standard Zarrouk’s culture medium (20 °C; pH 10.25).
From 3 (±1) days of lactation onwards, buffaloes were milked two times a day (05:00 and 17:00 h) in the auto-tandem milking parlour equipped with a pipeline milking system that transports milk to a refrigerated (4 °C) tank.
After the first 30 days of milking, four mozzarella cheese-making sessions between the 2nd and 3rd month of lactation, with 2 sessions per month, were carried out by using refrigerated (4 °C) bulk tank milk that was separately collected at the evening milking session from each group (approximately 60 kg/group per milking). Bulk milk from each group was processed at the dairy farm, in separate vats, following the traditional procedure adopted for the PDO mark (Protected Designation of Origin) detailed by Sacchi et al. [3]. In brief, the raw milk was heated to 37 °C, and natural starter cultures and liquid calf rennet were added. The curd was then broken into small particles (2–3 cm) and left under whey until the pH reached 4.85. At this pH, the curd was manually stretched in water kept at 90–95 °C. Finally, 50 g of mozzarella (spherical shape) were cut mechanically, cooled in water, and left in brine (10% NaCl).

2.2. Measurements, Sampling Procedure, and Analytical Methods

2.2.1. Feeds and Diets

Feed intake was monitored weekly on a group basis along the lactation period by subtracting feed refusals from the TMR offered. On the same days, individual feed and TMR samples were collected, dried in a forced air oven at 65° until a constant weight was reached, and ground to pass through a 1 mm screen to be analysed for the proximate composition according to the standard procedures described elsewhere [19,20].

2.2.2. Milk and Mozzarella Chemical Compositions

Triplicate bulk milk samples (150 mL/group) were collected immediately after milking before each cheese-making session and analysed on the same days of collection in duplicate for protein, fat, and lactose using mid-infrared method (MilkoScan Minor Type 78100, Foss Electric, Hillerød, Denmark). Three mozzarella cheese samples were taken from each production batch the day after manufacturing. Samples were cut in slices and then minced by using a blender (LB20ES, Waring Commercial Blender, New Hartford, CT, USA), and they were separately analysed in duplicate (100 g per replication) for moisture, protein, fat, lactose, and salt contents using FoodScan Lab Analyzer (Foss Electric A/S, Hillerød, Denmark) operating between 2 scanning frequencies (850 and 1048 nm).

2.2.3. Fatty Acids Composition

Fatty acid (FA) profiles of mozzarella cheese (10 g) were performed according to Vargas-Ramella et al. [21]. Fatty acids were transesterified and detected using a gas chromatograph (GC-Agilent 7890B, Agilent Technologies, Santa Clara, CA, USA) equipped with a flame ionisation detector (FID), a PAL RTC-120 autosampler (maintained at 250 °C and 64.2 mL/min of total flow rate), and a DB-23 fused silica capillary column (60 m, 0.25 mm i.d., 0.25 μm film thickness; Agilent Technologies) for the separation of Fatty Acid Methyl Esters (FAMEs). As standard, we used Supelco 37 Component FAME Mix (Sigma-Aldrich, St. Louis, MO, USA). Results were expressed as a percentage of total methylated FA. Values for individual FA < 0.1 were not reported. Atherogenic index (AI), thrombogenic index (TI), and hypocholesterolemic/hypercholesterolemic ratio (h/H) were calculated according to Chen and Liu [22].

2.2.4. Amino Acid Determination

Amino acid (AA) profiles were determined according to the procedure described by Vargas-Ramella et al. [23]. The HPLC system used was an Alliance 2695 model equipped with a 2475 scanning fluorescence detector (Waters, Milford, MA, USA). To control the system operation and results management, an Empower 2TM advanced software (Version 1.04.1037; Waters, Milford, MA, USA) was used. Separations were carried out using a Waters AccQ-Tag column (3.9 × 150 mm, with a 4 mm particle size) with a flow rate of 1.0 mL min−1 at 37 °C. Detection was carried out via fluorescence with excitation at 250 nm and emission at 395 nm. The AAs were quantified using the external standard method using an AA standard (Amino Acid Standard H, Thermo, Rockford, IL, USA) and identified via the retention time. The amount of each AA that was detected was expressed as mg/100 g sample.

2.2.5. Minerals Determination

Initially, a 3 g sample was subjected to incineration at a temperature of 600 °C using a muffle furnace (Car-bolite RWF 1200, Hope Valley, UK). Afterwards, 10 mL of 1 M HNO3 was added, and the sample was further incinerated at 600 °C. Standards were diluted and used to calibrate the IPC-MS for mineral analysis. The incinerated samples were analysed for mineral contents (Ca, Fe, K, Mg, Mn, Na, P, Zn, and Cu) by using inductively coupled plasma mass spectrometry (ICP-MS) (Thermo electron X7 inductively coupled plasma mass spectrometry, Model X series, Oxford, UK). For the calibration of the IPC-MS for mineral analysis, standards were diluted and used. The ICP-MS operating conditions were as follows: nebuliser gas flow, 0.91 L/min; radio frequency (RF), 1200 W; lens voltage, 1.6 V; cold gas, 13.0 L/min; auxiliary gas, 0.70 L/min [24]. Results were expressed as mg/100 g of sample.

2.2.6. Volatile Organic Compound Determination

The volatile organic compound (VOC) extraction was carried out using a solid phase microextraction (SPME) device (Supelco, Bellefonte, PA, USA), including a 10 μm length fused silica fibre coated with a layer (50/30 μm thickness) of divinylbenzene/carboxen/polydimethylsiloxane (DVB/CAR/PDMS), following the procedure described by Echegaray et al. [25]. Briefly, 1 g of minced mozzarella cheese was weighted in a 24 mL glass vial closed with a screw cap equipped with a laminated Teflon–rubber disc. The samples were kept at 35 °C for 15 min, allowing for the equilibration of VOC in the headspace. Then, the fibre, already conditioned at 270 °C for 60 min via heating in a gas chromatograph injection part, was inserted in the headspace of the vials through the septum and exposed to the headspace for 30 min at 35 °C. The splitless mode was used to inject the samples. Helium was used as carrier gas, with a linear velocity of 40 cm s−1. The total run time of 49 min and 30 s was divided as follows: 10 min at 40 °C (isothermal), and then increased to 20 min at 0 °C (5 °C/min), and finally, 250 °C (20 °C/min), maintained for 5 min. Both the injector and detector temperatures were set at 260 °C. The gas chromatograph used for the VOC detection was 6890 N (Agilent Technologies, Santa Clara, CA, USA) equipped with a DB-624 capillary column (30 m, 0.25 mm i.d., 1.4 μm film thickness; J&W Scientific, Folsom, CA, USA) and coupled to a mass selective detector, 5973 N (Agilent Technologies). VOCs (expressed as area units (AUs) × 104 per g of product) were identified by comparing the detected mass spectra with those reported in the NIST05 library (National Institute of Standards and Technology, Gaithersburg, MD, USA) (matching was considered when coincidence was greater than 80%), and/or by comparing the mass spectra and retention times with the authentic standards (Supelco, Bellefonte, PA, USA), and/or by calculating the retention index against a set of standard alkanes (C5-C14) (for calculating Kovats indices, Supelco 44585-U, Bellefonte, PA, USA) and by comparing them with the data reported in the literature.

2.2.7. Colour Evaluation

The colour analysis of mozzarella cheese was performed by implementing a Computer Vision System (CVS), following the method by Girolami et al. [26,27], on the same batch of samples used for the sensory analysis (QDA) before tasting and for each cheese-making session. Briefly, each mozzarella slice was cut in two; one half was used in order to evaluate the inner colour, and the other half was used to evaluate the outer colour of the sample. The images were captured with a digital camera (CANON EOS 450D, 12.2 Megapixel; Canon Inc., Tokyo, Japan) at a distance of 30 cm, in a black wooden box, under four fluorescent lamps at 50 cm from the sample and angled at 45° to ensure uniform light intensity on the sample. The camera was connected to an NEC MultySync LCD monitor with sRGB colour space (standard RGB) and a resolution of 1600 × 1200 pixels. The monitor was calibrated, and the ICC monitor profile was created using the Eye-One Match 3.2 software. The rendering intent used was of perceptive type. Colour evaluation was performed using Adobe Photoshop CS3 software. RGB images were transformed into L*, a*, and b* values after acquisition via RAW photographs. Particularly, three areas of the digital image of each sample were spotted by the cursor, and the colorimetric characteristics were measured.

2.3. Sensory Analyses

Sensory analyses included sensory profile, assessed via quantitative descriptive analysis (QDA) according to Murray et al. [28], consumer liking, and willingness to pay (WTP).

2.3.1. Quantitative Descriptive Analysis (QDA)

To perform QDA, fifteen regular eaters of buffalo mozzarella cheese (i.e., consuming it at least once a week) were enrolled. Among them, ten panellists (5 males and 5 females between 24 and 32 years of age) were chosen according to their capacity to identify the 4 basic tastes [29], as recommended by ISO recommendations (ISO 8586, [30]). A labelled scale with intervals of intensity was used to train panellists on the use of the 100 mm unstructured intensity linear scale (0 = absent; 100 = very high) provided for QDA [31]. In a subsequent session, the assessors tasted the mozzarella cheese samples and, based on specific works in the literature [11,32], they developed and agreed on a vocabulary of attributes (about appearance, odour, taste, flavour, and texture) and their definitions (Table 2). Their subsequent training was performed in individual sensory booths (ISO 8589) [33] by using a specific frame of reference [34] to identify the intensity ranges for low and high intensity for each attribute. Then, panellists tasted the samples again with the two preferences of intensity for each attribute in blind conditions. This training phase was essential to calibrate the performance of the panellists in terms of repeatability, discrimination, and agreement. For the test, two 50 g mozzarella cheese samples for C and S were administered in a randomised order at a temperature of 13 °C. Each sample was identified by a three-digit number code. To avoid the effect of appearance on the perception of odour/flavour, taste, and texture attributes, the assessors evaluated the intensities of these attributes of the first cheese under red light, while the intensities of the appearance parameters were assessed on the second cheese under white, fluorescent lighting. Each product was evaluated in 3 replications. The interval between consecutive samples was roughly 10 min for each product; assessors were recommended to drink a sip of water and to eat a piece of smith apple between two consecutive tastings to reset the effect of the previous sample. The Smart Sensory box 2.3.5 platform was used to manage the QDA sessions (Smart Sensory Solution, Sassari, Italy).

2.3.2. Consumer Test and Willingness to Pay

A total of 68 consumers (42 females and 26 males, from 18 to 60 years old) participated in the test. The reduced number of participants in the consumer trial (68 versus 100) was a consequence of the COVID-19 pandemic, which posed a challenge to recruitment. Consumers among regular eaters of buffalo mozzarella cheese (i.e., consuming this product at least once a week) and who were available over the study period were recruited by phone. The study was conducted in agreement with the guidelines of the Declaration of Helsinki and the Italian ethical requirements on research activities and personal data protection (D.L. 30.6.03 n. 196).
Firstly, they were asked to taste 50 g of mozzarella cheese from both groups (C and S) and rate their liking in blind conditions, that is, they did not receive information on the products (perceived liking, B). For each sample, consumers rated their overall liking and their liking for the appearance, taste/flavour, and texture using a 9-point hedonic scale, where the 9 categories ranged from “dislike extremely” to “like extremely”, with a central point (5) corresponding to “neither liked or disliked” [35,36].
On the same day, in the second test, the subjects received two sheets with information concerning the nutritional quality of mozzarella cheese, and they were asked to carefully read the information and give their liking expectation for that product without tasting the samples (expected liking, E). In detail, the information about the two products was as follows:
  • Information for sample 1—Mozzarella di bufala Campana produced with milk from conventional breeding. “Mozzarella di bufala Campana” is produced exclusively with fresh whole buffalo milk according to the specific disciplinary published in the Italian Official Gazette n. 258 of 6.11.2003. Mozzarella di bufala Campana is porcelain white in colour, has a characteristic and delicate flavour, a fat content of at least 52% (on the dry matter), and a maximum moisture content of 65%.
  • Information for sample 2—Buffalo mozzarella produced with milk from conventional breeding and Spirulina dietary supplement. “Mozzarella di Bufala Campana” is produced exclusively with fresh whole buffalo milk according to the specific disciplinary published in the Italian Official Gazzette n. 258 of 6.11.2003. Mozzarella di bufala campana is porcelain white in colour, has a characteristic and delicate flavour, a fat content of at least 52% (on the dry matter), and a maximum moisture content of 65%. Dietary supplementation with Spirulina (a natural product arising from the freeze-drying of microalgae) makes it possible to obtain a mozzarella with antioxidant, anti-cholesterol, and immune-stimulating properties.
The third test was performed the day after. Consumers received both products (C and S), each accompanied by the corresponding information. They had to read the information before tasting the sample and reporting their liking scores (actual liking, A). For the QDA, tests were performed in a controlled sensory analysis laboratory [37] equipped with individual booths under white fluorescent lighting. Consumers were asked to clean their mouths with some water and to eat a piece of smith apple between each sample evaluation to try to make the palate conditions similar for each sample. Samples, identified by a 3-digit number code, were served in random order. The Smart Sensory box 2.3.5 platform was used to manage the consumer test sessions (Smart Sensory Solution, Sassari, Italy).

2.3.3. Vickrey Auction

After the third test, two 250 g packs of mozzarella (C and S) were auctioned off. A second-price Vickrey auction [38] was performed to assess consumers’ WTP mozzarella cheese produced from buffalo milk fed with Spirulina supplementation, according to Napolitano et al. [39]. A short explanation of the procedure for the auction was given to the participants, and it was clarified that the proposed offers involved a commitment to purchase the product. Participants signed a consent agreement to the procedure and received EUR 10 (in cash). Then, they were formally trained on the use of Vickrey’s second-price auction. Each consumer separately had to write, on a paper, the maximum price to pay for one unit of product evaluated. The winner (i.e., the consumer submitting the highest value) had to purchase the product not at the proposed price, but at the second highest offer submitted. Thus, one of the participants was allowed to purchase a product at an equal or lower price than what they would normally have agreed to pay. In the case of more consumers offering the same highest offer, only one of them, randomly chosen by another consumer, would be selected as the winner. It was also clarified that the aim of the auction was to understand the value that the product had for consumers, and not its commercial value. To verify that all participants correctly understood the procedure, some practice with snacks was carried out. At this point, the test was performed. To prevent the participants from becoming less motivated in winning more products, it was explained that the mozzarella cheese pack would be evaluated under different information conditions, and only one condition, randomly chosen by a consumer, would be used for the actual auction.

2.4. Statistical Analyses

All the data collected were subjected to a Kolmogorov–Smirnov normality test. The chemical composition (i.e., fat, protein, lactose, fatty acid profile, amino acid profile; minerals for both milk and mozzarella; and moisture, salt, VOC, and colour for mozzarella only) was analysed via one-way analysis of variance (ANOVA) (GLM, general linear model), with group as a factor.
To verify panel performance, sensory data from the QDA test were subjected to a “Fixed” ANOVA model with 2 levels as products, 10 levels as assessors, and 3 levels as replications and their interaction (products x assessors, products x replications, and assessors x replications). To evaluate panel performance, we analysed the significance of replication effects and the assessors x products and assessors x replications interactions. The analysis of the product effect enabled us to evaluate the significant differences between the products in terms of the perceived intensity for each attribute listed in Table 2, and the perceived attributes’ intensity differences. Consumers’ liking data were analysed via one-way ANOVA (GLM) to identify the most liked product. Student’s paired t-test was used to evaluate differences between mean scores obtained for the two products and for the same products under different conditions (tasting only, information only, and tasting with information). Data collected for the validation of information were subjected to analysis of variance with type of information as a factor. All the statistical analyses were performed by using SAS software (2009).

3. Results and Discussion

3.1. Spirulina Effects on Mozzarella Cheese’s Chemical Composition

The milk composition was affected by Spirulina supplementation only in terms of protein, lowering the percentage from 4.59 to 4.31 (SEM 0.07, p < 0.05), while the fat and lactose contents were not influenced by Spirulina inclusion in the buffalo diets. The same trend was observed in the mozzarella cheese’s chemical composition; the fat, lactose, and moisture contents were not different among the two groups, while the protein amount was tendentially higher in the C group ((18.01 vs. 17.12 ± 0.33%; p < 0.10 (mean ± SEM)) than the S group. Our results do not agree with the increases in protein, fat, and lactose found by Šimkus et al. [40] as effects of Spirulina supplementation in cows, and the findings of Boeckaert et al. [41] and Stamey et al. [42], who registered an increase in milk fat. Despite the small differences in the protein content, the AA profiles of the mozzarella cheese samples did not change with Spirulina supplementation (Table 3). Among the EAAs, LEU and LYS are the most abundant in both products, tending to be higher in the S samples, which could be due to the AA profile of the added Spirulina. Microalgae in general are good sources of EAAs. The milk from the S group contained 27% more EAAs and 23% more NEAAs than the C group. The presence of EAAs in milk and dairy products, especially branched-chain amino acids, is important in terms of their benefits for human health [43]. Recently, Cacciola et al. [44,45] reported interesting results about a possible beneficial effect of delactosed buffalo milk whey by-product on colorectal human carcinogenesis. It is well known that primary proteolysis occurs during mozzarella processing [46], and the effect of the composition of milk protein fractions (relative contents of alpha S1 casein and beta casein) on milk coagulation properties has been widely studied [47,48].
Table 4 shows no significant differences in the FA profiles of the mozzarella cheese samples between the C and S groups, nor in the calculated nutritional index. Manzocchi et al. [49] did not observe any significant differences in the dairy cow milk FA content when substituting 5% of soybean meal with Spirulina in their diets, except for the total n-6 FA, which was higher in the control milk samples. This highlights that the diet supplemented with Spirulina lowered the apparent transfer efficiency of the total n-6 FA. In contrast, numerous authors have reported that replacing feed with Spirulina yields a significant improvement in the FA profile of ruminants’ milk. Christodoulou et al. [50] examined the effects of three levels of Spirulina substitution (i.e., 5%, 10%, and 15%) in the diets of ewes. Their findings revealed that only the highest level of substitution increased the PUFA and ω-3 PUFA contents, while a mere 5% of substitution was adequate to decrease the AI. Christaki et al. [51] added 40 g of powdered Spirulina to cow diets and observed a decrease in the SFA amount, while the MUFA and PUFA contents in the milk increased at the 45th day of experimentation. As stated by many authors, species and breeds strongly affect the animals’ responses to diets [14,15]. This might partially explain why the buffalo mozzarella cheese chemical compositions did not differ among the two groups in our study. Moreover, the amount of Spirulina included in the S diets for the buffaloes could be too low to see changes/improvements in the milk and cheese compositions. To date, most of the studies in which microalgae were tested for animal feeding showed inconsistent and contradictory effects, probably due to the high variability among the studies, the doses of microalgae and species, the experimental period, and the percentage of forage in the diet [14]. However, microalgae use in animal feeding originated with the objective of improving the nutritional quality, particularly in terms of the FA profile, of milk and dairy products [15].
The mozzarella cheese’s mineral content was not affected by the diets, as shown in Table 5. As it is well known, the major mineral that is present in buffalo milk, and thus in buffalo mozzarella cheese, is calcium, while the second most predominant mineral is phosphorus. Gulzar et al. [52] reported that the mineral content is influenced by the cheese process, with the ash content reducing proportionally as the milling pH decreases. They explained that acid development solubilises micellar calcium phosphate, leading to mineral expulsion in whey. Specifically, the calcium levels decrease in line with the milling pH reduction, although there is uncertainty about the influence of this cheese-making step on the potassium and sodium levels. The buffalo milk mineral content is subject to variation due to several factors, including the season, environment, diet, stage of lactation, animal breed, and genetics [53]. The Mediterranean buffalo has been reported to possess the highest magnesium content in milk, whilst the greatest amount of minerals found in buffalo milk occurred during the summer season [54]. In our study, it was found that the mineral content was consistent across the samples because both groups were homogeneous, consisting of the same breed, and were fed the same diet. Therefore, the inclusion of Spirulina powder did not affect the mineral percentage in the buffalo mozzarella cheese.
The results of the analysis on VOCs can be found in Table 6. In total, 94 compounds were identified, and the most prevalent class in both groups is “others”. This group covers all of the individual VOCs that do not belong to the main classes considered in this study. Although the less abundant classes are the same in both samples, including esters, aldehydes, halogenated hydrocarbons, sulphur, and nitrogen compounds (from highest to lowest), the most abundant VOC classes are different between the two groups. In the C samples, the most and least frequent classes are alcohols, ketones, hydrocarbons, and aromatic hydrocarbons, in that order. In contrast, in the S samples, the most frequent classes are hydrocarbons, alcohols, aromatic hydrocarbons, and ketones, in that order. The only class that significantly differs from the others is aromatic hydrocarbons, which are higher in the C samples than the S samples, despite being ranked fifth on the list of VOC classes for the C group (in descending order) and fourth for the S group. However, the individual VOCs that were found to be significantly different (only 4% of the VOCs detected) do not belong to this class. Specifically, toluene (p < 0.05), isobutyl acetate (p < 0.05), and acetic acid 2-phenylethyl ester (p < 0.01) were found at higher levels in product C, while 1 Pentanol (p < 0.01) was detected at lower levels (p < 0.01) (Table 6). Unlike the study by Sabia et al. [10], where the most prevalent VOC class was ketones, particularly in the cheese from buffalos that were fed wrapped ryegrass silage, our study found that ketones ranked third and fifth in the VOC lists of the C and S groups, respectively. Moreover, the level of ketones was higher in the C samples compared to the S samples (though not significantly). This is similar to the study by Sacchi et al. [3], where ketones were more abundant in the control sample than the experimental ones. Ketones are common in many dairy products, and their origin can be attributed to SFA β-oxidation. Some studies suggest that these compounds are derived from animal feeds, and silage is the primary source of ketones [3]. Further, animals consuming silage-based diets may result in the production of alcohols [55]. There are numerous metabolic pathways implicated in the alcohol biosynthesis found in cheese. These pathways include the reduction of methyl ketones and aldehydes, the degradation of linoleic and linolenic acids, as well as AA and lactose metabolism. Table 6 shows that the alcohol class is higher in the C samples in comparison to the S samples, although not significantly different, and they are the same as the ketones levels. Our study involved two groups of animals that were fed the same diet, with the same amount of silage. Therefore, the variations in the levels of ketones and alcohols could be attributed to the addition of Spirulina, even in small quantities. Although there is no significant difference in the levels of halogenated hydrocarbons between the two groups, it should be noted that the level of this class is four times greater in the C samples than in the S samples. The mozzarella cheese production process impacts both the quantity and quality of the VOC composition. High temperatures during stretching can cause compound loss, while microflora activity during curd ripening can generate new compounds. Additionally, enzymes and milk bacteria are involved in the development of the cheese’s flavour. The aroma of cheese is also the result of the interaction of volatile and non-volatile chemical compounds, mainly concentrated in the water-soluble fraction, resulting from the transformation of the primary components (fat, proteins, and carbohydrates) and the action of bacteria present during milk processing. Therefore, understanding the production process is crucial to regulate the VOC composition of mozzarella cheese [3]. However, the flavour of mozzarella cheese is not determined by the quantity of a particular compound/VOC, but by the equilibrium of all of the VOCs present.
The results about the instrumental colour of mozzarella showed that Spirulina integration was responsible of the higher values of the L*, a*, and b* indices in both the external and internal surfaces (Table 7). It is likely that the blue phycocyanin, one of the two pigmented antioxidants found in Spirulina, may have contributed to an increased lightness with a blue tint. However, it is worth noting that Park et al. [56] did not find a significant correlation between the L* value, pigment content, or antioxidant activity of Spirulina. If this finding is confirmed in future studies, it would be a favourable outcome, considering the high demand for porcelain white mozzarella among consumers.
A correct instrumental measurement of colour is useful at the stage of analysing consumer preferences for the research, development, and improvement of cheese-making methods. When observed under a light source, PDO buffalo mozzarella cheese should have a porcelain white colour and a glowing appearance. The white colour is given by casein micelles, while the yellowish hues are imparted by carotenoids in green fodder, which are not absorbed in the cattle species and are therefore released in the milk. In contrast, buffaloes, sheep, and goats are able to assimilate and transform these compounds, so the colour of their milk tends to remain white.

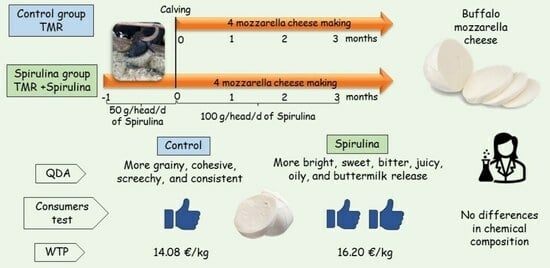
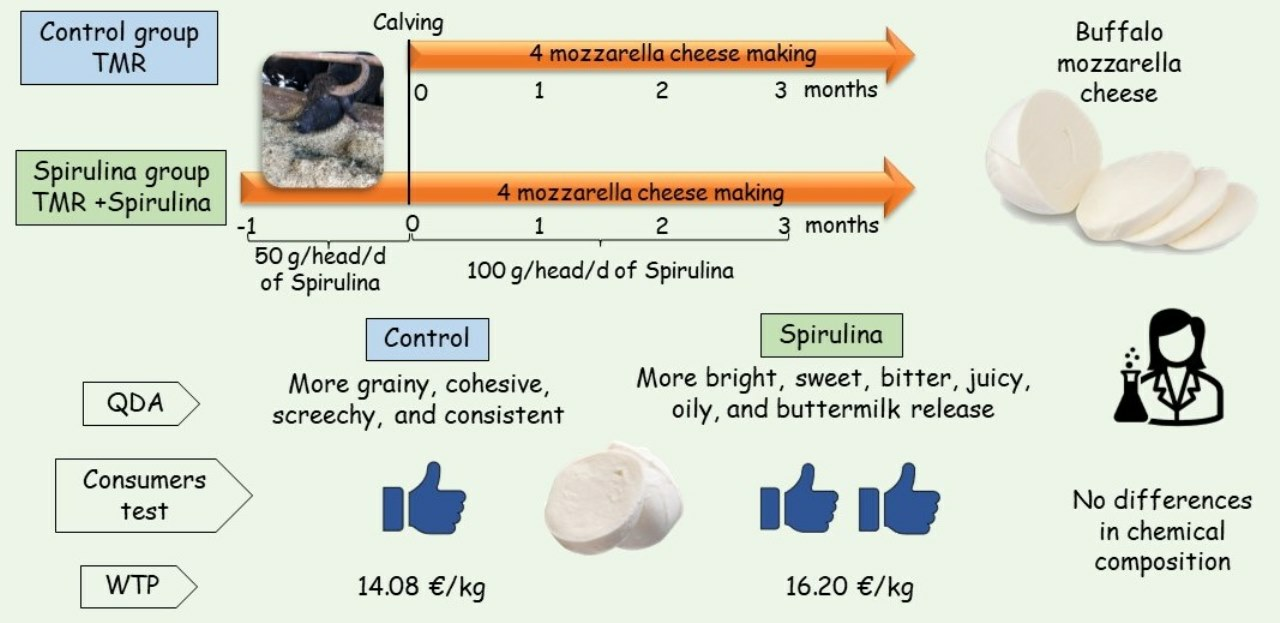
3.2. Spirulina Effects on Mozzarella Cheese’s Sensory Quality

As for the QDA, no significant product x replication or product x assessor interactions were observed, suggesting that the training program and the reference frame used in this study were efficacious in ensuring the high reliability of the panel (i.e., products were not evaluated differently in different replications or by different assessors).
Table 8 shows a significant diet effect on the sensory profiles of mozzarella cheeses. The samples from the S group were evaluated as being brighter (p < 0.05) with a lower white inner colour (p < 0.01) than the C group. The S mozzarella cheeses were perceived with a higher butter odour (p < 0.01), a higher whey flavour, and a sweeter and more bitter taste than the samples from the C group (p < 0.05). Furthermore, the panellists perceived higher oiliness (p < 0.01) and moisture (p < 0.0001) intensities in the S samples with a greater milk release when cutting (p < 0.001) and a tendentially higher tenderness (p < 0.10) than in the mozzarella cheeses from the C group, which, on the contrary, were perceived as being more grainy, cohesive, screechy, and having a greater consistency when cutting than the S mozzarella cheeses (p < 0.01).
In a recent study on buffalo mozzarella cheese [11], changes in texture were attributed, at least in part, to the corresponding fatty acid composition, which was lower in saturated fatty acids, such as C14:0, and richer in unsaturated fatty acids, such as C18:1, in products obtained from animals that were fed fresh fodder. The lower melting point of unsaturated fatty acids can produce softer cheeses. Furthermore, some attributes (e.g., bitter taste, flakiness, and grainy texture) may be influenced by more intense proteolysis that occurs in the summer, which, in turn, may contribute to the softening of the mozzarella and may have a direct effect on the flavour through the production of short-chain peptides and amino acids [57].
The greater oiliness could also be due to a different acid composition in the fat. For example, in Friesian cattle, Christaki et al. [51], following the administration of 40 g/head/d of Spirulina, observed a reduction in the content of saturated fatty acids in milk, with a consequent increase in MUFA and PUFA compared to the control. The sensory characteristics of fresh mozzarella largely rely on the raw materials and production techniques used. Further investigation is required to evaluate the influence of diverse components, including VOCs, AAs, FAs, and peptides, on each sensory attribute.
The data on the distribution of individual preferences (Table 9) show that the information received is able to direct the consumers’ judgements.
The consumers in blind conditions (P) evaluated both samples from the C and S groups to be greater than the middle value (i.e., 5) (Table 10), meaning there were satisfactory sensory properties in both products. Moreover, the blind evaluation was not influenced by the animals’ diet, nor by the ages and sexes of the consumers. No difference was observed between the two groups for expected (E) liking. Likewise, the actual (A) liking was only influenced by diet, with a higher rate for the S group samples (7.29) than the C group samples (6.85). Table 10 shows that for both groups, the expected liking was significantly higher than the blind evaluation (p < 0.01), which means there was a negative disconfirmation: consumers evaluate the mozzarella cheese to be lower than their expectations. There was no difference between the actual and perceived liking of the C group samples, which means that the information does not increase the product evaluation; on the contrary, for the S mozzarella cheese, the information strongly influenced the actual liking (p < 0.001), as it was close to the expected acceptability. This means that there was a complete assimilation, because the information given to the consumers brought them to similarly evaluate the samples in both the actual and expected conditions (i.e., with and without tasting the mozzarella cheese).
Many aspects of the product can be used by consumers to make their food choices. Grunert et al. [58] identified four main dimensions of quality for dairy products: hedonism, health, convenience, and process. A few of them can be experienced before purchase (e.g., colour), while most of them can be perceived after purchase (e.g., sensory properties), or may never be perceived (e.g., healthiness and appearance ethical). The latter must be communicated to the consumer, as they are characteristics that cannot be perceived before nor after the purchase [59]. Therefore, regarding these characteristics, consumers are forced to develop expectations to guide their food choices. In particular, to develop expectations on product quality attributes, consumers can use both intrinsic (e.g., holes in the cheese, colour of the external rind, etc.) and extrinsic (e.g., price) characteristics. However, consumers tend to rely mostly on extrinsic characteristics provided to them in the form of product information [60]. In particular, ethical concerns, such as environmental pollution and animal welfare, are becoming increasingly important in the hierarchy of purchasing motivations for animal products. Blockhuis et al. [61] highlighted that animal welfare is increasingly recognised as an important component of quality for consumers of animal products. Numerous studies have been conducted on the effect of information on food liking [62,63]. For example, the effect of information relating to animal welfare on lamb [64] and beef [65] liking has been studied, as well as the effect of information relating to organic production on the acceptability of foods and beverages [66,67]. All of these studies have shown that information-induced expectations can influence the perception of quality. Therefore, if expectations receive a positive disconfirmation (when the satisfaction score of the product tasted without external information is higher than expected) or a negative one (when the product is worse than expected), the assimilation model is generally applicable. According to this model, when external information is provided, the hedonic tests highlight a shift in acceptability towards expectations and reach different values from those obtained by tasting the same food without external information [68]. In both groups, the expected liking was significantly higher than the liking expressed in the blind conditions (p < 0.01), thus indicating that a negative disconfirmation occurred: the consumers found the mozzarella to be less pleasant than expected. In these conditions, generally, actual liking moves in the direction of expected liking for group C; no significant difference was observed between the actual and perceived liking. Thus, in this case, there was no assimilation, as the information did not improve the acceptability of the product (Table 10). Conversely, regarding the mozzarella cheese obtained from the S group, the information greatly improved the actual liking (p < 0.001), which moved in the direction of the expectations. According to Blokhuis et al. [61], the perception of food quality is determined by the welfare of the animals producing that food together with the overall nature and safety of the final product. In particular, the assimilation in this case was complete, since no difference was observed between the actual liking (expressed by the consumers with both sensory stimuli and information available) and expected liking (expressed by the consumers with only the information available). The complete assimilation observed for the S product is probably due to the important role played by information in determining the actual liking of mozzarella with Spirulina. This information is able to respond to some of the main and most current consumer concerns, such as the nutraceutical properties of products and animal welfare.
Napolitano et al. [64] showed that consumers are influenced by animal welfare information and shift their WTP in the direction of their expectations. In particular, the discrepancy between the expected liking and the actual willingness to pay was not fully assimilated, indicating that it was also expressed in relation to other aspects (for example, the sensorial properties of the products). Experimental auctions are able to place consumers in real situations where they can show their true preferences. In particular, the second-price Vickrey’s auction has been widely used to assess consumers’ WTP for real goods, including food [38], and the values that consumers place on food safety [69] and animal welfare [39]. Under this specific type of auction, consumers are individually asked to submit a sealed bid corresponding to the highest price they would agree to pay for a particular product. The highest bidder (i.e., the winner), by paying the second highest price, has the opportunity to purchase a product at a price that is equal to or, more often, lower than the value they attribute to the product [70]. Currently, consumers are not looking for the cheapest food, but the best quality/price ratio, i.e., the maximum benefit for what they are willing to spend [71]. In our study, it was observed that gender had no influence on the overall offer, while it was found that the consumers offered EUR 4.05 (16.20 EUR/kg) for a 250 g pack of Spirulina mozzarella cheese compared to EUR 3.52 (14.08 EUR/kg) for the control mozzarella cheese (F1,128 = 8.73; p = 0.0074).

4. Conclusions

The inclusion of 100 g of freeze-dried Spirulina per day in the diets of buffaloes does not alter the chemical composition of mozzarella cheese or the characteristics identified using chromatographic instruments, including the fatty acid profile or the classes of volatile organic compounds. Nevertheless, this small amount of supplementation affects the sensory characteristics of mozzarella cheese, as assessed by the panel of experts. The experimental mozzarella cheese was found to be brighter, sweeter, more bitter, juicier, more tender, and oilier, with higher buttermilk release, butter odour, and whey flavour than traditional buffalo mozzarella cheese. In addition, providing information about the nutraceutical properties of Spirulina and its possible beneficial effect on animal health to consumers can have a strong effect on their liking, as they rated the experimental mozzarella greater than the conventional one, and expressed a higher willingness to pay for the mozzarella cheese produced by the buffalo fed with Spirulina. Further studies with a higher level of Spirulina are necessary in order to confirm these results.

Supplementary Materials

The following supporting information can be downloaded at https://www.mdpi.com/article/10.3390/foods12224095/s1, Table S1: Ingredients (kg/head/day) and chemical composition (% of dry matter, DM, if not otherwise stated) of the experimental total mixed rations.

Author Contributions

Conceptualisation, G.D.R., C.M.A.B. and C.P.; methodology, C.L. and F.S.; validation, F.S., A.D.F., J.M.L. and C.P.; formal analysis, C.L. and A.B.; investigation, C.L., F.S. and C.P.; resources, G.D.R. and J.M.L.; data curation, C.L., A.B., A.D.F. and C.M.A.B.; writing—original draft preparation, C.L. and A.B.; writing—review and editing, C.L., F.S., A.B., C.M.A.B. and G.D.R.; visualisation, C.P. and A.D.F.; supervision, G.D.R.; project administration, G.D.R.; funding acquisition, G.D.R. All authors have read and agreed to the published version of the manuscript.

Funding

This research was supported by the Campania Region, PSR 2014–2020 Tipologia 16.1.1, SPIRALBUF project (Impiego della Spirulina nell’alimentazione della bufala), CUP: B68H19005470008.

Institutional Review Board Statement

This study was conducted according to the guidelines of the Declaration of Helsinki and approved by the Ethical Animal Care and Use Committee of Federico II University of Naples (protocol code: 007143; 8/1/2020).

Data Availability Statement

The datasets of the present study are available from the corresponding authors upon reasonable request.

Acknowledgments

We dedicate this paper to, and in memory of, our beloved friend and colleague, Fabio Napolitano, who contributed greatly to this study. He continues to inspire our work. The authors thank Amelia Riviezzi (Scuola di Scienze Agrarie, Forestali, Alimentari ed Ambientali, Università degli Studi della Basilicata) and Roberto Di Matteo (Dipartimento di Agraria, Università degli Studi di Napoli Federico II) for their expert technical assistance. Thanks are also due to Davide Colangelo (buffalo farm “Azienda agricola Colangelo Davide”) and Pasquale Colangelo (dairy “La Perla del Mediterraneo”) and their staff for managing the animals and producing the mozzarella, respectively.

Conflicts of Interest

The authors declare no conflict of interest.

References

  1. Borghese, A. Buffalo Livestock and Products in Europe. Buffalo Bull. 2013, 25, 50–74. [Google Scholar]
  2. Mota-Rojas, D.; Braghieri, A.; Álvarez-Macías, A.; Serrapica, F.; Ramírez-Bribiesca, E.; Cruz-Monterrosa, R.; Masucci, F.; Mora-Medina, P.; Napolitano, F. The Use of Draught Animals in Rural Labour. Animals 2021, 11, 2683. [Google Scholar] [CrossRef]
  3. Sacchi, R.; Marrazzo, A.; Masucci, F.; Di Francia, A.; Serrapica, F.; Genovese, A. Effects of Inclusion of Fresh Forage in the Diet for Lactating Buffaloes on Volatile Organic Compounds of Milk and Mozzarella Cheese. Molecules 2020, 25, 1332. [Google Scholar] [CrossRef] [PubMed]
  4. Zicarelli, L. Current Trends in Buffalo Milk Production. J. Buffalo Sci. 2020, 9, 121–132. [Google Scholar] [CrossRef]
  5. Coppola, S.; Villani, F.; Coppola, R.; Parente, E. Comparison of Different Starter Systems for Water-Buffalo Mozzarella Cheese Manufacture. Lait 1990, 70, 411–423. [Google Scholar] [CrossRef]
  6. Pizzolongo, F.; Quarto, M.; Nasi, A.; Ferranti, P.; Addeo, F.; Sacchi, R.; Chianese, L. Sensory Profile of P.D.O. Mozzarella Di Bufala Campana Cheese. Ital. J. Anim. Sci. 2007, 6, 1136–1139. [Google Scholar] [CrossRef]
  7. Napolitano, F.; Guerrero-Legarreta, I.; López, G.; Gómez, J.; Flores, K.; Bertoni, A.; Braghieri, A.; Macias, A.G.A.; Rosa, G.D.; Mota-Rojas, D.; et al. Advances and Perspectives in Research on Buffalo Milk Production and Mozzarella Cheese. Agro Product. 2021, 14, 1–9. [Google Scholar] [CrossRef]
  8. Claps, S.; Pizzillo, M.; Agoglia, E.; Schettino, M.V.; Sabia, E.; Rubino, R. Chemical and Texture Characteristics and Sensory Properties of “Mozzarella” Cheese from Different Feeding Systems. Ital. J. Anim. Sci. 2007, 6, 1143–1146. [Google Scholar] [CrossRef]
  9. Cifuni, G.F.; Pizzillo, M.; Claps, S.; Napoli, D.; Mazzi, M.; Rubino, R. Effect of Feeding Systems on Aromatic Characteristics of Buffalo Mozzarella Cheese. Ital. J. Anim. Sci. 2007, 6, 1147–1149. [Google Scholar] [CrossRef]
  10. Sabia, E.; Gauly, M.; Napolitano, F.; Cifuni, G.F.; Claps, S. The Effect of Different Dietary Treatments on Volatile Organic Compounds and Aromatic Characteristics of Buffalo Mozzarella Cheese. Int. J. Dairy Technol. 2020, 73, 594–603. [Google Scholar] [CrossRef]
  11. Uzun, P.; Masucci, F.; Serrapica, F.; Napolitano, F.; Braghieri, A.; Romano, R.; Manzo, N.; Esposito, G.; Di Francia, A. The Inclusion of Fresh Forage in the Lactating Buffalo Diet Affects Fatty Acid and Sensory Profile of Mozzarella Cheese. J. Dairy Sci. 2018, 101, 6752–6761. [Google Scholar] [CrossRef]
  12. Holman, B.W.B.; Malau-Aduli, A.E.O. Spirulina as a Livestock Supplement and Animal Feed. J. Anim. Physiol. Anim. Nutr. 2013, 97, 615–623. [Google Scholar] [CrossRef]
  13. Lamminen, M. Nutritional Value of Microalgae for Ruminants and Implications from Microalgae Production. CABI Rev. 2021, 2021, 54. [Google Scholar] [CrossRef]
  14. Orzuna-Orzuna, J.F.; Chay-Canul, A.J.; Lara-Bueno, A. Performance, Milk Fatty Acid Profile and Oxidative Status of Lactating Small Ruminants Supplemented with Microalgae: A Meta-Analysis. Small Rumin. Res. 2023, 226, 107031. [Google Scholar] [CrossRef]
  15. Altomonte, I.; Salari, F.; Licitra, R.; Martini, M. Use of Microalgae in Ruminant Nutrition and Implications on Milk Quality—A Review. Livest. Sci. 2018, 214, 25–35. [Google Scholar] [CrossRef]
  16. Ragab, M.; El-Diasty, M.; El-Sherbini, M.; AbdelKhalek, A. Effect of Spirulina on Somatic Cell Count and Milk Quality. J. Adv. Vet. Res. 2023, 13, 637–642. [Google Scholar]
  17. Bartocci, S.; Tripaldi, C.; Terramoccia, S. Characteristics of Foodstuffs and Diets, and the Quanti-Qualitative Milk Parameters of Mediterranean Buffaloes Bred in Italy Using the Intensive System: An Estimate of the Nutritional Requirements of Buffalo Herds Lactating or Dry. Livest. Prod. Sci. 2002, 77, 45–58. [Google Scholar] [CrossRef]
  18. Campanile, G.; Filippo, C.D.; Palo, R.D.; Taccone, W.; Zicarelli, L. Influence of Dietary Protein on Urea Levels in Blood and Milk of Buffalo Cows. Livest. Prod. Sci. 1998, 55, 135–143. [Google Scholar] [CrossRef]
  19. Serrapica, F.; Masucci, F.; Romano, R.; Napolitano, F.; Sabia, E.; Aiello, A.; Di Francia, A. Effects of Chickpea in Substitution of Soybean Meal on Milk Production, Blood Profile and Reproductive Response of Primiparous Buffaloes in Early Lactation. Animals 2020, 10, 515. [Google Scholar] [CrossRef]
  20. Serrapica, F.; Masucci, F.; Romano, R.; Santini, A.; Manzo, N.; Seidavi, A.; Omri, B.; Salem, A.Z.M.; Di Francia, A. Peas May Be a Candidate Crop for Integrating Silvoarable Systems and Dairy Buffalo Farming in Southern Italy. Agro. Syst. 2020, 94, 1345–1352. [Google Scholar] [CrossRef]
  21. Vargas-Ramella, M.; Munekata, P.E.S.; Pateiro, M.; Franco, D.; Campagnol, P.C.B.; Tomasevic, I.; Domínguez, R.; Lorenzo, J.M. Physicochemical Composition and Nutritional Properties of Deer Burger Enhanced with Healthier Oils. Foods 2020, 9, 571. [Google Scholar] [CrossRef]
  22. Chen, J.; Liu, H. Nutritional Indices for Assessing Fatty Acids: A Mini-Review. Int. J. Mol. Sci. 2020, 21, 5695. [Google Scholar] [CrossRef] [PubMed]
  23. Vargas Ramella, M.; Lorenzo Rodríguez, J.M.; Rois Losada, D.; Arias, A.; Justo, J.R.; Pateiro Moure, M.; López Pedrouso, M.D.; Chico, D. Effect of Finishing Diet on Carcass Characteristics and Meat Quality of Mos Cockerel. Span. J. Agric. Res. 2021, 19, 601. [Google Scholar] [CrossRef]
  24. Peñalver, R.; Martínez-Zamora, L.; Lorenzo, J.M.; Ros, G.; Nieto, G. Nutritional and Antioxidant Properties of Moringa Oleifera Leaves in Functional Foods. Foods 2022, 11, 1107. [Google Scholar] [CrossRef]
  25. Echegaray, N.; Paterio, M.; Domínguez, R.; Purriños, L.; Bermúdez, R.; Carballo, J.; Lorenzo, J.M. Effects of Different Cooking Methods and of the Inclusion of Chestnut (Castanea Sativa Miller) in the Finishing Diet of Celta Pig Breed on the Physicochemical Parameters and Volatile Profile of Longissimus Thoracis et Lumborum Muscle. Food Res. Int. 2020, 137, 109407. [Google Scholar] [CrossRef] [PubMed]
  26. Girolami, A.; Napolitano, F.; Faraone, D.; Braghieri, A. Measurement of Meat Color Using a Computer Vision System. Meat Sci. 2013, 93, 111–118. [Google Scholar] [CrossRef] [PubMed]
  27. Girolami, A.; Napolitano, F.; Faraone, D.; Di Bello, G.; Braghieri, A. Image Analysis with the Computer Vision System and the Consumer Test in Evaluating the Appearance of Lucanian Dry Sausage. Meat Sci. 2014, 96, 610–616. [Google Scholar] [CrossRef] [PubMed]
  28. Murray, J.M.; Delahunty, C.M.; Baxter, I.A. Descriptive Sensory Analysis: Past, Present and Future. Food Res. Int. 2001, 34, 461–471. [Google Scholar] [CrossRef]
  29. Albenzio, M.; Santillo, A.; Caroprese, M.; Braghieri, A.; Sevi, A.; Napolitano, F. Composition and Sensory Profiling of Probiotic Scamorza Ewe Milk Cheese. J. Dairy Sci. 2013, 96, 2792–2800. [Google Scholar] [CrossRef]
  30. ISO 8586:2012; Sensory Analysis—General Guidelines for the Selection, Training and Monitoring of Selected Assessors and Expert Sensory Assessor. International Organization for Standardization: Geneva, Switzerland, 2012. Available online: https://www.Iso.Org/Obp/Ui/#iso:Std:Iso:8586:Ed-1:V2:En (accessed on 16 October 2023).
  31. Stone, H.; Sidel, J.L. Sensory Evaluation Practices, 3rd ed.; Elsevier Academic Press: London, UK, 2004. [Google Scholar]
  32. Uzun, P.; Masucci, F.; Serrapica, F.; Varricchio, M.L.; Pacelli, C.; Claps, S.; Di Francia, A. Use of Mycorrhizal Inoculum under Low Fertilizer Application: Effects on Forage Yield, Milk Production, and Energetic and Economic Efficiency. J. Agric. Sci. 2018, 156, 127–135. [Google Scholar] [CrossRef]
  33. ISO 8589:2007; Sensory Analysis—Sensory Analysis–General Guidance for the Design of Test Rooms. International Organization for Standardization: Geneva, Switzerland, 2007. Available online: https://www.iso.org/obp/ui/#iso:std:iso:8589:ed-2:v1:en (accessed on 16 October 2023).
  34. Braghieri, A.; Zotta, T.; Morone, G.; Piazzolla, N.; Majlesi, M.; Napolitano, F. Starter Cultures and Preservation Liquids Modulate Consumer Liking and Shelf Life of Mozzarella Cheese. Int. Dairy J. 2018, 85, 254–262. [Google Scholar] [CrossRef]
  35. Markey, O.; Souroullas, K.; Fagan, C.C.; Kliem, K.E.; Vasilopoulou, D.; Jackson, K.G.; Humphries, D.J.; Grandison, A.S.; Givens, D.I.; Lovegrove, J.A.; et al. Consumer Acceptance of Dairy Products with a Saturated Fatty Acid–Reduced, Monounsaturated Fatty Acid–Enriched Content. J. Dairy Sci. 2017, 100, 7953–7966. [Google Scholar] [CrossRef] [PubMed]
  36. Peryam, D.R.; Pilgrim, F.J. Hedonic Scale Method of Measuring Food Preferences. Food Technol. 1957, 11, 9–14. [Google Scholar]
  37. Serrapica, F.; Masucci, F.; De Rosa, G.; Braghieri, A.; Sarubbi, F.; Garofalo, F.; Di Francia, A. Moving Buffalo Farming beyond Traditional Areas: Performances of Animals, and Quality of Mozzarella and Forages. Agriculture 2022, 12, 1219. [Google Scholar] [CrossRef]
  38. Lange, C.; Martin, C.; Chabanet, C.; Combris, P.; Issanchou, S. Impact of the Information Provided to Consumers on Their Willingness to Pay for Champagne: Comparison with Hedonic Scores. Food Qual. Prefer. 2002, 13, 597–608. [Google Scholar] [CrossRef]
  39. Napolitano, F.; Pacelli, C.; Girolami, A.; Braghieri, A. Effect of Information About Animal Welfare on Consumer Willingness to Pay for Yogurt. J. Dairy Sci. 2008, 91, 910–917. [Google Scholar] [CrossRef]
  40. Šimkus, A.; Oberauskas, V.; Laugalis, J.; Želvytė, R.; Monkevičienė, I.; Sederevičius, A.; Šimkienė, A.; Pauliukas, K. The Effect of Weed Spirulina Platensis on the Milk Production in Cows. Vet. Zootech 2007, 38, 74–77. [Google Scholar]
  41. Boeckaert, C.; Vlaeminck, B.; Dijkstra, J.; Issa-Zacharia, A.; Van Nespen, T.; Van Straalen, W.; Fievez, V. Effect of Dietary Starch or Micro Algae Supplementation on Rumen Fermentation and Milk Fatty Acid Composition of Dairy Cows. J. Dairy Sci. 2008, 91, 4714–4727. [Google Scholar] [CrossRef] [PubMed]
  42. Stamey, J.A.; Shepherd, D.M.; de Veth, M.J.; Corl, B.A. Use of Algae or Algal Oil Rich in N-3 Fatty Acids as a Feed Supplement for Dairy Cattle. J. Dairy Sci. 2012, 95, 5269–5275. [Google Scholar] [CrossRef]
  43. Nie, M.; Wang, L.; Lu, S.; Wang, Y.; Zheng, M.; Fang, Z. Protective Effect of Amino Acids on the Stability of Bayberry Anthocyanins and the Interaction Mechanism between L-Methionine and Cyanidin-3-O-Glycoside. Food Chem. 2022, 396, 133689. [Google Scholar] [CrossRef]
  44. Cacciola, N.A.; Salzano, A.; D’Onofrio, N.; Venneri, T.; Cicco, P.D.; Vinale, F.; Petillo, O.; Martano, M.; Maiolino, P.; Neglia, G.; et al. Buffalo Milk Whey Activates Necroptosis and Apoptosis in a Xenograft Model of Colorectal Cancer. Int. J. Mol. Sci. 2022, 23, 8464. [Google Scholar] [CrossRef]
  45. Cacciola, N.A.; Venneri, T.; Salzano, A.; D’Onofrio, N.; Martano, M.; Saggese, A.; Vinale, F.; Neglia, G.; Campanile, C.; Baccigalupi, L.; et al. Chemopreventive Effect of a Milk Whey By-Product Derived from Buffalo (Bubalus Bubalis) in Protecting from Colorectal Carcinogenesis. Cell Commun. Signal. 2023, 21, 245. [Google Scholar] [CrossRef] [PubMed]
  46. Petrella, G.; Pati, S.; Gagliardi, R.; Rizzuti, A.; Mastrorilli, P.; la Gatta, B.; Di Luccia, A. Study of Proteolysis in River Buffalo Mozzarella Cheese Using a Proteomics Approach. J. Dairy Sci. 2015, 98, 7560–7572. [Google Scholar] [CrossRef] [PubMed]
  47. Bonfatti, V.; Gervaso, M.; Rostellato, R.; Coletta, A.; Carnier, P. Protein Composition Affects Variation in Coagulation Properties of Buffalo Milk. J. Dairy Sci. 2013, 96, 4182–4190. [Google Scholar] [CrossRef]
  48. Bonfatti, V.; Giantin, M.; Rostellato, R.; Dacasto, M.; Carnier, P. Separation and Quantification of Water Buffalo Milk Protein Fractions and Genetic Variants by RP-HPLC. Food Chem. 2013, 136, 364–367. [Google Scholar] [CrossRef]
  49. Manzocchi, E.; Guggenbühl, B.; Kreuzer, M.; Giller, K. Effects of the Substitution of Soybean Meal by Spirulina in a Hay-Based Diet for Dairy Cows on Milk Composition and Sensory Perception. J. Dairy Sci. 2020, 103, 11349–11362. [Google Scholar] [CrossRef] [PubMed]
  50. Christodoulou, C.; Kotsampasi, B.; Dotas, V.; Simoni, M.; Righi, F.; Tsiplakou, E. The Effect of Spirulina Supplementation in Ewes’ Oxidative Status and Milk Quality. Anim. Feed Sci. Technol. 2023, 295, 115544. [Google Scholar] [CrossRef]
  51. Christaki, E.; Karatzia, M.; Bonos, E.; Florou-Paneri, P.; Karatzias, C. Effect of Dietary Spirulina Platensis on Milk Fatty Acid Profile of Dairy Cows. Asian J. Anim. Vet. Adv. 2012, 7, 597–604. [Google Scholar] [CrossRef]
  52. Gulzar, N.; Rafiq, S.; Nadeem, M.; Imran, M.; Khalique, A.; Muqada Sleem, I.; Saleem, T. Influence of Milling pH and Storage on Quality Characteristics, Mineral and Fatty Acid Profile of Buffalo Mozzarella Cheese. Lipids Health Dis. 2019, 18, 33. [Google Scholar] [CrossRef]
  53. Garau, V.; Manis, C.; Scano, P.; Caboni, P. Compositional Characteristics of Mediterranean Buffalo Milk and Whey. Dairy 2021, 2, 469–488. [Google Scholar] [CrossRef]
  54. Patiño, E.M.; Pochon, D.O.; Faisal, E.L.; Cedrés, J.F.; Mendez, F.I.; Stefani, C.G.; Crudeli, G. Influence of Breed, Year Season and Lactation Stage on the Buffalo Milk Mineral Content. Ital. J. Anim. Sci. 2007, 6, 1046–1049. [Google Scholar] [CrossRef]
  55. Stefanon, B.; Procida, G. Effects of Including Silage in the Diet on Volatile Compound Profiles in Montasio Cheese and Their Modification during Ripening. J. Dairy Res. 2004, 71, 58–65. [Google Scholar] [CrossRef]
  56. Park, W.S.; Kim, H.-J.; Li, M.; Lim, D.H.; Kim, J.; Kwak, S.-S.; Kang, C.-M.; Ferruzzi, M.G.; Ahn, M.-J. Two Classes of Pigments, Carotenoids and C-Phycocyanin, in Spirulina Powder and Their Antioxidant Activities. Molecules 2018, 23, 2065. [Google Scholar] [CrossRef]
  57. McSweeney, P.L.H. Biochemistry of Cheese Ripening. Int. J. Dairy Technol. 2004, 57, 127–144. [Google Scholar] [CrossRef]
  58. Grunert, K.G.; Bech-Larsen, T.; Bredahl, L. Three Issues in Consumer Quality Perception and Acceptance of Dairy Products. Int. Dairy J. 2000, 10, 575–584. [Google Scholar] [CrossRef]
  59. Grunert, K.G.; Bredahl, L.; Brunsø, K. Consumer Perception of Meat Quality and Implications for Product Development in the Meat Sector—A Review. Meat Sci. 2004, 66, 259–272. [Google Scholar] [CrossRef]
  60. Banović, M.; Grunert, K.G.; Barreira, M.M.; Fontes, M.A. Beef Quality Perception at the Point of Purchase: A Study from Portugal. Food Qual. Prefer. 2009, 20, 335–342. [Google Scholar] [CrossRef]
  61. Blokhuis, H.J.; Jones, R.B.; Geers, R.; Miele, M.; Veissier, I. Measuring and Monitoring Animal Welfare: Transparency in the Food Product Quality Chain. Anim. Welf. 2003, 12, 445–455. [Google Scholar] [CrossRef]
  62. Daillant, B.; Issanchou, S. Influence of Sugar and Fat Contents on Preference for Cream Cheese: A Preliminary Study. Food Qual. Prefer. 1993, 4, 133–139. [Google Scholar] [CrossRef]
  63. Aaron, J.I.; Mela, D.J.; Evans, R.E. The Influences of Attitudes, Beliefs and Label Information on Perceptions of Reduced-Fat Spread. Appetite 1994, 22, 25–37. [Google Scholar] [CrossRef] [PubMed]
  64. Napolitano, F.; Braghieri, A.; Caroprese, M.; Marino, R.; Girolami, A.; Sevi, A. Effect of Information about Animal Welfare, Expressed in Terms of Rearing Conditions, on Lamb Acceptability. Meat Sci. 2007, 77, 431–436. [Google Scholar] [CrossRef] [PubMed]
  65. Napolitano, F.; Caporale, G.; Carlucci, A.; Monteleone, E. Effect of Information about Animal Welfare and Product Nutritional Properties on Acceptability of Meat from Podolian Cattle. Food Qual. Prefer. 2007, 18, 305–312. [Google Scholar] [CrossRef]
  66. Caporale, G.; Monteleone, E. Influence of Information about Manufacturing Process on Beer Acceptability. Food Qual. Prefer. 2004, 15, 271–278. [Google Scholar] [CrossRef]
  67. Kihlberg, I.; Johansson, L.; Langsrud, Ø.; Risvik, E. Effects of Information on Liking of Bread. Food Qual. Prefer. 2005, 16, 25–35. [Google Scholar] [CrossRef]
  68. Cardello, A.V.; Sawyer, F.M. Effects of Disconfirmed Consumer Expectations on Food Acceptability. J. Sens. Stud. 1992, 7, 253–277. [Google Scholar] [CrossRef]
  69. Hayes, D.J.; Shogren, J.F.; Shin, S.Y.; Kliebenstein, J.B. Valuing Food Safety in Experimental Auction Markets. Am. J. Agric. Econ. 1995, 77, 40–53. [Google Scholar] [CrossRef]
  70. Vickrey, W. Counterspeculation, Auctions, and Competitive Sealed Tenders. J. Financ. 1961, 16, 8–37. [Google Scholar] [CrossRef]
  71. McInerney, J. Animal Welfare, Economics and Policy: Report on a Study Undertaken for the Farm & Animal Health Economics Division of Defra. 2004. Available online: https://webarchive.nationalarchives.gov.uk/20110318142209/http://www.defra.gov.uk/evidence/economics/foodfarm/reports/documents/animalwelfare.pdf (accessed on 16 October 2023).
Table 1. Chemical composition of freeze-dried Spirulina.
Proximate Composition%Fatty Acid Profile%Amino Acid Profilemg/100 g Mineralsmg/100 g
Moisture8.29SFA40.11His (E)1108.26Ca83.01
Ash8.78C 16:038.33Arg (E)4105.04Fe25.76
Fat5.84C 18:01.06Thr (E)3094.66K1879.29
Protein64.95MUFA10.07Val (E)4163.97Mg178.44
C 16:1 n-77.28Met (E)975.55Mn2118.37
C 18:1 n-91.41Lys (E)2819.49Na1442.96
PUFA49.82Ile (E)3701.69P933.98
C 18:2 n-623.89Leu (E)5527.34Zn0.75
C 18:3 n-623.50Phe (E)2918.31Cu0.28
C 20:3 n-61.40Asp5675.80
Ser3206.42
Glu9685.14
Gly3055.51
Ala4447.83
Pro2381.84
Cys458.28
Tyr2616.80
SFA, Saturated Fatty Acid; C 16:0, Palmitic Acid; C 18:0, Stearic Acid; MUFA, Monounsaturated Fatty Acid; C 16:1 n-7, Palmitoleic Acid; C 18:1 n-9, Oleic Acid; PUFA, Polyunsaturated Fatty Acid; C 18:2 n-6, Linoleic Acid; C 18:3 n-6, γ-Linolenic Acid; C 20:3 n-6, Dihomo-γ-Linolenic Acid; (E): Essential Amino Acid; His, Histidine; Arg, Arginine; Thr, Threonine; Val, Valine; Met, Methionine; Lys, Lysine; Ile, Isoleucine; Leu, Leucine; Phe, Phenylalanine; Asp, Aspartic Acid; Ser, Serine; Glu, Glutamic acid; Gly, Glycine; Ala, Alanine; Pro, Proline; Cys, Cysteine; Tyr, Tyrosine; Ca, Calcium; Fe, Iron; K, Potassium; Mg, Magnesium; Mn, Manganese; Na, Sodium; P, Phosphorus; Zn, Zinc; Cu, Copper.
Table 2. List of attributes used by the 10-member trained panel for buffalo mozzarella cheese sensory profiling.
AttributeDefinition
Appearance
Colour uniformityOverall colour uniformity
Surface uniformityProduct surface free of holes and granules
Inner colourIntensity of the cheese’s inner colour (from white to ivory)
BrightnessShininess or glossiness of the surface
Number of eyes Average number of eyes in the cheese mass
Uniformity after cuttingCut surface free of holes and granules
Buttermilk release Amount of buttermilk released after cutting
Odour
MilkOdour arising from milk at room temperature
Butter Odour arising from butter at room temperature
YoghurtCharacteristic odour of plain whole yoghurt
Taste
SaltinessFundamental taste associated with sodium chloride
SweetnessFundamental taste associated with sucrose
BitternessFundamental taste associated with quinine
SournessFundamental taste associated with citric acid
Flavour
FruityOdour associated with fruits such as pineapple
WheyCharacteristic whey flavour
Texture
TendernessMinimum force required to chew cheese sample; the lower the force, the greater the tenderness
OilinessAmount of oily/fatty feeling in the mouth during chewing
MoistureMoisture released by the cheese in the mouth during early mastication
GraininessPerception of particles (grains) in the mouth
CohesivenessDegree to which a cheese sample holds together or adheres itself after chewing
ScreechinessFriction of the product against the teeth
Shear consistencyConsistency of the sample during cutting
Table 3. Amino acid profiles of mozzarella cheese from control (C) and Spirulina (S) groups.
Amino Acid (mg/100 g of Sample)GroupSEM
AbbreviationCommon NameCS
Total EAA 6031.107040.75736.86
HisHistidine388.00448.7646.68
ArgArginine552.39633.0955.73
ThrThreonine520.98608.8560.38
ValValine793.33931.31103.68
MetMethionine278.41333.2048.91
LysLysine1039.481226.28134.79
IleIsoleucine645.86753.2983.53
LeuLeucine1176.331373.75155.64
PhePhenylalanine636.33732.2379.97
Total NEAA 7150.258360.97930.26
AspAspartic acid857.741015.54114.24
SerSerine742.36873.1894.15
GluGlutamic acid2868.143361.24389.88
GlyGlycine255.70297.8433.40
AlaAlanine364.21424.5343.46
ProProline1305.201520.22171.65
TyrTyrosine733.81844.6885.86
CysCysteine23.0923.746.92
SEM, Standard Error of the Mean; EAA, Essential Amino Acid; NEAA, Not Essential Amino Acid.
Table 4. Fatty acid (FA) profiles (% on total FAs) and nutritional index of mozzarella cheese from control (C) and Spirulina (S) groups.
Fatty AcidsGroupSEM
AbbreviationCommon NameCS
C4:0Butiric acid2.742.760.034
C6:0Caproic acid1.771.790.024
C8:0Caprylic acid1.051.050.016
C10:0Capric acid2.092.100.029
C12:0Lauric acid2.602.610.035
C14:0Myristic acid11.5011.630.138
C15:0Pentadecylic acid1.071.040.019
C16:0Palmitic acid35.0235.310.397
C16:1 n-7Palmitoleic acid1.721.650.062
C18:0Stearic acid12.7612.590.169
C18:1 trans 9Elaidic acid0.630.640.008
C18:1 trans 11Transvaccenic trans-11-Octadecenoic acid1.621.590.037
C18:1 n-9Oleic acid19.7719.610.236
C18:2 n-6Linoleic acid1.851.900.058
C18:3 n-6γ-Linolenic acid0.220.230.014
C18:2 c9-t11 CLALinolenic acid isomer0.660.640.015
C20:0Eicosanoic acid0.230.220.004
othothers0.140.14.
SFASaturated FA71.6671.920.313
MUFAMonounsaturated FA25.0924.800.266
PUFAPolyunsaturated FA3.253.290.102
n-3 0.4480.4450.023
n-6 2.152.210.069
Nutritional Index
UFA/SFA 0.3950.3900.007
PUFA/SFA 0.0460.0460.002
n-6/n-3 4.8404.9850.161
AIAtherogenic index2.9533.0100.058
TIThrombogenic index3.9103.9650.069
h/HHipocholesterolemic/hypercholesterolemic ratio0.4680.4630.010
SEM, Standard Error of the Mean.
Table 5. Mineral contents of mozzarella cheese from control (C) and Spirulina (S) groups.
Mineral (mg/100 g of Sample)GroupSEM
AbbreviationCommon NameCS
CaCalcium248.093248.22825.388
FeIron0.3230.2850.037
KPotassium32.43525.5705.371
MgMagnesium13.93312.5580.788
MnManganese19.88016.3654.724
NaSodium93.263101.71810.848
PPhosphorus188.253185.24514.608
ZnZinc1.7731.6150.224
CuCopper0.1430.0950.020
SEM, Standard Error of the Mean.
Table 6. Individual VOCs and class levels expressed as area unit ((AU) × 104/g of product) in mozzarella cheese from control (C) and Spirulina (S) groups.
VOCsRTMatch FactorMZGroupSEMp
CS
Aldehyde 201.38128.3044.870.2934
Propanal, 2-methyl-4.493.6724.441.171.980.2872
Pentanal12.195.2589.592.582.230.0684
Hexanal18.598.55661.6253.0619.680.7690
Benzeneacetaldehyde30.285.49117.490.7110.770.3130
Heptanal23.596.5705.276.612.180.6784
Benzaldehyde26.798.710644.8759.0321.520.6581
Butanal, 3-methyl-8.997.25844.372.3018.280.1547
Butanal, 2-methyl-9.594.05813.732.848.110.3791
Ketone 451.35239.79169.090.4104
2,3-Pentanedione12.590.91003.944.781.590.7216
Cyclobutanone, 2,2,3-trimethyl-14.792.1553.331.501.100.2816
2-Heptanone23.297.95824.2357.5626.070.4008
2-Butanone6.091.5722.224.111.000.2296
Acetoin14.996.245406.57158.01155.260.3008
2-Pentanone11.895.1863.824.361.490.8083
Cyclohexanone23.987.7980.470.400.180.8010
2-Hydroxy-3-pentanone20.390.4453.932.991.090.5653
2-Octanone27.490.6580.190.480.160.2730
2-Nonanone31.295.8583.665.601.510.3988
Alcohol 498.54303.11232.630.5742
1-Propanol, 2-methyl-8.496.24314.256.738.700.5634
1-Pentanol17.697.95512.1622.641.760.0057
1-Hexanol22.698.15615.3139.6412.490.2174
2-Heptanol23.788.8452.752.341.460.8489
Phenylethyl Alcohol33.186.39181.301.6645.330.2702
Isopropyl Alcohol10.886.14510.5832.6016.280.3758
1-Hexanol, 4-methyl-26.893.4700.761.760.300.0563
2-Ethyl-1-hexanol29.087.9572.102.020.310.8595
Cyclobutanol1.985.84496.12124.0151.810.7166
1-Propanol5.094.3590.860.820.290.9331
1-Butanol, 3-methyl-15.899.055249.0449.89108.720.2428
1-Butanol, 2-methyl-16.098.35733.0817.8416.380.5351
1-Heptanol26.889.8550.591.170.220.1058
Ester 243.88157.2657.080.3245
Butanoic acid, ethyl ester18.096.68818.177.2510.010.4699
Acetic acid, butyl ester18.888.25645.5436.3822.320.7815
1-Butanol, 3-methyl-, acetate21.997.15511.8710.548.250.9129
Hexanoic acid, ethyl ester27.096.18815.864.1711.110.4846
Sulphuric acid dibutyl ester4.188.25642.0848.2715.070.7813
CH3C(O)OCH(CH3)C(O)CH3 (Acetoin acetate)24.190.5870.310.520.300.6337
n-Caproic acid vinyl ester27.087.39910.965.036.350.5337
Propanoic acid, pentyl ester30.785.9700.430.420.100.9127
Acetic acid ethenyl ester5.896.38635.5521.5011.360.4156
Ethyl Acetate6.298.17039.1811.9621.200.3987
Propanoic acid, ethyl ester12.597.75717.047.967.800.4419
n-Propyl acetate12.897.4611.311.860.860.6696
Isobutyl acetate16.693.8732.310.420.510.0471
1-Butanol, 2-methyl-, acetate22.089.0702.930.871.630.4077
Acetic acid, 2-phenylethyl ester36.990.21043.710.150.170.0048
Aromatic hydrocarbons 308.86244.9917.460.0414
D-Limonene27.798.29328.3225.514.650.6841
Styrene22.592.11045.865.280.790.6187
Toluene15.699.091253.91195.2216.290.0436
Ethylbenzene20.898.6916.716.150.850.6537
Benzene, 1,3-dimethyl-21.299.29114.0512.841.600.6118
Hydrocarbons 426.30330.3973.770.3934
Hexane, 2,2-dimethyl-8.797.15716.2215.322.380.7976
Dodecane33.398.55756.3732.227.550.0644
Cyclopentane3.892.3552.242.430.490.8032
Heptane9.597.41007.2810.654.790.6361
Undecane29.897.3856.473.981.260.2131
n-Hexane4.598.85780.41101.1725.070.5796
Heptane, 2,2-dimethyl-25.991.2576.213.161.950.3107
Undecane, 2,8-dimethyl-29.687.6710.501.630.640.2670
Pentane, 3,3-diethyl-30.786.6570.480.530.180.8647
Tridecane36.598.35731.3918.244.340.0761
Heptane, 4-methyl-14.496.6705.365.103.190.9554
Cyclopentane, 1-ethyl-2-methyl-16.189.255106.157.8565.740.3311
Octane16.495.7856.897.101.200.9030
Heptane, 2,3-dimethyl-19.692.1840.550.810.210.4062
Octane, 4-methyl-19.997.3853.293.451.990.9558
Decane26.094.3575.524.341.350.5606
Decane, 4-methyl-26.491.9712.192.381.250.9184
Nonane, 2,6-dimethyl-26.691.0712.262.661.380.8474
Decane, 2,4-dimethyl-28.391.6851.361.900.380.3632
3-Ethyl-3-methylheptane28.690.0710.410.620.280.6143
Undecane, 4,7-dimethyl-30.089.3711.872.720.620.3740
Pentane, 2-methyl-3.791.5712.772.290.270.2552
Pentane, 3-methyl-4.196.25780.10100.4024.930.5856
Halogenated hydrocarbons 141.8632.9081.340.3801
Trichloromethane6.897.883141.5832.1781.240.3777
Pentane, 3-bromo-29.187.6710.290.730.430.4955
Nitrogen compounds 10.508.411.740.4297
2-Propen-1-amine25.991.2576.213.291.940.3288
Diazene, dimethyl-3.195.7584.295.121.430.6931
Sulphur compounds 21.7717.449.230.7515
Disulfide, dimethyl14.596.29418.8915.268.440.7711
Dimethyl trisulfide26.293.21262.081.780.780.7956
Dimethyl sulfide3.297.8620.800.400.510.6018
Others 529.14571.37159.960.8581
Dimethyl ether2.792.445157.64131.4592.960.8487
Methylene chloride3.793.7843.823.540.310.5382
1,3-Dioxolane, 2,4,5-trimethyl-13.191.61012.593.600.630.2991
Dimethylphosphinic fluoride10.985.4812.123.270.370.0665
Bicyclo[3.1.1]hept-2-ene, 3,6,6-trimethyl-23.693.09311.4011.131.170.8762
Methane, trimethoxy-6.087.47522.0120.553.090.7500
1-Hexene4.492.05642.2052.7913.130.5891
2,4-Dimethyl-1-heptene19.097.6708.147.374.590.9091
Bicyclo[3.1.0]hex-2-ene, 2-methyl-5-(1-methylethyl)-23.690.69311.4011.131.170.8762
Ethoxyacetylene33.795.9701.070.810.180.3384
Silanediol, dimethyl-17.498.677260.02320.82109.840.7090
tert-Butyl Hydroperoxide19.993.1596.044.401.900.5656
Butanal, 3,3-dimethyl-2-oxo-, hemihydrate34.091.5850.690.510.120.3245
SEM, Standard Error of the Mean.
Table 7. Values (mean ± S.E.) of CIE L*, a*, and b* of the external and internal surfaces of mozzarella cheese from control (C) and Spirulina (S) groups.
External SurfaceInternal Surface
GrouppGroupp
SCSC
L*93.43 ± 0.0292.91 ± 0.04<0.000193.13 ± 0.0692.80 ± 0.150.0410
a*−2.26 ± 0.03−2.13 ± 0.03<0.0001−3.42 ± 0.03−3.13 ± 0.02<0.0001
b*0.62 ± 0.070.41 ± 0.010.0044.14 ± 0.053.39 ± 0.05<0.0001
Table 8. List of attributes assessed by panellists during the quantitative descriptive analysis (QDA) of mozzarella cheeses from control (C) and Spirulina (S) groups.
Sensory AttributeGroupSEMp
CS
Appearance75.7074.283.330.7660
Colour uniformity39.4540.622.610.7540
Surface uniformity53.2140.132.670.0030
Inner colour56.1466.272.700.0160
Eye number23.9327.863.430.4290
Uniformity after cutting58.5558.533.400.9970
Buttermilk release44.1567.323.910.0006
Odour
Milk44.8050.512.850.1730
Butter33.3642.892.220.0070
Yoghurt20.7724.961.680.0940
Taste
Saltiness25.7824.722.900.7980
Sweetness12.8717.721.230.0125
Bitterness12.0416.871.550.0415
Sourness15.5718.792.270.3290
Flavour
Fruity12.8215.172.050.4270
Whey43.6653.772.770.0190
Texture
Tenderness51.4759.022.850.0710
Oiliness28.1244.133.280.0030
Moisture55.7678.712.12<0.0001
Graininess33.0920.592.360.0010
Cohesiveness60.5727.793.57<0.0001
Screechy50.6431.703.970.0030
Shear consistency66.8348.071.78<0.0001
SEM, Standard Error of the Mean.
Table 9. Rating attributed by the consumers (%) to mozzarella cheese from control (C) and Spirulina (S) groups in relation to absence (perceived) or presence (actual) of information and expectation (expected).
Hedonic ScalePerceivedExpectedActual
CSCSCS
Dislike extremely—1000000
Dislike very much—2030020
Dislike moderately—3150200
Dislike slightly—4482205
Neither like nor dislike—54656128
Like slightly—625206191811
Like moderately—7382633293423
Like very much—8192943353234
Like extremely—975118219
Table 10. Mean rating (given by the consumers) during the three hedonic tests of mozzarella cheese from control (C) and Spirulina (S) groups.
AcceptabilityGroupp
CS
Perceived (P)6.816.430.0903
Expected (E)7.447.070.1034
Actual (A)6.857.290.0508
P-E−0.63 *−0.64 *
A-P0.040.86 **
A-E−0.590.22
* p < 0.05; ** p < 0.01.
Disclaimer/Publisher’s Note: The statements, opinions and data contained in all publications are solely those of the individual author(s) and contributor(s) and not of MDPI and/or the editor(s). MDPI and/or the editor(s) disclaim responsibility for any injury to people or property resulting from any ideas, methods, instructions or products referred to in the content.

