
Characterisation of the Enzymatically Extracted Oat Protein Concentrate after Defatting and Its Applicability for Wet Extrusion

Abstract
:1. Introduction
2. Materials and Methods
2.1. Raw Materials
2.2. Chemical Characterization
2.3. Oat Protein Extraction
2.4. Oil Extraction by Ethanol
2.5. Oil Extraction by Supercritical Carbon Dioxide
2.6. Protein Solubility Index of Defatted Oat Protein Concentrate
2.7. Water/Oil Holding Capacity
2.8. Foaming
2.9. Molecular Weight Determination
2.10. Extrusion
2.10.1. Raw Material Preparing
2.10.2. Extrusion Process
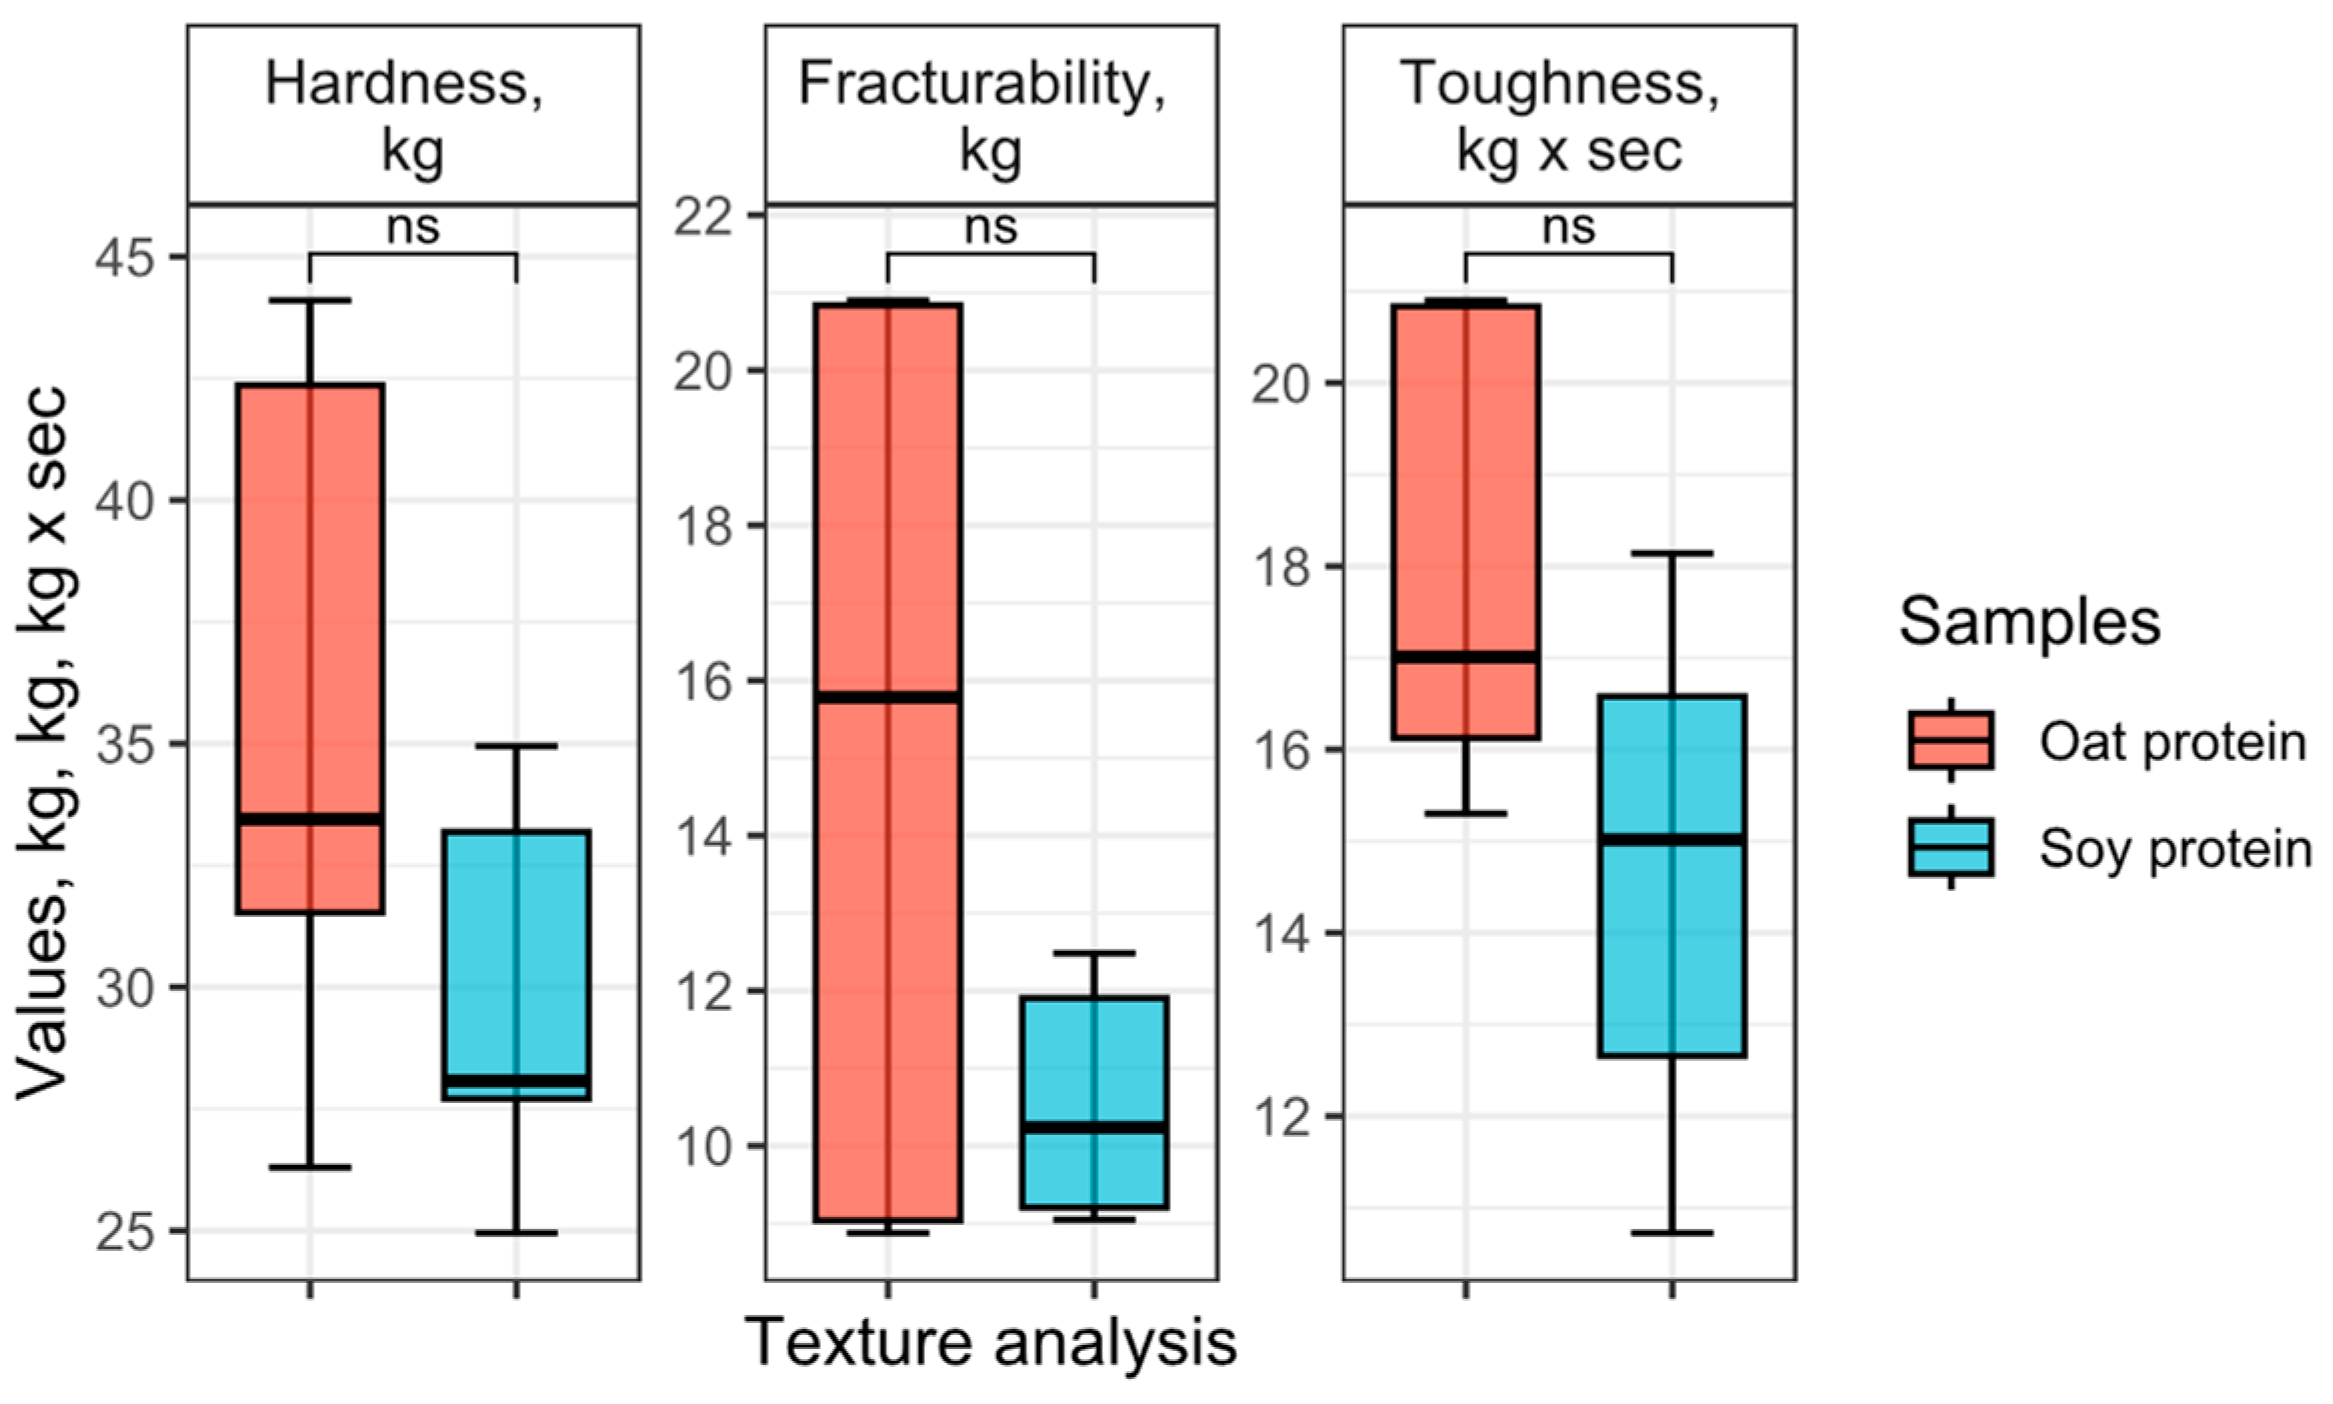
2.11. Textural Analysis
2.12. Colour Analysis
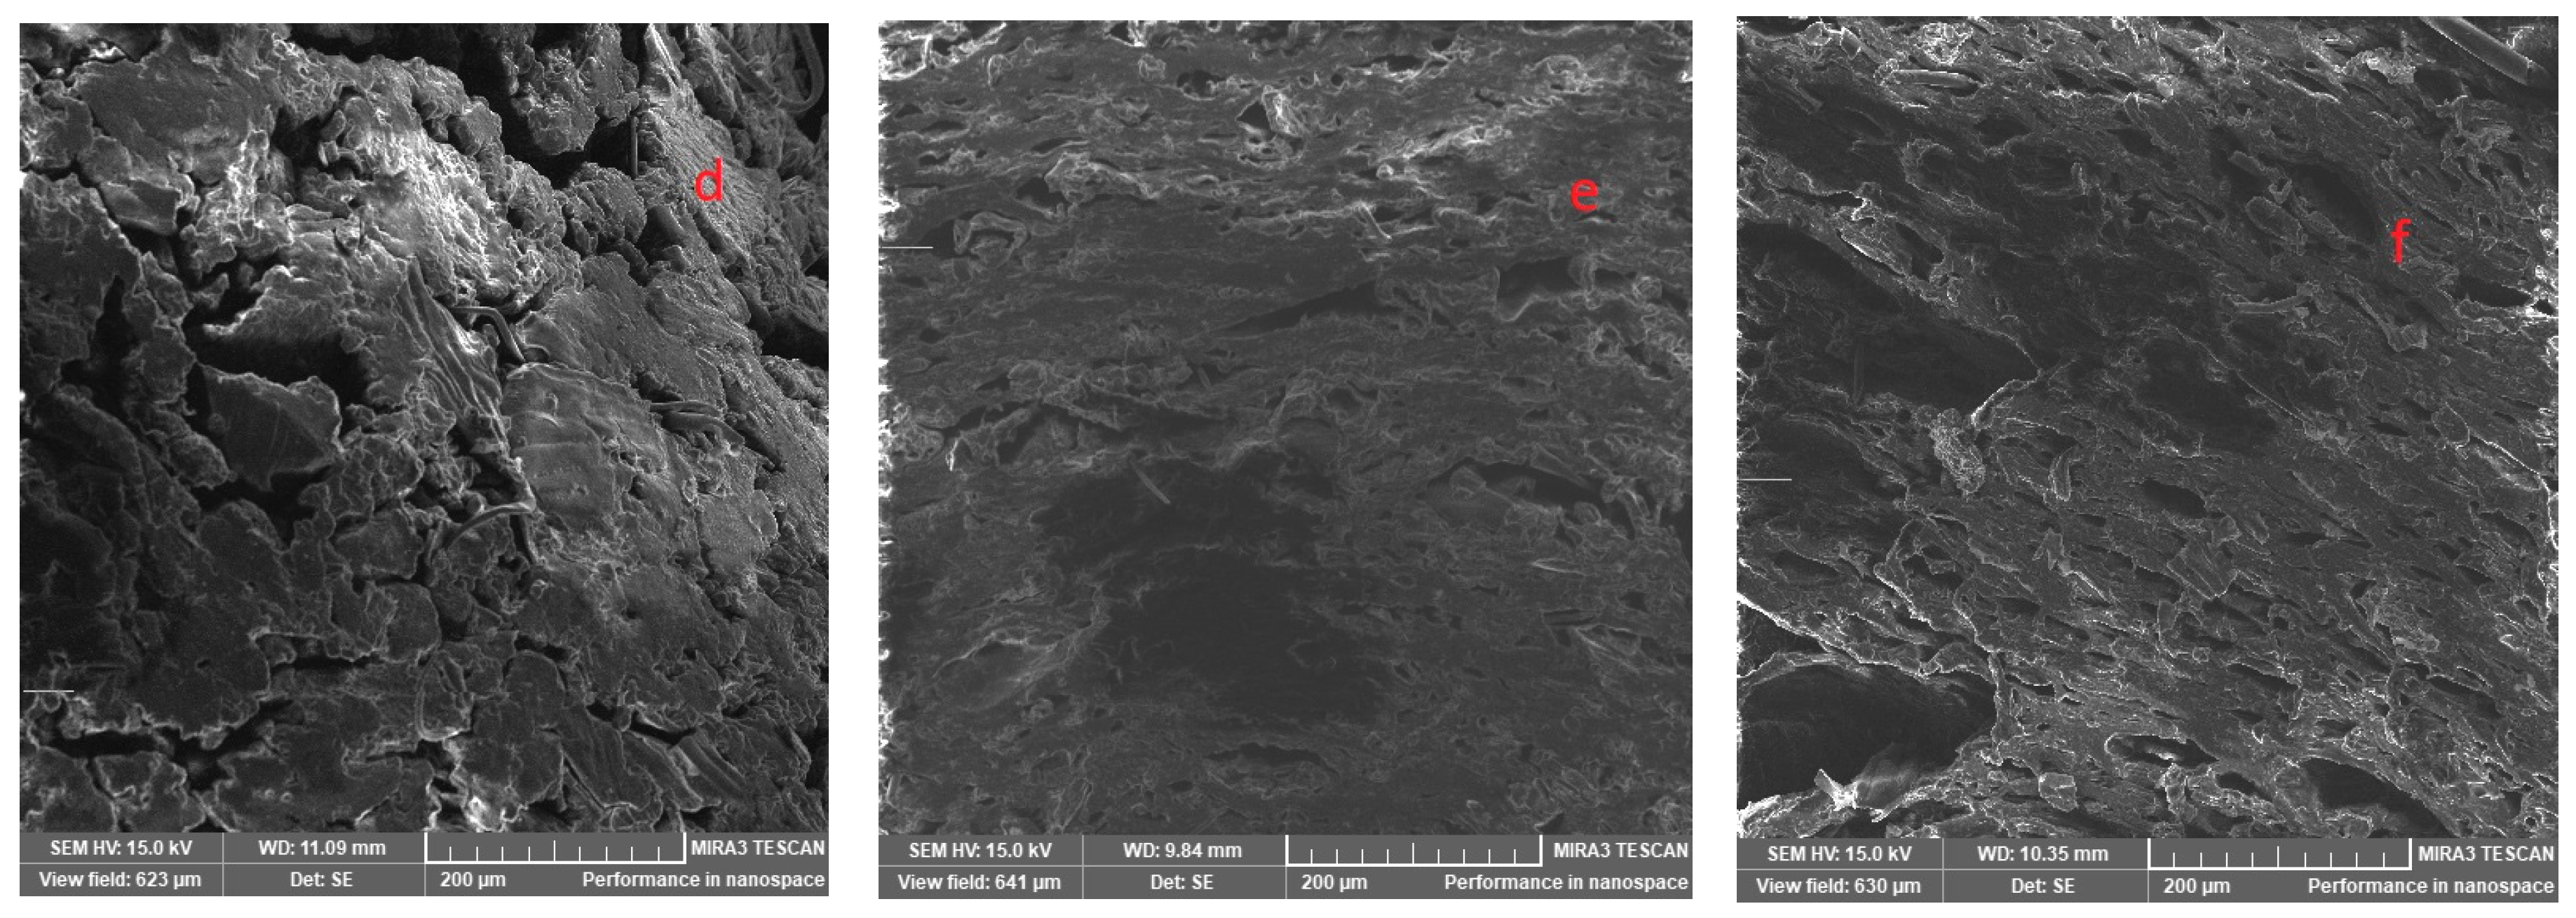
2.13. Scanning Electron Microscope
2.14. Statistical Analysis
3. Results
3.1. Protein Extraction
3.2. Oil Extraction
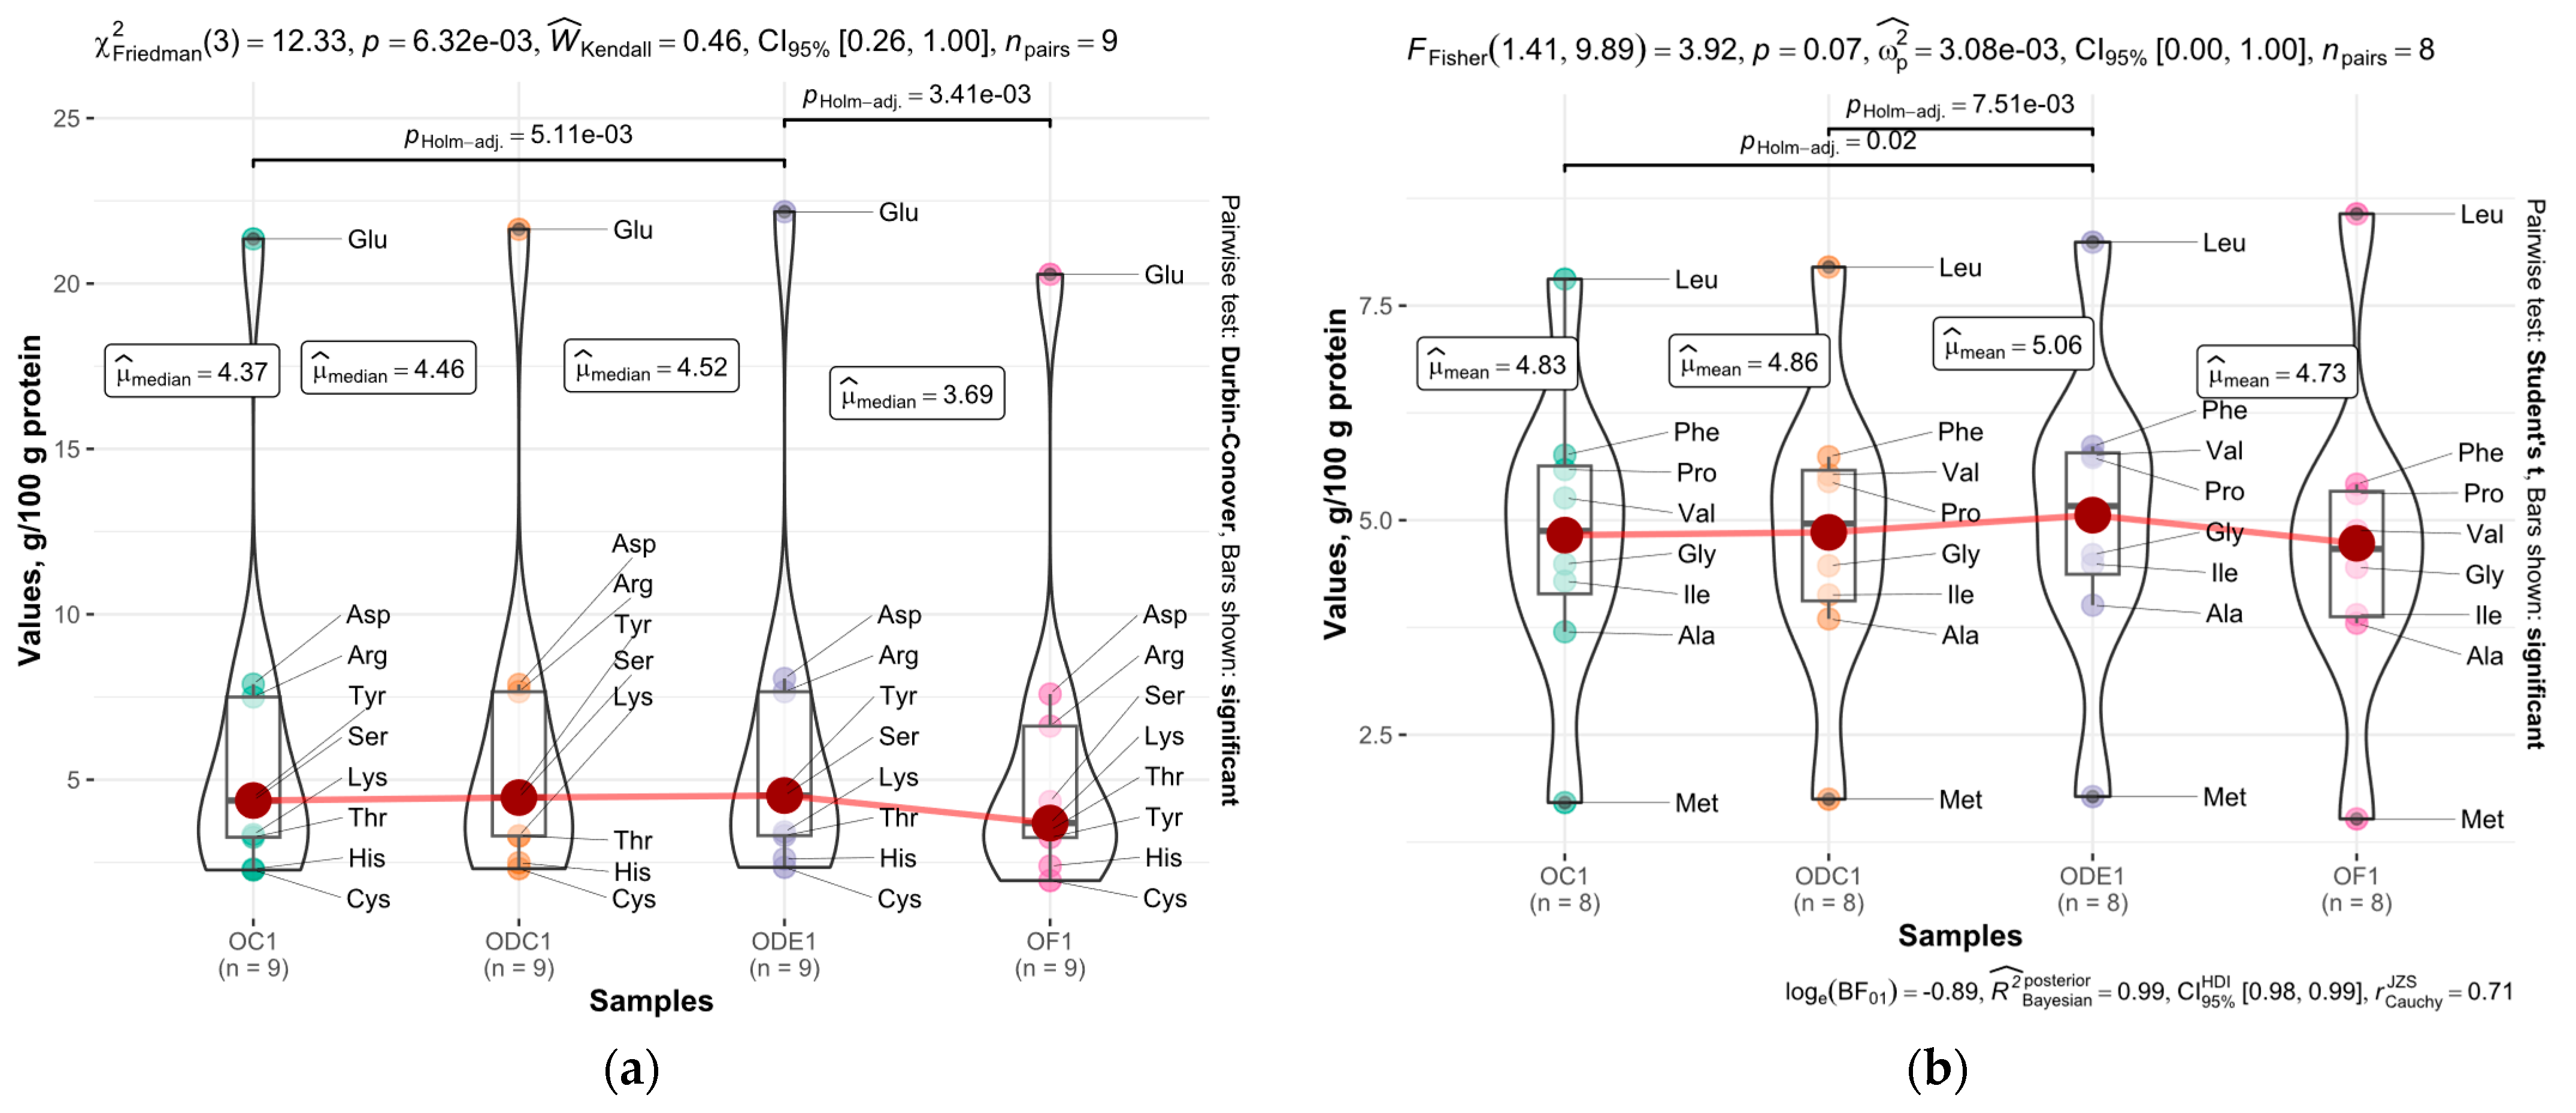
3.3. Amino Acids
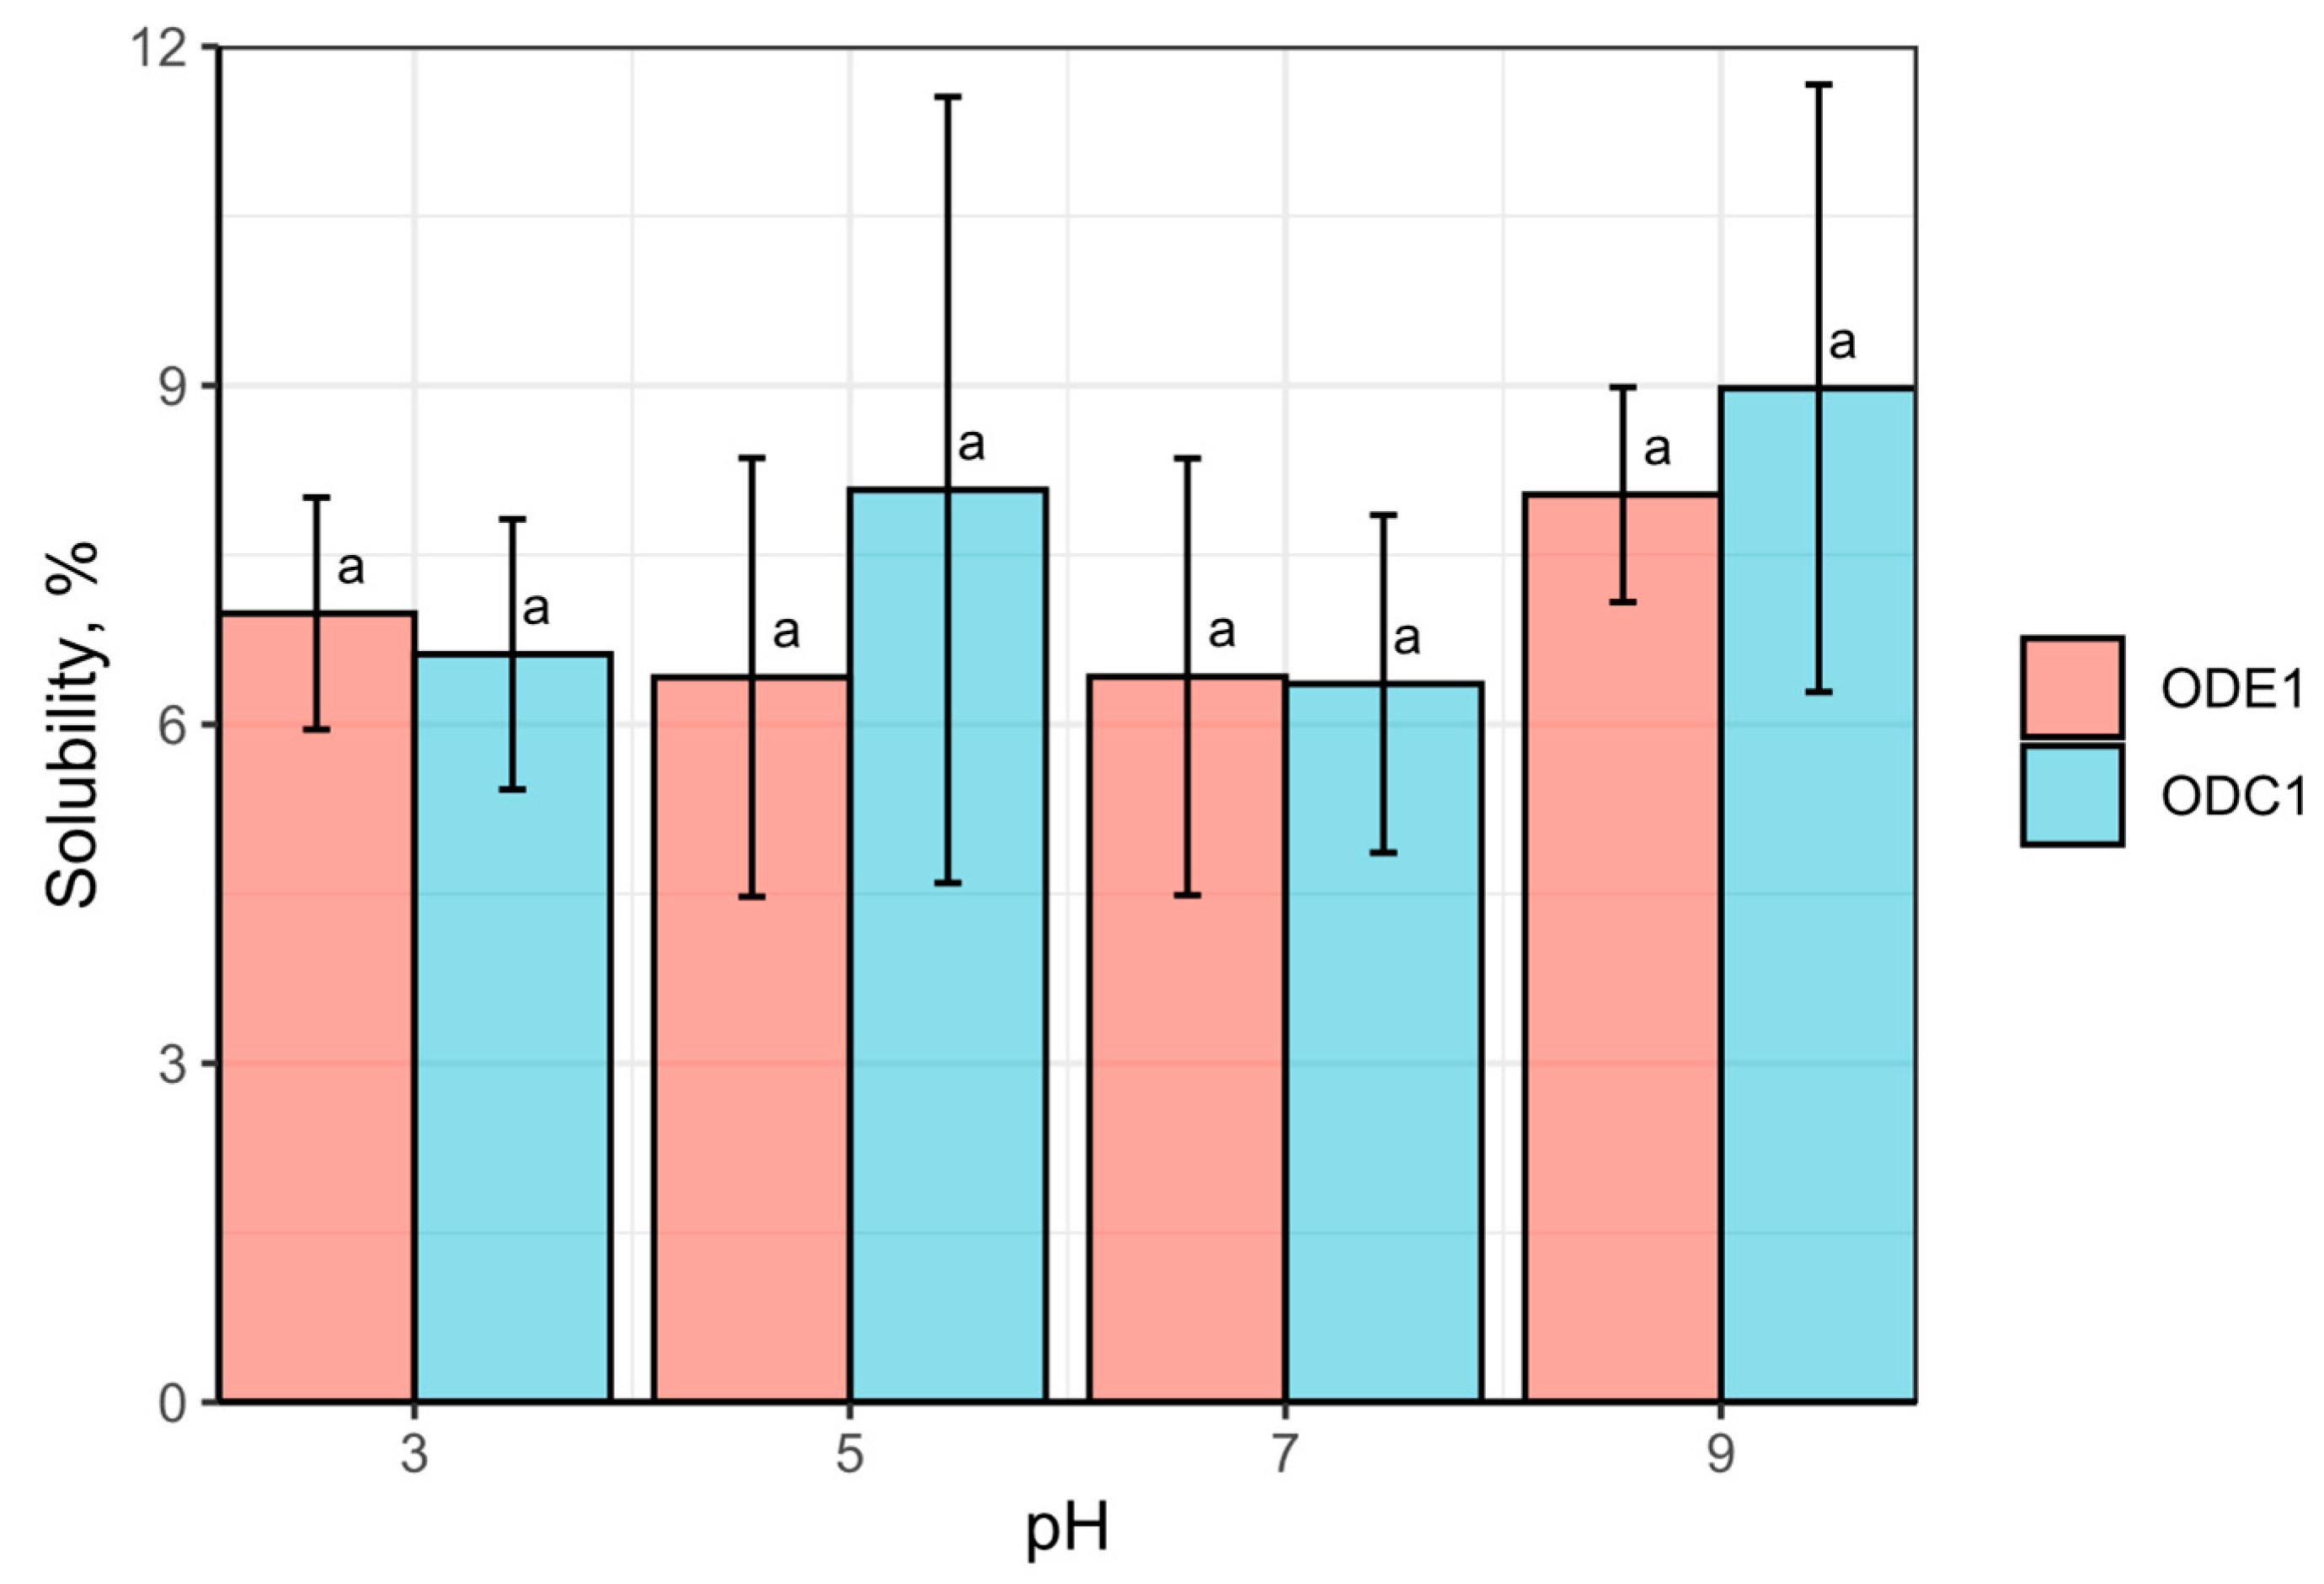
3.4. Protein Solubility
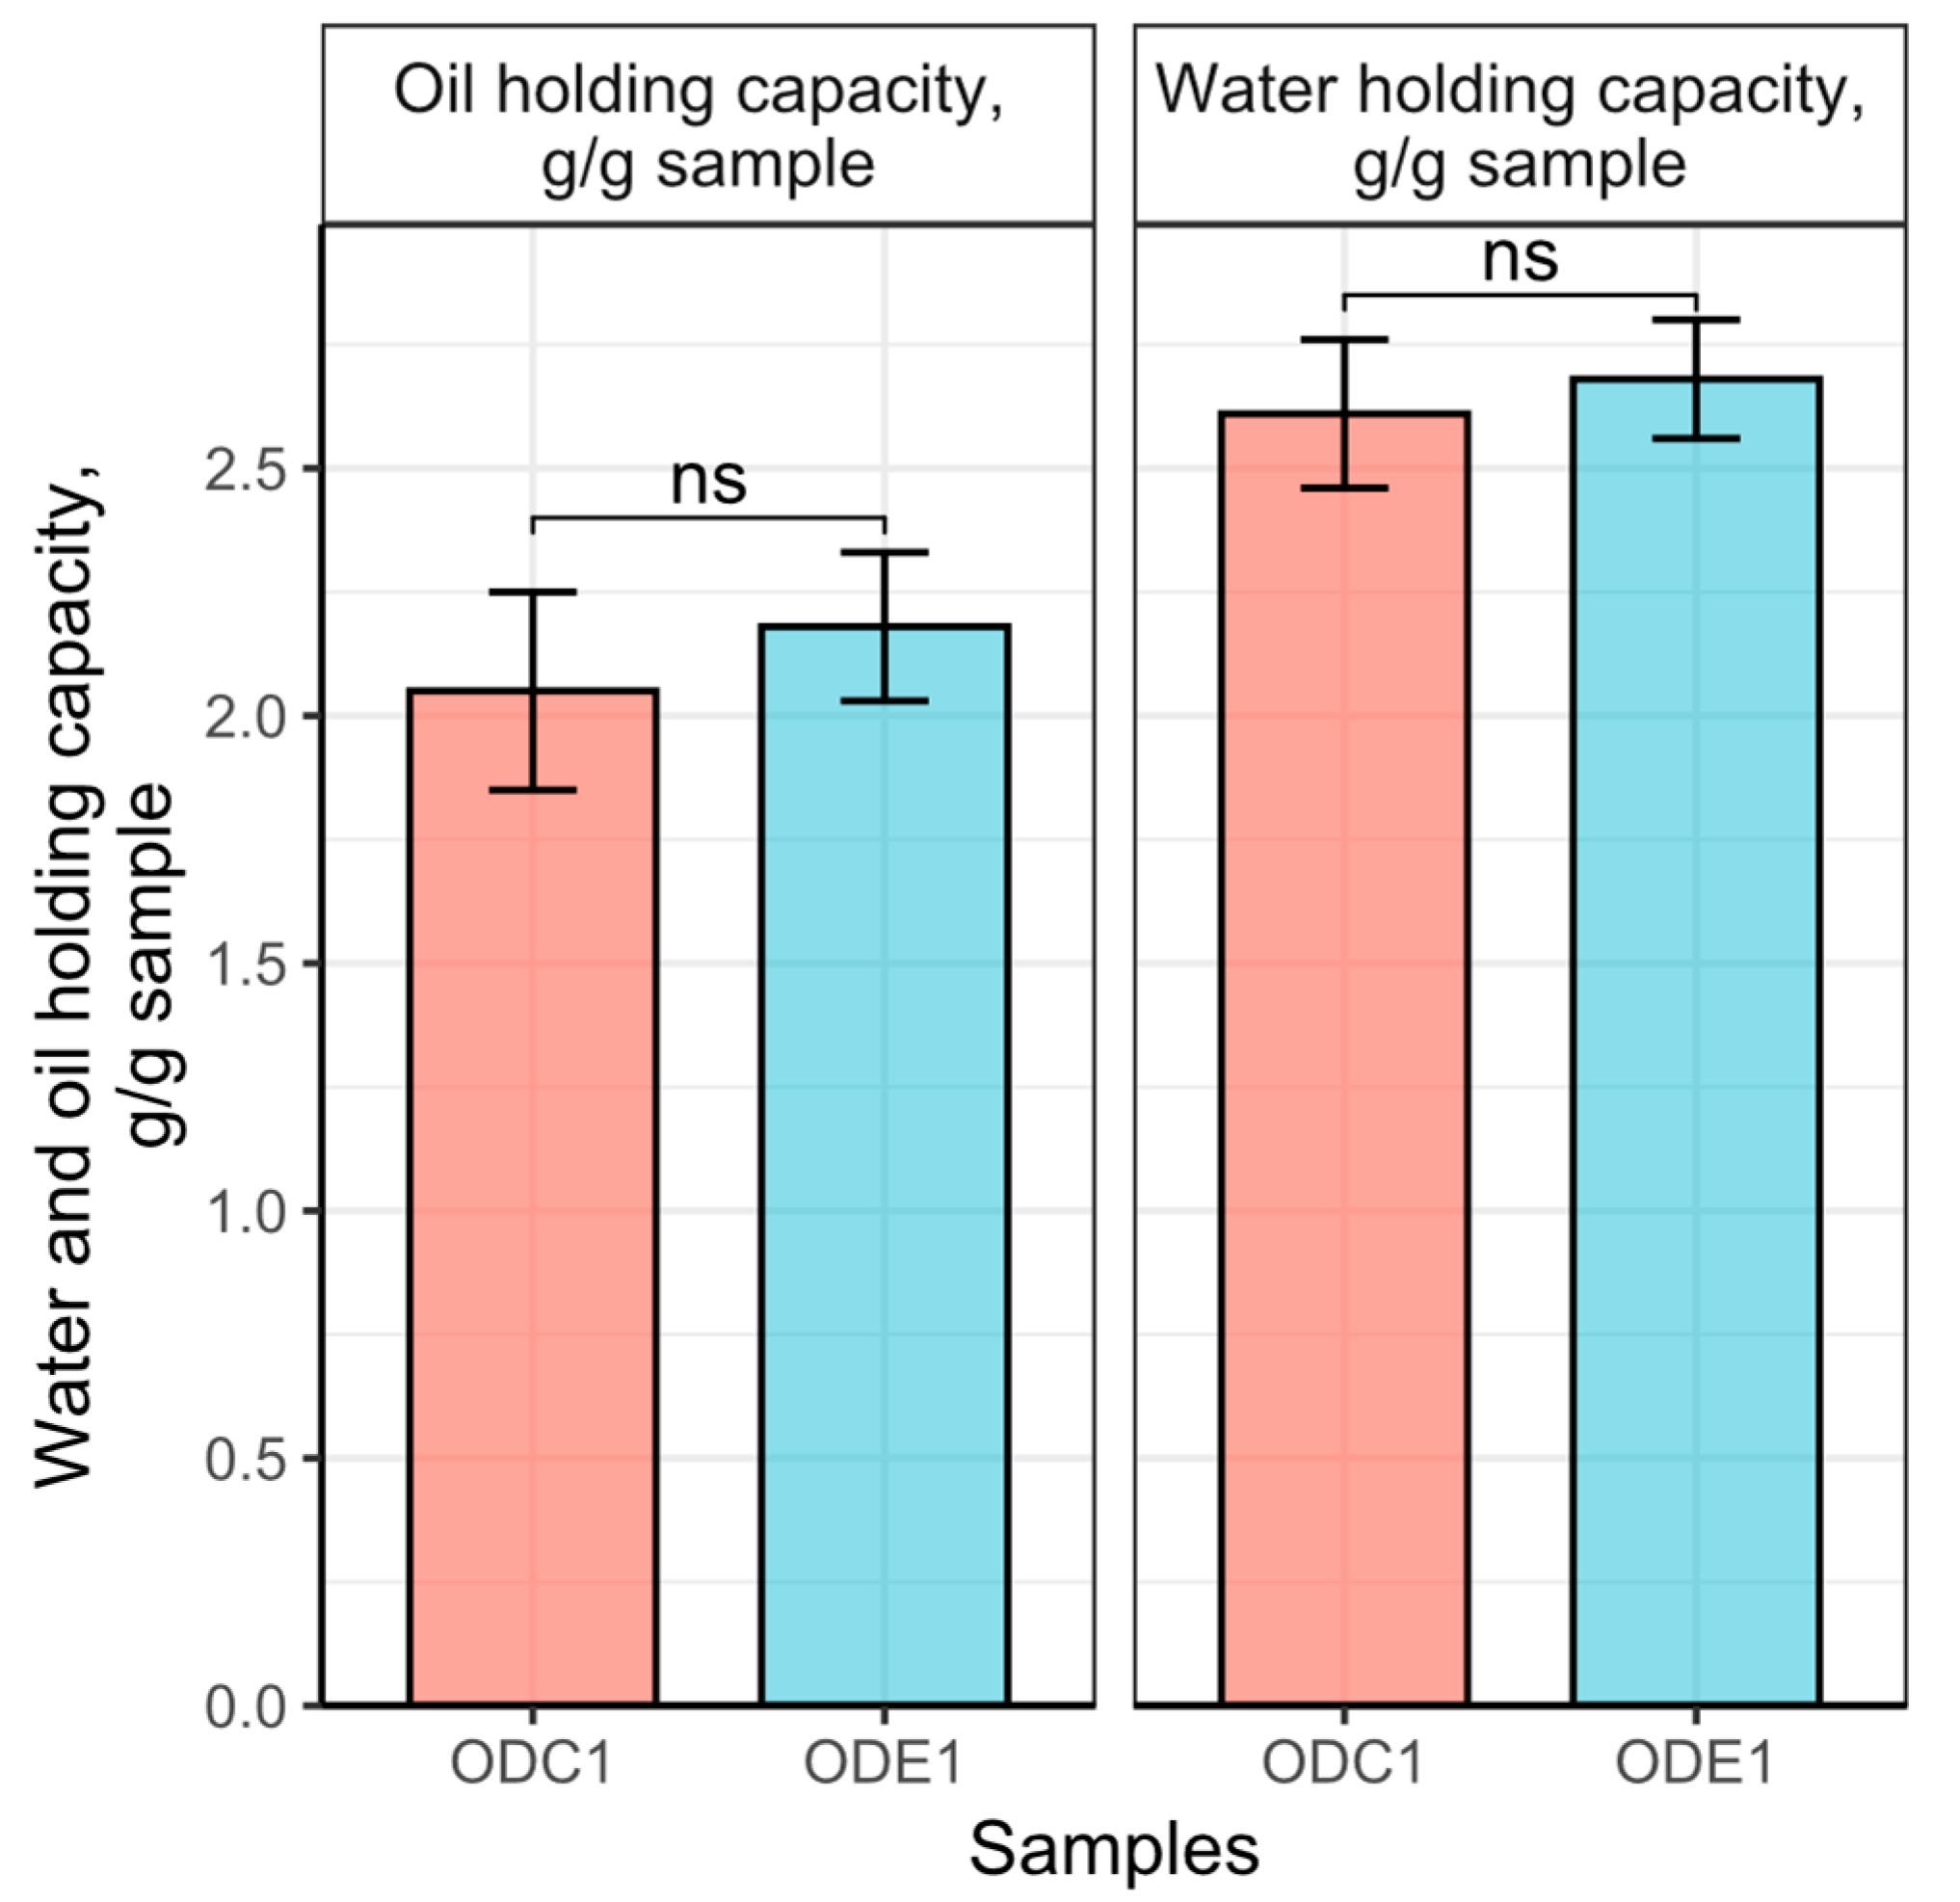
3.5. Water and Oil Holding Capacity
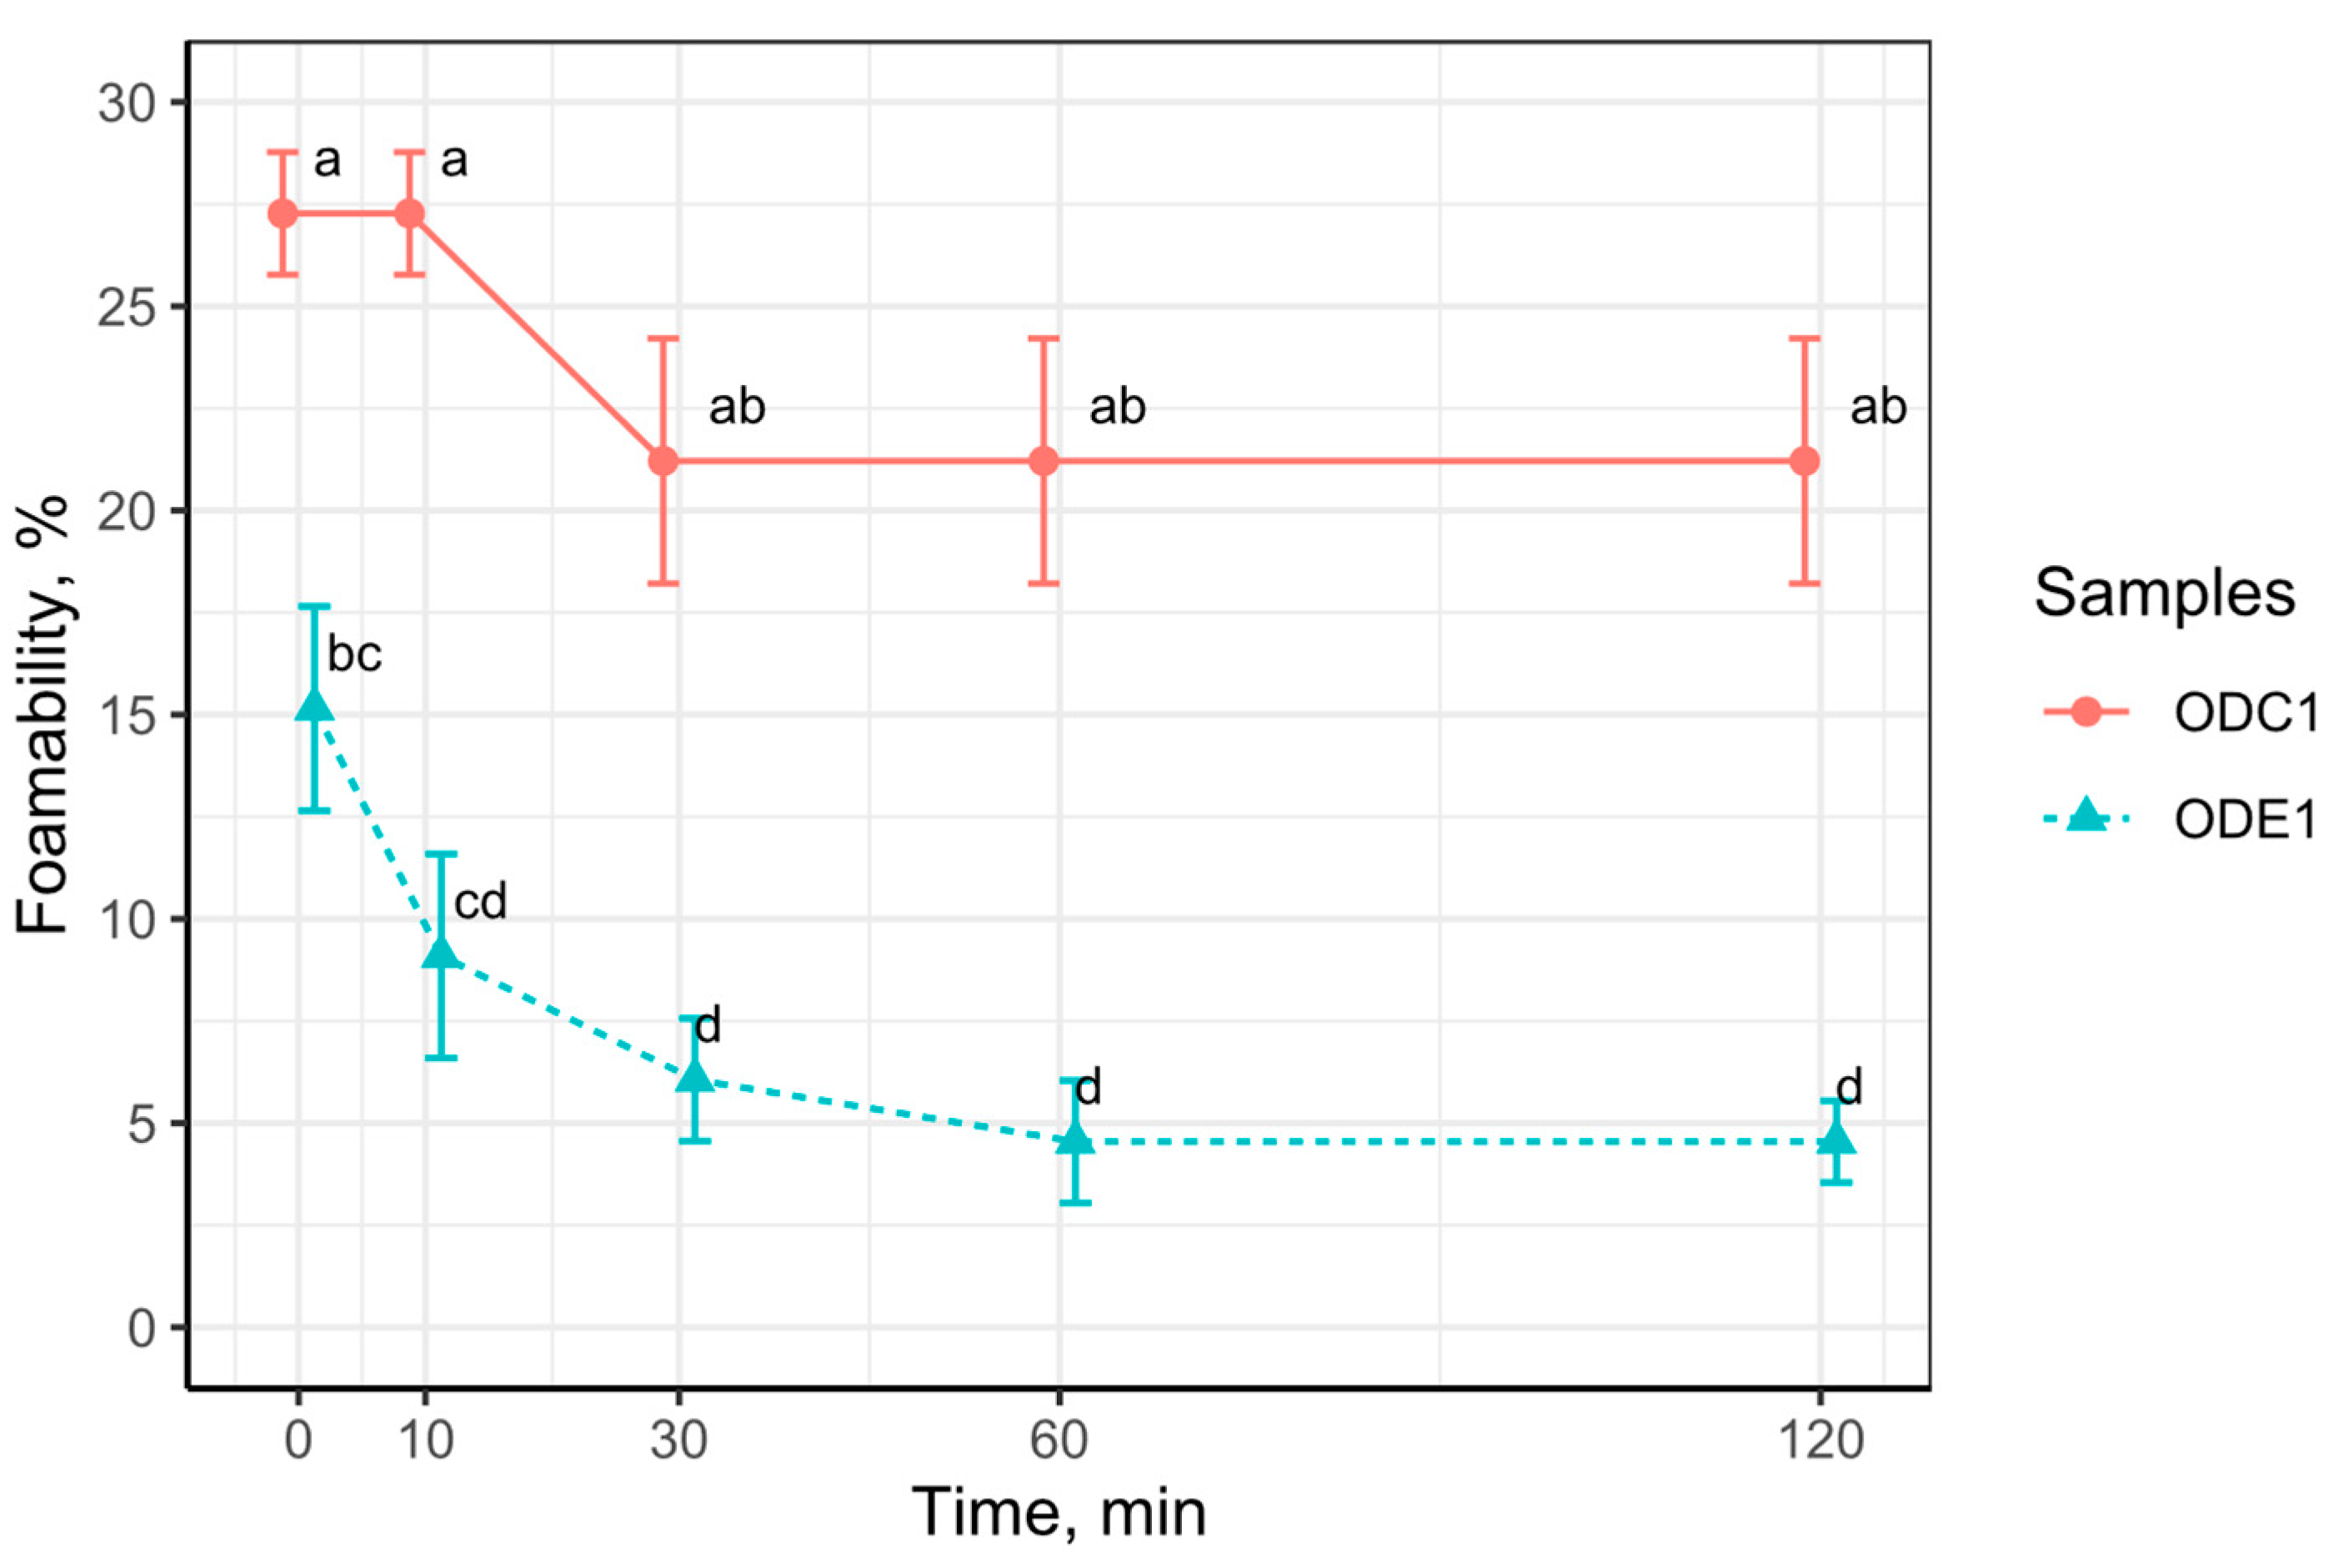
3.6. Foamability
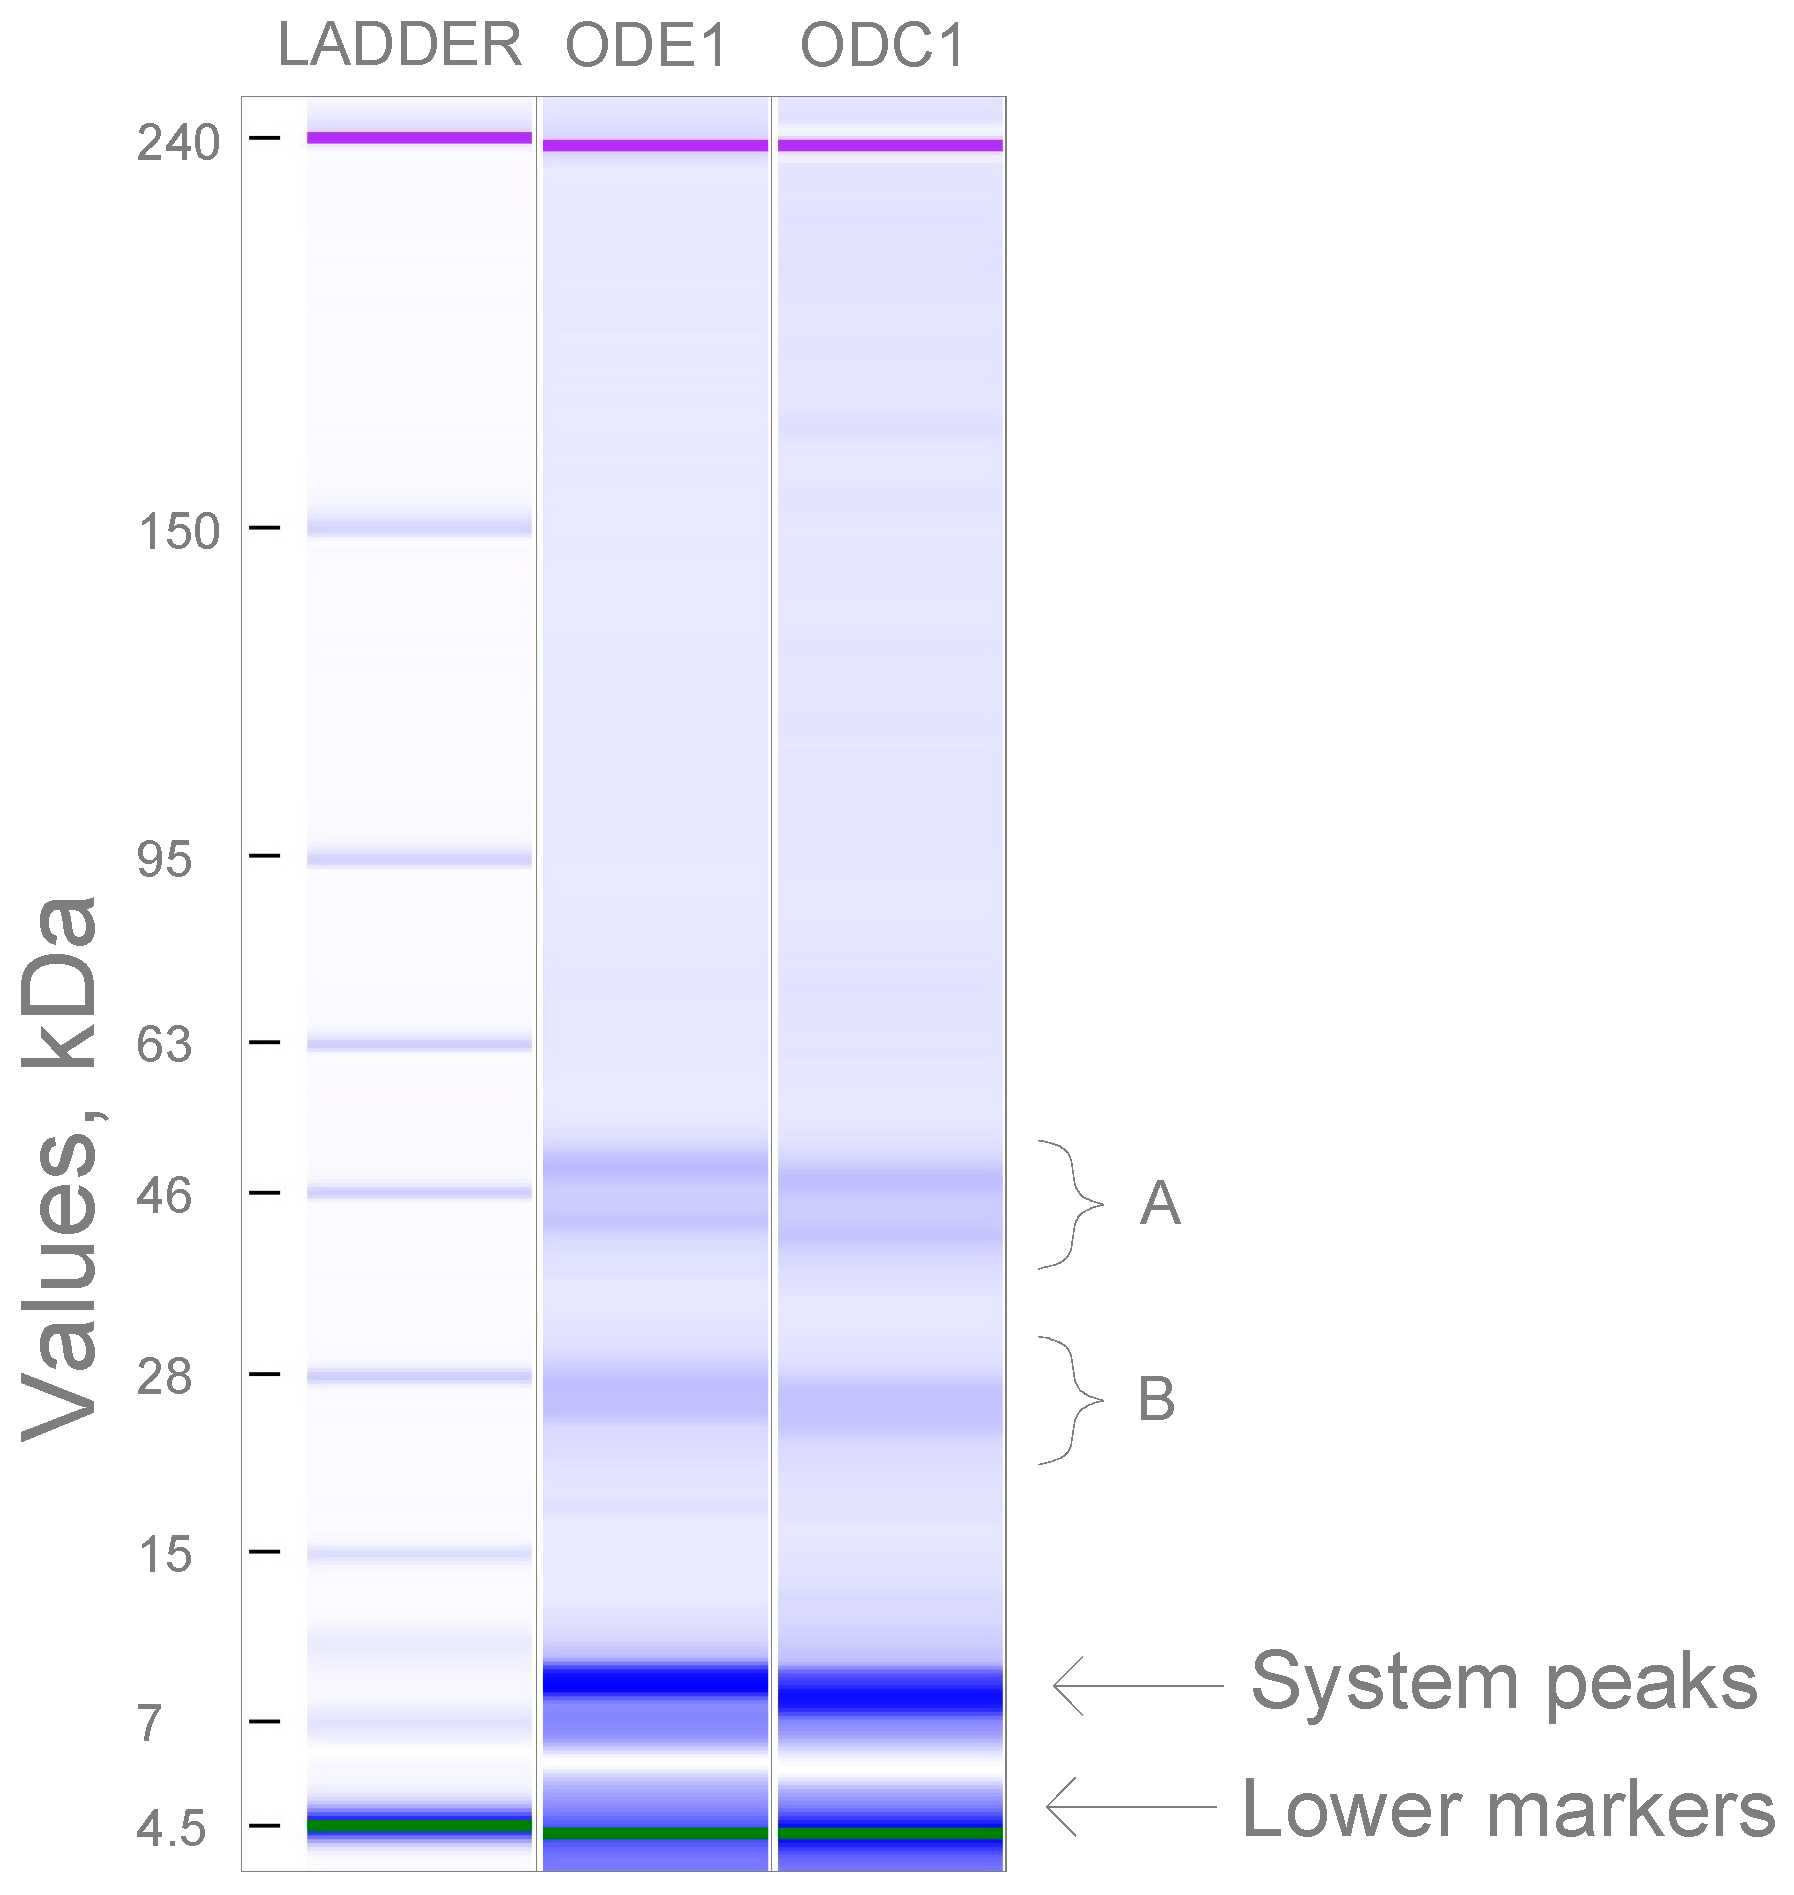
3.7. Molecular Weight of Oat Protein Concentrate
3.8. Extrusion
3.9. Colour
3.10. Texture of the Extrudate
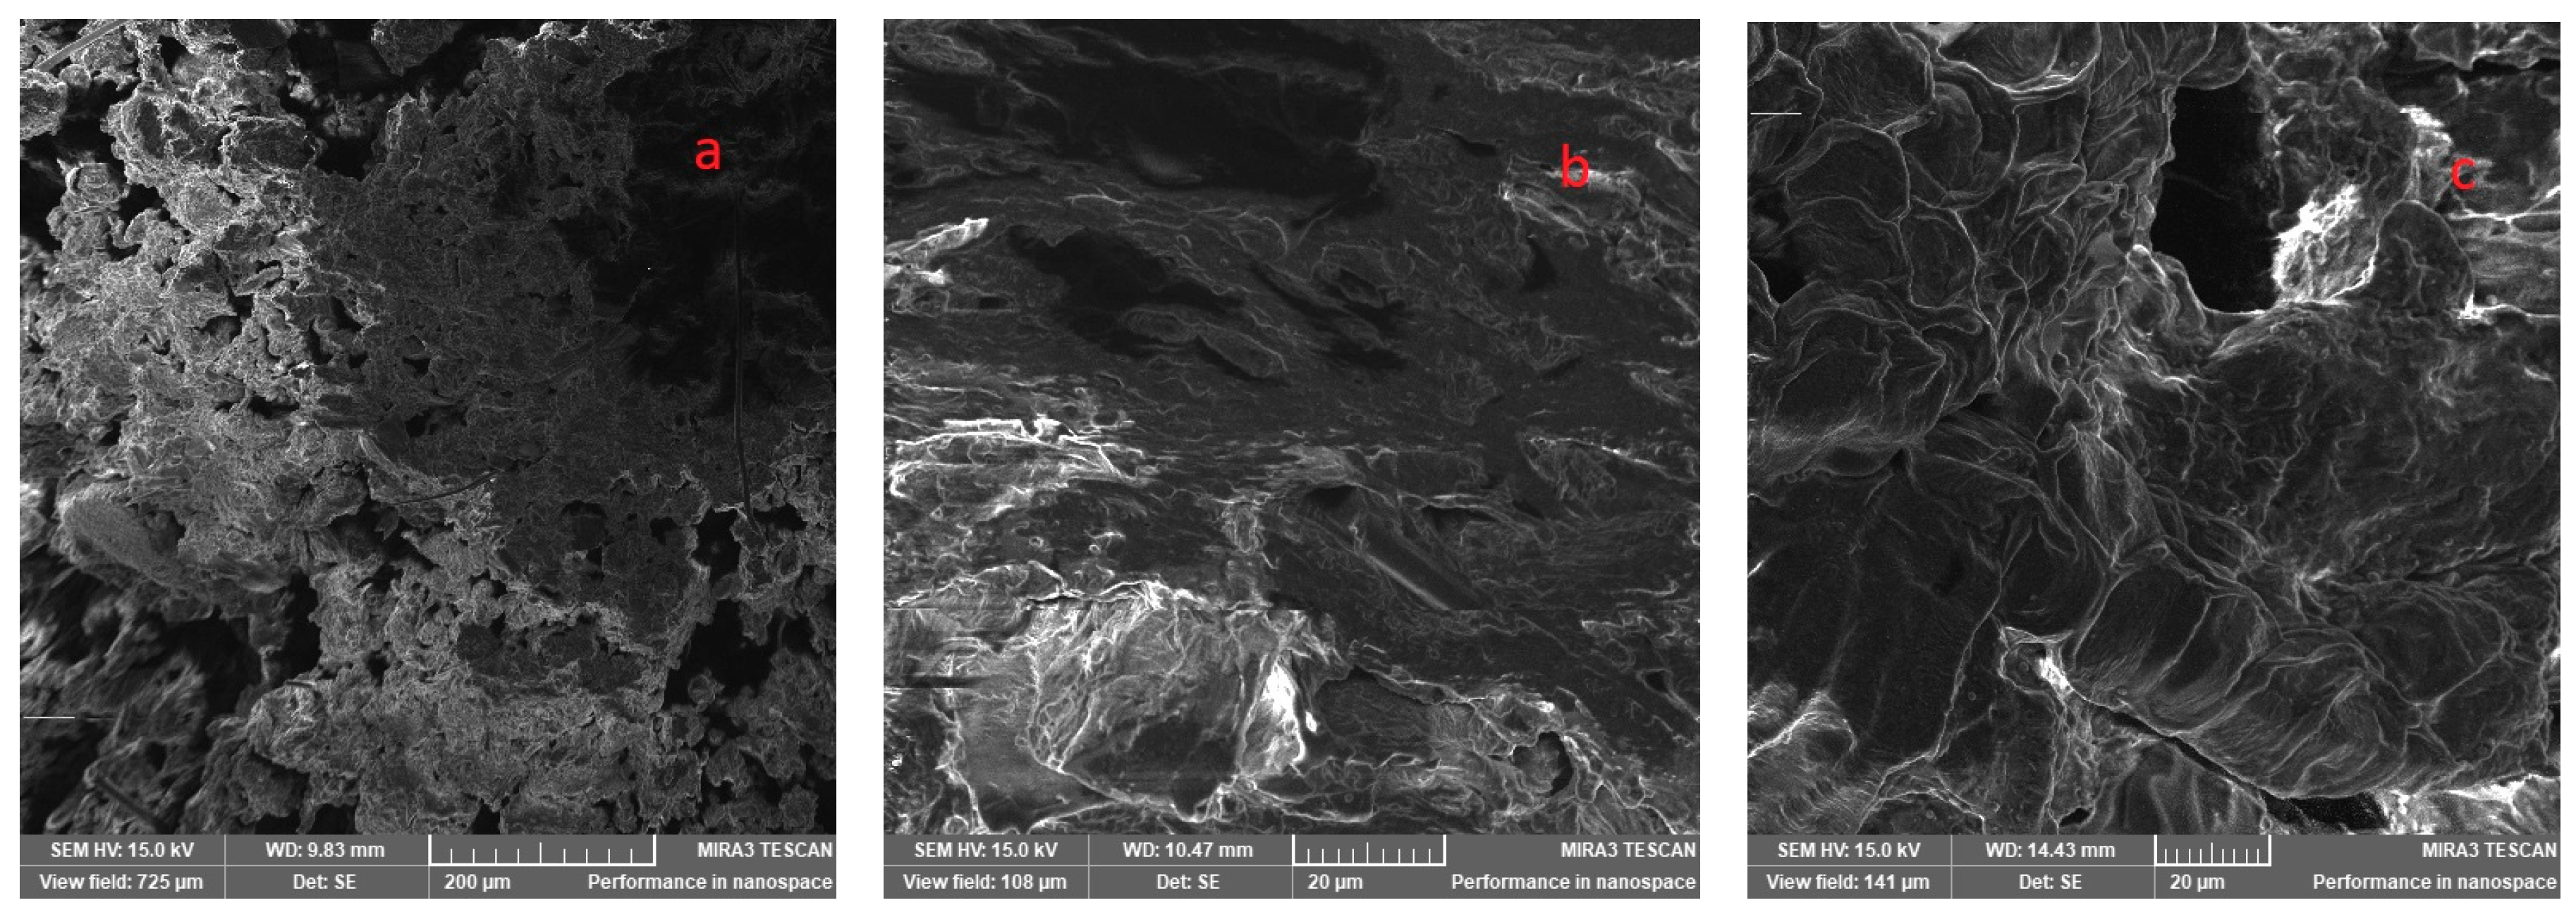
3.11. Scanning Electron Microscope
4. Conclusions
Author Contributions
Funding
Data Availability Statement
Acknowledgments
Conflicts of Interest
References
- Osen, R.; Toelstede, S.; Wild, F.; Eisner, P.; Schweiggert-Weisz, U. High Moisture Extrusion Cooking of Pea Protein Isolates: Raw Material Characteristics, Extruder Responses, and Texture Properties. J. Food Eng. 2014, 127, 67–74. [Google Scholar] [CrossRef]
- Wittek, P.; Zeiler, N.; Karbstein, H.P.; Emin, M.A. High Moisture Extrusion of Soy Protein: Investigations on the Formation of Anisotropic Product Structure. Foods 2021, 10, 102. [Google Scholar] [CrossRef] [PubMed]
- Samard, S.; Ryu, G. Physicochemical and Functional Characteristics of Plant Protein-based Meat Analogs. J. Food Process. Preserv. 2019, 43, e14123. [Google Scholar] [CrossRef]
- Pori, P.; Nisov, A.; Nordlund, E. Enzymatic Modification of Oat Protein Concentrate with Trans- and Protein-Glutaminase for Increased Fibrous Structure Formation during High-Moisture Extrusion Processing. LWT 2022, 156, 113035. [Google Scholar] [CrossRef]
- Ahola, H.G.; Sontag-Strohm, T.S.; Schulman, A.H.; Tanhuanpää, P.; Viitala, S.; Huang, X. Immunochemical Analysis of Oat Avenins in an Oat Cultivar and Landrace Collection. J. Cereal Sci. 2020, 95, 103053. [Google Scholar] [CrossRef]
- Liu, J.; Jin, S.; Song, H.; Huang, K.; Li, S.; Guan, X.; Wang, Y. Effect of Extrusion Pretreatment on Extraction, Quality and Antioxidant Capacity of Oat (Avena Sativa L.) Bran Oil. J. Cereal Sci. 2020, 95, 102972. [Google Scholar] [CrossRef]
- Immonen, M.; Chandrakusuma, A.; Sibakov, J.; Poikelispää, M.; Sontag-Strohm, T. Texturization of a Blend of Pea and Destarched Oat Protein Using High-Moisture Extrusion. Foods 2021, 10, 1517. [Google Scholar] [CrossRef]
- Saldanha do Carmo, C.; Varela, P.; Poudroux, C.; Dessev, T.; Myhrer, K.; Rieder, A.; Zobel, H.; Sahlstrøm, S.; Knutsen, S.H. The Impact of Extrusion Parameters on Physicochemical, Nutritional and Sensorial Properties of Expanded Snacks from Pea and Oat Fractions. LWT 2019, 112, 108252. [Google Scholar] [CrossRef]
- Sibakov, J. Processing of Oat Dietary Fibre for Improved Functionality as a Food Ingredient; Aalto University School of Chemical Technology, Aalto University School of Chemical Technology: Espoo, Finland, 2014. [Google Scholar]
- Moisio, T.; Forssell, P.; Partanen, R.; Damerau, A.; Hill, S.E. Reorganisation of Starch, Proteins and Lipids in Extrusion of Oats. J. Cereal Sci. 2015, 64, 48–55. [Google Scholar] [CrossRef]
- Thadavathi, Y.L.N.; Wassén, S.; Kádár, R. In-Line Rheological and Microstroctural Characterization of High Moisture Content Protein Vegetable Mixtures in Single Screw Extrusion. J. Food Eng. 2019, 245, 112–123. [Google Scholar] [CrossRef]
- Kaukovirta-Norja, A.; Myllymäki, O.; Aro, H.; Hietaniemi, V.; Pihlava, J.-M. Method for Fractionating Oat, Products thus Obtained, and Use Thereof. EP2120604, 7 February 2008. [Google Scholar]
- Sibakov, J.; Myllymäki, O.; Holopainen, U.; Kaukovirta-Norja, A.; Hietaniemi, V.; Pihlava, J.M.; Poutanen, K.; Lehtinen, P. Lipid Removal Enhances Separation of Oat Grain Cell Wall Material from Starch and Protein. J. Cereal Sci. 2011, 54, 104–109. [Google Scholar] [CrossRef]
- Sargautis, D.; Kince, T.; Sargautiene, V. Review: Current Trends in Oat Protein Recovery and Utilization in Aqueous Food Systems. Res. Rural. Dev. 2021, 36, 77–83. [Google Scholar]
- Ma, C.Y. Chemical Characterization and Functionality Assessment of Protein Concentrates from Oats. Cereal Chem. 1983, 60, 36–42. [Google Scholar]
- Liu, G.; Li, J.; Shi, K.; Wang, S.; Chen, J.; Liu, Y.; Huang, Q. Composition, Secondary Structure, and Self-Assembly of Oat Protein Isolate. J. Agric. Food Chem. 2009, 57, 4552–4558. [Google Scholar] [CrossRef] [PubMed]
- Cartus, A. D-Amino Acids and Cross-Linked Amino Acids in Food. In Chemical Contaminants and Residues in Food, 2nd ed.; Schrenk, D., Cartus, A., Eds.; Woodhead Publishing: Sawston, UK, 2017; pp. 251–278. ISBN 978-0-08-100674-0. [Google Scholar]
- Karimi, R.; Azizi, M.H.; Xu, Q.; Sahari, M.A.; Hamidi, Z. Enzymatic Removal of Starch and Protein during the Extraction of Dietary Fiber from Barley Bran. J. Cereal Sci. 2018, 83, 259–265. [Google Scholar] [CrossRef]
- Liu, J.; Guan, X.; Zhu, D.; Sun, J. Optimization of the Enzymatic Pretreatment in Oat Bran Protein Extraction by Particle Swarm Optimization Algorithms for Response Surface Modeling. LWT Food Sci. Technol. 2008, 41, 1913–1918. [Google Scholar] [CrossRef]
- Maskan, M.; Altan, A. (Eds.) Advances in Food Extrusion Technology, 1st ed.; CRC Press: Boca Raton, FL, USA, 2012; ISBN 978-1-4398-1521-2. [Google Scholar]
- Capellini, M.C.; Chiavoloni, L.; Giacomini, V.; Rodrigues, C.E.C. Alcoholic Extraction of Sesame Seed Cake Oil: Influence of the Process Conditions on the Physicochemical Characteristics of the Oil and Defatted Meal Proteins. J. Food Eng. 2019, 240, 145–152. [Google Scholar] [CrossRef]
- De Pretto, C.; Tardioli, P.W.; Costa, C.B.B. Assessing Energetic and Available Fuel Demands from a Soybean Biorefinery Producing Refined Oil, Biodiesel, Defatted Meal and Power. Comput. Chem. Eng. 2017, 104, 259–270. [Google Scholar] [CrossRef]
- Toda, T.A.; Sawada, M.M.; Rodrigues, C.E.C. Kinetics of Soybean Oil Extraction Using Ethanol as Solvent: Experimental Data and Modeling. Food Bioprod. Process. 2016, 98, 1–10. [Google Scholar] [CrossRef]
- ISO 6496:1999; Animal Feeding Stuffs — Determination of Moisture and Other Volatile Matter Content. International Organization for Standardization: Geneva, Switzerland, 1999.
- ISO 20483:2013; Cereals and Pulses—Determination of the Nitrogen Content and Calculation of the Crude Protein Content—Kjeldahl Method. International Organization for Standardization: Geneva, Switzerland, 2013.
- ISO 5498:1981; Agricultural Food Products—Determination of Crude Fibre Content—General Method. International Organization for Standardization: Geneva, Switzerland, 1981.
- ISO 6492:1999; Animal Feeding Stuffs—Determination of Fat Content. International Organization for Standardization: Geneva, Switzerland, 1999.
- ISO 13903:2005; Animal Feeding Stuffs—Determination of Amino Acids Content. International Organization for Standardization: Geneva, Switzerland, 2005.
- Morr, C.V.; German, B.; Kinsella, J.E.; Regenstein, J.M.; Buren, J.P.V.; Kilara, A.; Lewis, B.A.; Mangino, M.E. A Collaborative Study to Develop a Standardized Food Protein Solubility Procedure. J. Food Sci. 1985, 50, 1715–1718. [Google Scholar] [CrossRef]
- Sawada, M.M.; Venâncio, L.L.; Toda, T.A.; Rodrigues, C.E.C. Effects of Different Alcoholic Extraction Conditions on Soybean Oil Yield, Fatty Acid Composition and Protein Solubility of Defatted Meal. Food Res. Int. 2014, 62, 662–670. [Google Scholar] [CrossRef]
- Mirmoghtadaie, L.; Kadivar, M.; Shahedi, M. Effects of Succinylation and Deamidation on Functional Properties of Oat Protein Isolate. Food Chem. 2009, 114, 127–131. [Google Scholar] [CrossRef]
- Linly, B.; Mukani, M.; Mariam, N.; Jolien, S.; Arnold, O.; Esther, M.; Gordon, M.; Laurence, D.; Mark, T.; Tawanda, M. Application of Wedge Fracture Test for Texture Analysis in Boiled Sweetpotato (Ipomoea Batatas). Afr. J. Food Sci. 2021, 15, 145–151. [Google Scholar] [CrossRef]
- Ojha, P.; Pathak, G.; Maharjan, S.; Manandhar, U.; Maharjan, S.; Karki, R. Quality and Textural Properties Evaluation of Gluten-Free Biscuit Developed from Maize, Rice, Buckwheat, and Soybean. Bacau 2022, 23, 295–305. [Google Scholar]
- Kirse-Ozolina, A.; Muizniece-Brasava, S.; Veipa, J. Effect of Various Packaging Solutions on the Quality of Hazelnuts in Nut–Dried Fruit Mixes. Food and Agriculture Organization: Rome, Italy, 2019; pp. 216–221. [Google Scholar]
- Zhang, J.; Liu, L.; Jiang, Y.; Faisal, S.; Wang, Q. A New Insight into the High-Moisture Extrusion Process of Peanut Protein: From the Aspect of the Orders and Amount of Energy Input. J. Food Eng. 2020, 264, 109668. [Google Scholar] [CrossRef]
- R Core Team. R: A Language and Environment for Statistical Computing; R Foundation for Statistical Computing: Vienna, Austria, 2022. [Google Scholar]
- Patil, I. Visualizations with Statistical Details: The “ggstatsplot” Approach. JOSS 2021, 6, 3167. [Google Scholar] [CrossRef]
- Wickham, H.; Averick, M.; Bryan, J.; Chang, W.; McGowan, L.D.; François, R.; Grolemund, G.; Hayes, A.; Henry, L.; Hester, J.; et al. Welcome to the Tidyverse. J. Open Source Softw. 2019, 4, 1686. [Google Scholar] [CrossRef] [Green Version]
- Graves, S.; Piepho, H.-P.; Selze, L.; Dorai-Raj, L.S. Multcomp View: Visualizations of Paired Comparisons. R Foundation for Statistical Computing: Vienna, Austria, 2023. [Google Scholar]
- Kassambara, A. Ggpubr: “ggplot2” Based Publication Ready Plots. R Foundation for Statistical Computing: Vienna, Austria, 2023. [Google Scholar]
- RStudio Team. RStudio: Integrated Development Environment for R; R Foundation for Statistical Computing: Vienna, Austria, 2022. [Google Scholar]
- Jing, X.; Yang, C.; Zhang, L. Characterization and Analysis of Protein Structures in Oat Bran: Characterization of Protein Structures. J. Food Sci. 2016, 81, C2337–C2343. [Google Scholar] [CrossRef]
- Peterson, D.M. CHAPTER 8-Storage Proteins. In Oats, 2nd ed.; Webster, F.H., Wood, P.J., Eds.; AACC International Press: Eagan, MA, USA, 2011; pp. 123–142. ISBN 978-1-891127-64-9. [Google Scholar]
- Hu, X.; Wei, Y.; Ren, C.; Zhao, J. Relationship between Kernel Size and Shape and Lipase Activity of Naked Oat before and after Pearling Treatment. J. Sci. Food Agric. 2009, 89, 1424–1427. [Google Scholar] [CrossRef]
- Miller, S.S.; Fulcher, R.G. CHAPTER 5—Microstructure and Chemistry of the Oat Kernel. In Oats, 2nd ed.; Webster, F.H., Wood, P.J., Eds.; AACC International Press: Eagan, MA, USA, 2011; pp. 77–94. ISBN 978-1-891127-64-9. [Google Scholar]
- Doehlert, D.C.; Moreau, R.A.; Welti, R.; Roth, M.R.; McMullen, M.S. Polar Lipids from Oat Kernels. Cereal Chem. J. 2010, 87, 467–474. [Google Scholar] [CrossRef] [Green Version]
- Nagendra, P.M.; Sanjay, K.; Khatokar M, S.; Vismaya, M.; Nanjunda, S.S. Health Benefits of Rice Bran—A Review. Nutr. Food Sci. 2011, 1, 108. [Google Scholar] [CrossRef] [Green Version]
- Capellini, M.C.; Giacomini, V.; Cuevas, M.S.; Rodrigues, C.E.C. Rice Bran Oil Extraction Using Alcoholic Solvents: Physicochemical Characterization of Oil and Protein Fraction Functionality. Ind. Crops Prod. 2017, 104, 133–143. [Google Scholar] [CrossRef]
- Rad, H.B.; Sabet, J.K.; Varaminian, F. Study of Solubility in Supercritical Fluids: Thermodynamic Concepts and Measurement Methods—A Review. Braz. J. Chem. Eng. 2019, 36, 1367–1392. [Google Scholar] [CrossRef] [Green Version]
- Joint WHO/FAO/UNU Expert Consultation. Protein and Amino Acid Requirements in Human Nutrition; FAO, Joint Expert Consultation on Protein and Amino Acid Requirements in Human Nutrition, Weltgesundheitsorganisation, United Nations University, Eds.; WHO Technical Report Series; WHO: Geneva, Switzerland, 2007; ISBN 978-92-4-120935-9. [Google Scholar]
- Vnučec, D.; Kutnar, A.; Goršek, A. Soy-Based Adhesives for Wood-Bonding—A Review. J. Adhes. Sci. Technol. 2017, 31, 910–931. [Google Scholar] [CrossRef]
- Wang, Z.; Zhang, C.; Zhang, T.; Ju, X.; He, R. Effects of Acylation and Glycation Treatments on Physicochemical and Gelation Properties of Rapeseed Protein Isolate. RSC Adv. 2018, 8, 40395–40406. [Google Scholar] [CrossRef] [PubMed] [Green Version]
- Yue, J.; Zhu, Z.; Yi, J.; Lan, Y.; Chen, B.; Rao, J. Structure and Functionality of Oat Protein Extracted by Choline Chloride–dihydric Alcohol Deep Eutectic Solvent and Its Water Binary Mixtures. Food Hydrocoll. 2021, 112, 106330. [Google Scholar] [CrossRef]
- Zhong, L.; Ma, N.; Wu, Y.; Zhao, L.; Ma, G.; Pei, F.; Hu, Q. Characterization and Functional Evaluation of Oat Protein Isolate-Pleurotus Ostreatus β-Glucan Conjugates Formed via Maillard Reaction. Food Hydrocoll. 2019, 87, 459–469. [Google Scholar] [CrossRef]
- Pommie, C.; Levadoux, S.; Sabatier, R.; Lefranc, G.; Lefranc, M.-P. IMGT Standardized Criteria for Statistical Analysis of Immunoglobulin V-REGION Amino Acid Properties. J. Mol. Recognit. 2004, 21, 17–32. [Google Scholar] [CrossRef]
- Averina, E.; Konnerth, J.; D’Amico, S.; van Herwijnen, H.W.G. Protein Adhesives: Alkaline Hydrolysis of Different Crop Proteins as Modification for Improved Wood Bonding Performance. Ind. Crops Prod. 2021, 161, 113187. [Google Scholar] [CrossRef]
- Feng, J.; Berton-Carabin, C.C.; Ataç Mogol, B.; Schroën, K.; Fogliano, V. Glycation of Soy Proteins Leads to a Range of Fractions with Various Supramolecular Assemblies and Surface Activities. Food Chem. 2021, 343, 128556. [Google Scholar] [CrossRef]
- Sargautis, D.; Kince, T. Effect of Enzymatic Pre-Treatment on Oat Flakes Protein Recovery and Properties. Foods 2023, 12, 965. [Google Scholar] [CrossRef] [PubMed]
- Walters, M.E.; Udenigwe, C.C.; Tsopmo, A. Structural Characterization and Functional Properties of Proteins from Oat Milling Fractions. J. Am. Oil Chem. Soc. 2018, 95, 991–1000. [Google Scholar] [CrossRef]
- Brückner-Gühmann, M.; Heiden-Hecht, T.; Sözer, N.; Drusch, S. Foaming Characteristics of Oat Protein and Modification by Partial Hydrolysis. Eur. Food Res. Technol. 2018, 244, 2095–2106. [Google Scholar] [CrossRef]
- Prosekov, A.; Babich, O.; Kriger, O.; Ivanova, S.; Pavsky, V.; Sukhikh, S.; Yang, Y.; Kashirskih, E. Functional Properties of the Enzyme-Modified Protein from Oat Bran. Food Biosci. 2018, 24, 46–49. [Google Scholar] [CrossRef]
- Loponen, J.; Laine, P.; Sontag-Strohm, T.; Salovaara, H. Behaviour of Oat Globulins in Lactic Acid Fermentation of Oat Bran. Eur. Food Res. Technol. 2007, 225, 105–110. [Google Scholar] [CrossRef]
- Li, R.; Xiong, Y.L. Sensitivity of Oat Protein Solubility to Changing Ionic Strength and pH. J. Food Sci. 2021, 86, 78–85. [Google Scholar] [CrossRef]
- Liu, K.; Hsieh, F.-H. Protein–Protein Interactions during High-Moisture Extrusion for Fibrous Meat Analogues and Comparison of Protein Solubility Methods Using Different Solvent Systems. J. Agric. Food Chem. 2008, 56, 2681–2687. [Google Scholar] [CrossRef]
- Zhang, B.; Kang, X.; Cheng, Y.; Cui, B.; Abd El-Aty, A.M. Impact of High Moisture Contents on the Structure and Functional Properties of Pea Protein Isolate during Extrusion. Food Hydrocoll. 2022, 127, 107508. [Google Scholar] [CrossRef]
- Mohamed, A.; Biresaw, G.; Xu, J.; Hojilla-Evangelista, M.P.; Rayas-Duarte, P. Oats Protein Isolate: Thermal, Rheological, Surface and Functional Properties. Food Res. Int. 2009, 42, 107–114. [Google Scholar] [CrossRef]
- Yue, J.; Gu, Z.; Zhu, Z.; Yi, J.; Ohm, J.-B.; Chen, B.; Rao, J. Impact of Defatting Treatment and Oat Varieties on Structural, Functional Properties, and Aromatic Profile of Oat Protein. Food Hydrocoll. 2021, 112, 106368. [Google Scholar] [CrossRef]
- Lan, Y.; Ohm, J.-B.; Chen, B.; Rao, J. Physicochemical Properties and Aroma Profiles of Flaxseed Proteins Extracted from Whole Flaxseed and Flaxseed Meal. Food Hydrocoll. 2020, 104, 105731. [Google Scholar] [CrossRef]
- Yang, J.; Berton-Carabin, C.C.; Nikiforidis, C.V.; van der Linden, E.; Sagis, L.M.C. Competition of Rapeseed Proteins and Oleosomes for the Air-Water Interface and Its Effect on the Foaming Properties of Protein-Oleosome Mixtures. Food Hydrocoll. 2022, 122, 107078. [Google Scholar] [CrossRef]
- Ercili-Cura, D.; Miyamoto, A.; Paananen, A.; Yoshii, H.; Poutanen, K.; Partanen, R. Adsorption of Oat Proteins to Air–Water Interface in Relation to Their Colloidal State. Food Hydrocoll. 2015, 44, 183–190. [Google Scholar] [CrossRef]
- Heneen, W.K.; Karlsson, G.; Brismar, K.; Gummeson, P.-O.; Marttila, S.; Leonova, S.; Carlsson, A.S.; Bafor, M.; Banas, A.; Mattsson, B.; et al. Fusion of Oil Bodies in Endosperm of Oat Grains. Planta 2008, 228, 589–599. [Google Scholar] [CrossRef]
- Westermeier, R. Electrophoresis in Practice: A Guide to Methods and Applications of DNA and Protein Separations, 5th ed.; Wiley-VCH Verlag GmbH & Co. KGaA: Weinheim, Germany, 2016; ISBN 978-3-527-69516-4. [Google Scholar]
- Wang, W.; Vignani, R.; Scali, M.; Sensi, E.; Tiberi, P.; Cresti, M. Removal of Lipid Contaminants by Organic Solvents from Oilseed Protein Extract Prior to Electrophoresis. Anal. Biochem. 2004, 329, 139–141. [Google Scholar] [CrossRef]
- Klose, C.; Schehl, B.D.; Arendt, E.K. Fundamental Study on Protein Changes Taking Place during Malting of Oats. J. Cereal Sci. 2009, 9, 83–91. [Google Scholar] [CrossRef]
- Sargautis, D. Unpublished Work; Faculty of Food Technology, Latvia University of Life Sciences and Technologies: Jelgava, Latvia, 2020. [Google Scholar]
- Beck, S.M.; Knoerzer, K.; Foerster, M.; Mayo, S.; Philipp, C.; Arcot, J. Low Moisture Extrusion of Pea Protein and Pea Fibre Fortified Rice Starch Blends. J. Food Eng. 2018, 231, 61–71. [Google Scholar] [CrossRef]
- Chanvrier, H.; Colonna, P.; Della Valle, G.; Lourdin, D. Structure and Mechanical Behaviour of Corn Flour and Starch–Zein Based Materials in the Glassy State. Carbohydr. Polym. 2005, 59, 109–119. [Google Scholar] [CrossRef]
- Agrahar-Murugkar, D.; Gulati, P.; Kotwaliwale, N.; Gupta, C. Evaluation of Nutritional, Textural and Particle Size Characteristics of Dough and Biscuits Made from Composite Flours Containing Sprouted and Malted Ingredients. J. Food Sci. Technol. 2015, 52, 5129–5137. [Google Scholar] [CrossRef] [Green Version]
- Wang, H.; Wang, R.; Zhang, L.; Zhang, W.; Bakalis, S.; Li, Y.; Lametsch, R. Physicochemical Properties, Texture, and in Vitro Protein Digestibility in High-Moisture Extrudate with Different Oil/Water Ratio. Food Res. Int. 2023, 163, 112286. [Google Scholar] [CrossRef]
- Kristiawan, M.; Micard, V.; Maladira, P.; Alchamieh, C.; Maigret, J.-E.; Réguerre, A.-L.; Emin, M.A.; Della Valle, G. Multi-Scale Structural Changes of Starch and Proteins during Pea Flour Extrusion. Food Res. Int. 2018, 108, 203–215. [Google Scholar] [CrossRef] [PubMed]
- Andrés, V.; Villanueva, M.J.; Tenorio, M.D. The Effect of High-Pressure Processing on Colour, Bioactive Compounds, and Antioxidant Activity in Smoothies during Refrigerated Storage. Food Chem. 2016, 192, 328–335. [Google Scholar] [CrossRef]
- Lobato, L.P.; Anibal, D.; Lazaretti, M.M.; Grossmann, M.V.E. Extruded Puffed Functional Ingredient with Oat Bran and Soy Flour. LWT Food Sci. Technol. 2011, 44, 933–939. [Google Scholar] [CrossRef]
- Sun, P.L.; Sun, Z.L.; Jia, F.G.; Sun, Y.; Cao, Y. The Experimental Research about the Influence of High Moisture Extrusion on Texture of Product. AMR 2011, 188, 246–249. [Google Scholar]
- Robin, F.; Dubois, C.; Pineau, N.; Schuchmann, H.P.; Palzer, S. Expansion Mechanism of Extruded Foams Supplemented with Wheat Bran. J. Food Eng. 2011, 107, 80–89. [Google Scholar] [CrossRef]


| Sample | Protein, DS, wt, %, (N × 6.25) | Crude Oil, DS, wt, % | Fibre, DS, wt, % |
|---|---|---|---|
| Oat Flour | 10.44 ± 0.32 c | 6.21 ± 0.28 b | 0.59 ± 0.21 b |
| Oat protein concentrate | 63.05 ± 1.3 b | 20.55 ± 0.4 a | 1.34 ± 0.07 a |
| Defatted by ethanol | 78.18 ± 1.93 a | 4.88 ± 0.01 c | n.a. |
| Defatted by CO2 | 77.39 ± 1.58 a | 3.48 ± 0.11 d | n.a. |
| Amino Acid | g/100 g in Oat Flour Protein | g/100 g in OC1 Protein | g/100 g in ODE1 Protein | g/100 g in ODC1 Protein | WHO/FAO, Adults, g/100 g Protein ** |
|---|---|---|---|---|---|
| Ala | 3.8 ± 0.17 a | 3.7 ± 0.05 a | 4.01 ± 0.17 a | 3.85 ± 0.06 a | |
| Arg | 6.62 ± 0.29 b | 7.5 ± 0.25 a | 7.66 ± 0.32 a | 7.66 ± 0.08 a | |
| Asp | 7.59 ± 0.24 a | 7.89 ± 0.16 a | 8.06 ± 0.18 a | 7.88 ± 0.3 a | |
| Cys | 1.95 ± 0.05 b | 2.27 ± 0.07 a | 2.35 ± 0.05 a | 2.31 ± 0.07 a | 0.6 |
| Phe | 5.42 ± 0.27 a | 5.76 ± 0.23 a | 5.86 ± 0.17 a | 5.74 ± 0.16 a | 3.8 * |
| Gly | 4.45 ± 0.1 a | 4.49 ± 0.19 a | 4.6 ± 0.12 a | 4.47 ± 0.18 a | |
| Glu | 20.28 ± 0.54 b | 21.35 ± 1.01 ab | 22.17 ± 0.54 a | 21.64 ± 0.38 ab | |
| His | 2.39 ± 0.05 bc | 2.3 ± 0.08 c | 2.61 ± 0.05 a | 2.49 ± 0.06 ab | 1.5 |
| Ile | 3.9 ± 0.06 b | 4.29 ± 0.19 ab | 4.49 ± 0.15 a | 4.13 ± 0.19 ab | 3.0 |
| Leu | 8.57 ± 0.11 a | 7.81 ± 0.1 b | 8.24 ± 0.29 ab | 7.95 ± 0.18 b | 5.9 |
| Lys | 3.69 ± 0.12 a | 3.34 ± 0.11 b | 3.42 ± 0.12 ab | 3.3 ± 0.09 b | 4.5 |
| Met | 1.52 ± 0.08 b | 1.71 ± 0.02 a | 1.78 ± 0.04 a | 1.75 ± 0.08 a | 1.6 |
| Pro | 5.31 ± 0.23 a | 5.59 ± 0.18 a | 5.73 ± 0.17 a | 5.45 ± 0.06 a | |
| Ser | 4.34 ± 0.18 a | 4.37 ± 0.1 a | 4.52 ± 0.15 a | 4.46 ± 0.16 a | |
| Tyr | 3.25 ± 0.17 b | 4.47 ± 0.14 a | 4.75 ± 0.19 a | 4.61 ± 0.06 a | |
| Thr | 3.47 ± 0.11 a | 3.26 ± 0.16 a | 3.31 ± 0.1 a | 3.3 ± 0.15 a | 2.3 |
| Val | 4.88 ± 0.09 c | 5.26 ± 0.21 bc | 5.76 ± 0.14 a | 5.53 ± 0.14 ab | 3.9 |
| Sample | a | b | L |
|---|---|---|---|
| Oat raw material | 2.6 ± 1.41 a | 11.57 ± 5.36 a | 83.6 ± 2.47 b |
| Oat extrudate | 0.61 ± 1.56 ab | 11.34 ± 5.68 a | 21.78 ± 5.27 d |
| Soy raw material | −0.67 ± 2.38 b | 14.19 ± 5.61 a | 90.68 ± 2.49 a |
| Soy extrudate | −0.54 ± 1.55 b | 15.48 ± 4.73 a | 48.68 ± 3.44 c |
Disclaimer/Publisher’s Note: The statements, opinions and data contained in all publications are solely those of the individual author(s) and contributor(s) and not of MDPI and/or the editor(s). MDPI and/or the editor(s) disclaim responsibility for any injury to people or property resulting from any ideas, methods, instructions or products referred to in the content. |
© 2023 by the authors. Licensee MDPI, Basel, Switzerland. This article is an open access article distributed under the terms and conditions of the Creative Commons Attribution (CC BY) license (https://creativecommons.org/licenses/by/4.0/).
Share and Cite
Sargautis, D.; Kince, T.; Gramatina, I. Characterisation of the Enzymatically Extracted Oat Protein Concentrate after Defatting and Its Applicability for Wet Extrusion. Foods 2023, 12, 2333. https://doi.org/10.3390/foods12122333
Sargautis D, Kince T, Gramatina I. Characterisation of the Enzymatically Extracted Oat Protein Concentrate after Defatting and Its Applicability for Wet Extrusion. Foods. 2023; 12(12):2333. https://doi.org/10.3390/foods12122333
Chicago/Turabian StyleSargautis, Darius, Tatjana Kince, and Ilze Gramatina. 2023. "Characterisation of the Enzymatically Extracted Oat Protein Concentrate after Defatting and Its Applicability for Wet Extrusion" Foods 12, no. 12: 2333. https://doi.org/10.3390/foods12122333
APA StyleSargautis, D., Kince, T., & Gramatina, I. (2023). Characterisation of the Enzymatically Extracted Oat Protein Concentrate after Defatting and Its Applicability for Wet Extrusion. Foods, 12(12), 2333. https://doi.org/10.3390/foods12122333