Preparation and Evaluation of Undaria pinnatifida Nanocellulose in Fabricating Pickering Emulsions for Protection of Astaxanthin


Abstract
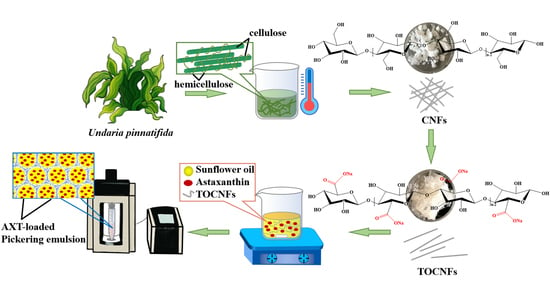
1. Introduction
2. Materials and Methods
2.1. Materials
2.2. Preparation of TOCNFs
2.2.1. Preparation of Undaria pinnatifida Cellulose (U-Cellulose) by Alkali and Bleaching Treatments
2.2.2. Preparation of CNFs by Enzymatic Hydrolysis
2.2.3. Preparation of TOCNFs
2.3. Morphology Analysis
2.4. Characterization of U-Cellulose, CNFs and TOCNFs
2.5. Preparation of Pickering Emulsions Stabilized with TOCNFs
2.6. Influencing Factors of Pickering Emulsion
2.6.1. Effect of TOCNFs Concentrations on Pickering Emulsion
2.6.2. Effect of pH and Ionic Strength on Pickering Emulsion
2.7. Characterization of Pickering Emulsions
2.7.1. Morphology Analysis of Pickering Emulsions
2.7.2. Droplets Size Determination and Emulsion Index (EI)
2.8. Preparation of AXT-Loaded Pickering Emulsion
2.9. Stability Analysis of AXT-Loaded Pickering Emulsion
2.10. Encapsulation Efficiency (EE)
2.11. In Vitro Simulated Digestion
2.12. Statistical Analysis
3. Results and Discussion
3.1. Preparation of U-Cellulose, CNFs, and TOCNFs
3.2. FT−IR, XRD and TGA Analysis of U-Cellulose, CNFs, and TOCNFs
3.3. Particle Size and ζ−Potential of U-Cellulose, CNFs, and TOCNFs
3.4. Effect of Ultrasonic Power on Pickering Emulsions
3.5. Effect of TOCNFs Concentrations on Pickering Emulsions
3.6. Effect of pH and Ionic Strength on Pickering Emulsions
3.7. Morphology of Emulsion Droplets
3.8. Thermal Stability of AXT-Loaded Pickering Emulsions
3.9. Storage Stability of AXT-Loaded Pickering Emulsions
3.10. Release of FFAs and Bioaccessibility Analysis
4. Conclusions
Supplementary Materials
Author Contributions
Funding
Data Availability Statement
Conflicts of Interest
References
- Anarjan, N.; Jafarizadeh-Malmiri, H.; Nehdi, I.A.; Sbihi, H.M.; Al-Resayes, S.I.; Tan, C.P. Effects of homogenization process parameters on physicochemical properties of astaxanthin nanodispersions prepared using a solvent-diffusion technique. Int. J. Nanomed. 2015, 10, 1109–1118. [Google Scholar] [CrossRef][Green Version]
- Higuera-Ciapara, I.; Felix-Valenzuela, L.; Goycoolea, F.M.; Argüelles-Monal, W. Microencapsulation of astaxanthin in a chitosan matrix. Carbohydr. Polym. 2004, 56, 41–45. [Google Scholar] [CrossRef]
- Guerin, M.; Huntley, M.E.; Olaizola, M. Haematococcus astaxanthin: Applications for human health and nutrition. Trends Biotechnol. 2003, 21, 210–216. [Google Scholar] [CrossRef]
- Ribeiro, H.S.; Rico, L.G.; Badolato, G.G.; Schubert, H. Production of O/W emulsions containing astaxanthin by repeated premix membrane emulsification. J. Food Sci. 2005, 70, E117–E123. [Google Scholar] [CrossRef]
- Zhu, M.; Huan, S.; Liu, S.; Li, Z.; He, M.; Yang, G.; Liu, S.; McClements, D.J.; Rojas, O.J.; Bai, L. Recent development in food emulsion stabilized by plant-based cellulose nanoparticles. Curr. Opin. Colloid Interface Sci. 2021, 56, 101512. [Google Scholar] [CrossRef]
- Zhu, X.; Chen, J.; Hu, Y.; Zhang, N.; Fu, Y.; Chen, X. Tuning complexation of carboxymethyl cellulose/cationic chitosan to stabilize Pickering emulsion for curcumin encapsulation. Food Hydrocoll. 2021, 110, 106135. [Google Scholar] [CrossRef]
- Bai, L.; Huan, S.; Zhu, Y.; Chu, G.; McClements, D.J.; Rojas, O.J. Recent advances in food emulsions and engineering foodstuffs using plant-based nanocelluloses. Annu. Rev. Food Sci. Technol. 2021, 12, 383–406. [Google Scholar] [CrossRef]
- Dong, H.; Ding, Q.; Jiang, Y.; Li, X.; Han, W. Pickering emulsions stabilized by spherical cellulose nanocrystals. Carbohydr. Polym. 2021, 265, 118101. [Google Scholar] [CrossRef]
- Deepa, B.; Abraham, E.; Cordeiro, N.; Faria, M.; Primc, G.; Pottathara, Y.; Leskovsek, M.; Gorjanc, M.; Mozetic, M.; Thomas, S.; et al. Nanofibrils vs nanocrystals bio-nanocomposites based on sodium alginate matrix: An improved-performance study. Heliyon 2020, 6, e03266. [Google Scholar] [CrossRef]
- Solala, I.; Iglesias, M.C.; Peresin, M.S. On the potential of lignin-containing cellulose nanofibrils (LCNFs): A review on properties and applications. Cellulose 2019, 27, 1853–1877. [Google Scholar] [CrossRef]
- Rol, F.; Belgacem, M.N.; Gandini, A.; Bras, J. Recent advances in surface-modified cellulose nanofibrils. Prog. Polym. Sci. 2019, 88, 241–264. [Google Scholar] [CrossRef]
- Tang, Z.; Li, W.; Lin, X.; Xiao, H.; Miao, Q.; Huang, L.; Chen, L.; Wu, H. TEMPO-oxidized cellulose with high degree of oxidation. Polymers 2017, 9, 421. [Google Scholar] [CrossRef] [PubMed]
- Kaffashsaie, E.; Yousefi, H.; Nishino, T.; Matsumoto, T.; Mashkour, M.; Madhoushi, M.; Kawaguchi, H. Direct conversion of raw wood to TEMPO-oxidized cellulose nanofibers. Carbohydr. Polym. 2021, 262, 117938. [Google Scholar] [CrossRef] [PubMed]
- Gómez, H.C.; Serpa, A.; Velásquez-Cock, J.; Gañán, P.; Castro, C.; Vélez, L.; Zuluaga, R. Vegetable nanocellulose in food science: A review. Food Hydrocoll. 2016, 57, 178–186. [Google Scholar] [CrossRef]
- Wu, Y.; Zhang, X.; Qiu, D.; Pei, Y.; Li, Y.; Li, B.; Liu, S. Effect of surface charge density of bacterial cellulose nanofibrils on the rheology property of O/W Pickering emulsions. Food Hydrocoll. 2021, 120, 106944. [Google Scholar] [CrossRef]
- Ahmed, F.; Ayoub Arbab, A.; Jatoi, A.W.; Khatri, M.; Memon, N.; Khatri, Z.; Kim, I.S. Ultrasonic-assisted deacetylation of cellulose acetate nanofibers: A rapid method to produce cellulose nanofibers. Ultrason. Sonochem. 2017, 36, 319–325. [Google Scholar] [CrossRef] [PubMed]
- Owonubi, S.J.; Agwuncha, S.C.; Malima, N.M.; Shombe, G.B.; Revaprasadu, N. Non-woody biomass as sources of nanocellulose particles: A review of extraction procedures. Front. Energy Res. 2021, 9, 608825. [Google Scholar] [CrossRef]
- Lakshmi, D.S.; Trivedi, N.; Reddy, C.R.K. Synthesis and characterization of seaweed cellulose derived carboxymethyl cellulose. Carbohydr. Polym. 2017, 157, 1604–1610. [Google Scholar] [CrossRef]
- Feng, X.; Meng, X.; Zhao, J.; Miao, M.; Shi, L.; Zhang, S.; Fang, J. Extraction and preparation of cellulose nanocrystals from dealginate kelp residue: Structures and morphological characterization. Cellulose 2015, 22, 1763–1772. [Google Scholar] [CrossRef]
- Kasiri, N.; Fathi, M. Production of cellulose nanocrystals from pistachio shells and their application for stabilizing Pickering emulsions. Int. J. Biol. Macromol. 2018, 106, 1023–1031. [Google Scholar] [CrossRef]
- Wu, J.; Zhu, W.; Shi, X.; Li, Q.; Huang, C.; Tian, Y.; Wang, S. Acid-free preparation and characterization of kelp (Laminaria japonica) nanocelluloses and their application in Pickering emulsions. Carbohydr. Polym. 2020, 236, 115999. [Google Scholar] [CrossRef] [PubMed]
- Zhou, Y.; Saito, T.; Bergstrom, L.; Isogai, A. Acid-free preparation of cellulose nanocrystals by TEMPO oxidation and subsequent cavitation. Biomacromolecules 2018, 19, 633–639. [Google Scholar] [CrossRef] [PubMed]
- Du Le, H.; Loveday, S.M.; Singh, H.; Sarkar, A. Pickering emulsions stabilised by hydrophobically modified cellulose nanocrystals: Responsiveness to pH and ionic strength. Food Hydrocoll. 2020, 99, 105344. [Google Scholar] [CrossRef]
- Khalid, N.; Shu, G.; Holland, B.J.; Kobayashi, I.; Nakajima, M.; Barrow, C.J. Formulation and characterization of O/W nanoemulsions encapsulating high concentration of astaxanthin. Food Res. Int. 2017, 102, 364–371. [Google Scholar] [CrossRef]
- Burgos-Díaz, C.; Opazo-Navarrete, M.; Soto-Añual, M.; Leal-Calderón, F.; Bustamante, M. Food-grade Pickering emulsion as a novel astaxanthin encapsulation system for making powder-based products: Evaluation of astaxanthin stability during processing, storage, and its bioaccessibility. Food Res. Int. 2020, 134, 109244. [Google Scholar] [CrossRef]
- Ahmed, K.; Li, Y.; McClements, D.J.; Xiao, H. Nanoemulsion- and emulsion-based delivery systems for curcumin: Encapsulation and release properties. Food Chem. 2012, 132, 799–807. [Google Scholar] [CrossRef]
- Yang, J.; Zhou, Q.; Huang, Z.; Gu, Z.; Cheng, L.; Qiu, L.; Hong, Y. Mechanisms of in vitro controlled release of astaxanthin from starch-based double emulsion carriers. Food Hydrocoll. 2021, 119, 106837. [Google Scholar] [CrossRef]
- Zou, L.; Zheng, B.; Liu, W.; Liu, C.; Xiao, H.; McClements, D.J. Enhancing nutraceutical bioavailability using excipient emulsions: Influence of lipid droplet size on solubility and bioaccessibility of powdered curcumin. J. Funct. Foods 2015, 15, 72–83. [Google Scholar] [CrossRef]
- Boonlao, N.; Shrestha, S.; Sadiq, M.B.; Anal, A.K. Influence of whey protein-xanthan gum stabilized emulsion on stability and in vitro digestibility of encapsulated astaxanthin. J. Food Eng. 2020, 272, 109859. [Google Scholar] [CrossRef]
- Rohaizu, R.; Wanrosli, W.D. Sono-assisted TEMPO oxidation of oil palm lignocellulosic biomass for isolation of nanocrystalline cellulose. Ultrason. Sonochem. 2017, 34, 631–639. [Google Scholar] [CrossRef]
- Dai, H.; Ou, S.; Huang, Y.; Huang, H. Utilization of pineapple peel for production of nanocellulose and film application. Cellulose 2018, 25, 1743–1756. [Google Scholar] [CrossRef]
- Lin, N.; Bruzzese, C.; Dufresne, A. TEMPO-oxidized nanocellulose participating as crosslinking aid for alginate-based sponges. ACS Appl. Mater. Interfaces 2012, 4, 4948–4959. [Google Scholar] [CrossRef]
- Ko, S.W.; Soriano, J.P.E.; Rajan Unnithan, A.; Lee, J.Y.; Park, C.H.; Kim, C.S. Development of bioactive cellulose nanocrystals derived from dominant cellulose polymorphs I and II from Capsosiphon Fulvescens for biomedical applications. Int. J. Biol. Macromol. 2018, 110, 531–539. [Google Scholar] [CrossRef]
- Henrique, M.A.; Silverio, H.A.; Flauzino Neto, W.P.; Pasquini, D. Valorization of an agro-industrial waste, mango seed, by the extraction and characterization of its cellulose nanocrystals. J. Environ. Manag. 2013, 121, 202–209. [Google Scholar] [CrossRef]
- Ni, Y.; Li, J.; Fan, L. Production of nanocellulose with different length from ginkgo seed shells and applications for oil in water Pickering emulsions. Int. J. Biol. Macromol. 2020, 149, 617–626. [Google Scholar] [CrossRef]
- Naduparambath, S.; Jinitha, T.; Shaniba, V.; Sreejith, M.P.; Balan, A.K.; Purushothaman, E. Isolation and characterisation of cellulose nanocrystals from sago seed shells. Carbohydr. Polym. 2018, 180, 13–20. [Google Scholar] [CrossRef]
- Chen, Y.W.; Lee, H.V.; Juan, J.C.; Phang, S.M. Production of new cellulose nanomaterial from red algae marine biomass Gelidium elegans. Carbohydr. Polym. 2016, 151, 1210–1219. [Google Scholar] [CrossRef]
- El Achaby, M.; Kassab, Z.; Aboulkas, A.; Gaillard, C.; Barakat, A. Reuse of red algae waste for the production of cellulose nanocrystals and its application in polymer nanocomposites. Int. J. Biol. Macromol. 2018, 106, 681–691. [Google Scholar] [CrossRef]
- Mondal, K.; Sakurai, S.; Okahisa, Y.; Goud, V.V.; Katiyar, V. Effect of cellulose nanocrystals derived from Dunaliella tertiolecta marine green algae residue on crystallization behaviour of poly (lactic acid). Carbohydr. Polym. 2021, 261, 117881. [Google Scholar] [CrossRef]
- Puangsin, B.; Yang, Q.; Saito, T.; Isogai, A. Comparative characterization of TEMPO-oxidized cellulose nanofibril films prepared from non-wood resources. Int. J. Biol. Macromol. 2013, 59, 208–213. [Google Scholar] [CrossRef]
- Ni, Y.; Li, J.; Fan, L. Effects of ultrasonic conditions on the interfacial property and emulsifying property of cellulose nanoparticles from ginkgo seed shells. Ultrason. Sonochem. 2021, 70, 105335. [Google Scholar] [CrossRef]
- Zhang, H.; Chen, Y.; Wang, S.; Ma, L.; Yu, Y.; Dai, H.; Zhang, Y. Extraction and comparison of cellulose nanocrystals from lemon (Citrus limon) seeds using sulfuric acid hydrolysis and oxidation methods. Carbohydr. Polym. 2020, 238, 116180. [Google Scholar] [CrossRef]
- Kargar, M.; Fayazmanesh, K.; Alavi, M.; Spyropoulos, F.; Norton, I.T. Investigation into the potential ability of Pickering emulsions (food-grade particles) to enhance the oxidative stability of oil-in-water emulsions. J. Colloid Interface Sci. 2012, 366, 209–215. [Google Scholar] [CrossRef]
- Li, Q.; Xie, B.; Wang, Y.; Wang, Y.; Peng, L.; Li, Y.; Li, B.; Liu, S. Cellulose nanofibrils from Miscanthus floridulus straw as green particle emulsifier for O/W Pickering emulsion. Food Hydrocoll. 2019, 97, 105214. [Google Scholar] [CrossRef]
- Qi, J.R.; Song, L.W.; Zeng, W.Q.; Liao, J.S. Citrus fiber for the stabilization of O/W emulsion through combination of Pickering effect and fiber-based network. Food Chem. 2021, 343, 128523. [Google Scholar] [CrossRef]
- Dai, H.; Zhang, H.; Chen, Y.; Ma, L.; Wu, J.; Zhang, Y. Co-stabilization and properties regulation of Pickering emulsions by cellulose nanocrystals and nanofibrils from lemon seeds. Food Hydrocoll. 2021, 120, 106884. [Google Scholar] [CrossRef]
- Shen, X.; Fang, T.; Zheng, J.; Guo, M. Physicochemical properties and cellular uptake of astaxanthin-loaded emulsions. Molecules 2019, 24, 727. [Google Scholar] [CrossRef]
- Miao, J.; Xu, N.; Cheng, C.; Zou, L.; Chen, J.; Wang, Y.; Liang, R.; McClements, D.J.; Liu, W. Fabrication of polysaccharide-based high internal phase emulsion gels: Enhancement of curcumin stability and bioaccessibility. Food Hydrocoll. 2021, 117, 106679. [Google Scholar] [CrossRef]
- Han, J.; Zhang, Z.; Shang, W.; Yan, J.; Julian McClements, D.; Xiao, H.; Wu, H.; Zhu, B. Modulation of physicochemical stability and bioaccessibility of beta-carotene using alginate beads and emulsion stabilized by scallop (Patinopecten yessoensis) gonad protein isolates. Food Res. Int. 2020, 129, 108875. [Google Scholar] [CrossRef]


| AXT-Loaded Pickering Emulsions | EE (%) | EI (%) | Average Diameter (μm) |
|---|---|---|---|
| 1stday | 94.24 ± 0.73 a | 94.93 ± 2.76 a | 6.07 ± 0.32 a |
| 7th day | 86.65 ± 8.71a | 87.92 ± 3.90 ab | 6.31 ± 0.39 b |
| 14th day | 80.64 ± 7.44 a | 86.39 ± 5.16 b | 7.09 ± 0.04 c |
Publisher’s Note: MDPI stays neutral with regard to jurisdictional claims in published maps and institutional affiliations. |
© 2022 by the authors. Licensee MDPI, Basel, Switzerland. This article is an open access article distributed under the terms and conditions of the Creative Commons Attribution (CC BY) license (https://creativecommons.org/licenses/by/4.0/).
Share and Cite
Li, Y.; Fei, S.; Yu, D.; Zhang, L.; Li, J.; Liu, R.; Tan, M. Preparation and Evaluation of Undaria pinnatifida Nanocellulose in Fabricating Pickering Emulsions for Protection of Astaxanthin. Foods 2022, 11, 876. https://doi.org/10.3390/foods11060876
Li Y, Fei S, Yu D, Zhang L, Li J, Liu R, Tan M. Preparation and Evaluation of Undaria pinnatifida Nanocellulose in Fabricating Pickering Emulsions for Protection of Astaxanthin. Foods. 2022; 11(6):876. https://doi.org/10.3390/foods11060876
Chicago/Turabian StyleLi, Yu, Siyuan Fei, Deyang Yu, Lijuan Zhang, Jiaxuan Li, Ronggang Liu, and Mingqian Tan. 2022. "Preparation and Evaluation of Undaria pinnatifida Nanocellulose in Fabricating Pickering Emulsions for Protection of Astaxanthin" Foods 11, no. 6: 876. https://doi.org/10.3390/foods11060876
APA StyleLi, Y., Fei, S., Yu, D., Zhang, L., Li, J., Liu, R., & Tan, M. (2022). Preparation and Evaluation of Undaria pinnatifida Nanocellulose in Fabricating Pickering Emulsions for Protection of Astaxanthin. Foods, 11(6), 876. https://doi.org/10.3390/foods11060876