
Multi-Response Optimization of the Malting Process of an Italian Landrace of Rye (Secale cereale L.) Using Response Surface Methodology and Desirability Function Coupled with Genetic Algorithm
 , ,
, ,  ,
,  , and
, and 
Abstract
:1. Introduction
2. Materials and Methods
2.1. Raw Material
2.2. Experimental Design
2.3. Micro-Malting Plan
2.4. Chemical Analyses
2.5. Statistical Analysis
3. Results and Discussion
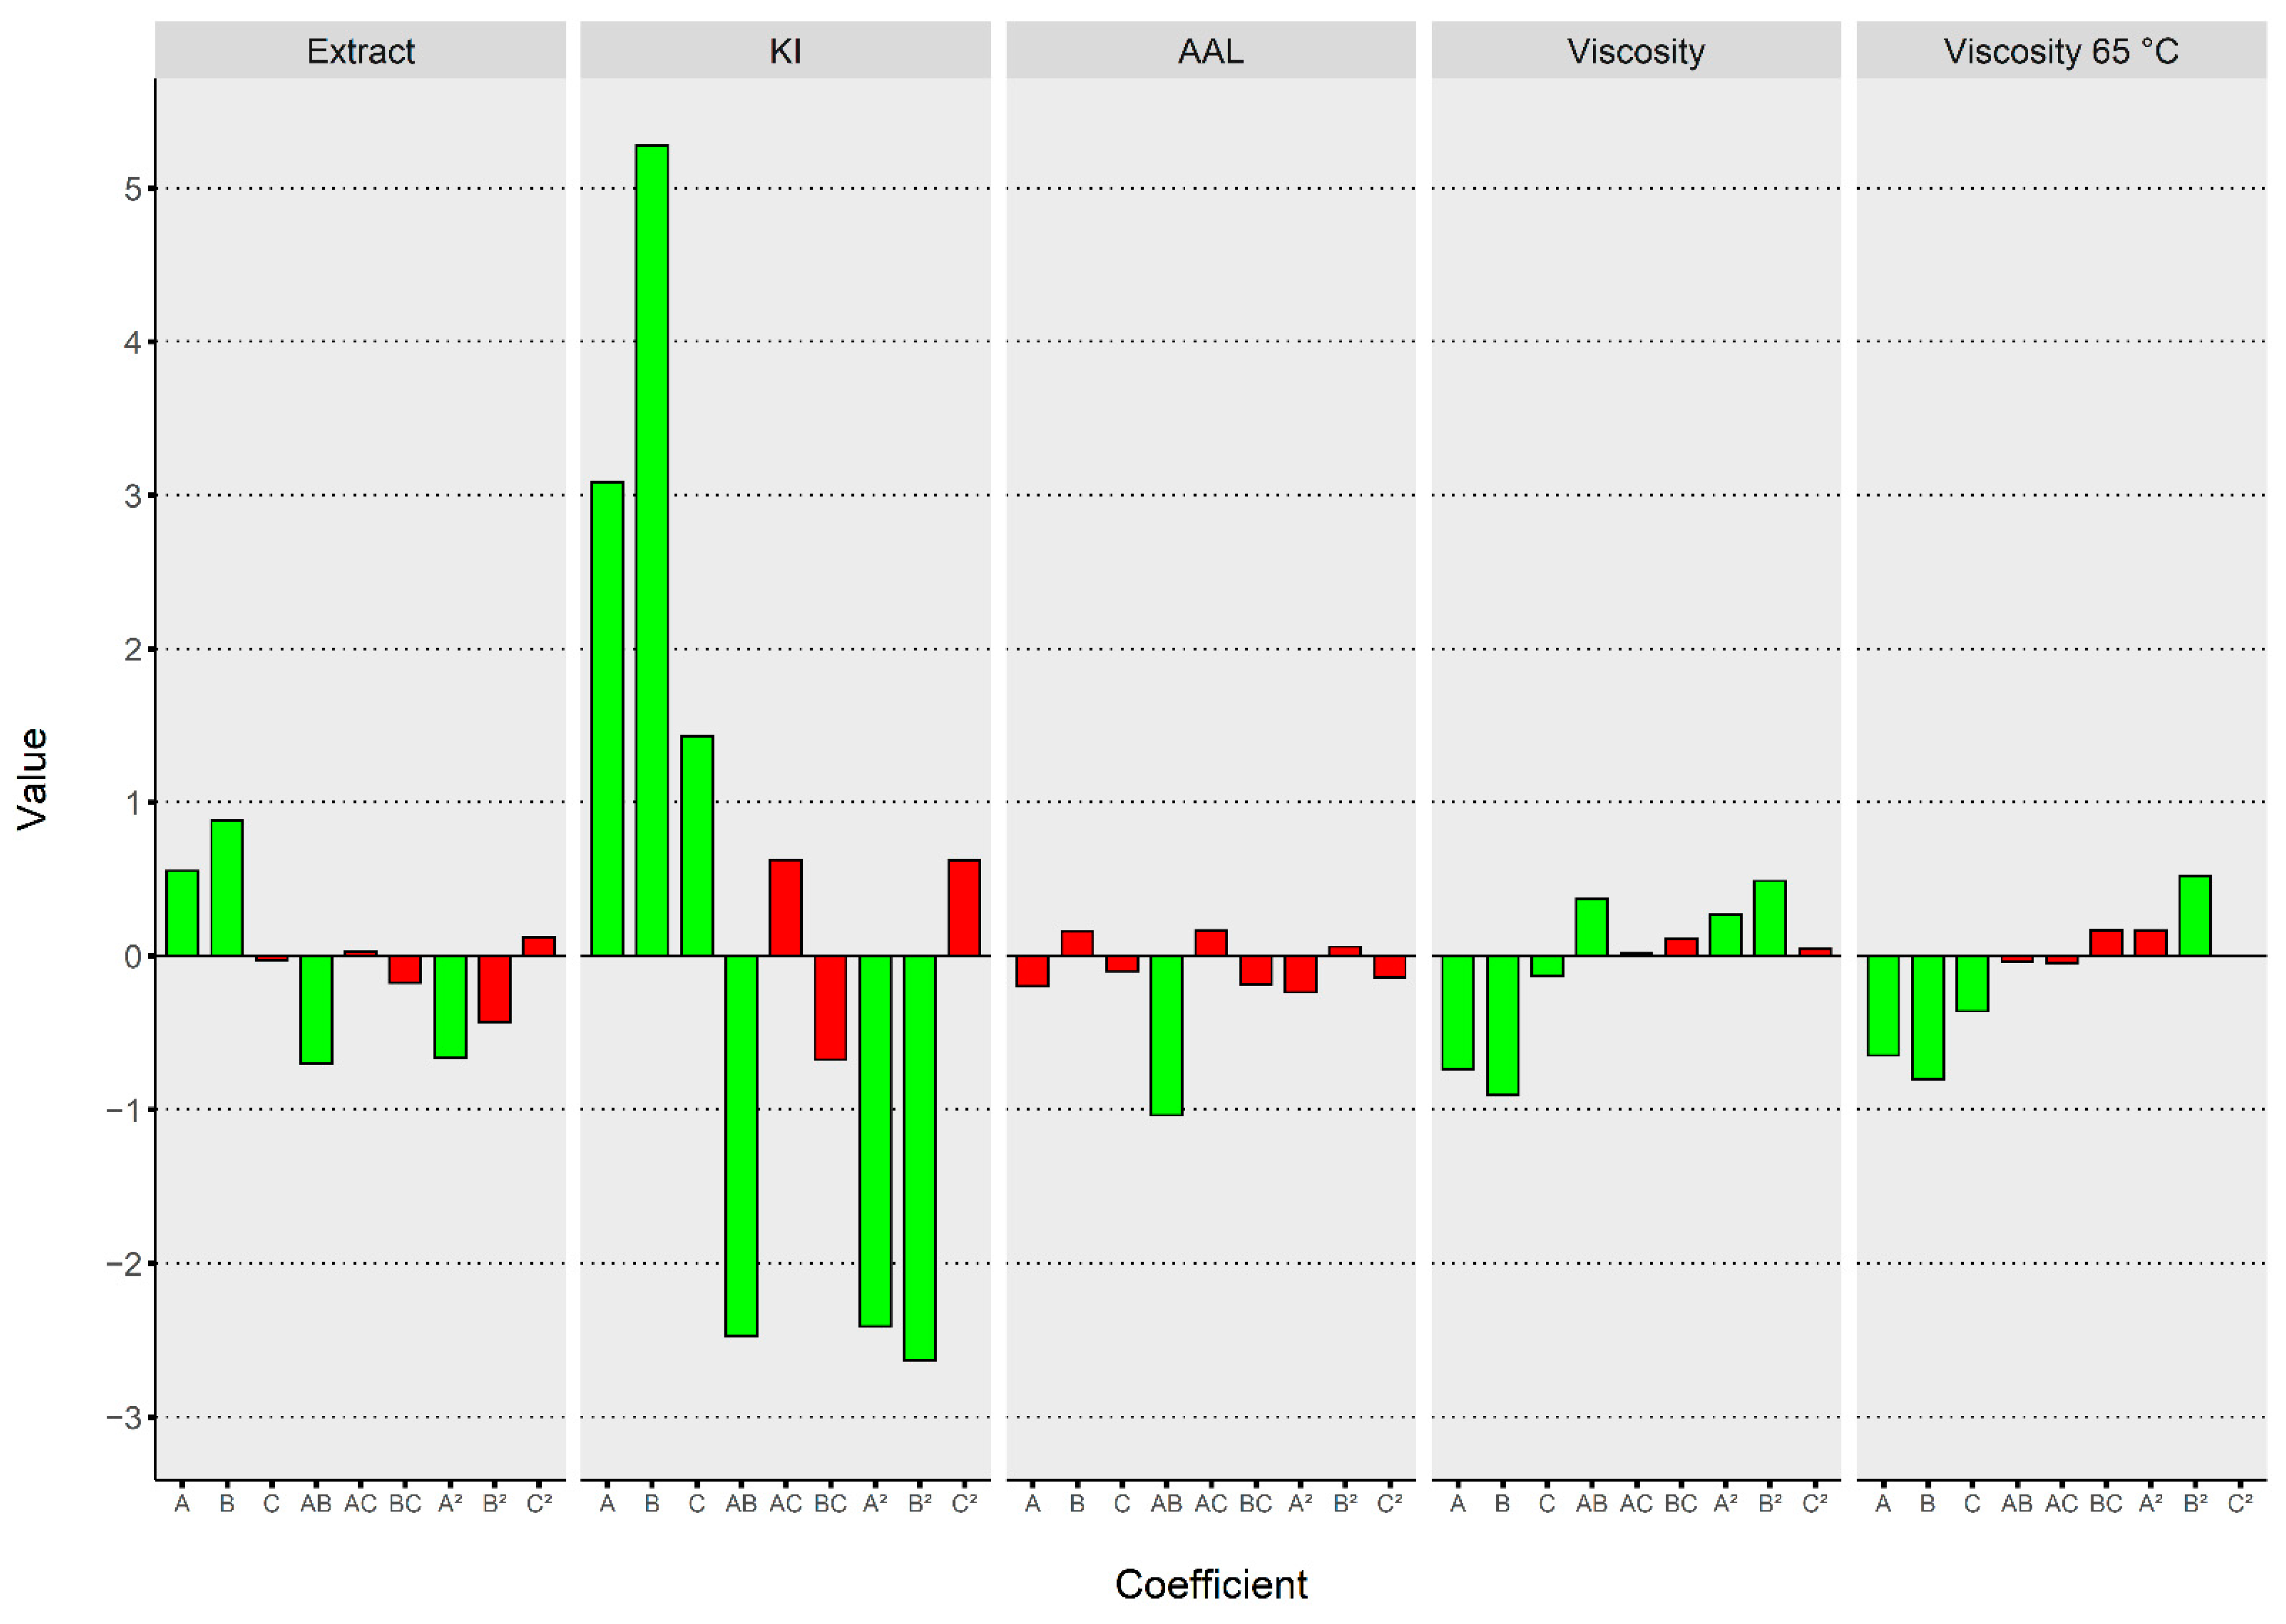
3.1. Model Fitting and Adequacy Evaluation
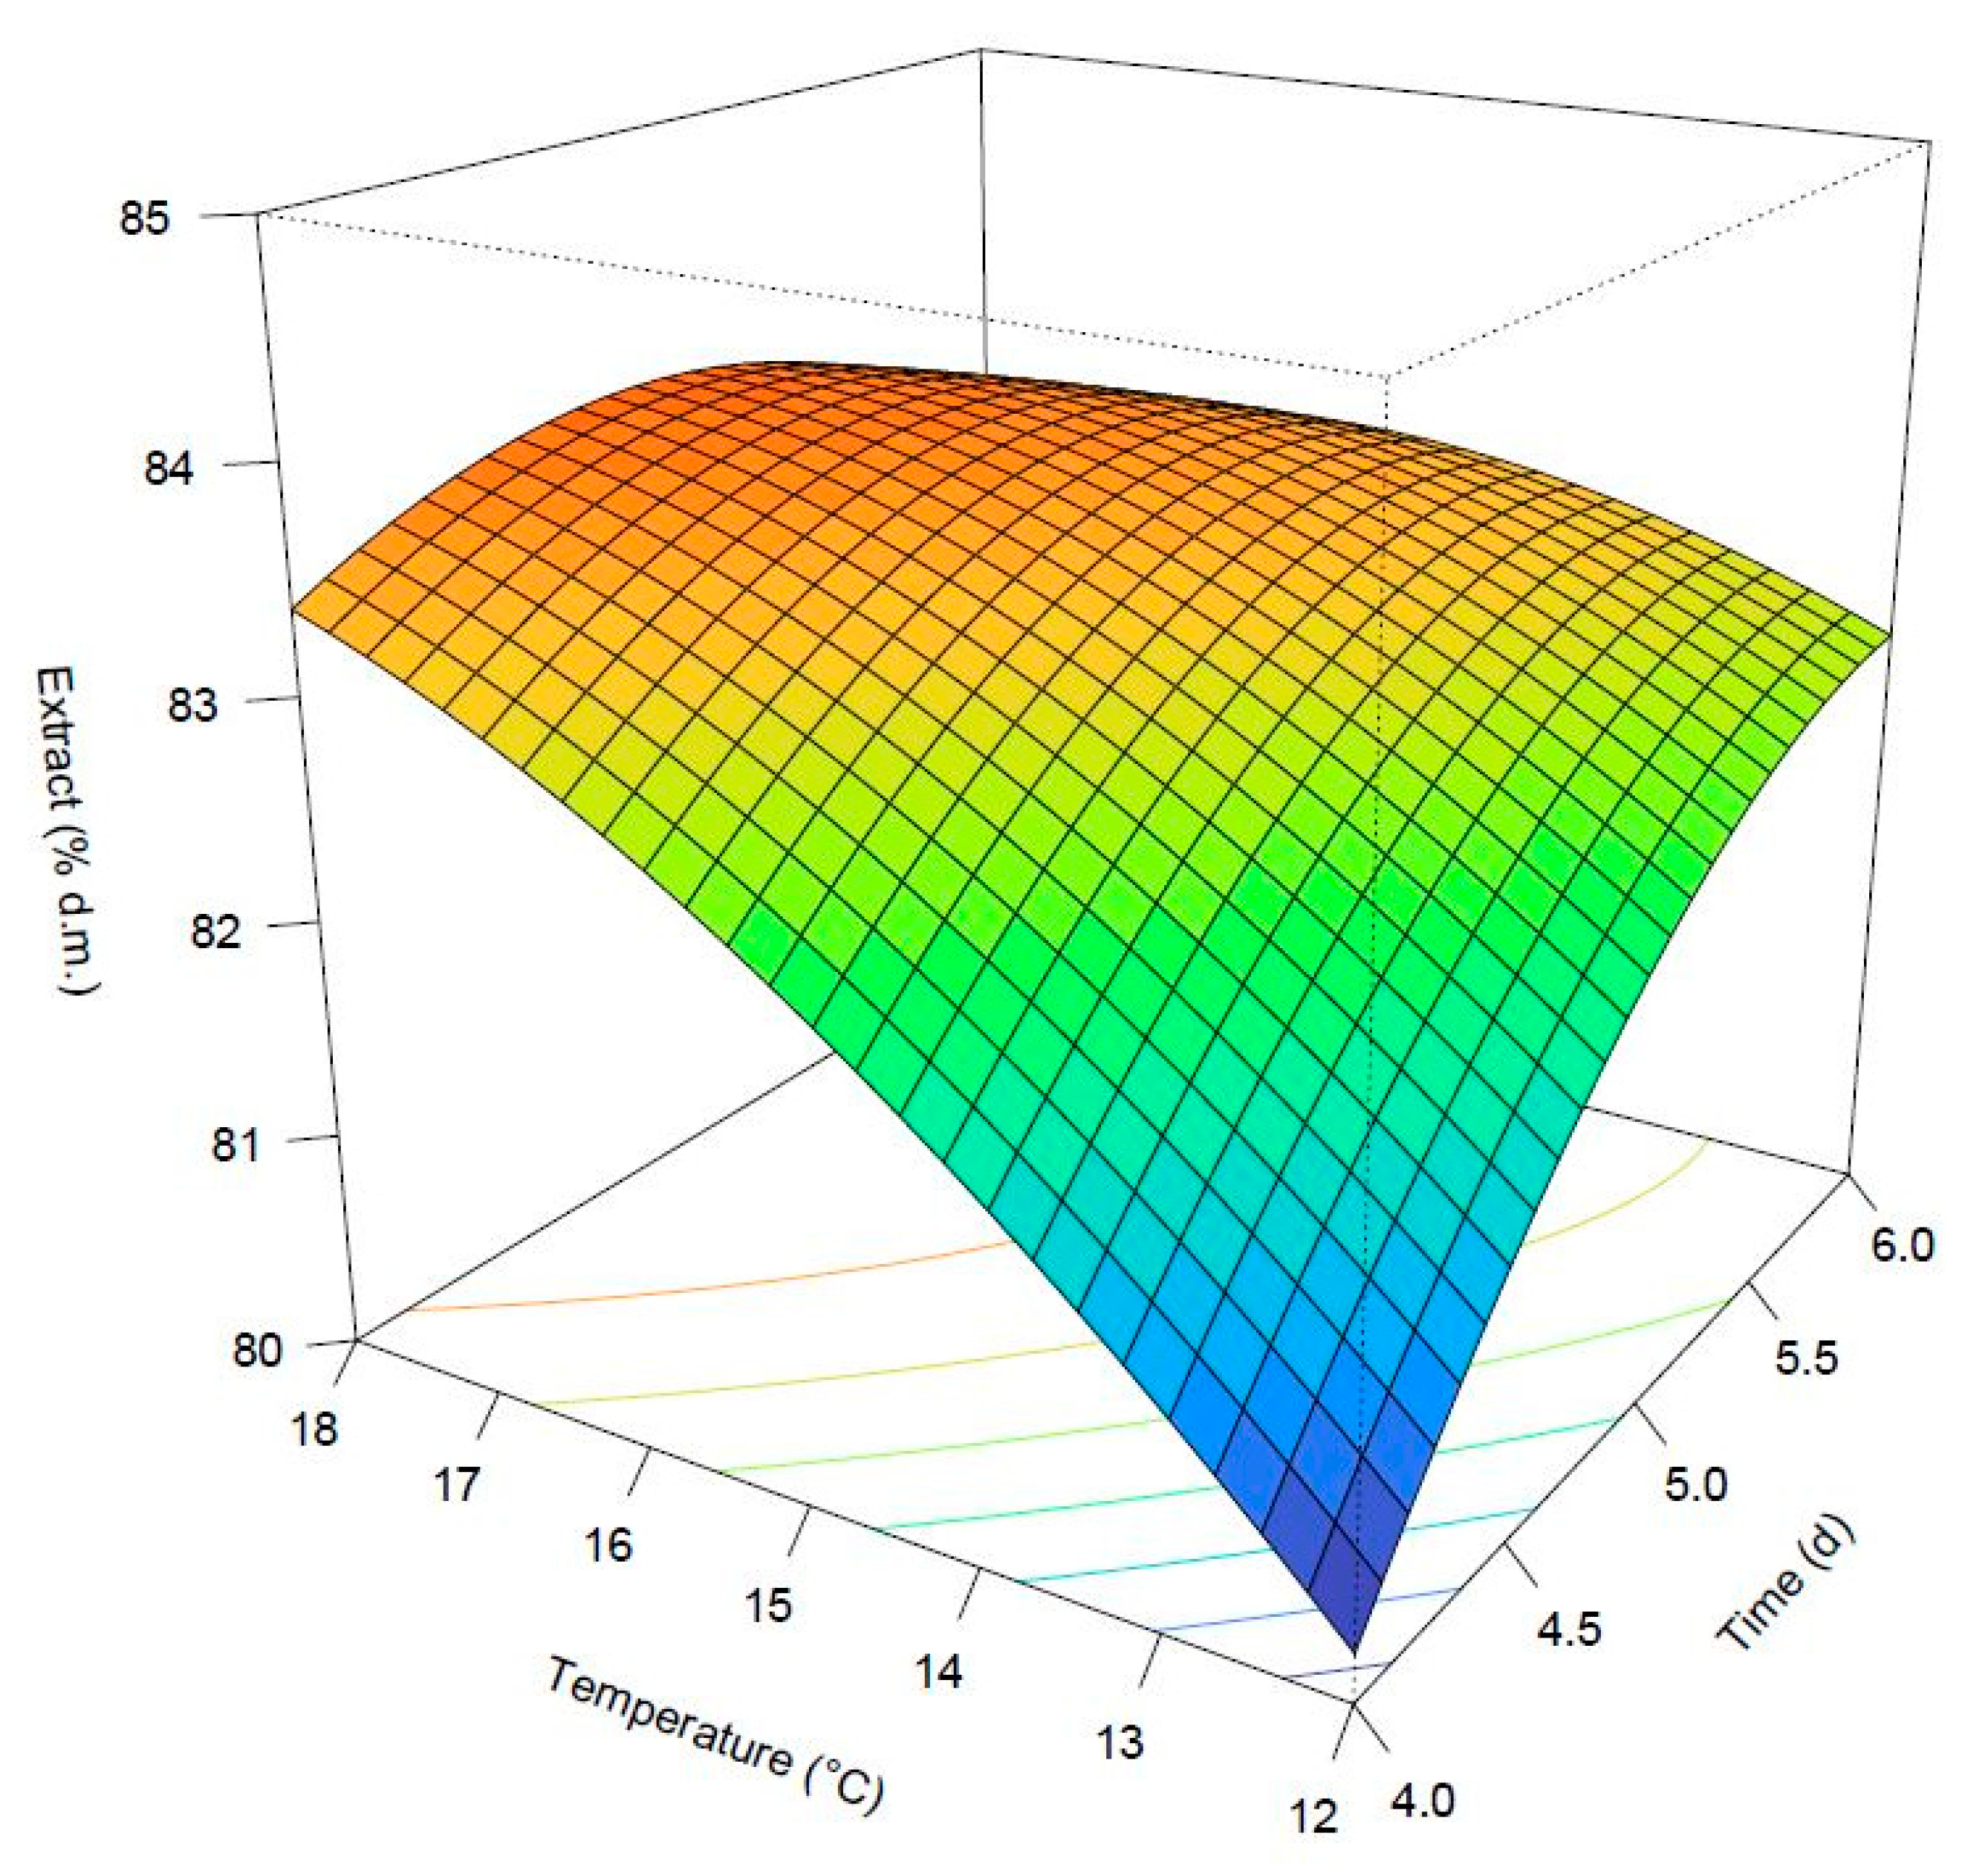
3.2. Extract
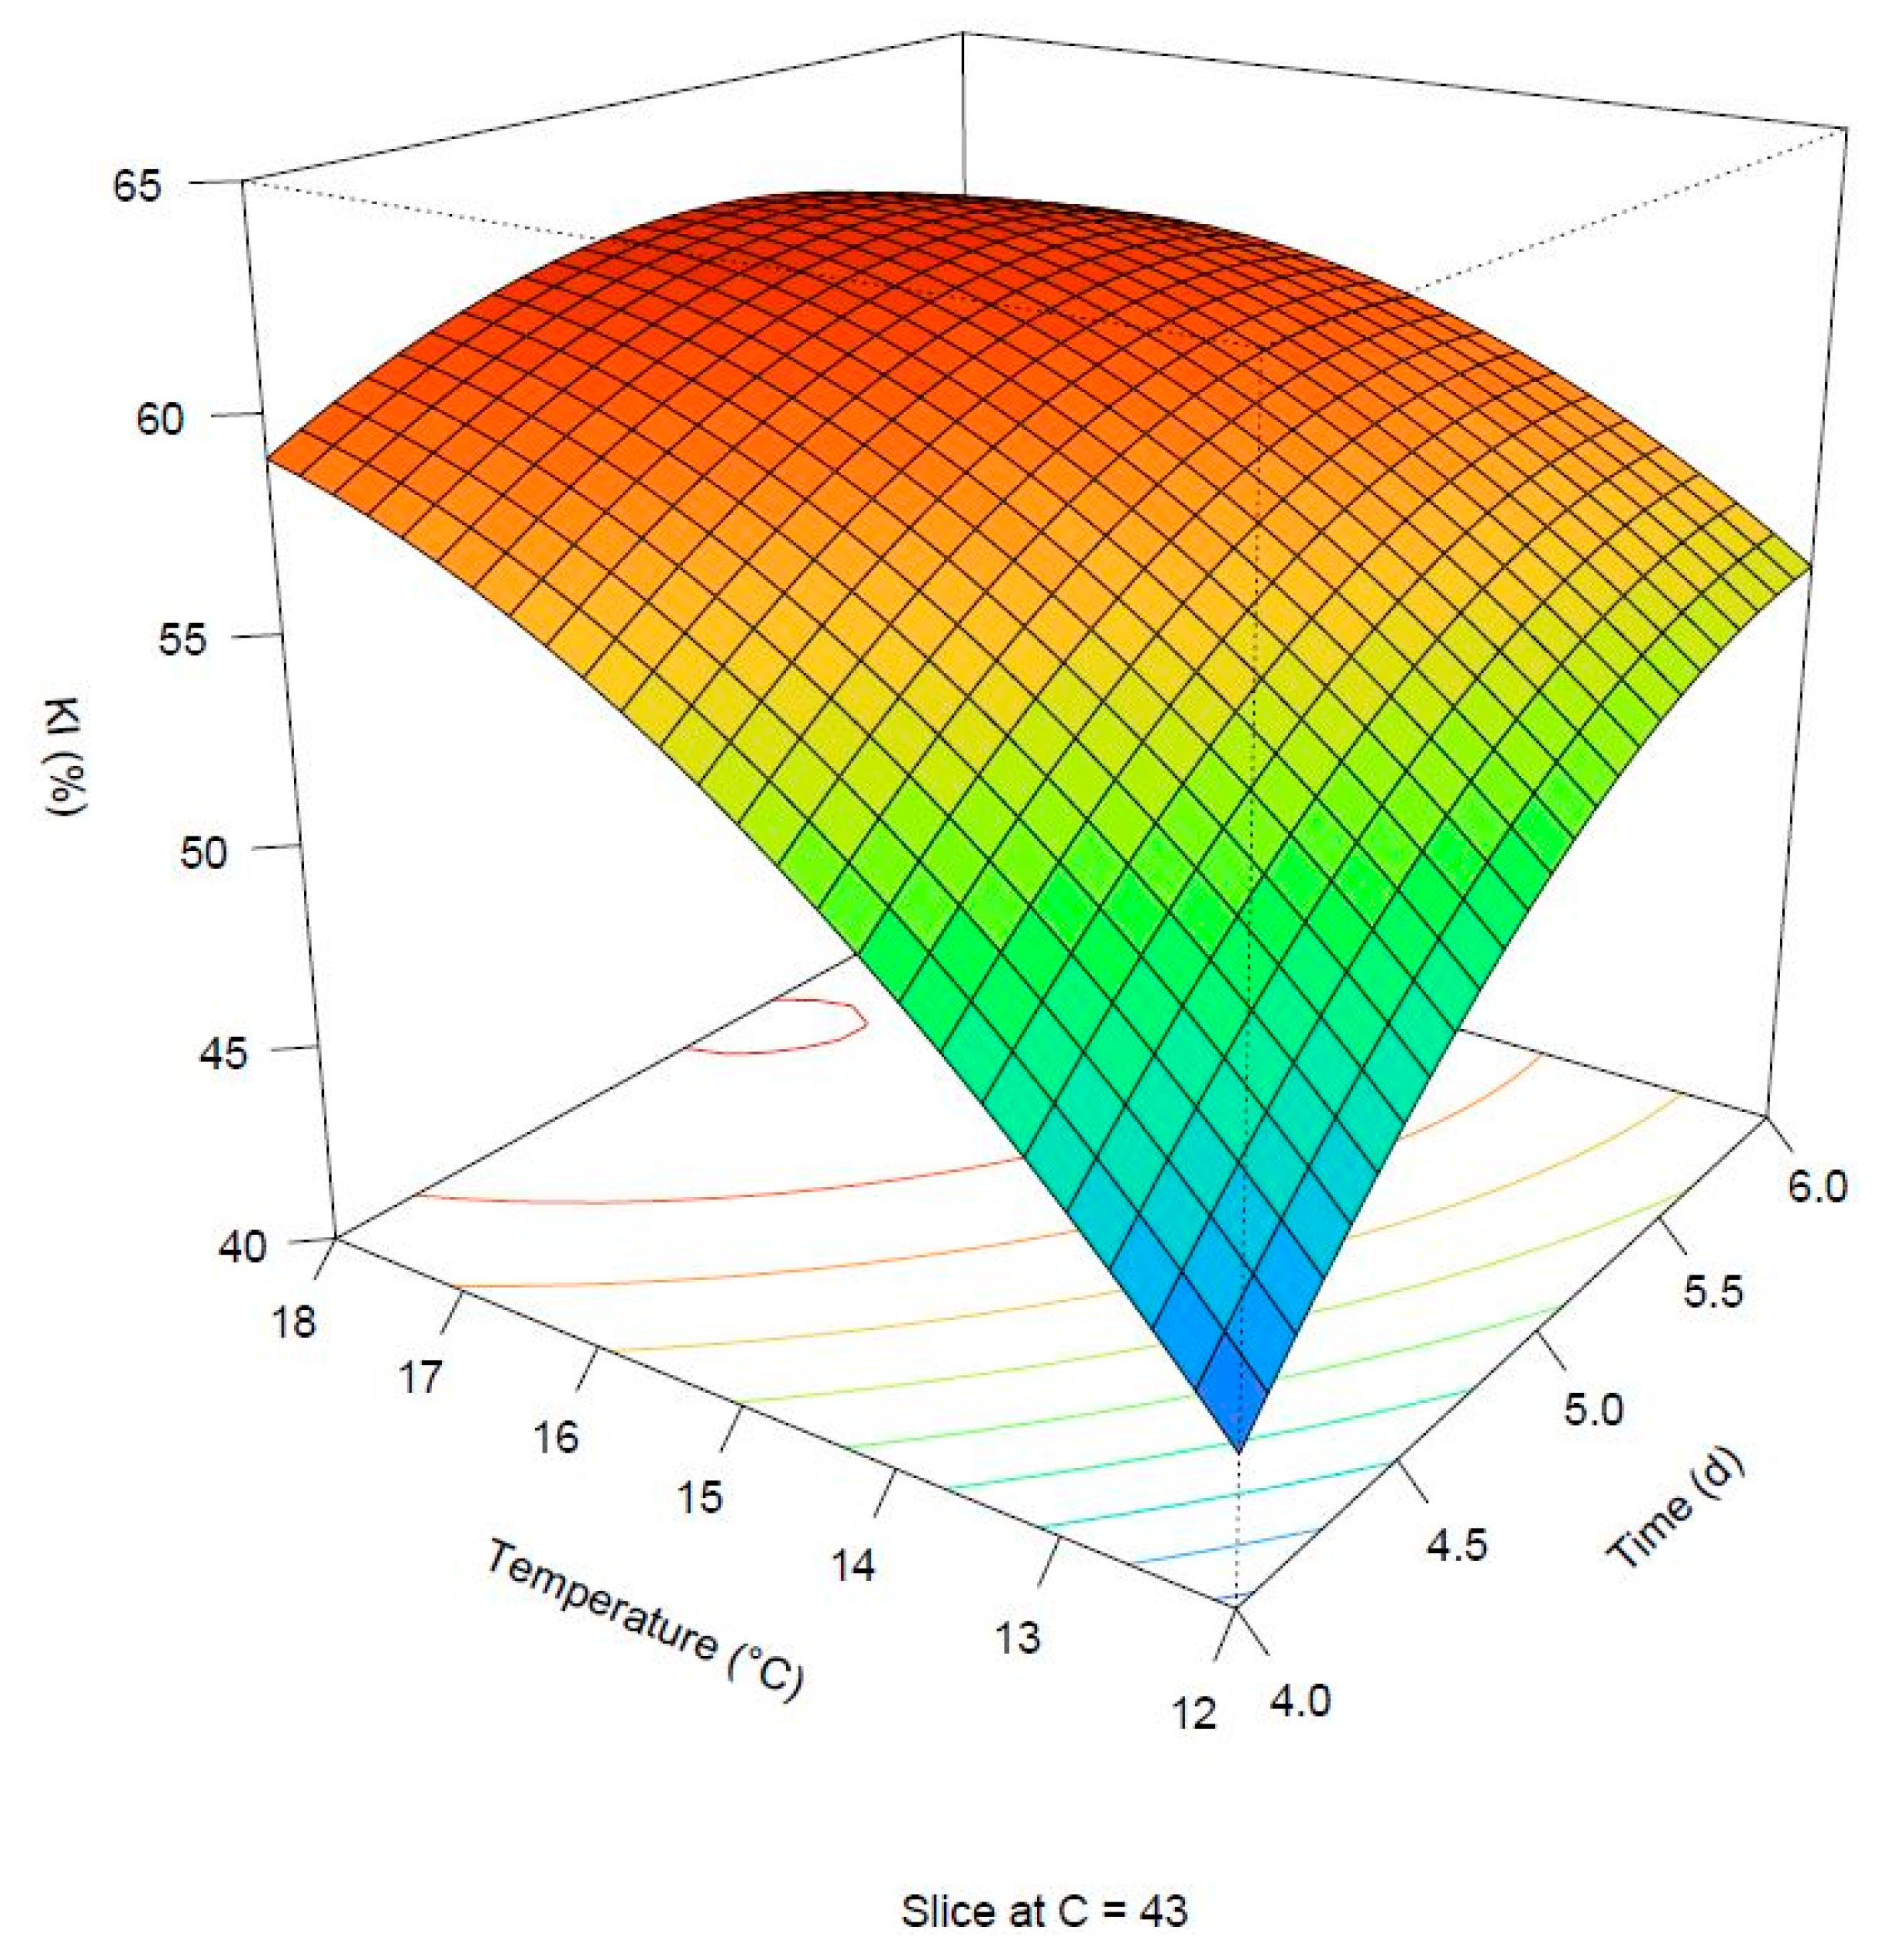
3.3. Kolbach Index
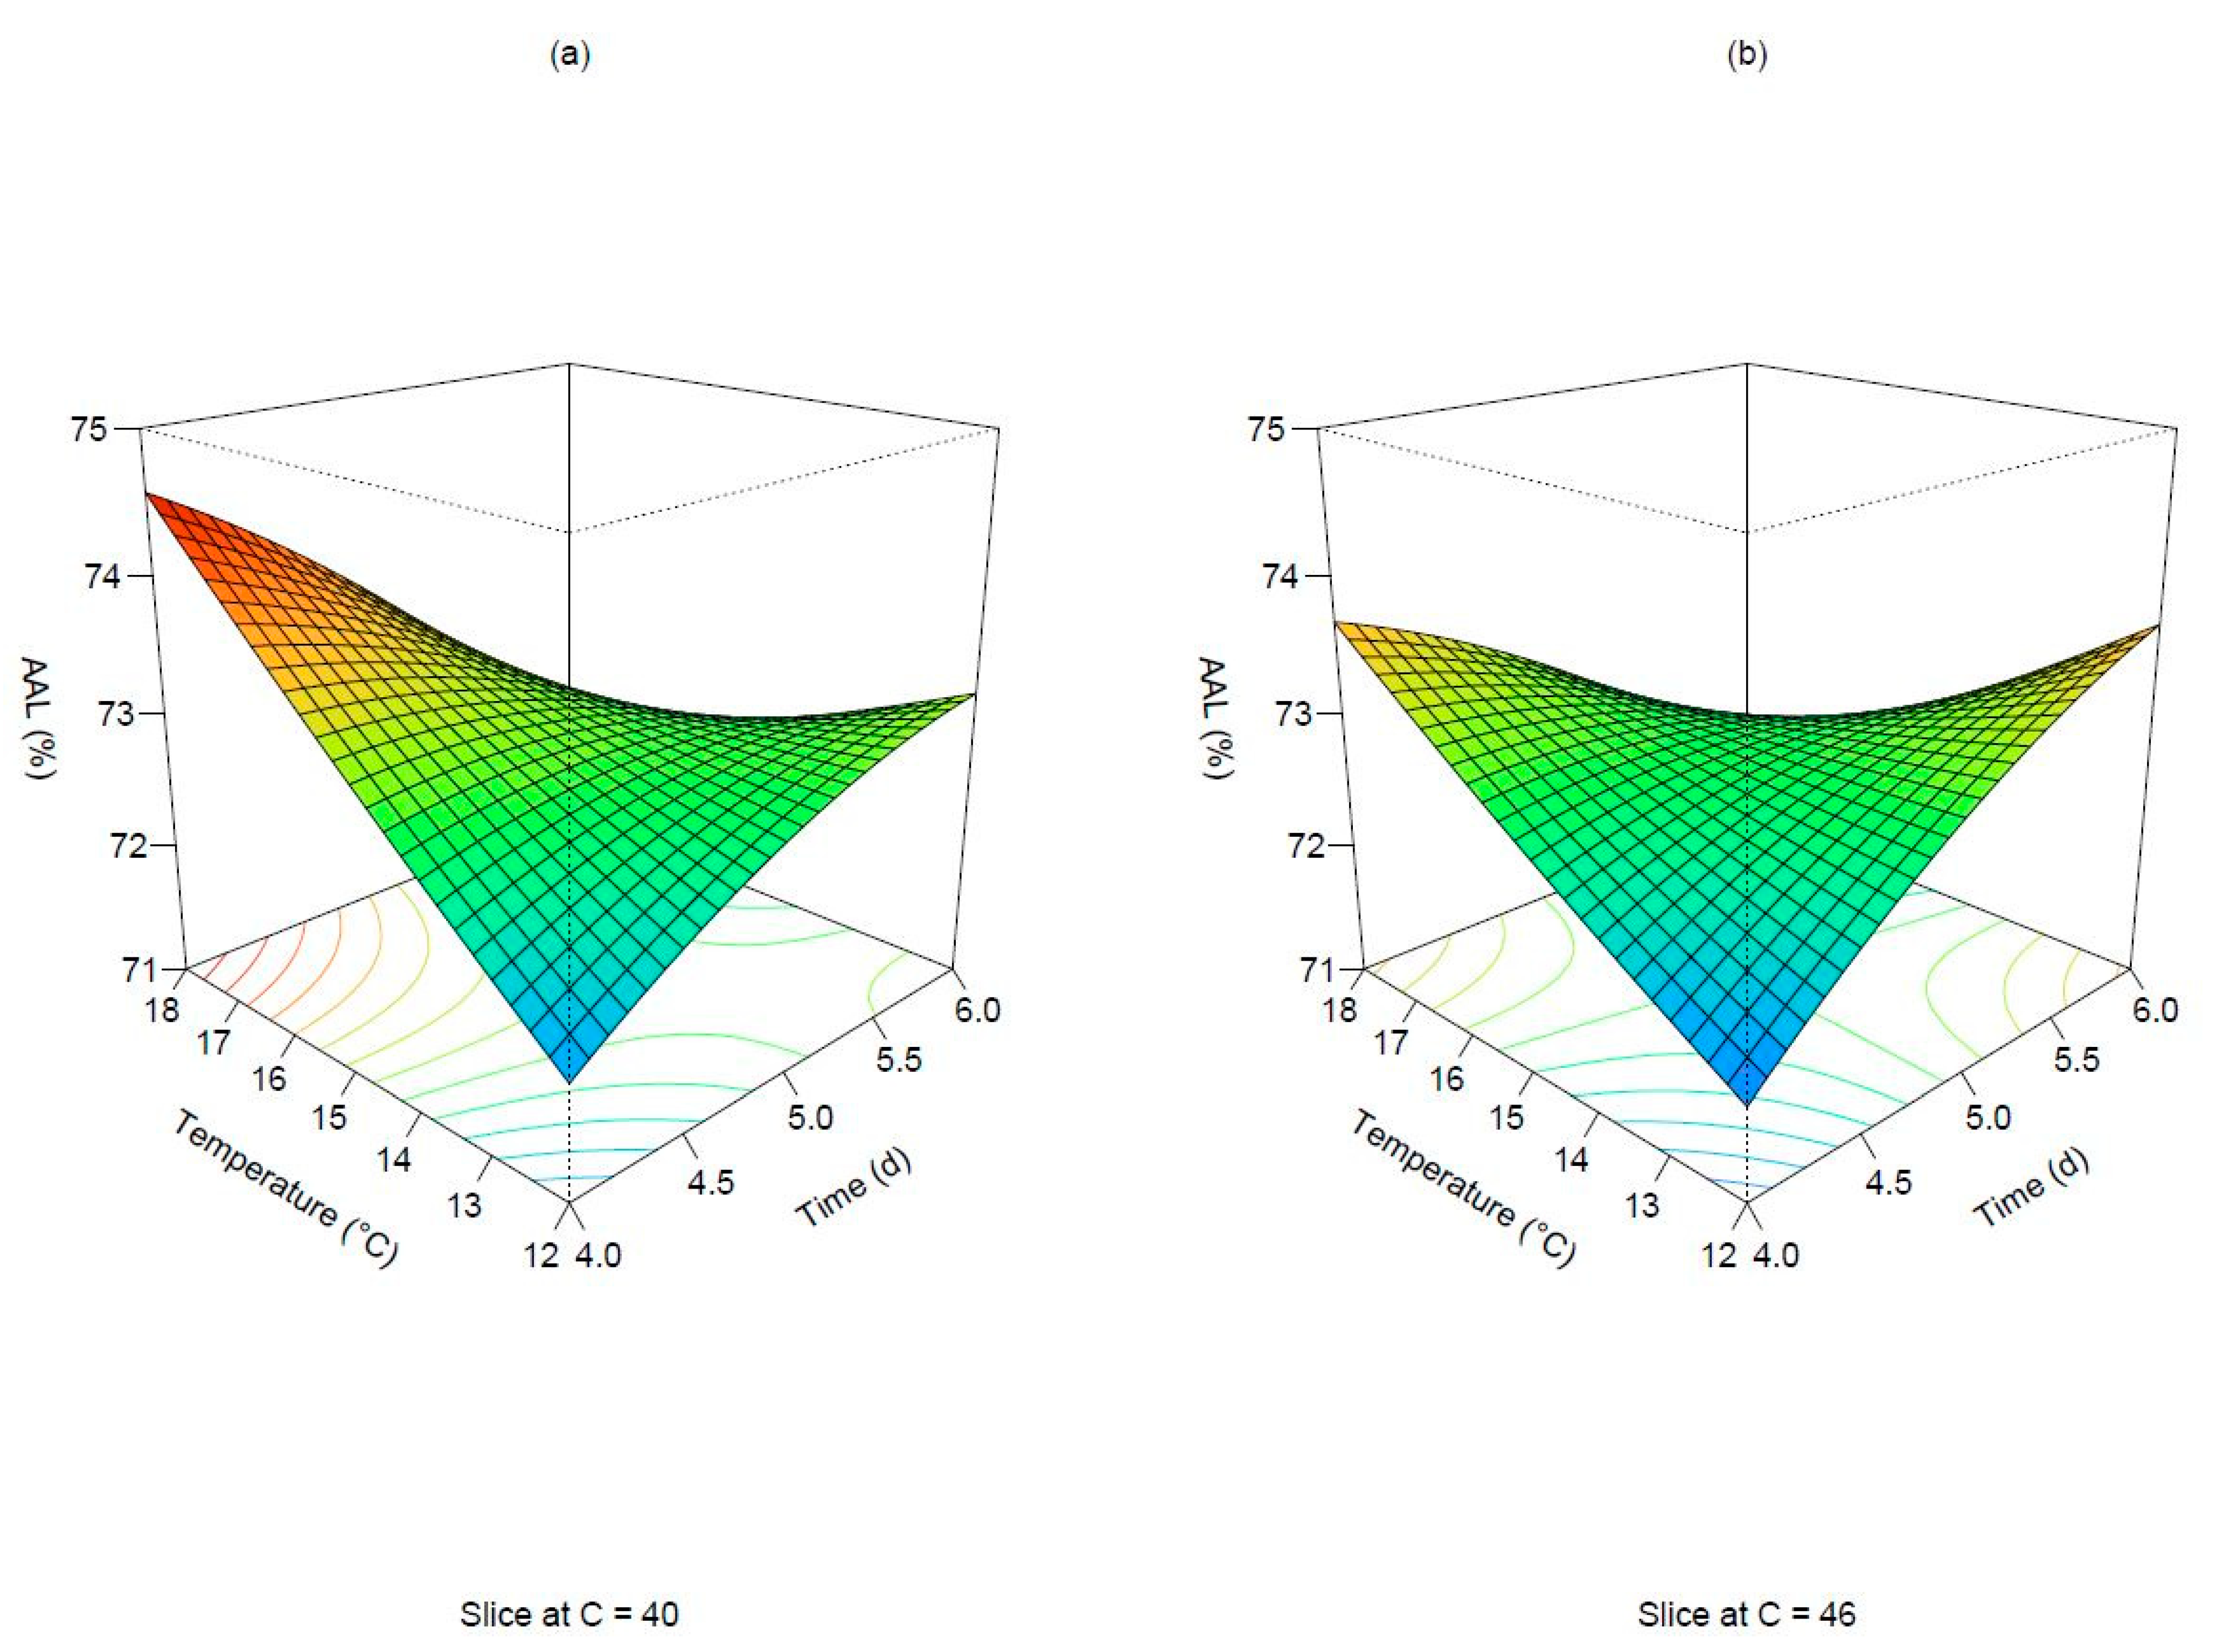
3.4. Apparent Attenuation Limit
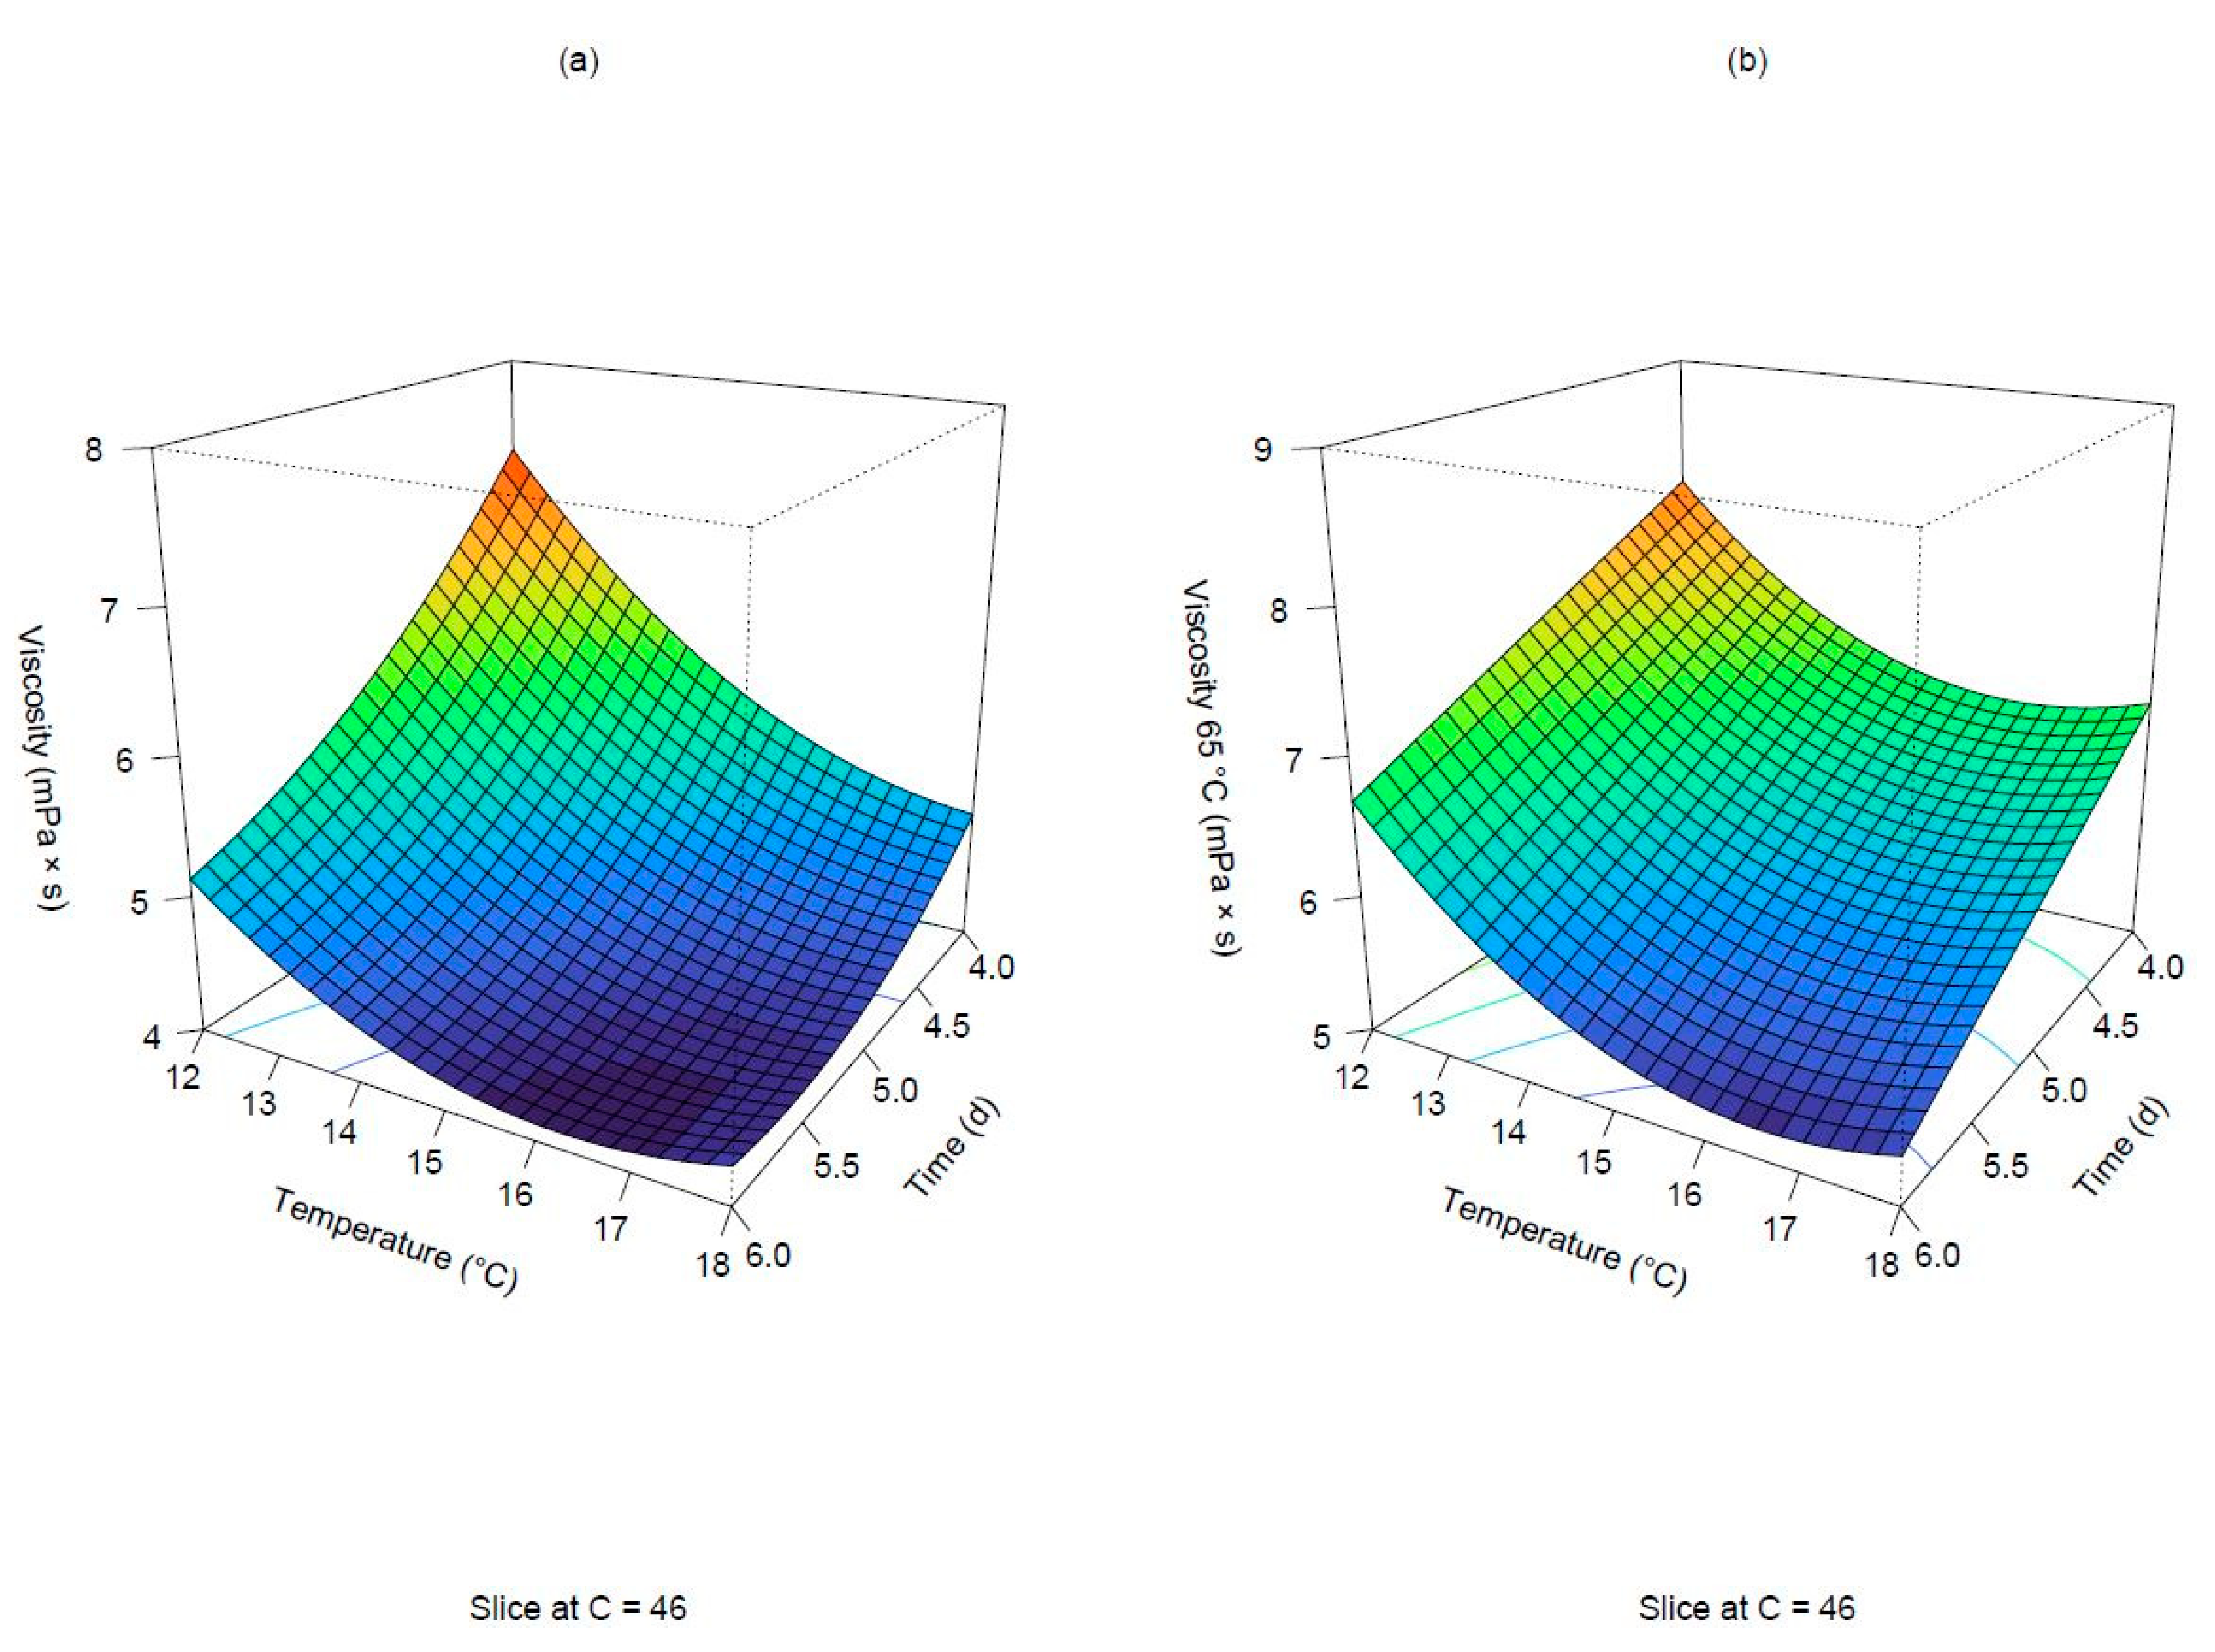
3.5. Viscosity
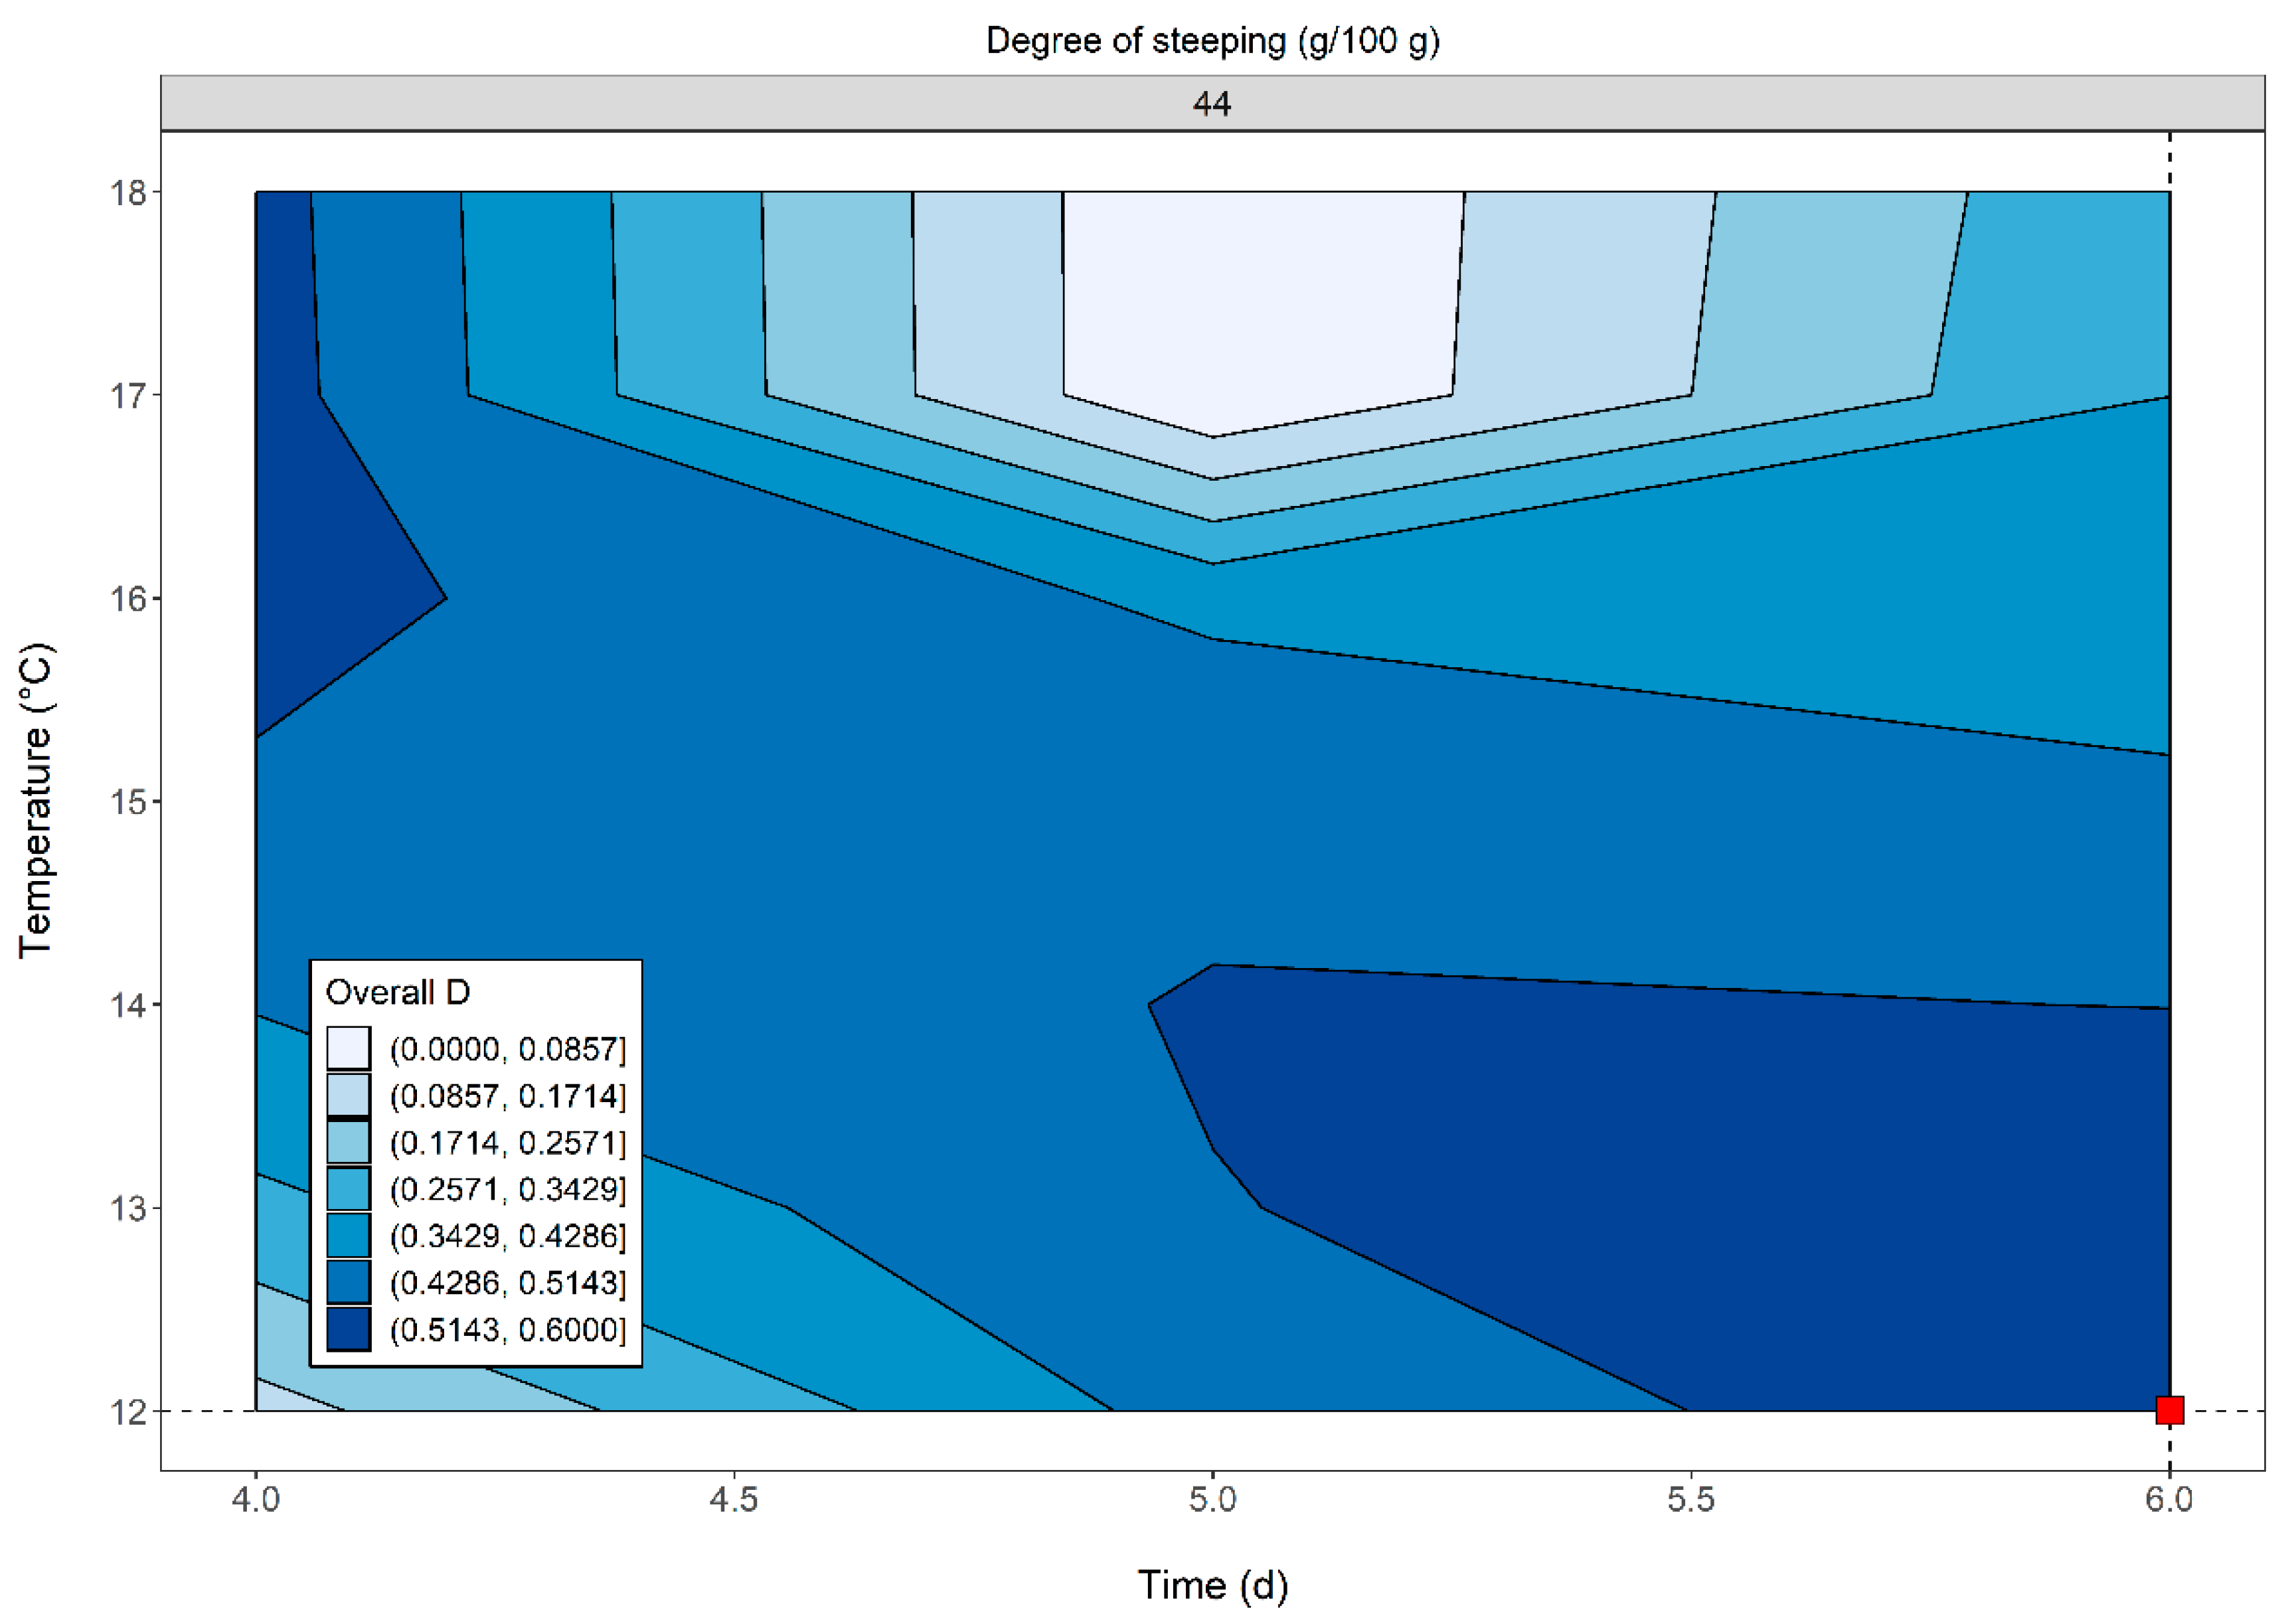
3.6. Multicriteria Optimization
3.6.1. Desirability Function
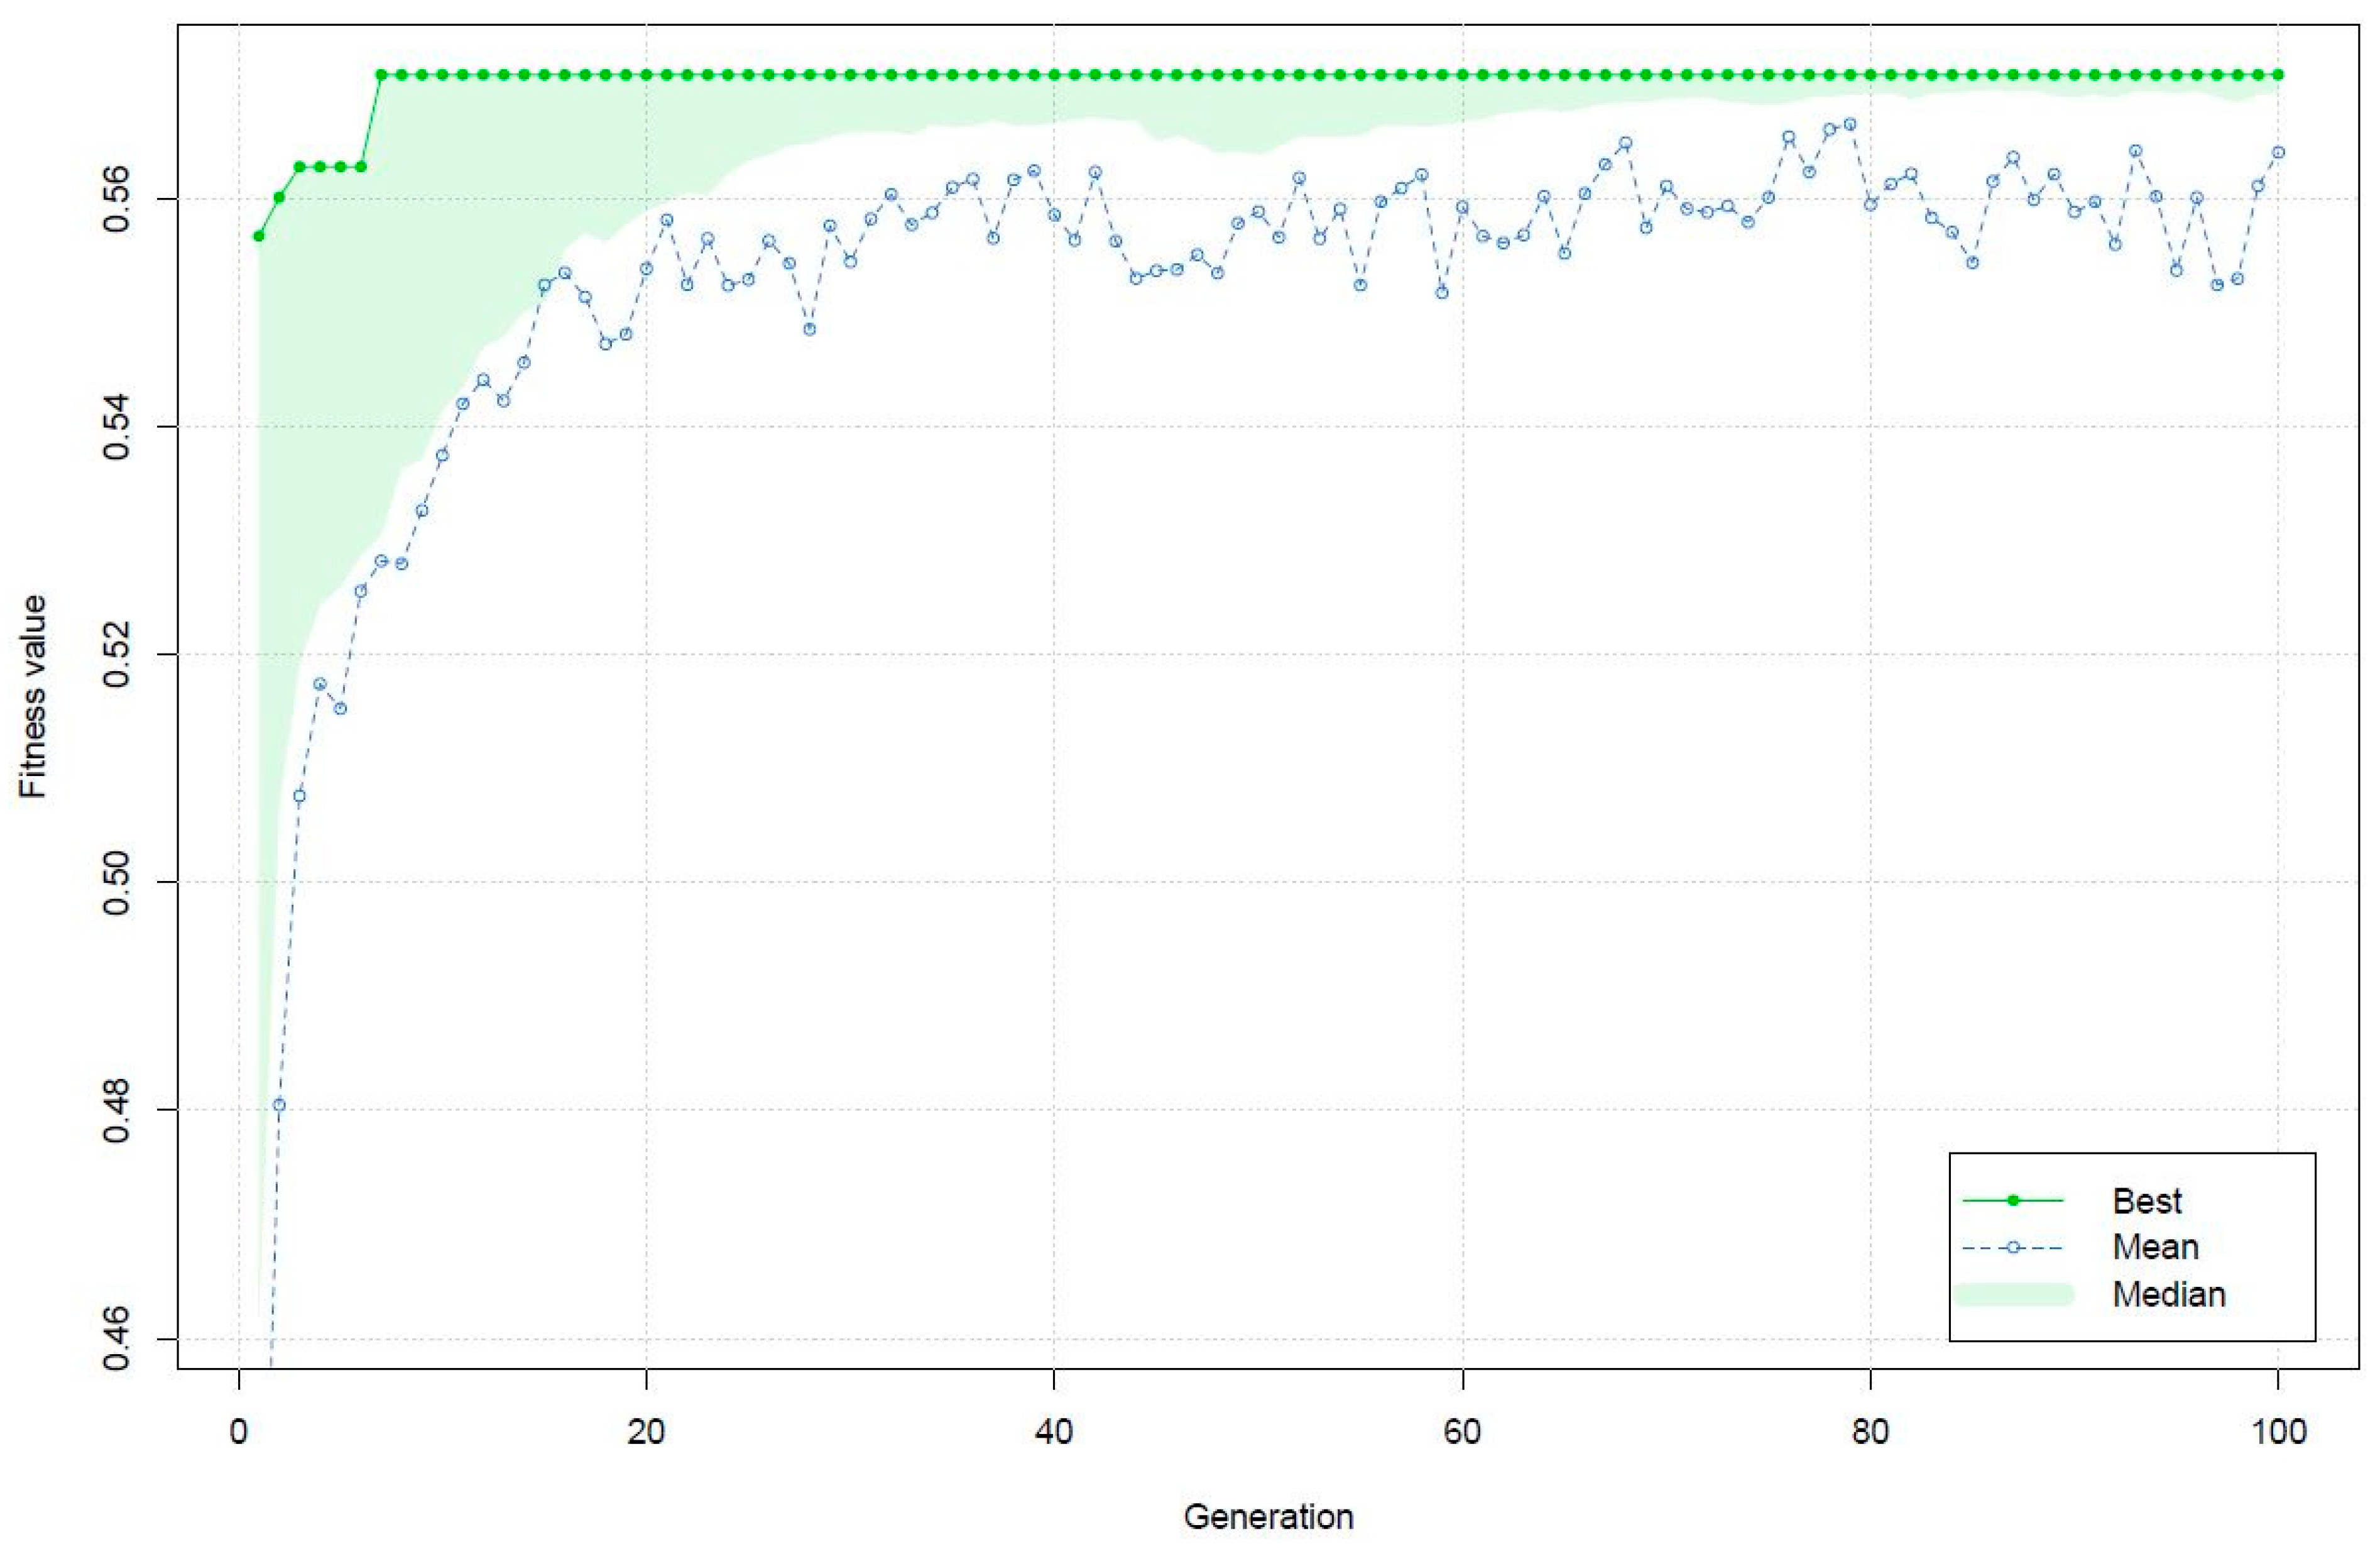
3.6.2. Genetic Algorithm
4. Conclusions
Supplementary Materials
Author Contributions
Funding
Institutional Review Board Statement
Informed Consent Statement
Data Availability Statement
Acknowledgments
Conflicts of Interest
References
- Garavaglia, C. Industry Evolution: Evidence from the Italian Brewing Industry. Compet. Chang. 2022, 26, 75–95. [Google Scholar] [CrossRef]
- Cipollaro, M.; Fabbrizzi, S.; Sottini, V.A.; Fabbri, B.; Menghini, S. Linking Sustainability, Embeddedness and Marketing Strategies: A Study on the Craft Beer Sector in Italy. Sustainability 2021, 13, 10903. [Google Scholar] [CrossRef]
- Holtkamp, C.; Shelton, T.; Daly, G.; Hiner, C.C.; Hagelman, R.R., III. Assessing Neolocalism in Microbreweries. Pap. Appl. Geogr. 2016, 2, 66–78. [Google Scholar] [CrossRef]
- Colombo, F.; Franguelli, N.; Licheri, G.; Ghidoli, M.; Cassani, E.; Castelli, L.; Pasquali, M.; Bresciani, A.; Marti, A.; Dell’Anno, M.; et al. Agriculture in Marginal Areas: Reintroduction of Rye and Wheat Varieties for Breadmaking in the Antrona Valley. Agronomy 2022, 12, 1695. [Google Scholar] [CrossRef]
- Zeven, A. Landraces: A Review of Definitions and Classifications. Euphytica 1998, 104, 127–139. [Google Scholar] [CrossRef]
- ARSAC. Available online: https://www.arsacweb.it/la-segale-il-cereale-da-rilanciare-nei-parchi-nazionali-calabresi/ (accessed on 29 August 2022).
- Korzun, V.; Ponomareva, M.L.; Sorrells, M.E. Economic and Academic Importance of Rye. In The Rye Genome; Rabanus-Wallace, M.T., Stein, N., Eds.; Springer International: Cham, Switzerland, 2021; pp. 1–12. ISBN 978-3-030-83383-1. [Google Scholar]
- Behre, K.E. The history of rye cultivation in Europe. Veg. Hist. Archaeobotany 1992, 1, 141–156. [Google Scholar] [CrossRef]
- Schreiber, M.; Özkan, H.; Komatsuda, T.; Mascher, M. Evolution and Domestication of Rye. In The Rye Genome; Rabanus-Wallace, M.T., Stein, N., Eds.; Springer International: Cham, Switzerland, 2021; pp. 85–100. ISBN 978-3-030-83383-1. [Google Scholar]
- Németh, R.; Tömösközi, S. Rye: Current State and Future Trends in Research and Applications. Acta Aliment. 2021, 50, 620–640. [Google Scholar] [CrossRef]
- Wrigley, C.; Bushuk, W. Rye: Grain-Quality Characteristics and Management of Quality Requirements. In Cereal Grains, 2nd ed.; Chapter 7; Wrigley, C., Batey, I., Miskelly, D., Eds.; Woodhead Publishing: Sawston, UK, 2017; pp. 153–178. ISBN 978-0-08-100719-8. [Google Scholar]
- Food and Agricultural Organization of United Nations (FAO). FAOSTAT. Available online: https://www.fao.org/faostat/en/#data/QCL (accessed on 24 August 2022).
- Kaur, P.; Sandhu, K.S.; Purewal, S.S.; Kaur, M.; Singh, S.K. Rye: A Wonder Crop with Industrially Important Macromolecules and Health Benefits. Food Res. Int. 2021, 150, 110769. [Google Scholar] [CrossRef]
- Jonsson, K.; Andersson, R.; Knudsen, K.E.B.; Hallmans, G.; Hanhineva, K.; Katina, K.; Kolehmainen, M.; Kyrø, C.; Langton, M.; Nordlund, E.; et al. Rye and Health—Where Do We Stand and Where Do We Go? Trends Food Sci. Technol. 2018, 79, 78–87. [Google Scholar] [CrossRef]
- Kulichová, K.; Sokol, J.; Nemeček, P.; Maliarová, M.; Maliar, T.; Havrlentová, M.; Kraic, J. Phenolic Compounds and Biological Activities of Rye (Secale Cereale L.) Grains. Open Chem. 2019, 17, 988–999. [Google Scholar] [CrossRef]
- Vuholm, S.; Nielsen, D.S.; Iversen, K.N.; Suhr, J.; Westermann, P.; Krych, L.; Andersen, J.R.; Kristensen, M. Whole-Grain Rye and Wheat Affect Some Markers of Gut Health without Altering the Fecal Microbiota in Healthy Overweight Adults: A 6-Week Randomized Trial. J. Nutr. 2017, 147, 2067–2075. [Google Scholar] [CrossRef] [Green Version]
- Adhikari, K.B.; Tanwir, F.; Gregersen, P.L.; Steffensen, S.K.; Jensen, B.M.; Poulsen, L.K.; Nielsen, C.H.; Høyer, S.; Borre, M.; Fomsgaard, I.S. Benzoxazinoids: Cereal Phytochemicals with Putative Therapeutic and Health-Protecting Properties. Mol. Nutr. Food Res. 2015, 59, 1324–1338. [Google Scholar] [CrossRef]
- Pihlava, J.-M.; Kurtelius, T. Determination of Benzoxazinoids in Wheat and Rye Beers by HPLC-DAD and UPLC-QTOF MS. Food Chem. 2016, 204, 400–408. [Google Scholar] [CrossRef]
- Stika, H.-P. Early Iron Age and Late Mediaeval Malt Finds from Germany—Attempts at Reconstruction of Early Celtic Brewing and the Taste of Celtic Beer. Archaeol. Anthropol. Sci. 2011, 3, 41–48. [Google Scholar] [CrossRef]
- Pomeranz, Y.; Standridge, N.N.; Schreck, J.J.; Goplin, E.D. Rye in Malting and Brewing 1. Crop Sci. 1973, 13, 213–215. [Google Scholar] [CrossRef]
- Walker, G.; Hill, A. Saccharomyces Cerevisiae in the Production of Whisk(e)y. Beverages 2016, 2, 38. [Google Scholar] [CrossRef] [Green Version]
- Bogdan, P.; Kordialik-Bogacka, E. Alternatives to Malt in Brewing. Trends Food Sci. Technol. 2017, 65, 1–9. [Google Scholar] [CrossRef]
- Marsh, A.J.; Hill, C.; Ross, R.P.; Cotter, P.D. Fermented Beverages with Health-Promoting Potential: Past and Future Perspectives. Trends Food Sci. Technol. 2014, 38, 113–124. [Google Scholar] [CrossRef] [Green Version]
- Ekberg, J.; Gibson, B.; Joensuu, J.J.; Krogerus, K.; Magalhães, F.; Mikkelson, A.; Seppänen-Laakso, T.; Wilpola, A. Physicochemical Characterization of Sahti, an ‘Ancient’ Beer Style Indigenous to Finland: Physicochemical Characterization of Sahti. J. Inst. Brew. 2015, 121, 464–473. [Google Scholar] [CrossRef]
- Segobia Muñoz, S.A. Evaluation of the Addition of Rye (Secale cereale) in the Formulation of Belgian Pale Ale Craft Beer. Enfoque UTE 2022, 13, 14–28. [Google Scholar] [CrossRef]
- BJCP. Available online: https://www.bjcp.org/bjcp-style-guidelines/ (accessed on 29 August 2022).
- Hallam, N.D. Embryogenesis and germination in rye (Secale cereale L.). Planta 1972, 104, 157–166. [Google Scholar] [CrossRef]
- Briggs, D.E. Malts and Malting, 1st ed.; An Imprint of Thomson Science; Blackie Academic & Professional: London, UK, 1998. [Google Scholar]
- Myers, R.H.; Montgomery, D.C.; Anderson-Cook, C.M. Response Surface Methodology: Process and Product Optimization Using Designed Experiments, 3rd ed.; John Wiley & Sons: New York, NY, USA, 2009. [Google Scholar]
- Khuri, A.I.; Mukhopadhyay, S. Response Surface Methodology. WIREs Comput. Stat. 2010, 2, 128–149. [Google Scholar] [CrossRef]
- Kuhn, M. R Package; Version 2.1; Desirability: Function Optimization and Ranking via Desirability Functions; R Foundation for Statistical Computing: Vienna, Austria, 2016; Available online: https://CRAN.R-project.org/package=desirability (accessed on 23 May 2022).
- Holland, J.H. Genetic Algorithms. Sci. Am. 1992, 267, 66–73. Available online: http://www.jstor.org/stable/24939139 (accessed on 23 May 2022). [CrossRef]
- Álvarez, M.J.; Ilzarbe, L.; Viles, E.; Tanco, M. The Use of Genetic Algorithms in Response Surface Methodology. Qual. Technol. Quant. Manag. 2009, 6, 295–307. [Google Scholar] [CrossRef]
- Thongsook, S. Using the GA Package in R Program and Desirability Function to Develop a Multiple Response Optimization Procedure in Case of Two Responses. Thail. Stat. Jan. 2018, 16, 64–76. Available online: http://statassoc.or.th (accessed on 23 May 2022).
- Scrucca, L. GA: A Package for Genetic Algorithms in R. J. Stat. Soft. 2013, 53, 1–37. [Google Scholar] [CrossRef] [Green Version]
- Goldberg, D.E. Genetic Algorithms. In Search, Optimization and Machine Learning, 1st ed.; Addison-Wesley Longman Publishing Co., Inc.: Boston, MA, USA, 1989; ISBN 0-201-15767-5. [Google Scholar]
- Chawanda, E.T.; Manhokwe, S.; Jombo, T.Z.; Mugadza, D.T.; Njini, M.; Manjeru, P. Optimisation of Malting Parameters for Quinoa and Barley: Application of Response Surface Methodology. J. Food Qual. 2022, 2022, 5279177. [Google Scholar] [CrossRef]
- Muñoz-Insa, A.; Gastl, M.; Zarnkow, M.; Becker, T. Optimization of the Malting Process of Oat (Avena sativa L.) as a Raw Material for Fermented Beverages. Span. J. Agric. Res. 2011, 9, 510–523. [Google Scholar] [CrossRef] [Green Version]
- Muñoz-Insa, A.; Selciano, H.; Zarnkow, M.; Becker, T.; Gastl, M. Malting Process Optimization of Spelt (Triticum spelta L.) for the Brewing Process. LWT-Food Sci. Technol. 2013, 50, 99–109. [Google Scholar] [CrossRef]
- Methner, F.-J. Raw Materials: Adjuncts, Barley, Malt, Hops and Hop Products: Collection of Brewing Analysis Methods of the Mitteleuropäische Brautechnische Analysenkommission; MEBAK®: Freising, Germany, 2018. [Google Scholar]
- FAO. Available online: https://www.fao.org/3/y5022e/y5022e03.htm#:~:text=On%20the%20basis%20of%20early,nitrogen%20content%20into%20protein%20content (accessed on 28 September 2022).
- Lenth, R.V. Response-Surface Methods in R, Using Rsm. J. Stat. Soft. 2009, 32, 1–17. [Google Scholar] [CrossRef] [Green Version]
- R Core Team. R: A Language and Environment for Satistical Computing (R Version 4.1.0); R Foundation for Statistical Computing: Vienna, Austria, 2021; Available online: https://www.R-project.org/ (accessed on 2 March 2022).
- Lüdecke, D.; Ben-Shachar, M.; Patil, I.; Waggoner, P.; Makowski, D. Performance: An R Package for Assessment, Comparison and Testing of Statistical Models. J. Open Source Softw. 2021, 6, 3139. [Google Scholar] [CrossRef]
- Venables, W.N.; Ripley, B.D. Modern Applied Statistics with S, 4th ed.; Springer: New York, NY, USA, 2022; ISBN 0-387-95457-0. Available online: https://www.stats.ox.ac.uk/pub/MASS4/ (accessed on 12 April 2022).
- Wickham, H. Ggplot2: Elegant Graphics for Data Analysis; Springer: New York, NY, USA, 2016; ISBN 978-3-319-24277-4. Available online: https://ggplot2.tidyverse.org (accessed on 12 April 2022).
- Garnier, S.; Ross, N.; Rudis, R.; Camargo, A.P.; Sciaini, M.; Scherer, C. R Package; Version 0.6.2; Rvision—Colorblind-Friendly Color Maps for R; R Foundation for Statistical Computing: Vienna, Austria, 2021; Available online: https://sjmgarnier.github.io/viridis/ (accessed on 13 April 2022).
- Pedersen, T.L. R Package; Version 1.1.1; Patchwork: The Composer of Plots; R Foundation for Statistical Computing: Vienna, Austria, 2020; Available online: https://CRAN.R-project.org/package=patchwork (accessed on 12 April 2022).
- Humberg, S.; Grund, S. Response Surface Analysis with Missing Data. Multivar. Behav. Res. 2022, 57, 581–602. [Google Scholar] [CrossRef]
- van Buuren, S.; Groothuis-Oudshoorn, K. Mice: Multivariate Imputation by Chained Equations in R. J. Stat. Softw. 2011, 45, 1–67. [Google Scholar] [CrossRef] [Green Version]
- Borkowski, J.J. Center Points. In Encyclopedia of Statistics in Quality and Reliability; Ruggeri, F., Kenett, R.S., Faltin, F.W., Eds.; John Wiley & Sons, Ltd: Chichester, UK, 2008. [Google Scholar] [CrossRef]
- Cabras, P.; Tuberoso, C.I.G. Analisi dei Prodotti Alimentari; Piccin Nuova Libraria S.p.A.: Padova, Italy, 2014. [Google Scholar]
- Wang, Y.; Jin, Z.; Barr, J.; Gillespie, J.; Simsek, S.; Horsley, R.; Schwarz, P. Micro-Malting for the Quality Evaluation of Rye (Secale Cereale) Genotypes. Fermentation 2018, 4, 50. [Google Scholar] [CrossRef] [Green Version]
- Back, W.; Gastl, M.; Krottenthaler, M.; Narziss, L.; Zarnkow, M. Brewing Techniques in Practice: An In-Depth Guide with Problem Solving Strategies; Hans Carl Fachverlag: Nürnberg, Germany, 2019; Volume 1, p. 26. [Google Scholar]
- Hübner, F.; Arendt, E.K. Comparison of Protein Degradation as a Consequence of Germination Time and Temperature in Rye and Barley Malts. J. Am. Soc. Brew. Chem. 2010, 68, 195–203. [Google Scholar] [CrossRef]
- Narziß, L. Abriss der Bierbrauerei, 7th ed.Wiley-VCH: Weinheim, Germany, 2005. [Google Scholar]
- Gastl, M.; Kupetz, M.; Becker, T. Determination of Cytolytic Malt Modification—Part II: Impact on Wort Separation. J. Am. Soc. Brew. Chem. 2021, 79, 66–74. [Google Scholar] [CrossRef]
- Blšáková, L.; Gregor, T.; Mešťánek, M.; Hřivna, L.; Kumbár, V. The Use of Unconventional Malts in Beer Production and Their Effect on the Wort Viscosity. Foods 2021, 11, 31. [Google Scholar] [CrossRef]
- Laus, A.; Endres, F.; Hutzler, M.; Zarnkow, M.; Jacob, F. Isothermal Mashing of Barley Malt: New Insights into Wort Composition and Enzyme Temperature Ranges. Food Bioprocess Technol. 2022, 15, 2294–2312. [Google Scholar] [CrossRef]
- Evans, D.E.; Sheehan, M.C.; Stewart, D.C. The Impact of Malt Derived Proteins on Beer Foam Quality. Part II: The Influence of Malt Foam-Positive Proteins and Non-Starch Polysaccharides on Beer Foam Quality. J. Inst. Brew. 1999, 105, 171–178. [Google Scholar] [CrossRef]
- Kordialik-Bogacka, E.; Antczak, N. Prediction of Beer Foam Stability from Malt Components. Czech J. Food Sci. 2011, 29, 243–249. [Google Scholar] [CrossRef]

| Run Order | xA | xB | xC | A | B | C |
|---|---|---|---|---|---|---|
| 1 | −1 | 1 | 1 | 4 | 18 | 46 |
| 2 | 0 | 0 | 0 | 5 | 15 | 43 |
| 3 | −1 | 1 | −1 | 4 | 18 | 40 |
| 4 | 0 | 0 | −1 | 5 | 15 | 40 |
| 5 | 1 | 1 | −1 | 6 | 18 | 40 |
| 6 | 0 | 0 | 0 | 5 | 15 | 43 |
| 7 | 0 | 0 | 0 | 5 | 15 | 43 |
| 8 | −1 | 0 | 0 | 4 | 15 | 43 |
| 9 | 1 | −1 | −1 | 6 | 12 | 40 |
| 10 | 1 | 0 | 0 | 6 | 15 | 43 |
| 11 | 0 | 1 | 0 | 5 | 18 | 43 |
| 12 | 1 | 1 | 1 | 6 | 18 | 46 |
| 13 | 0 | −1 | 0 | 5 | 12 | 43 |
| 14 | 0 | 0 | 1 | 5 | 15 | 46 |
| 15 | −1 | −1 | −1 | 4 | 12 | 40 |
| 16 | −1 | −1 | 1 | 4 | 12 | 46 |
| 17 | 0 | 0 | 0 | 5 | 15 | 43 |
| 18 | 1 | −1 | 1 | 6 | 12 | 46 |
| Response | Source of Variation | Df 1 | Sum Sq 2 | Mean Sq 3 | F Value | p-Value |
|---|---|---|---|---|---|---|
| Extract | Model | 5 | 18.05 | 10.9843 | 48.31 | *** |
| Residuals | 11 | 0.8220 | 0.0747 | |||
| Lack of fit | 2 | 0.0170 | 0.0085 | 0.0949 | ns | |
| Pure error | 9 | 0.8050 | 0.0894 | |||
| KI 4 | Model | 9 | 513.82 | 171.275 | 32.31 | *** |
| Residuals | 7 | 12.37 | 1.767 | |||
| Lack of fit | 4 | 10.55 | 2.637 | 4.3465 | ns | |
| Pure error | 3 | 1.82 | 0.607 | |||
| AAL 5 | Model | 9 | 10.20 | 3.39975 | 18.65 | *** |
| Residuals | 7 | 0.4254 | 0.06078 | |||
| Lack of fit | 4 | 0.3654 | 0.09136 | 4.5680 | ns | |
| Pure error | 3 | 0.0600 | 0.02000 | |||
| Viscosity | Model | 8 | 16.2291 | 5.7671 | 106.7 | *** |
| Residuals | 8 | 0.1521 | 0.0190 | |||
| Lack of fit | 5 | 0.1386 | 0.0277 | 6.172 | ns | |
| Pure error | 3 | 0.0135 | 0.0045 | |||
| Viscosity 65 °C | Model | 7 | 13.0247 | 5.4064 | 34.32 | *** |
| Residuals | 9 | 0.4879 | 0.0542 | |||
| Lack of fit | 6 | 0.3979 | 0.0663 | 2.2107 | ns | |
| Pure error | 3 | 0.0900 | 0.0300 |
| Run Order | Extract (%, d.m.1) | KI 2 (%) | AAL 3 (%) | Viscosity (mPa × s) | Viscosity 65 °C (mPa × s) | |||||
|---|---|---|---|---|---|---|---|---|---|---|
| Actual | Predicted | Actual | Predicted | Actual | Predicted | Actual | Predicted | Actual | Predicted | |
| 1 | 83.2 | 83.4 | 60.6 | 59.7 | 73.5 | 73.7 | 4.99 | 4.97 | 6.93 | 6.84 |
| 2 | 83.4 | 83.4 | 60.3 | 59.4 | 73.0 | 73.0 | 4.67 | 4.77 | 6.36 | 6.46 |
| 3 | 83.5 | 83.4 | 59.6 | 59.5 | 74.7 | 74.6 | 4.92 | 5.05 | 7.13 | 7.12 |
| 4 | 83.3 | 83.4 | 57.3 | 58.6 | 72.7 | 73.0 | 5.04 | 4.90 | 6.88 | 6.82 |
| 5 | 83.5 | 83.1 | 60.6 | 59.4 | 71.8 | 71.8 | 4.29 | 4.30 | 5.99 | 5.82 |
| 6 | 83.3 | 83.4 | 60.4 | 59.4 | 72.9 | 73.0 | 4.69 | 4.77 | 6.12 | 6.46 |
| 7 | 83.1 | 83.4 | 59.3 | 59.4 | 72.9 | 73.0 | 4.71 | 4.77 | 6.54 | 6.46 |
| 8 | 82.3 | 82.2 | 53.2 | 53.9 | 73.1 | 73.0 | 5.82 | 5.79 | 7.42 | 7.12 |
| 9 | 82.5 | 82.7 | 51.8 | 52.5 | 73.3 | 73.2 | 5.56 | 5.59 | 7.77 | 7.84 |
| 10 | na 4 | na 4 | na 4 | na 4 | na 4 | na 4 | na 4 | na 4 | na 4 | na 4 |
| 11 | 83.9 | 83.8 | 60.4 | 62.0 | 73.3 | 73.3 | 4.55 | 4.35 | 5.94 | 6.28 |
| 12 | 82.7 | 83.1 | 61.7 | 62.2 | 71.5 | 71.5 | 4.19 | 4.28 | 5.42 | 5.34 |
| 13 | 82.1 | 82.1 | 52.4 | 51.5 | 73.0 | 72.9 | 6.00 | 6.16 | 8.14 | 7.89 |
| 14 | 83.8 | 83.4 | 62.0 | 61.4 | 73.2 | 72.8 | 4.63 | 4.63 | 6.17 | 6.10 |
| 15 | 80.3 | 80.2 | 43.3 | 42.6 | 71.8 | 71.8 | 7.89 | 7.81 | 8.93 | 8.99 |
| 16 | 80.1 | 80.2 | 44.6 | 45.6 | 71.6 | 71.7 | 7.29 | 7.29 | 7.89 | 8.03 |
| 17 | 83.2 | 83.4 | 58.8 | 59.4 | 73.2 | 73.0 | 4.82 | 4.77 | 6.38 | 6.46 |
| 18 | 83.0 | 82.7 | 58.0 | 57.9 | 73.5 | 73.7 | 5.25 | 5.13 | 6.70 | 6.68 |
Publisher’s Note: MDPI stays neutral with regard to jurisdictional claims in published maps and institutional affiliations. |
© 2022 by the authors. Licensee MDPI, Basel, Switzerland. This article is an open access article distributed under the terms and conditions of the Creative Commons Attribution (CC BY) license (https://creativecommons.org/licenses/by/4.0/).
Share and Cite
Calvi, A.; Preiti, G.; Poiana, M.; Marconi, O.; Gastl, M.; Zarnkow, M. Multi-Response Optimization of the Malting Process of an Italian Landrace of Rye (Secale cereale L.) Using Response Surface Methodology and Desirability Function Coupled with Genetic Algorithm. Foods 2022, 11, 3561. https://doi.org/10.3390/foods11223561
Calvi A, Preiti G, Poiana M, Marconi O, Gastl M, Zarnkow M. Multi-Response Optimization of the Malting Process of an Italian Landrace of Rye (Secale cereale L.) Using Response Surface Methodology and Desirability Function Coupled with Genetic Algorithm. Foods. 2022; 11(22):3561. https://doi.org/10.3390/foods11223561
Chicago/Turabian StyleCalvi, Antonio, Giovanni Preiti, Marco Poiana, Ombretta Marconi, Martina Gastl, and Martin Zarnkow. 2022. "Multi-Response Optimization of the Malting Process of an Italian Landrace of Rye (Secale cereale L.) Using Response Surface Methodology and Desirability Function Coupled with Genetic Algorithm" Foods 11, no. 22: 3561. https://doi.org/10.3390/foods11223561
APA StyleCalvi, A., Preiti, G., Poiana, M., Marconi, O., Gastl, M., & Zarnkow, M. (2022). Multi-Response Optimization of the Malting Process of an Italian Landrace of Rye (Secale cereale L.) Using Response Surface Methodology and Desirability Function Coupled with Genetic Algorithm. Foods, 11(22), 3561. https://doi.org/10.3390/foods11223561